variant data analysis and prioritization using hgva€¦ · an individual exome carries between...
TRANSCRIPT
Variant data analysis and prioritization using HGVA
TrainMALTACambridge, UK
2nd June 2017
Marta Bleda Latorre
Research Associate at the Department of Medicine
University of Cambridge
Cambridge, UK
Marta Bleda | Variant data analysis and prioritization using HGVA 2
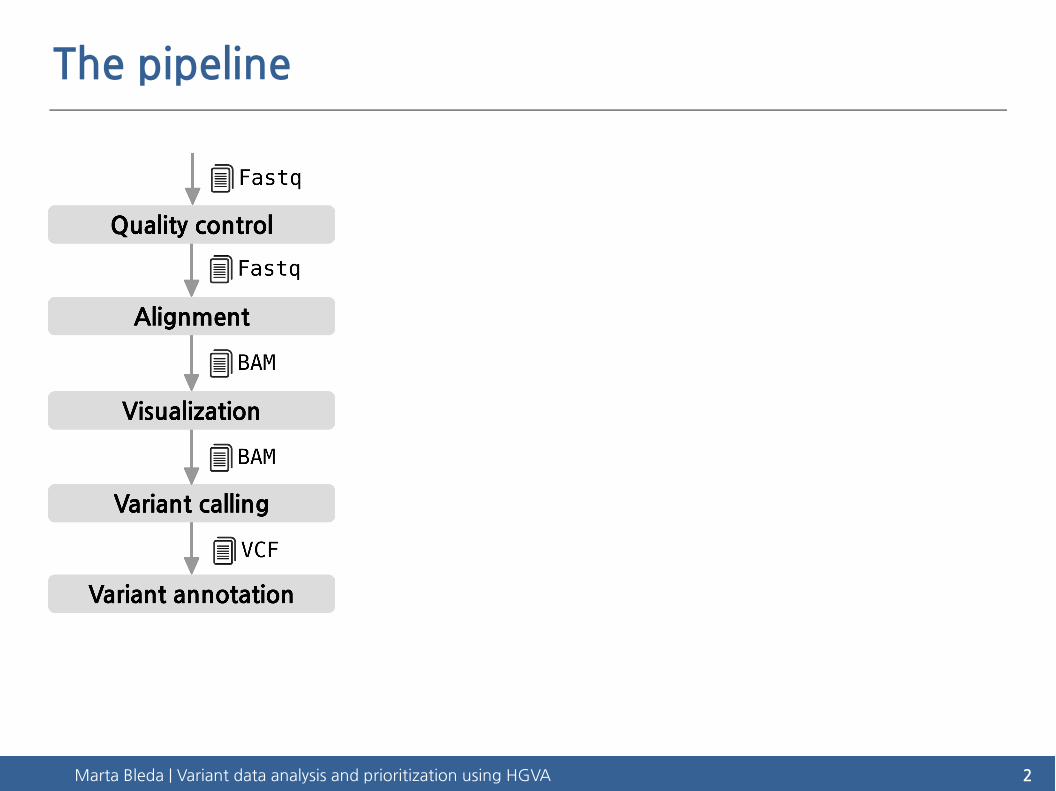
The pipeline
Marta Bleda | Variant data analysis and prioritization using HGVA 3
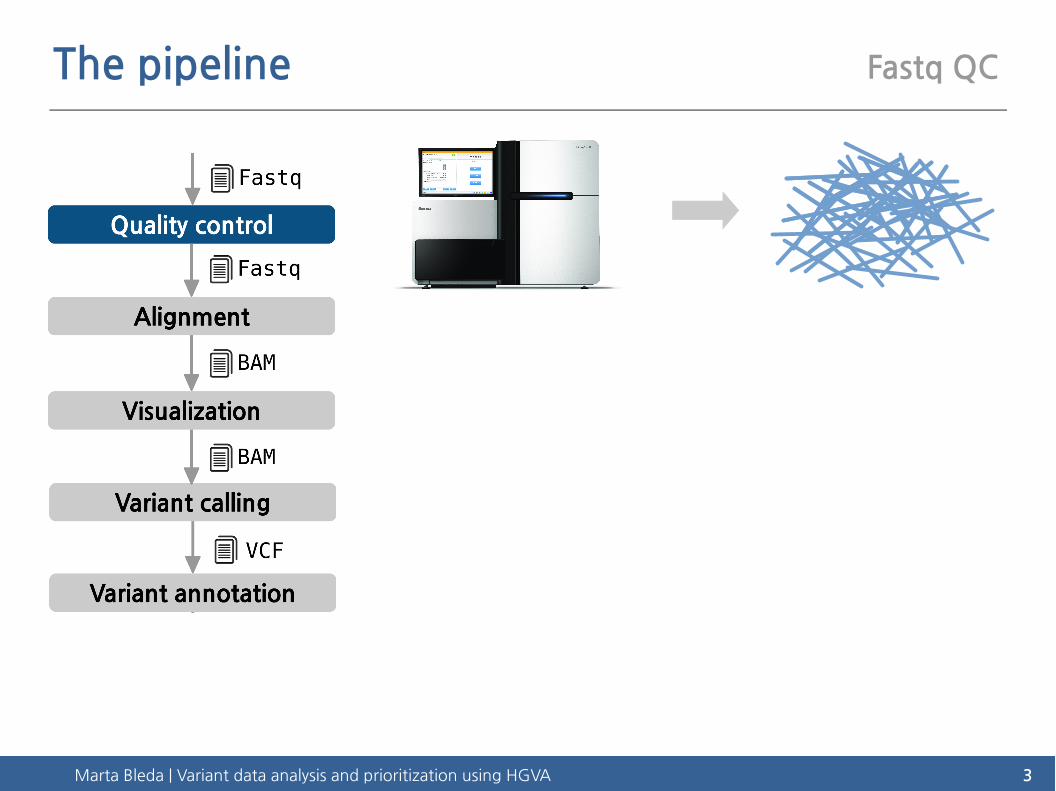
The pipeline Fastq QC
Marta Bleda | Variant data analysis and prioritization using HGVA 4
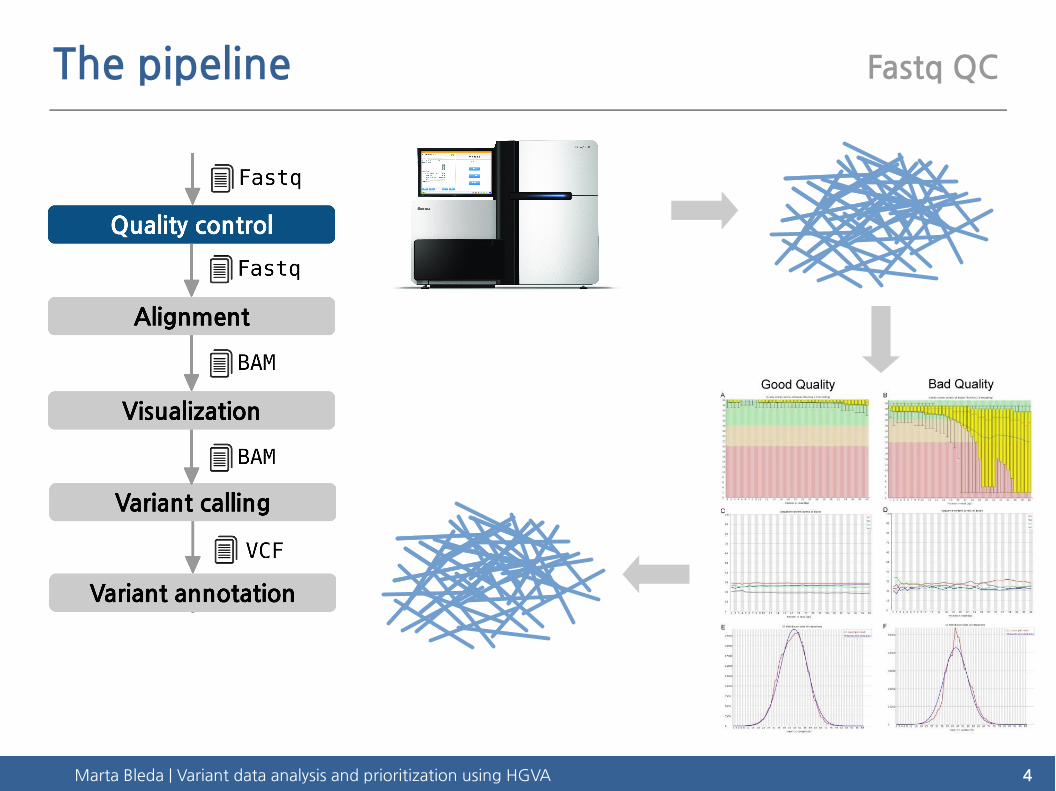
The pipeline Fastq QC
Marta Bleda | Variant data analysis and prioritization using HGVA 5
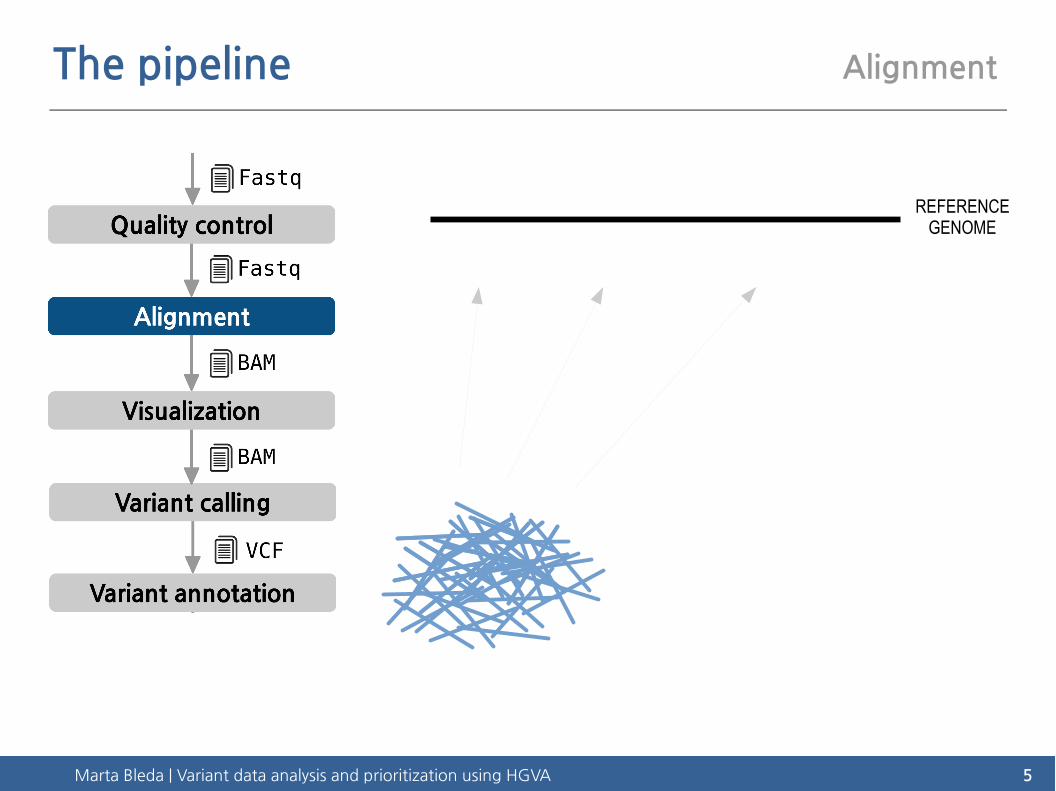
The pipeline Alignment
REFERENCEGENOME
Marta Bleda | Variant data analysis and prioritization using HGVA 6
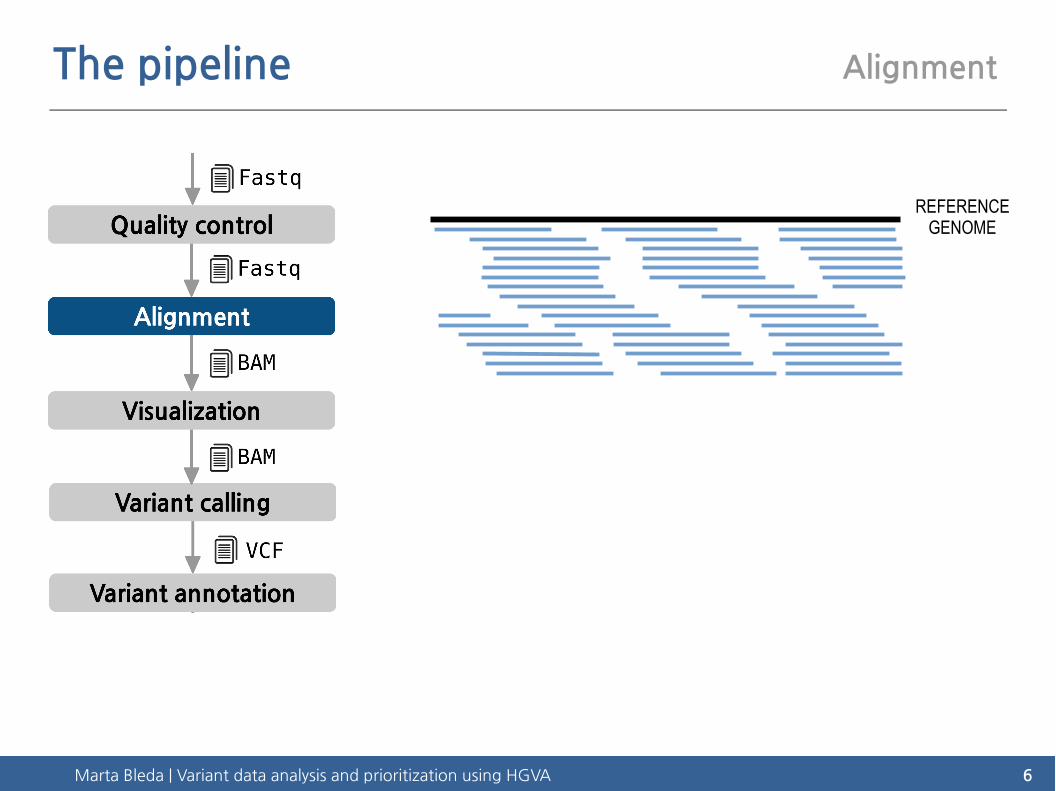
The pipeline Alignment
REFERENCEGENOME
Marta Bleda | Variant data analysis and prioritization using HGVA 7
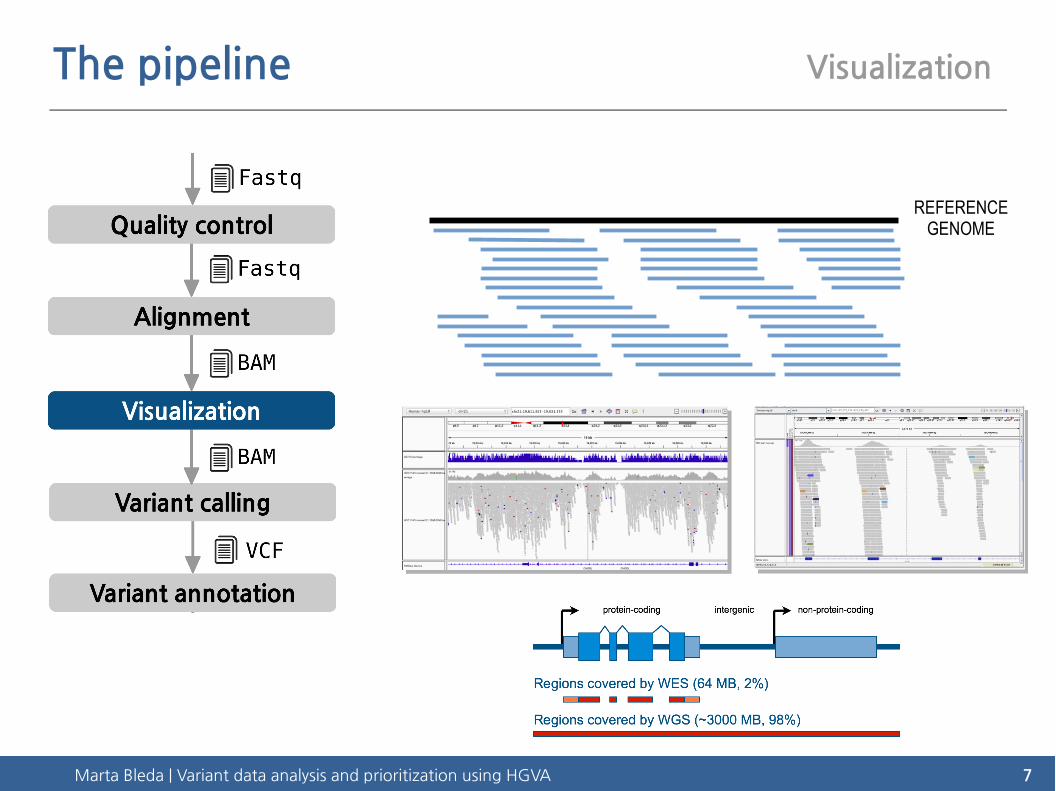
The pipeline Visualization
REFERENCEGENOME

Marta Bleda | Variant data analysis and prioritization using HGVA 8
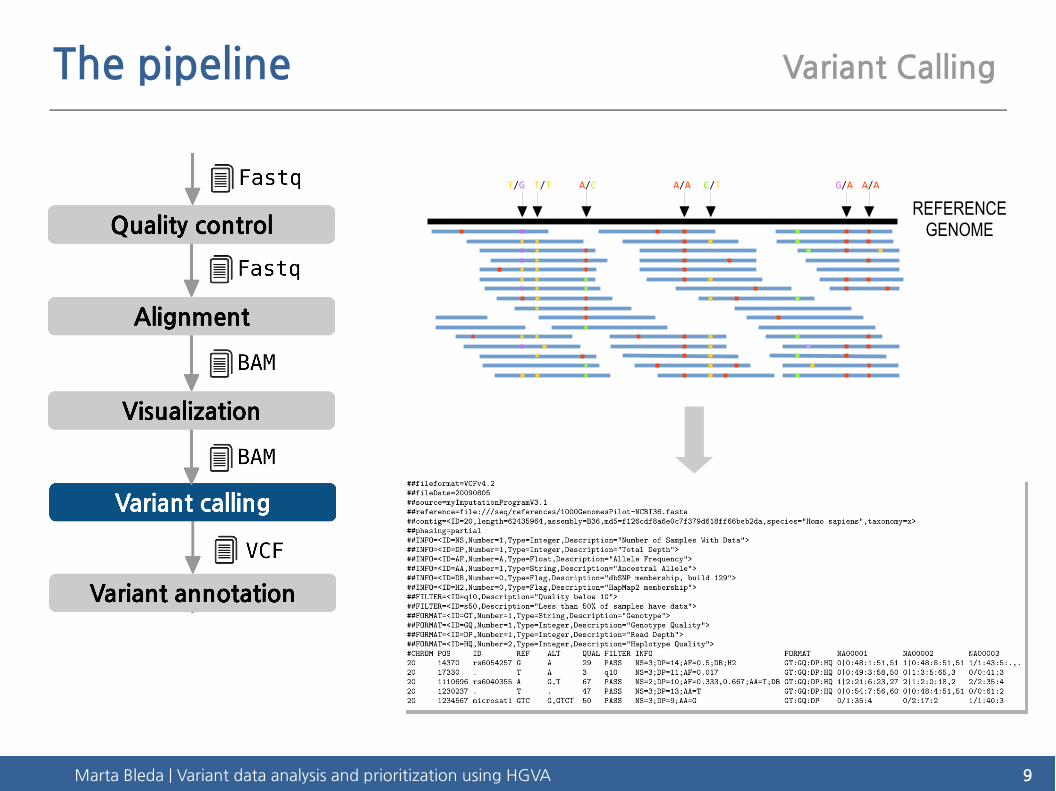
The pipeline Variant Calling
REFERENCEGENOME
Marta Bleda | Variant data analysis and prioritization using HGVA 9
The pipeline Variant Calling
REFERENCEGENOME
T/G T/T A/C A/A C/T G/A A/A
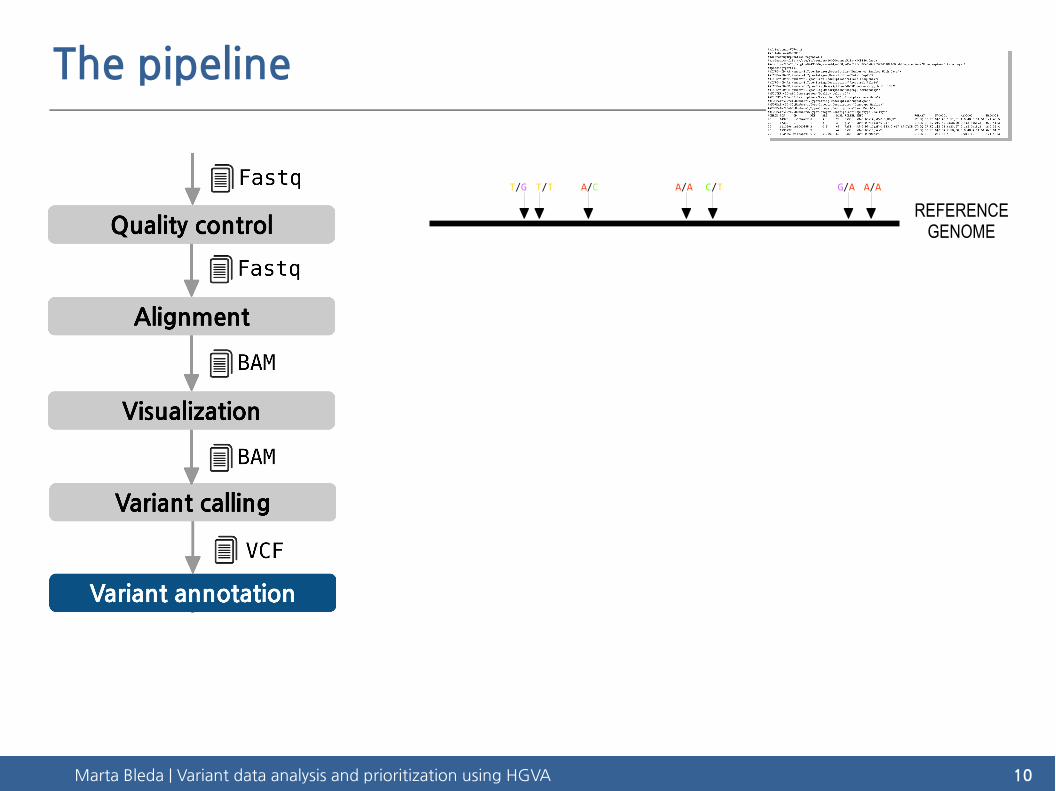
Marta Bleda | Variant data analysis and prioritization using HGVA 10
The pipeline
REFERENCEGENOME
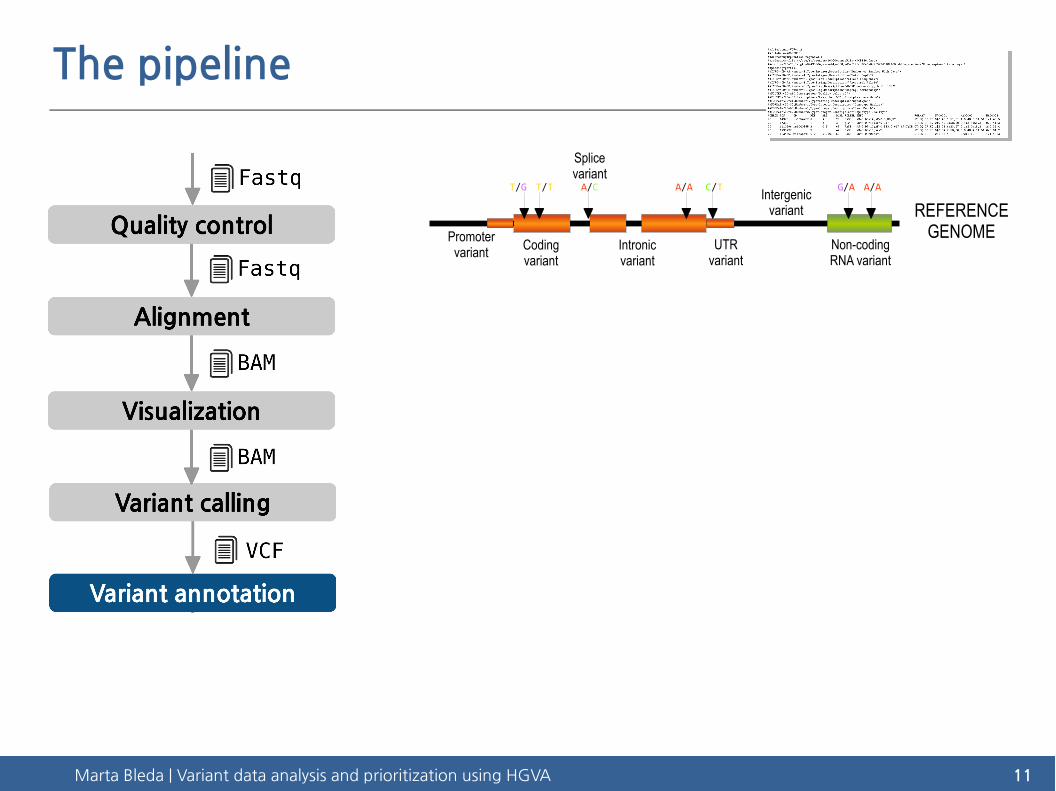
T/G T/T A/C A/A C/T G/A A/A
Marta Bleda | Variant data analysis and prioritization using HGVA 11
The pipeline
REFERENCEGENOME
T/G T/T A/C A/A C/T G/A A/A
Promotervariant Coding
variantIntronic variant
Splice variant
UTR variant
Intergenic variant
Non-coding RNA variant
Marta Bleda | Variant data analysis and prioritization using HGVA 12
The pipeline
REFERENCEGENOME
T/G T/T A/C A/A C/T G/A A/A
Promotervariant Coding
variantIntronic variant
Splice variant
UTR variant
Intergenic variant
Non-coding RNA variant
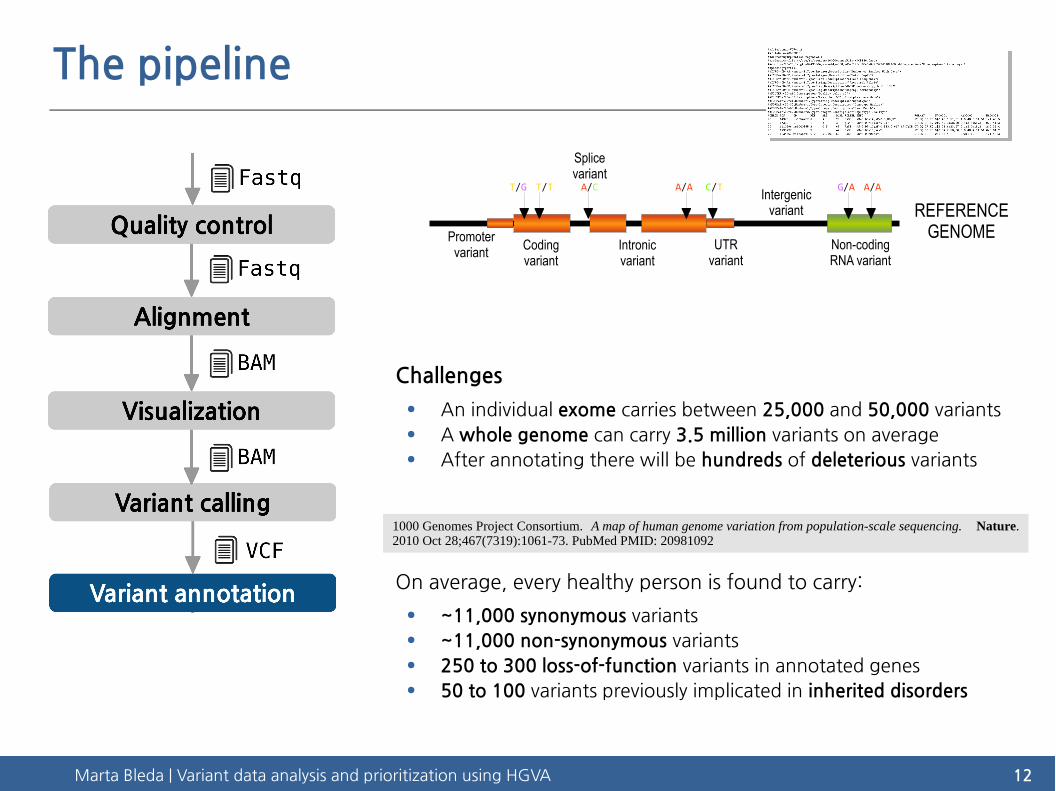
1000 Genomes Project Consortium. A map of human genome variation from population-scale sequencing. Nature. 2010 Oct 28;467(7319):1061-73. PubMed PMID: 20981092
Challenges
● An individual exome carries between 25,000 and 50,000 variants● A whole genome can carry 3.5 million variants on average● After annotating there will be hundreds of deleterious variants
On average, every healthy person is found to carry:
● ~11,000 synonymous variants● ~11,000 non-synonymous variants● 250 to 300 loss-of-function variants in annotated genes● 50 to 100 variants previously implicated in inherited disorders
Marta Bleda | Variant data analysis and prioritization using HGVA 13
The pipeline
REFERENCEGENOME
T/G T/T A/C A/A C/T G/A A/A
Promotervariant Coding
variantIntronic variant
Splice variant
UTR variant
Intergenic variant
Non-coding RNA variant
Marta Bleda | Variant data analysis and prioritization using HGVA 14
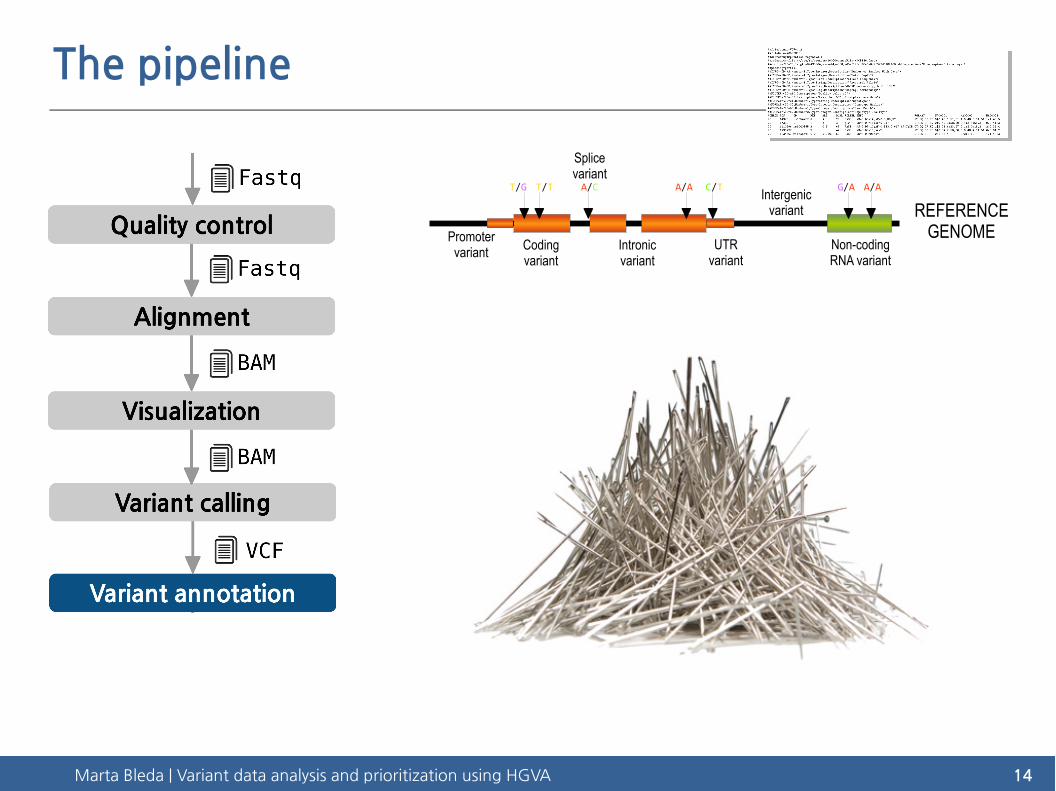
The pipeline
REFERENCEGENOME
T/G T/T A/C A/A C/T G/A A/A
Promotervariant Coding
variantIntronic variant
Splice variant
UTR variant
Intergenic variant
Non-coding RNA variant
Marta Bleda | Variant data analysis and prioritization using HGVA 15
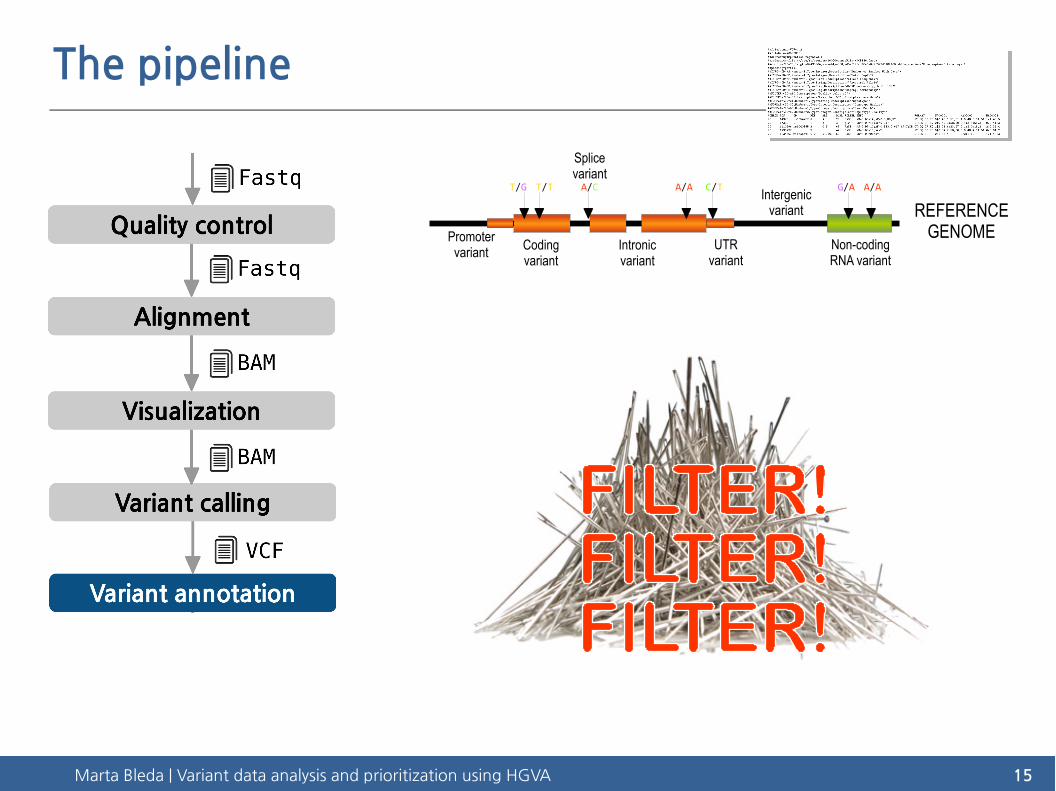
The pipeline
REFERENCEGENOME
T/G T/T A/C A/A C/T G/A A/A
Promotervariant Coding
variantIntronic variant
Splice variant
UTR variant
Intergenic variant
Non-coding RNA variant
Marta Bleda | Variant data analysis and prioritization using HGVA 16
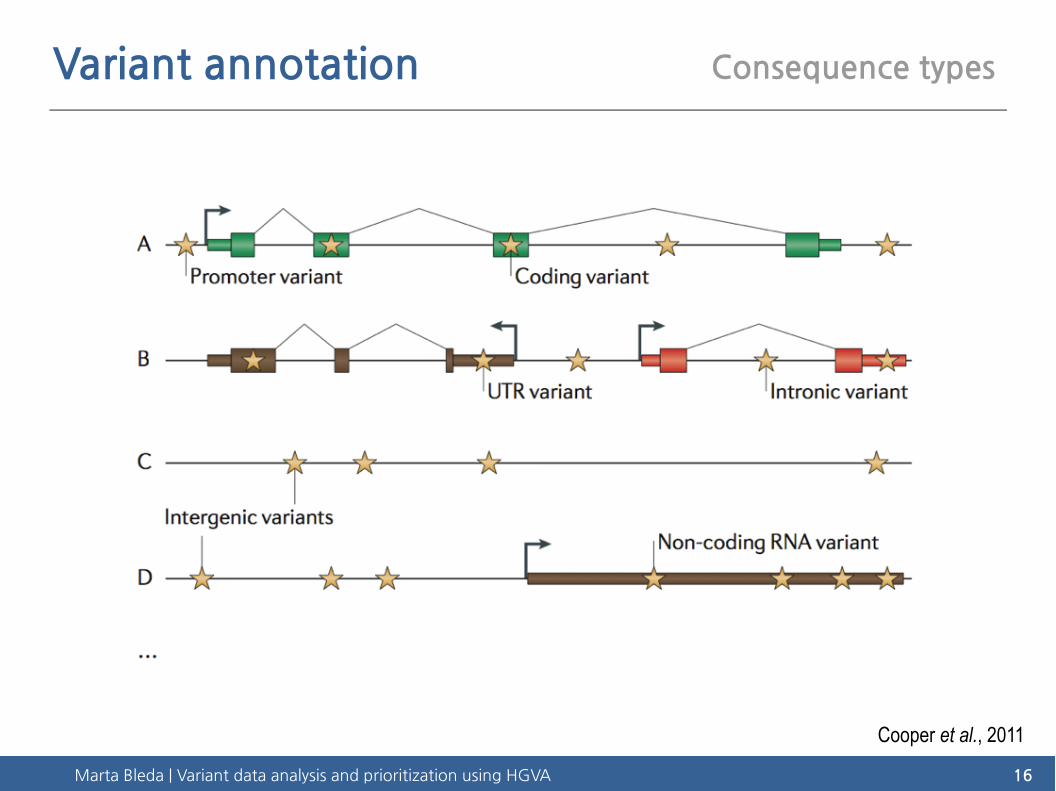
Variant annotation Consequence types
Cooper et al., 2011
Marta Bleda | Variant data analysis and prioritization using HGVA 17
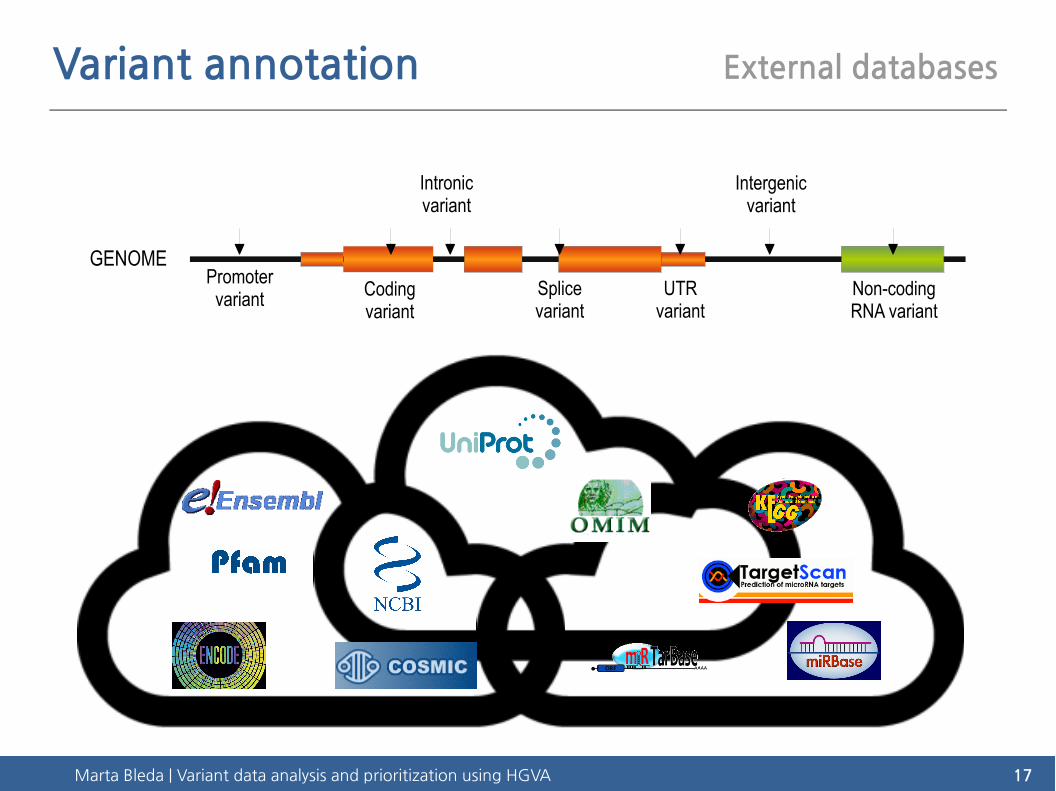
Variant annotation External databases
GENOMEPromotervariant Coding
variant
Intronic variant
Splice variant
UTR variant
Intergenic variant
Non-coding RNA variant

Marta Bleda | Variant data analysis and prioritization using HGVA 18
Variant annotation Reference datasets
GENOMEPromotervariant Coding
variant
Intronic variant
Splice variant
UTR variant
Intergenic variant
Non-coding RNA variant
Population allele frequency is one of the most powerful discriminators of genetic variant pathogenicity
AF from large-scale genomic datasets can be used for efficient filtering of candidate disease-causing variants
Common variants are unlikely to be pathogenic
● 1000 Genomes (2,504 samples)● Exome Sequencing Project (ESP) (6,503 samples)● ExAC (60,706 samples)● GnomAD (138,632 samples)
Marta Bleda | Variant data analysis and prioritization using HGVA 19
Variant annotation Reference datasets: ExAC
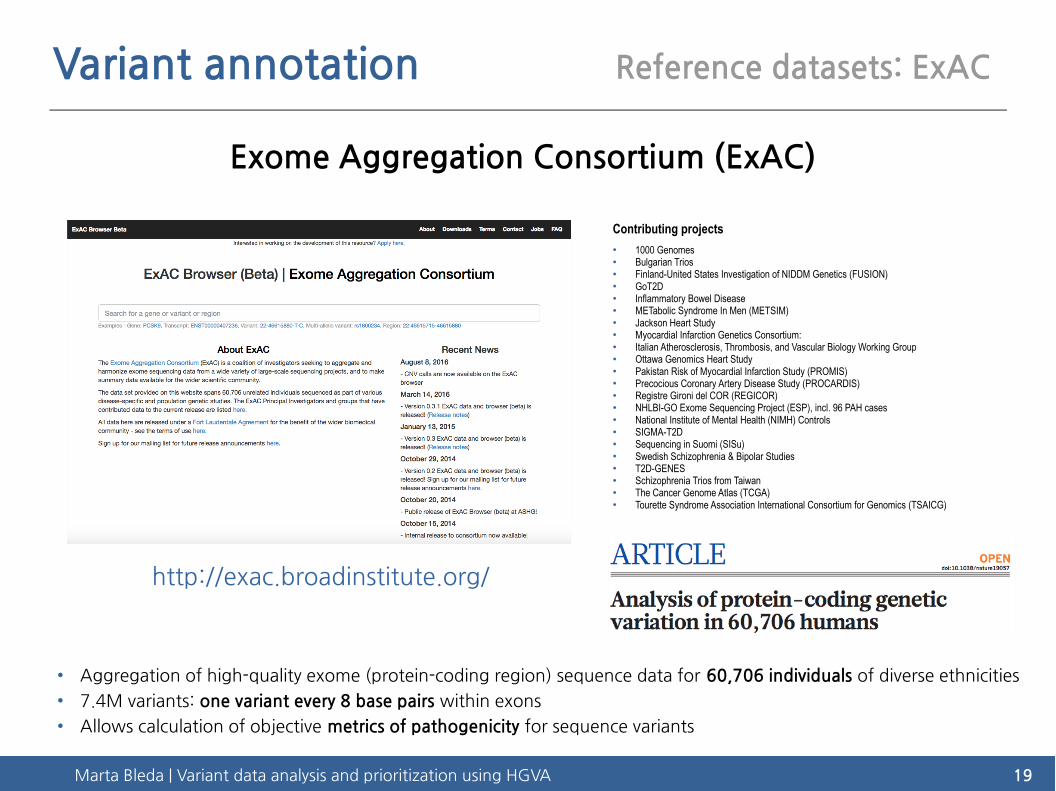
Exome Aggregation Consortium (ExAC)
http://exac.broadinstitute.org/
● Aggregation of high-quality exome (protein-coding region) sequence data for 60,706 individuals of diverse ethnicities
● 7.4M variants: one variant every 8 base pairs within exons
● Allows calculation of objective metrics of pathogenicity for sequence variants
Contributing projects● 1000 Genomes● Bulgarian Trios● Finland-United States Investigation of NIDDM Genetics (FUSION)● GoT2D● Inflammatory Bowel Disease● METabolic Syndrome In Men (METSIM)● Jackson Heart Study● Myocardial Infarction Genetics Consortium:● Italian Atherosclerosis, Thrombosis, and Vascular Biology Working Group● Ottawa Genomics Heart Study● Pakistan Risk of Myocardial Infarction Study (PROMIS)● Precocious Coronary Artery Disease Study (PROCARDIS)● Registre Gironi del COR (REGICOR)● NHLBI-GO Exome Sequencing Project (ESP), incl. 96 PAH cases● National Institute of Mental Health (NIMH) Controls● SIGMA-T2D● Sequencing in Suomi (SISu)● Swedish Schizophrenia & Bipolar Studies● T2D-GENES● Schizophrenia Trios from Taiwan● The Cancer Genome Atlas (TCGA)● Tourette Syndrome Association International Consortium for Genomics (TSAICG)

Marta Bleda | Variant data analysis and prioritization using HGVA 20
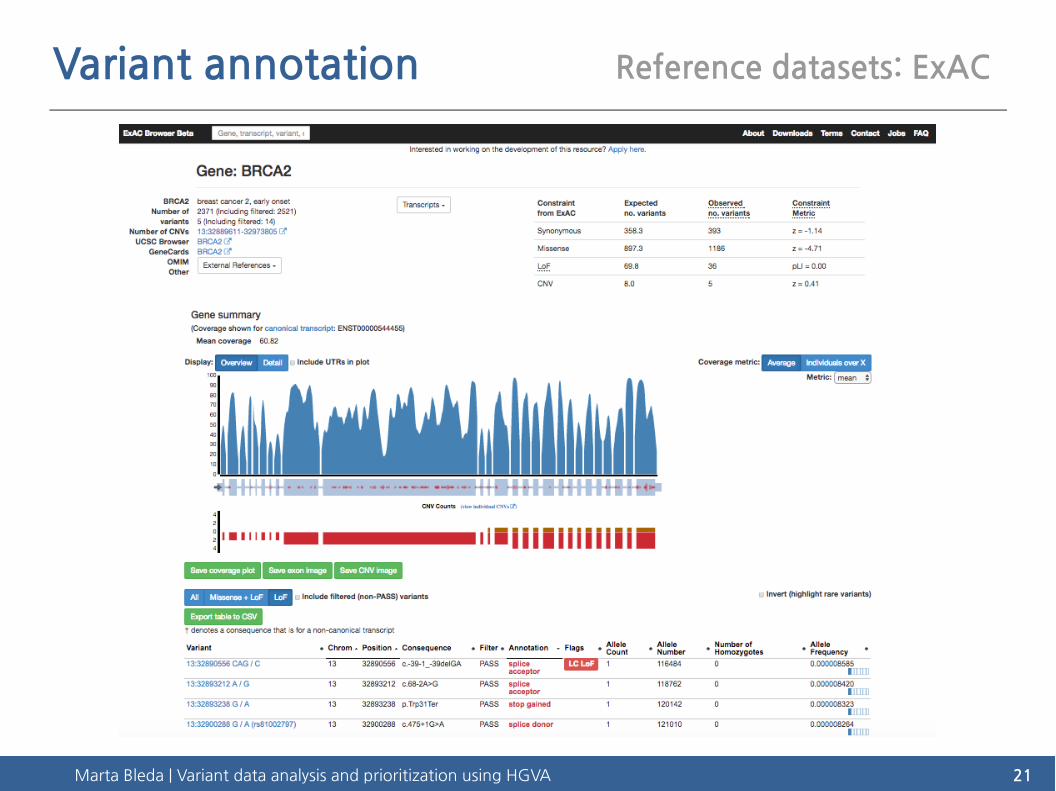
Variant annotation Reference datasets: ExAC
Marta Bleda | Variant data analysis and prioritization using HGVA 21
Variant annotation Reference datasets: ExAC
Marta Bleda | Variant data analysis and prioritization using HGVA 22
Variant annotation Reference datasets: gnomAD
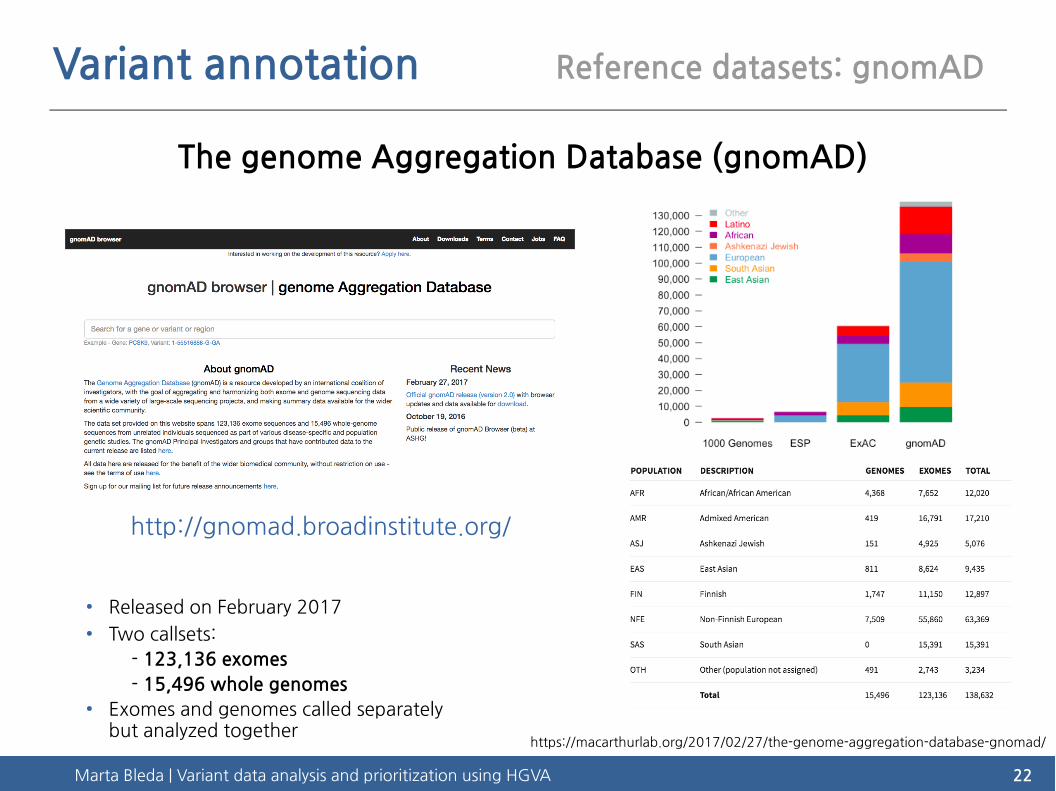
The genome Aggregation Database (gnomAD)
http://gnomad.broadinstitute.org/
● Released on February 2017● Two callsets:
- 123,136 exomes
- 15,496 whole genomes● Exomes and genomes called separately
but analyzed togetherhttps://macarthurlab.org/2017/02/27/the-genome-aggregation-database-gnomad/

Marta Bleda | Variant data analysis and prioritization using HGVA 23
Variant annotation Reference datasets: gnomAD

Marta Bleda | Variant data analysis and prioritization using HGVA 24
Variant annotation Deleteriousness scores
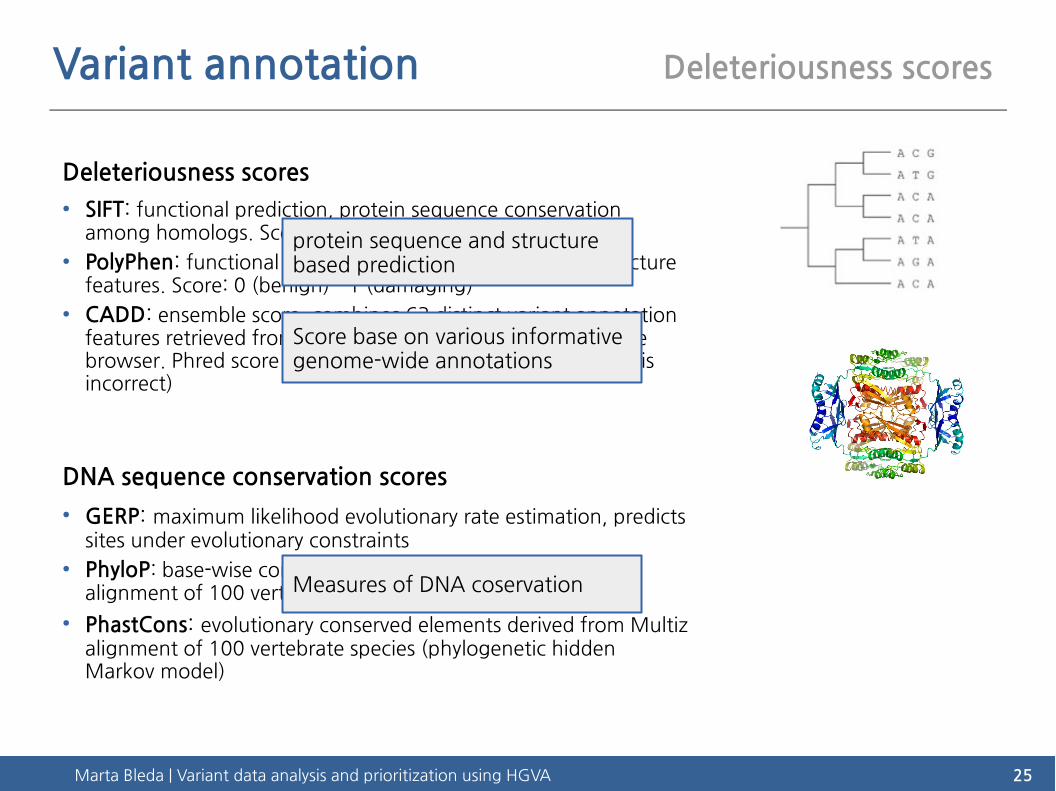
Deleteriousness scores
● SIFT: functional prediction, protein sequence conservation among homologs. Score: 1 (tolerated) - 0 (deleterious)
● PolyPhen: functional prediction, protein sequence and structure features. Score: 0 (benign) - 1 (damaging)
● CADD: ensemble score, combines 63 distinct variant annotation features retrieved from Ensembl VEP, Encode, UCSC genome browser. Phred score (i.e. 30 = 99.9% accurate or 1 in 1000 is incorrect)
DNA sequence conservation scores
● GERP: maximum likelihood evolutionary rate estimation, predicts sites under evolutionary constraints
● PhyloP: base-wise conservation score derived from Multiz alignment of 100 vertebrate species
● PhastCons: evolutionary conserved elements derived from Multiz alignment of 100 vertebrate species (phylogenetic hidden Markov model)
Marta Bleda | Variant data analysis and prioritization using HGVA 25
Variant annotation Deleteriousness scores
Deleteriousness scores
● SIFT: functional prediction, protein sequence conservation among homologs. Score: 1 (tolerated) - 0 (deleterious)
● PolyPhen: functional prediction, protein sequence and structure features. Score: 0 (benign) - 1 (damaging)
● CADD: ensemble score, combines 63 distinct variant annotation features retrieved from Ensembl VEP, Encode, UCSC genome browser. Phred score (i.e. 30 = 99.9% accurate or 1 in 1000 is incorrect)
DNA sequence conservation scores
● GERP: maximum likelihood evolutionary rate estimation, predicts sites under evolutionary constraints
● PhyloP: base-wise conservation score derived from Multiz alignment of 100 vertebrate species
● PhastCons: evolutionary conserved elements derived from Multiz alignment of 100 vertebrate species (phylogenetic hidden Markov model)
protein sequence and structure based prediction
Score base on various informative genome-wide annotations
Measures of DNA coservation
Marta Bleda | Variant data analysis and prioritization using HGVA 26
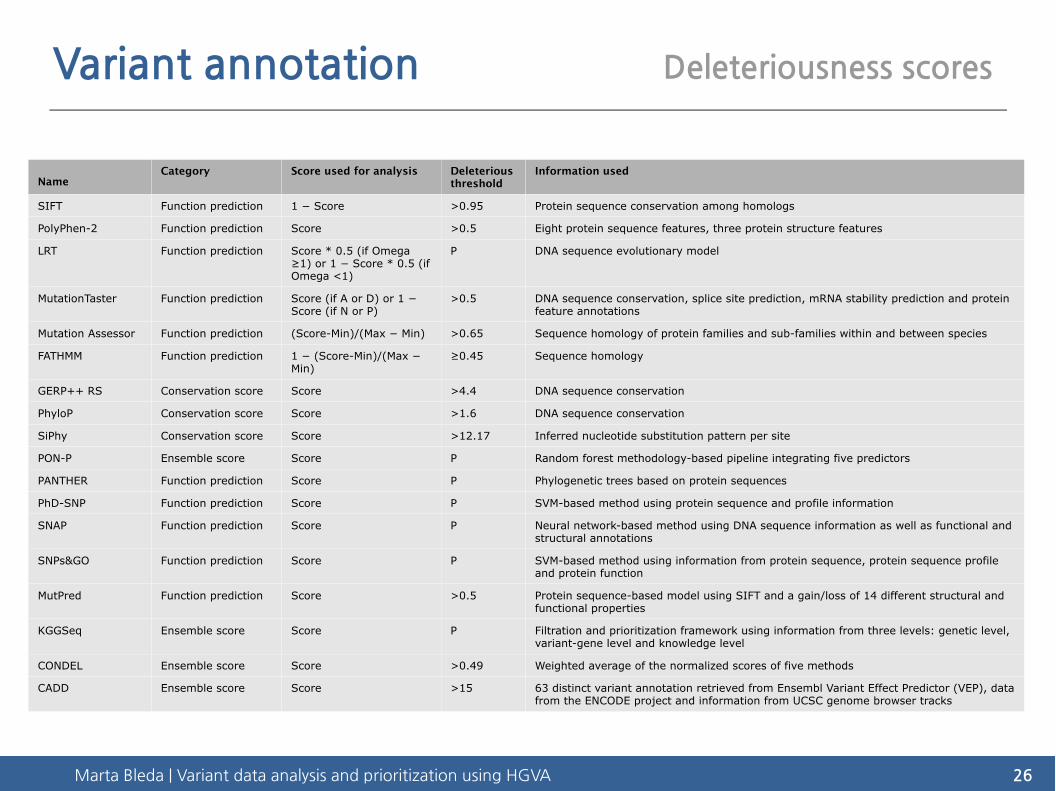
Variant annotation Deleteriousness scores
NameCategory Score used for analysis Deleterious
thresholdInformation used
SIFT Function prediction 1 − Score >0.95 Protein sequence conservation among homologs
PolyPhen-2 Function prediction Score >0.5 Eight protein sequence features, three protein structure features
LRT Function prediction Score * 0.5 (if Omega ≥1) or 1 − Score * 0.5 (if Omega <1)
P DNA sequence evolutionary model
MutationTaster Function prediction Score (if A or D) or 1 − Score (if N or P)
>0.5 DNA sequence conservation, splice site prediction, mRNA stability prediction and protein feature annotations
Mutation Assessor Function prediction (Score-Min)/(Max − Min) >0.65 Sequence homology of protein families and sub-families within and between species
FATHMM Function prediction 1 − (Score-Min)/(Max − Min)
≥0.45 Sequence homology
GERP++ RS Conservation score Score >4.4 DNA sequence conservation
PhyloP Conservation score Score >1.6 DNA sequence conservation
SiPhy Conservation score Score >12.17 Inferred nucleotide substitution pattern per site
PON-P Ensemble score Score P Random forest methodology-based pipeline integrating five predictors
PANTHER Function prediction Score P Phylogenetic trees based on protein sequences
PhD-SNP Function prediction Score P SVM-based method using protein sequence and profile information
SNAP Function prediction Score P Neural network-based method using DNA sequence information as well as functional and structural annotations
SNPs&GO Function prediction Score P SVM-based method using information from protein sequence, protein sequence profile and protein function
MutPred Function prediction Score >0.5 Protein sequence-based model using SIFT and a gain/loss of 14 different structural and functional properties
KGGSeq Ensemble score Score P Filtration and prioritization framework using information from three levels: genetic level, variant-gene level and knowledge level
CONDEL Ensemble score Score >0.49 Weighted average of the normalized scores of five methods
CADD Ensemble score Score >15 63 distinct variant annotation retrieved from Ensembl Variant Effect Predictor (VEP), data from the ENCODE project and information from UCSC genome browser tracks
Marta Bleda | Variant data analysis and prioritization using HGVA 27
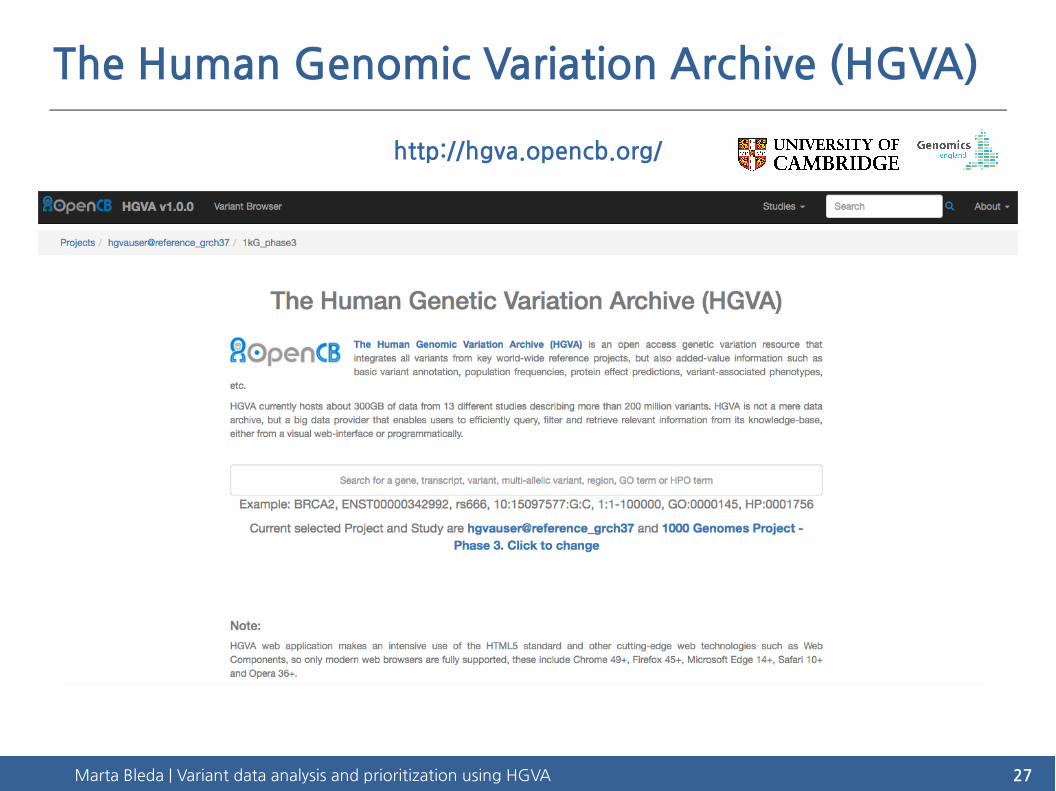
The Human Genomic Variation Archive (HGVA)
http://hgva.opencb.org/
Marta Bleda | Variant data analysis and prioritization using HGVA 28
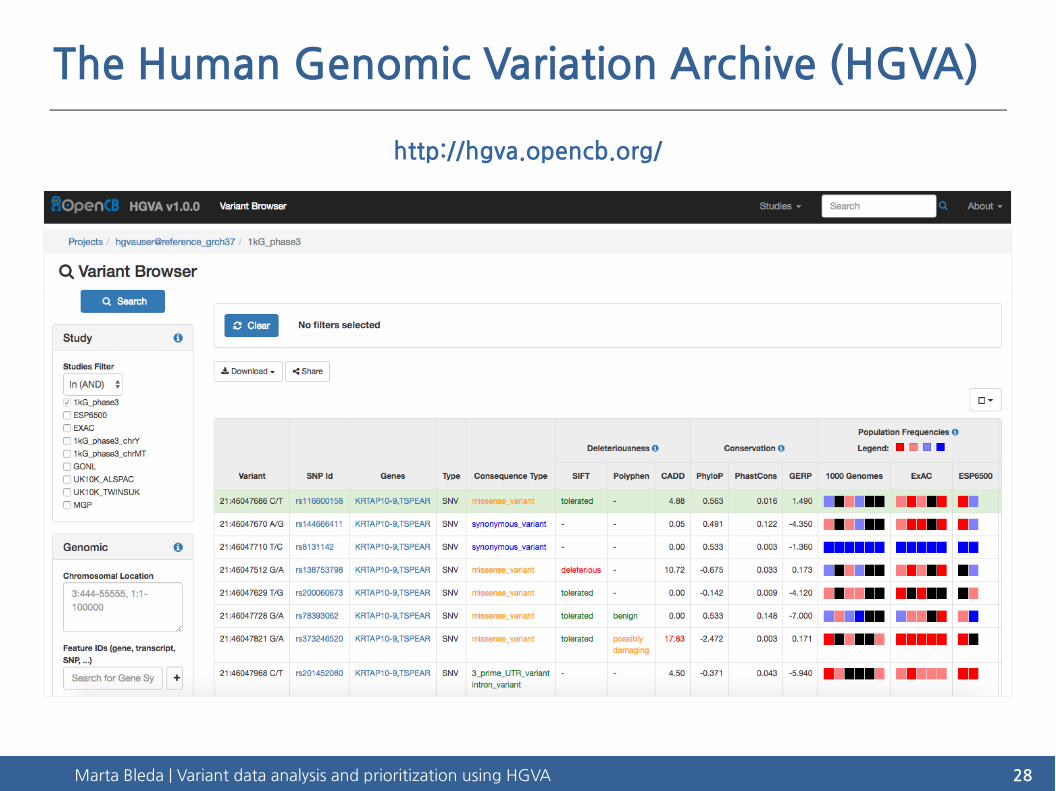
The Human Genomic Variation Archive (HGVA)
http://hgva.opencb.org/

Marta Bleda | Variant data analysis and prioritization using HGVA 29
THANK YOU.