vancouver energy npdes engineering report savage/application...vancouver energy npdes engineering...
TRANSCRIPT
Vancouver Energy NPDES Engineering Report
EFSEC Application for Site Certification No. 2013-01 Docket No. EF131590
Appendix E Water Quality Model Results

Facility Runoff Model Results


WWHM2012
PROJECT REPORT
VE Full Facility 2/25/2015 5:34:59 PM Page 2
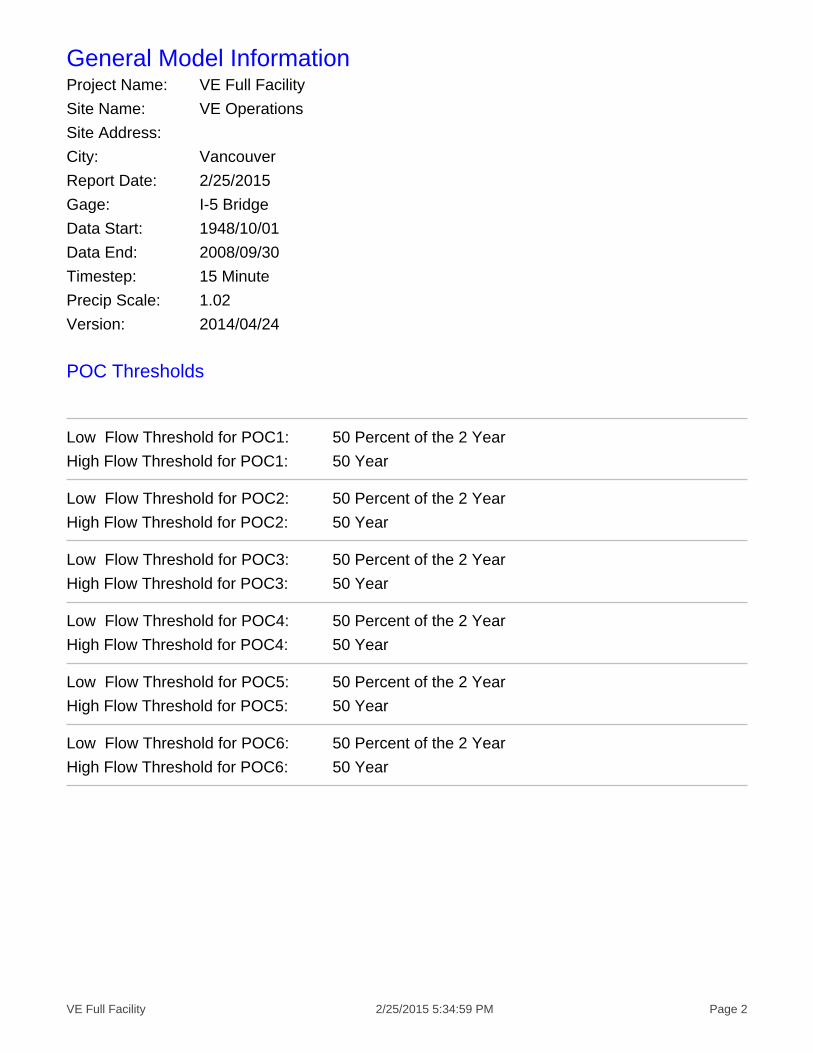
General Model InformationProject Name: VE Full Facility
Site Name: VE Operations
Site Address:
City: Vancouver
Report Date: 2/25/2015
Gage: I-5 Bridge
Data Start: 1948/10/01
Data End: 2008/09/30
Timestep: 15 Minute
Precip Scale: 1.02
Version: 2014/04/24
POC Thresholds
Low Flow Threshold for POC1: 50 Percent of the 2 Year
High Flow Threshold for POC1: 50 Year
Low Flow Threshold for POC2: 50 Percent of the 2 Year
High Flow Threshold for POC2: 50 Year
Low Flow Threshold for POC3: 50 Percent of the 2 Year
High Flow Threshold for POC3: 50 Year
Low Flow Threshold for POC4: 50 Percent of the 2 Year
High Flow Threshold for POC4: 50 Year
Low Flow Threshold for POC5: 50 Percent of the 2 Year
High Flow Threshold for POC5: 50 Year
Low Flow Threshold for POC6: 50 Percent of the 2 Year
High Flow Threshold for POC6: 50 Year

VE Full Facility 2/25/2015 5:34:59 PM Page 3
Landuse Basin DataPredeveloped Land Use
200Bypass: No
GroundWater: No
Pervious Land Use Acres
Pervious Total 0
Impervious Land Use Acres DRIVEWAYS FLAT 7.8
Impervious Total 7.8
Basin Total 7.8
Element Flows To:Surface Interflow Groundwater
VE Full Facility 2/25/2015 5:34:59 PM Page 4
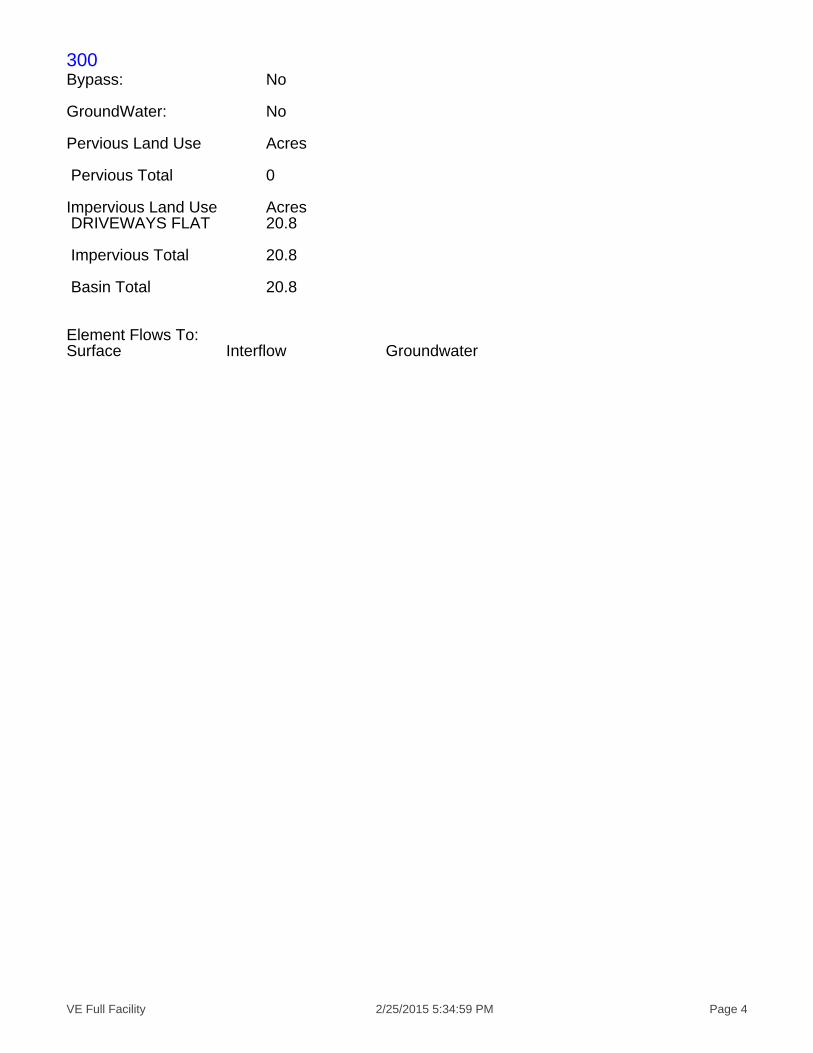
300Bypass: No
GroundWater: No
Pervious Land Use Acres
Pervious Total 0
Impervious Land Use Acres DRIVEWAYS FLAT 20.8
Impervious Total 20.8
Basin Total 20.8
Element Flows To:Surface Interflow Groundwater
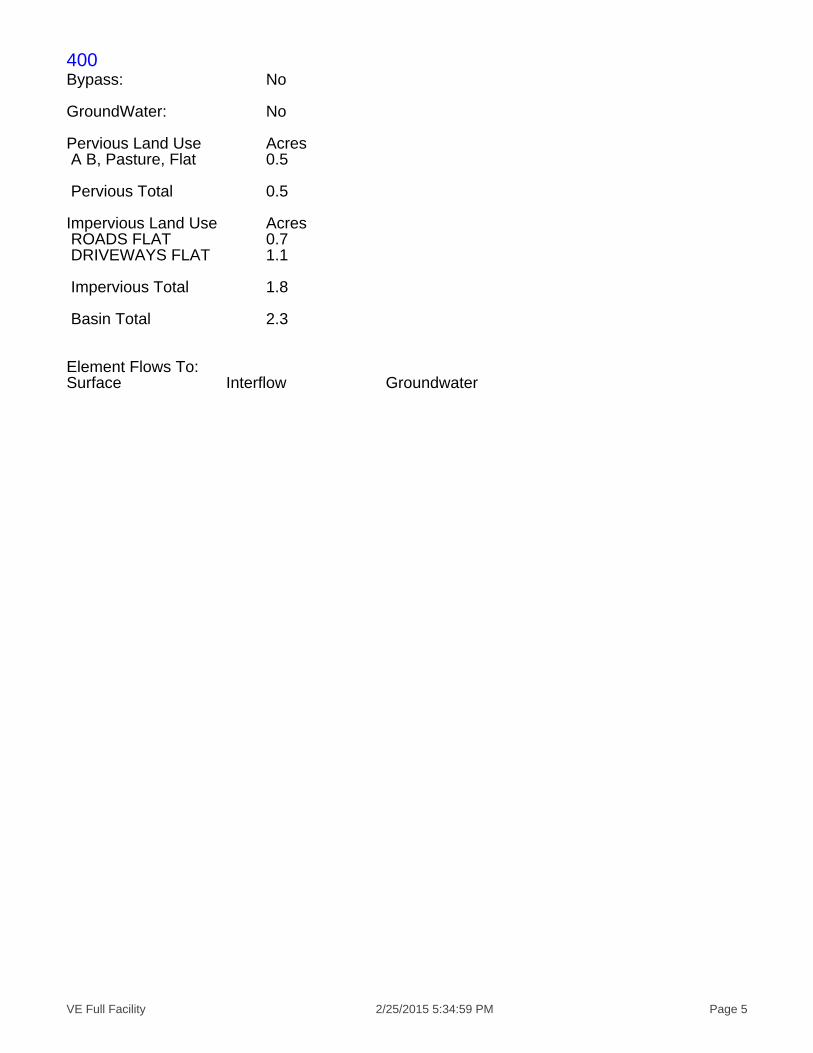
VE Full Facility 2/25/2015 5:34:59 PM Page 5
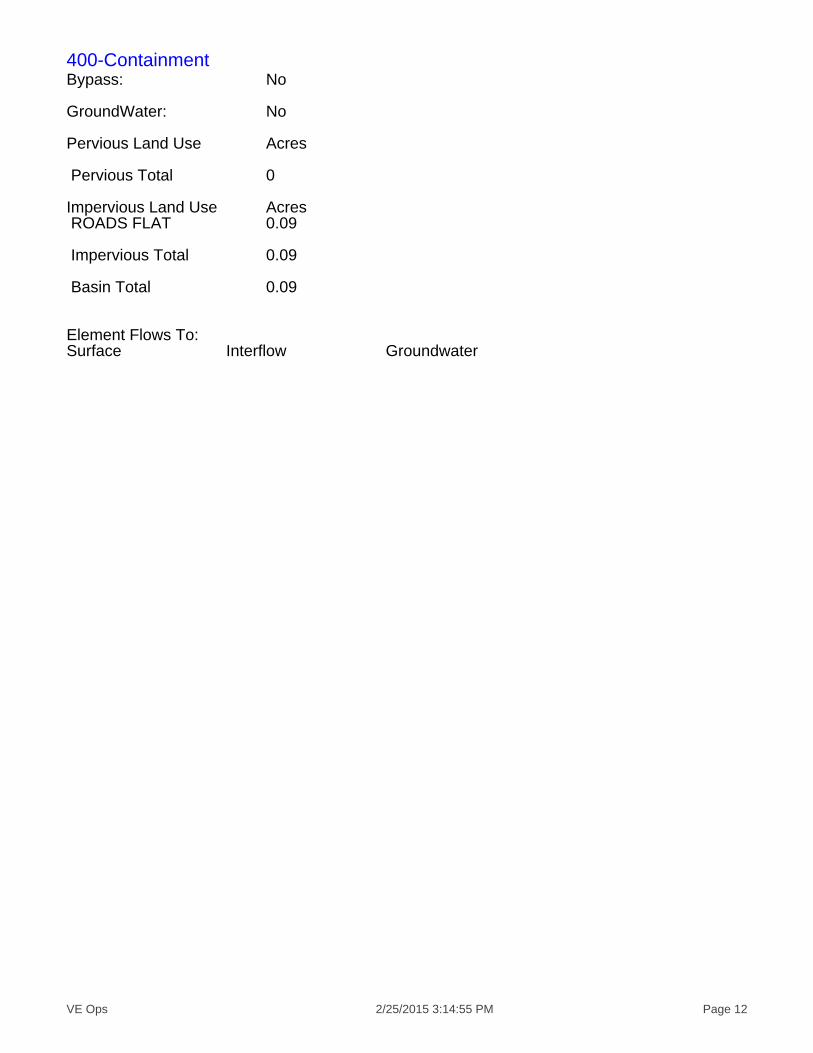
400Bypass: No
GroundWater: No
Pervious Land Use Acres A B, Pasture, Flat 0.5
Pervious Total 0.5
Impervious Land Use Acres ROADS FLAT 0.7 DRIVEWAYS FLAT 1.1
Impervious Total 1.8
Basin Total 2.3
Element Flows To:Surface Interflow Groundwater
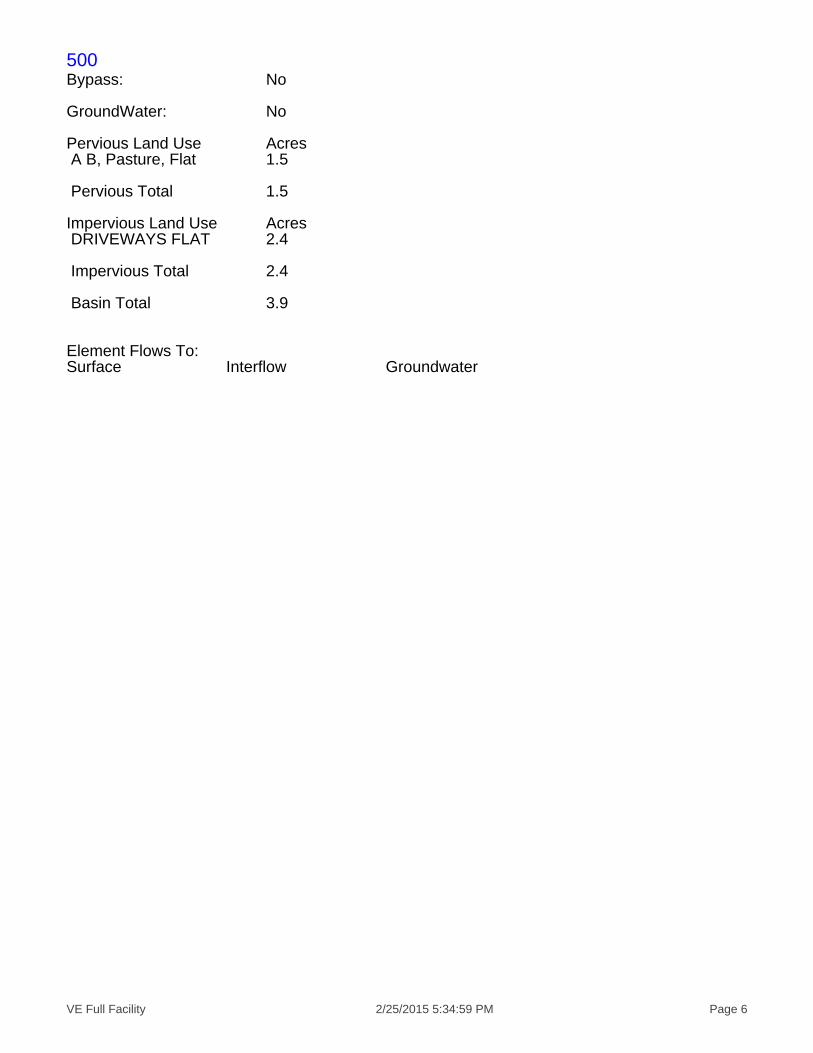
VE Full Facility 2/25/2015 5:34:59 PM Page 6
500Bypass: No
GroundWater: No
Pervious Land Use Acres A B, Pasture, Flat 1.5
Pervious Total 1.5
Impervious Land Use Acres DRIVEWAYS FLAT 2.4
Impervious Total 2.4
Basin Total 3.9
Element Flows To:Surface Interflow Groundwater
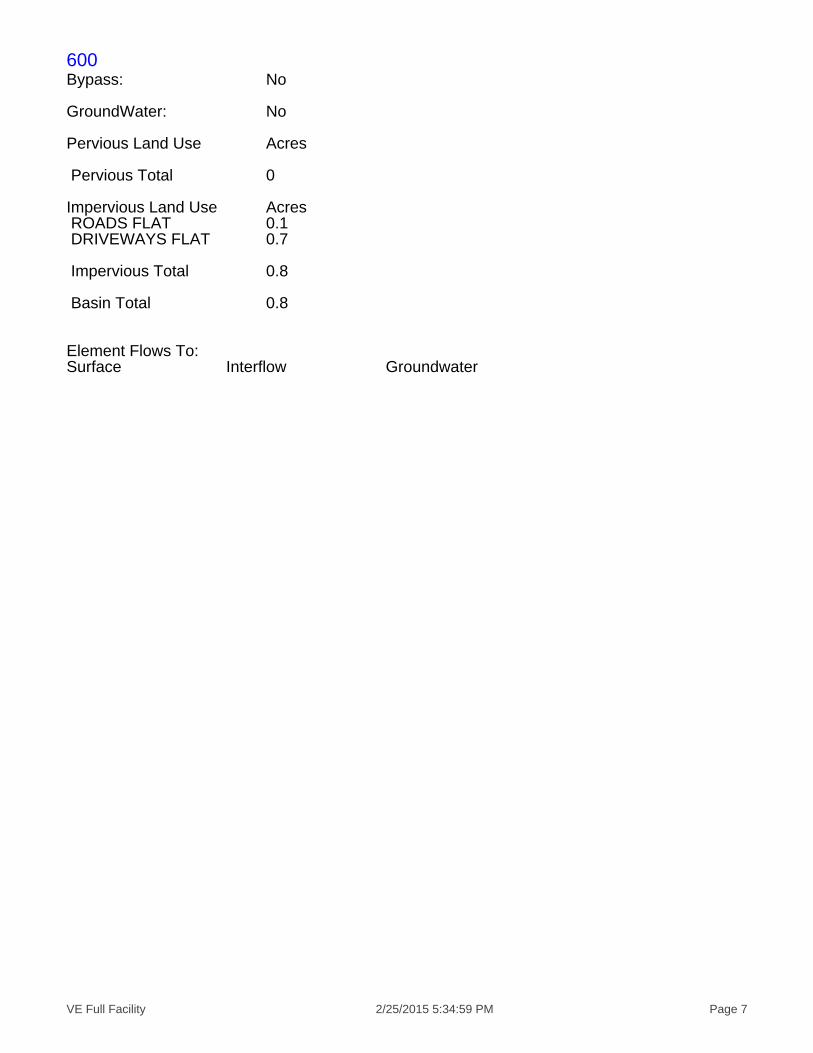
VE Full Facility 2/25/2015 5:34:59 PM Page 7
600Bypass: No
GroundWater: No
Pervious Land Use Acres
Pervious Total 0
Impervious Land Use Acres ROADS FLAT 0.1 DRIVEWAYS FLAT 0.7
Impervious Total 0.8
Basin Total 0.8
Element Flows To:Surface Interflow Groundwater

VE Full Facility 2/25/2015 5:34:59 PM Page 8
Rail ImpBypass: No
GroundWater: No
Pervious Land Use Acres
Pervious Total 0
Impervious Land Use Acres DRIVEWAYS FLAT 5.4
Impervious Total 5.4
Basin Total 5.4
Element Flows To:Surface Interflow Groundwater
VE Full Facility 2/25/2015 5:34:59 PM Page 9
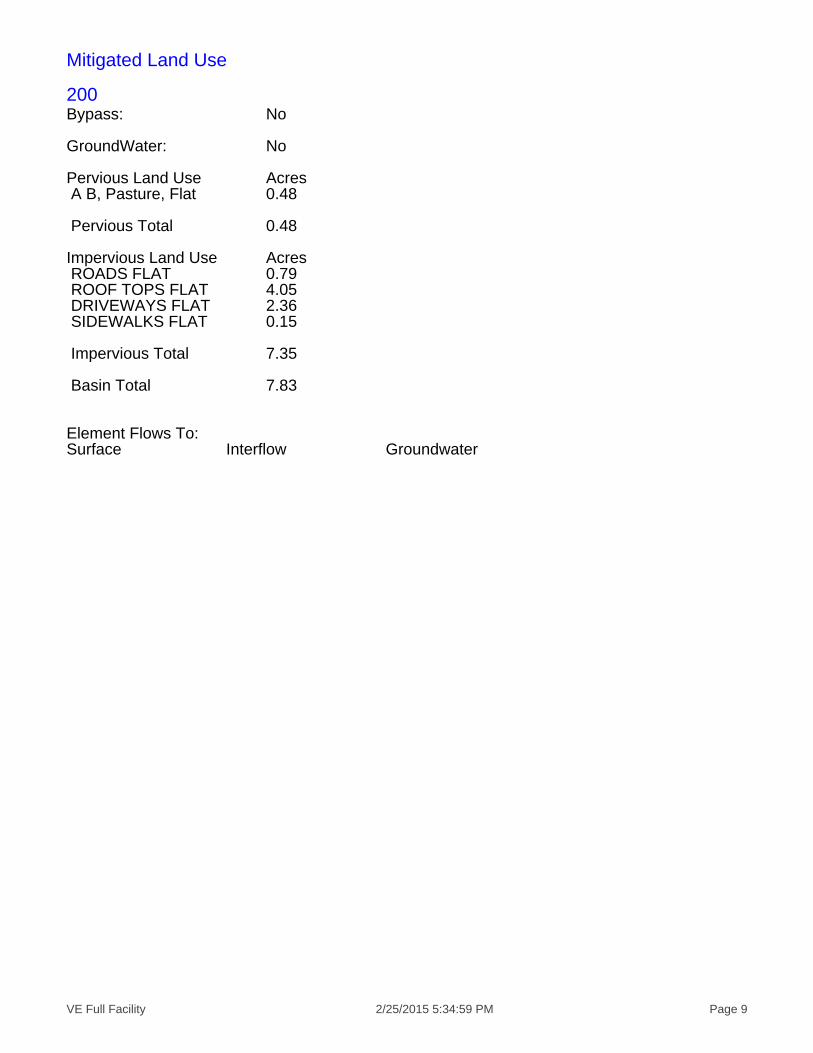
Mitigated Land Use
200Bypass: No
GroundWater: No
Pervious Land Use Acres A B, Pasture, Flat 0.48
Pervious Total 0.48
Impervious Land Use Acres ROADS FLAT 0.79 ROOF TOPS FLAT 4.05 DRIVEWAYS FLAT 2.36 SIDEWALKS FLAT 0.15
Impervious Total 7.35
Basin Total 7.83
Element Flows To:Surface Interflow Groundwater
VE Full Facility 2/25/2015 5:34:59 PM Page 10
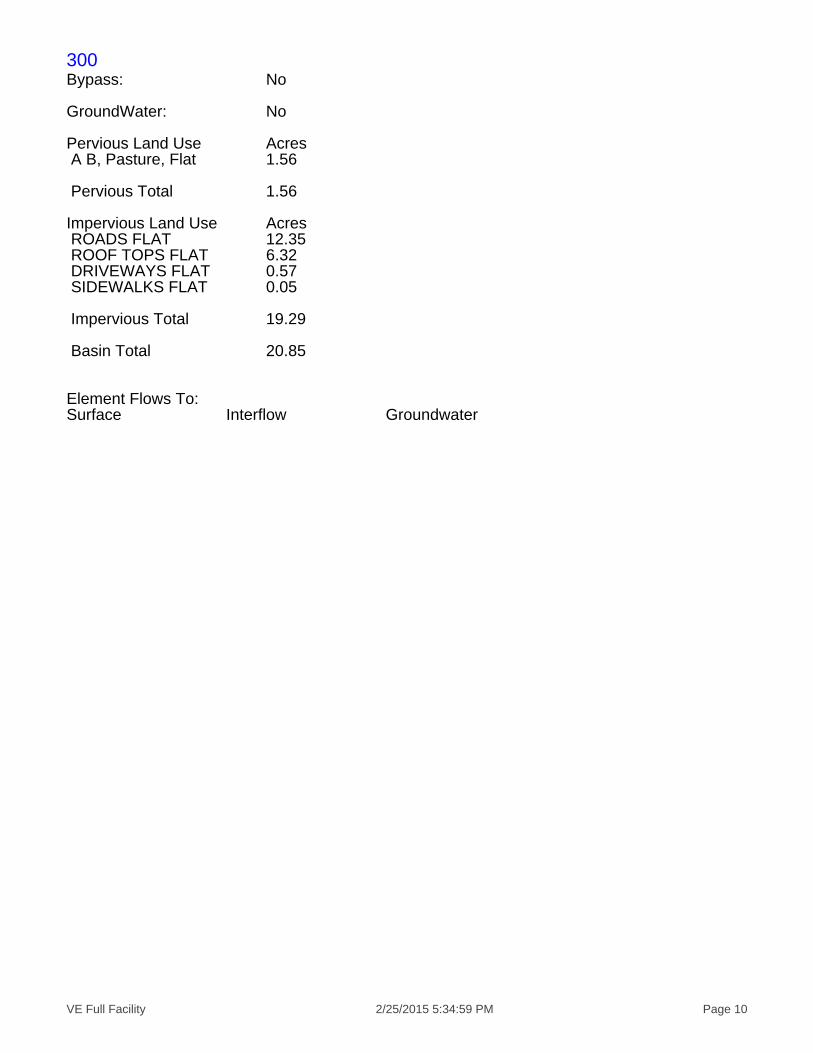
300Bypass: No
GroundWater: No
Pervious Land Use Acres A B, Pasture, Flat 1.56
Pervious Total 1.56
Impervious Land Use Acres ROADS FLAT 12.35 ROOF TOPS FLAT 6.32 DRIVEWAYS FLAT 0.57 SIDEWALKS FLAT 0.05
Impervious Total 19.29
Basin Total 20.85
Element Flows To:Surface Interflow Groundwater
VE Full Facility 2/25/2015 5:34:59 PM Page 11
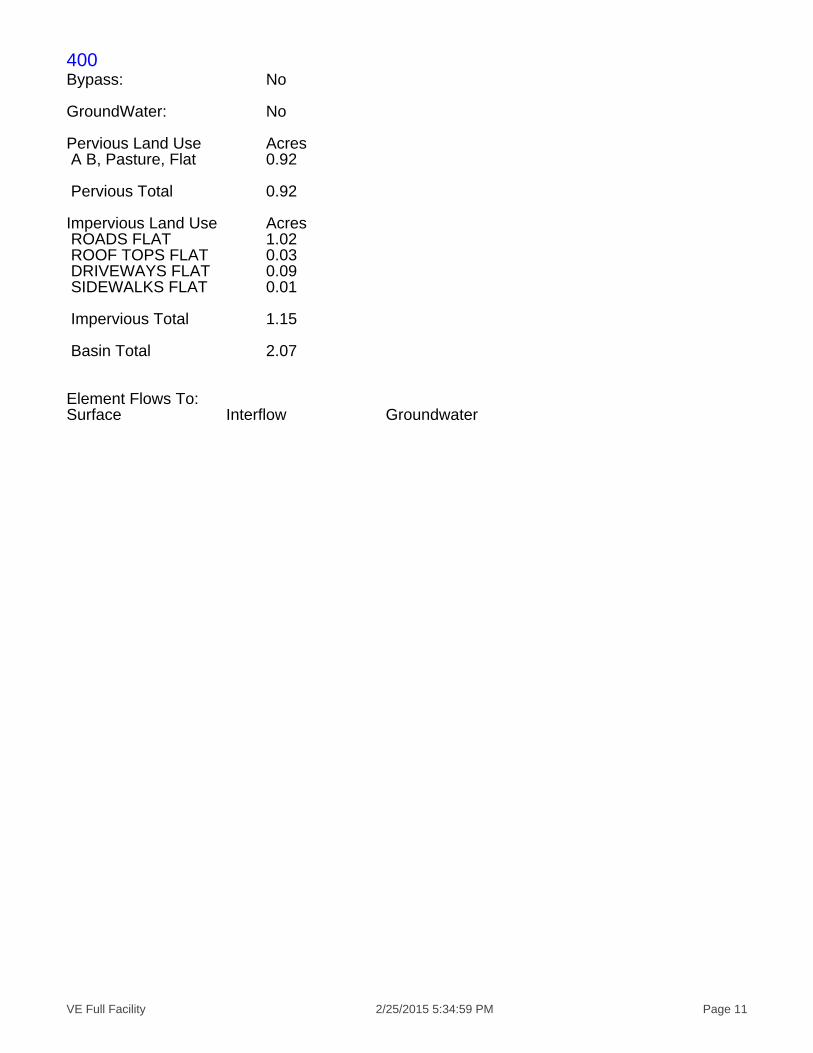
400Bypass: No
GroundWater: No
Pervious Land Use Acres A B, Pasture, Flat 0.92
Pervious Total 0.92
Impervious Land Use Acres ROADS FLAT 1.02 ROOF TOPS FLAT 0.03 DRIVEWAYS FLAT 0.09 SIDEWALKS FLAT 0.01
Impervious Total 1.15
Basin Total 2.07
Element Flows To:Surface Interflow Groundwater

VE Full Facility 2/25/2015 5:34:59 PM Page 12
500Bypass: No
GroundWater: No
Pervious Land Use Acres
Pervious Total 0
Impervious Land Use Acres DRIVEWAYS FLAT 4.89
Impervious Total 4.89
Basin Total 4.89
Element Flows To:Surface Interflow Groundwater

VE Full Facility 2/25/2015 5:34:59 PM Page 13
600Bypass: No
GroundWater: No
Pervious Land Use Acres A B, Pasture, Flat 0.1
Pervious Total 0.1
Impervious Land Use Acres ROADS FLAT 0.16 ROOF TOPS FLAT 0.19 DRIVEWAYS FLAT 0.39 SIDEWALKS FLAT 0.01
Impervious Total 0.75
Basin Total 0.85
Element Flows To:Surface Interflow Groundwater
VE Full Facility 2/25/2015 5:34:59 PM Page 14
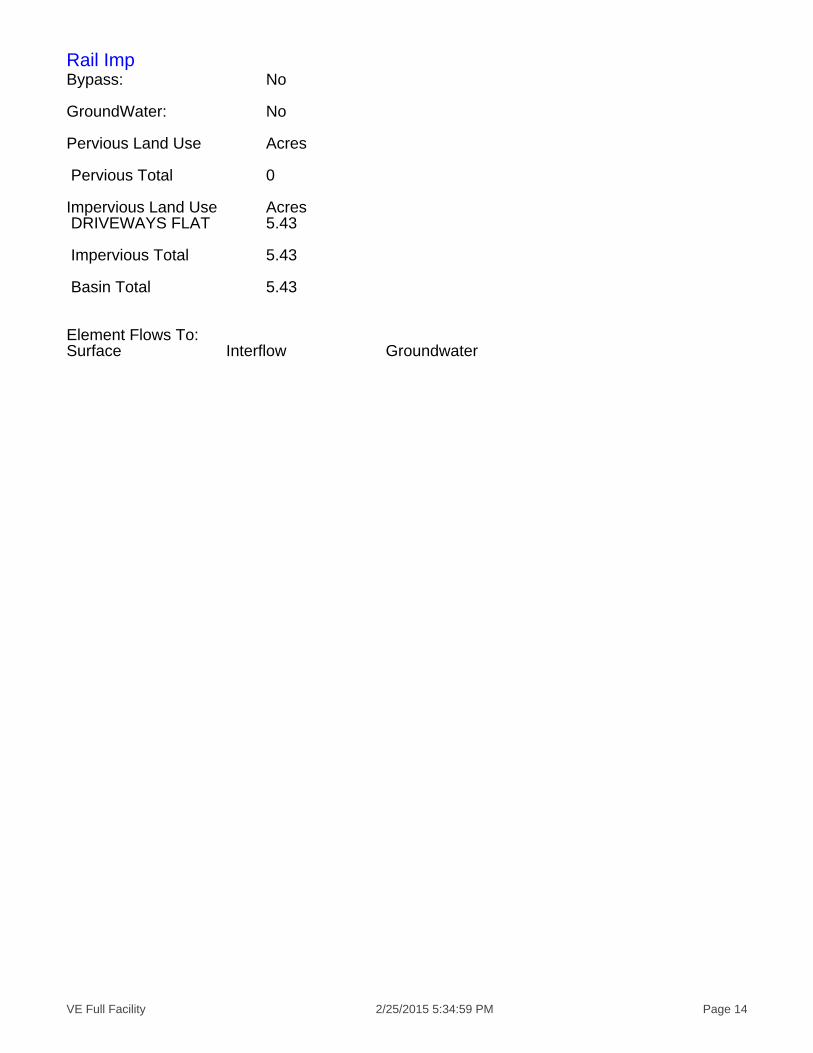
Rail ImpBypass: No
GroundWater: No
Pervious Land Use Acres
Pervious Total 0
Impervious Land Use Acres DRIVEWAYS FLAT 5.43
Impervious Total 5.43
Basin Total 5.43
Element Flows To:Surface Interflow Groundwater

VE Full Facility 2/25/2015 5:34:59 PM Page 15
Routing ElementsPredeveloped Routing

VE Full Facility 2/25/2015 5:34:59 PM Page 16
Mitigated Routing
VE Full Facility 2/25/2015 5:34:59 PM Page 17
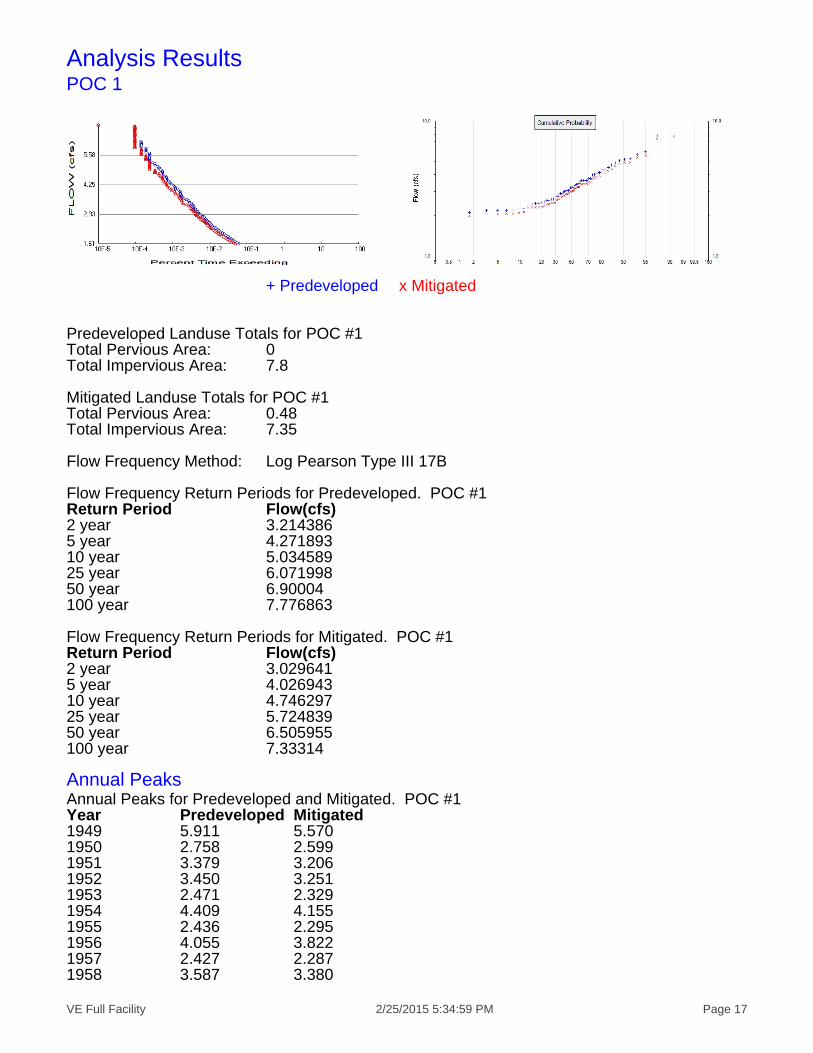
Analysis ResultsPOC 1
+ Predeveloped x Mitigated
Predeveloped Landuse Totals for POC #1Total Pervious Area: 0Total Impervious Area: 7.8
Mitigated Landuse Totals for POC #1Total Pervious Area: 0.48Total Impervious Area: 7.35
Flow Frequency Method: Log Pearson Type III 17B
Flow Frequency Return Periods for Predeveloped. POC #1Return Period Flow(cfs)2 year 3.2143865 year 4.27189310 year 5.03458925 year 6.07199850 year 6.90004100 year 7.776863
Flow Frequency Return Periods for Mitigated. POC #1Return Period Flow(cfs)2 year 3.0296415 year 4.02694310 year 4.74629725 year 5.72483950 year 6.505955100 year 7.33314
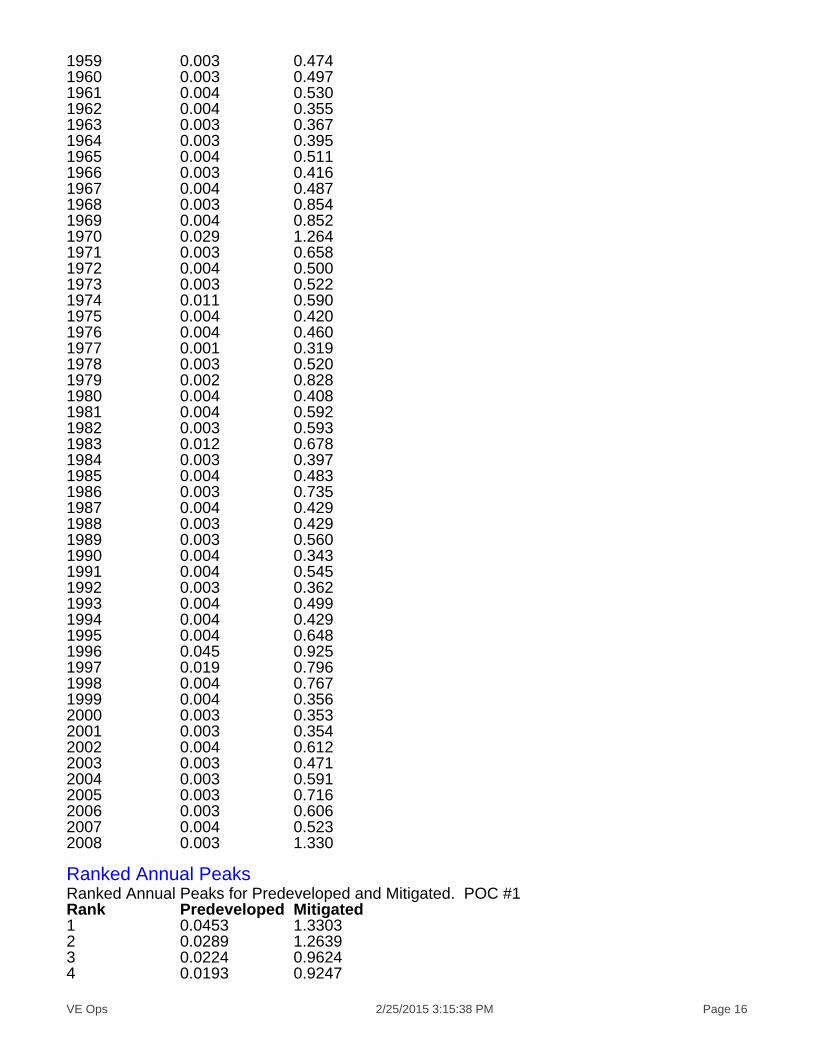
Annual PeaksAnnual Peaks for Predeveloped and Mitigated. POC #1Year Predeveloped Mitigated1949 5.911 5.5701950 2.758 2.5991951 3.379 3.2061952 3.450 3.2511953 2.471 2.3291954 4.409 4.1551955 2.436 2.2951956 4.055 3.8221957 2.427 2.2871958 3.587 3.380
VE Full Facility 2/25/2015 5:35:50 PM Page 18
1959 2.912 2.7441960 3.051 2.8751961 3.254 3.0661962 2.183 2.0571963 2.255 2.1251964 2.424 2.2841965 3.141 2.9601966 2.557 2.4101967 2.990 2.8181968 5.248 4.9451969 5.232 4.9301970 7.762 7.3331971 4.043 3.8101972 3.068 2.8911973 3.209 3.0241974 3.621 3.4121975 2.581 2.4321976 2.826 2.6631977 1.960 1.8471978 3.192 3.0081979 5.082 4.7891980 2.508 2.3631981 3.633 3.4241982 3.641 3.4311983 4.164 3.9381984 2.437 2.2961985 2.968 2.7971986 4.515 4.2551987 2.632 2.4801988 2.636 2.4841989 3.441 3.2431990 2.108 1.9861991 3.345 3.1521992 2.223 2.0951993 3.067 2.8901994 2.635 2.4841995 3.979 3.7501996 5.679 5.3521997 4.891 4.6091998 4.713 4.4411999 2.189 2.0632000 2.165 2.0402001 2.174 2.0492002 3.758 3.5422003 2.895 2.7282004 3.631 3.4212005 4.397 4.1432006 3.725 3.5102007 3.212 3.0272008 8.170 7.699
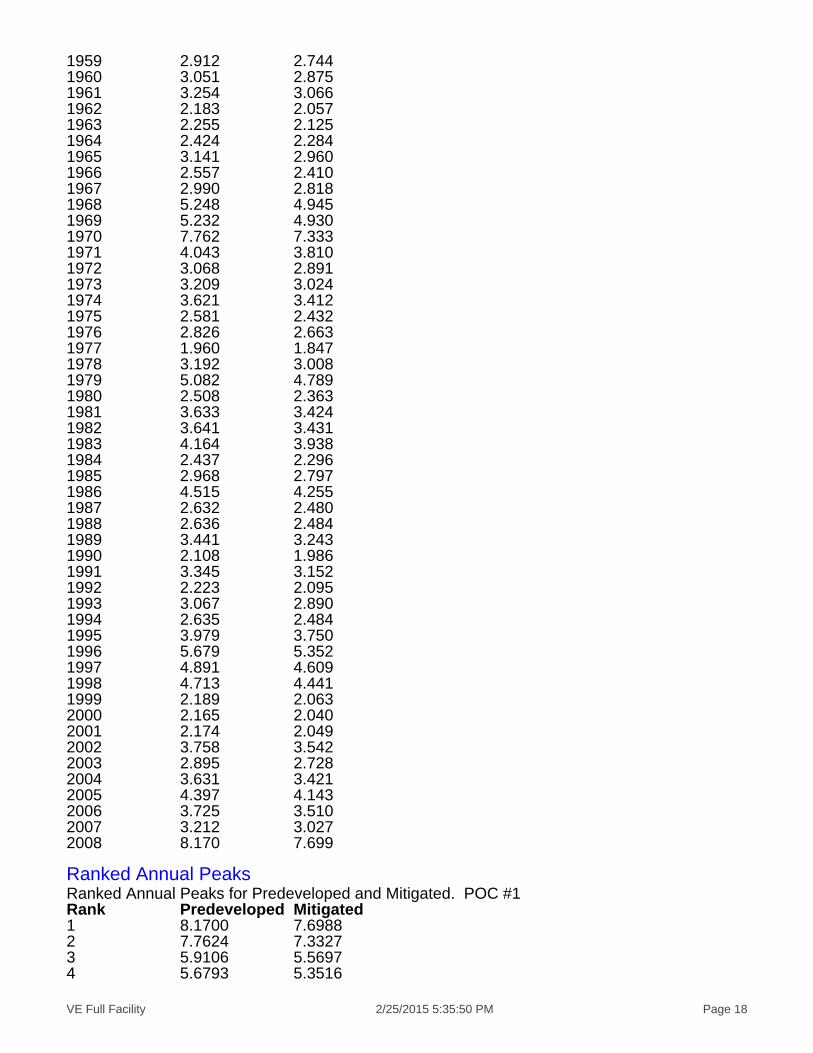
Ranked Annual PeaksRanked Annual Peaks for Predeveloped and Mitigated. POC #1Rank Predeveloped Mitigated1 8.1700 7.69882 7.7624 7.33273 5.9106 5.56974 5.6793 5.3516

VE Full Facility 2/25/2015 5:35:50 PM Page 19
5 5.2479 4.94546 5.2319 4.93007 5.0824 4.78928 4.8915 4.60939 4.7131 4.441210 4.5152 4.254811 4.4094 4.155312 4.3965 4.143013 4.1644 3.938214 4.0550 3.822215 4.0429 3.809716 3.9793 3.749917 3.7583 3.541518 3.7246 3.509819 3.6407 3.430820 3.6332 3.423621 3.6305 3.421222 3.6206 3.411723 3.5869 3.380024 3.4502 3.251225 3.4410 3.242526 3.3792 3.206027 3.3449 3.151928 3.2537 3.066029 3.2118 3.026530 3.2089 3.023931 3.1922 3.008032 3.1412 2.960033 3.0683 2.891334 3.0666 2.889735 3.0515 2.875436 2.9904 2.817937 2.9678 2.796838 2.9120 2.744339 2.8948 2.727840 2.8263 2.663341 2.7577 2.598642 2.6361 2.484343 2.6354 2.483644 2.6319 2.480045 2.5812 2.432346 2.5574 2.410247 2.5081 2.363448 2.4714 2.329249 2.4366 2.296050 2.4360 2.295451 2.4274 2.287352 2.4235 2.283853 2.2545 2.124654 2.2233 2.095055 2.1894 2.063256 2.1828 2.056957 2.1740 2.048958 2.1651 2.040259 2.1075 1.986060 1.9601 1.8471

VE Full Facility 2/25/2015 5:35:50 PM Page 20
VE Full Facility 2/25/2015 5:35:50 PM Page 21
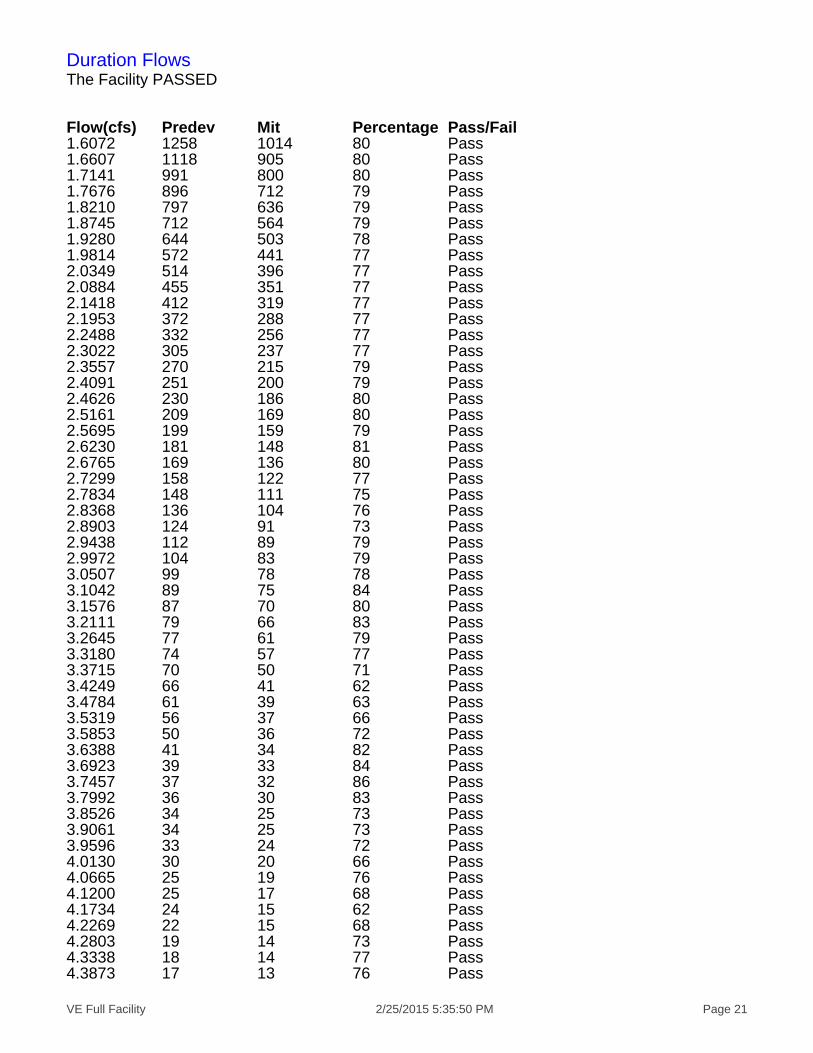
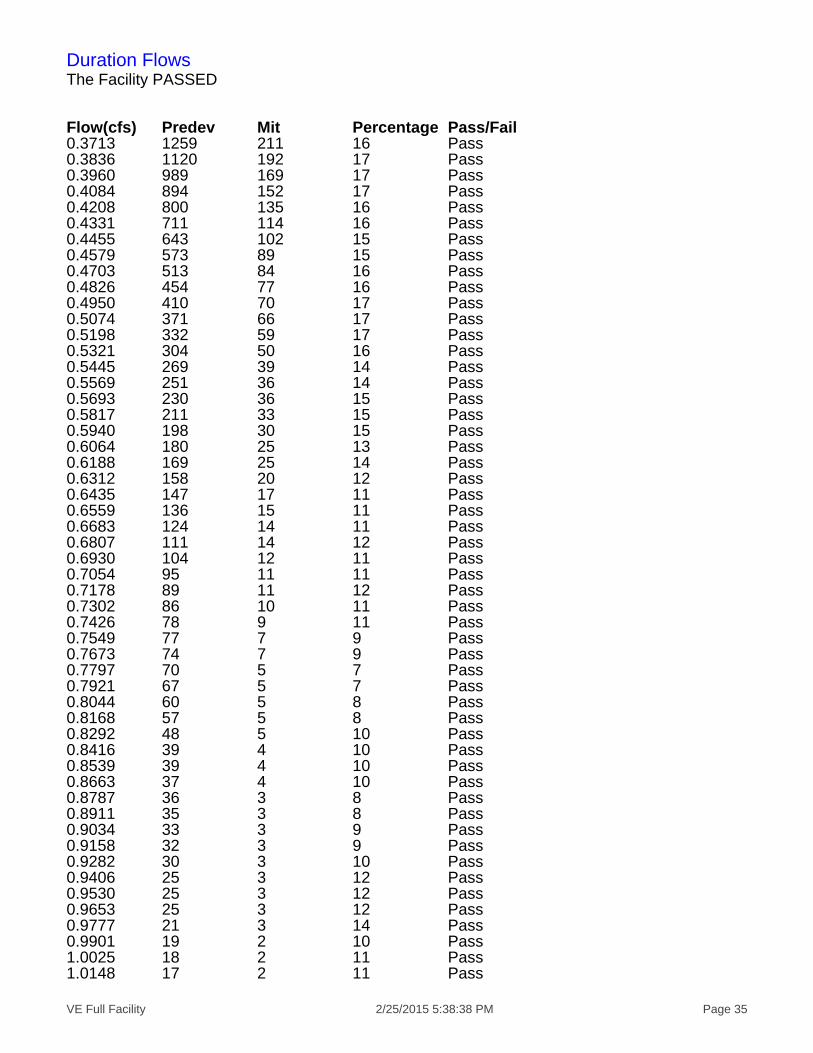
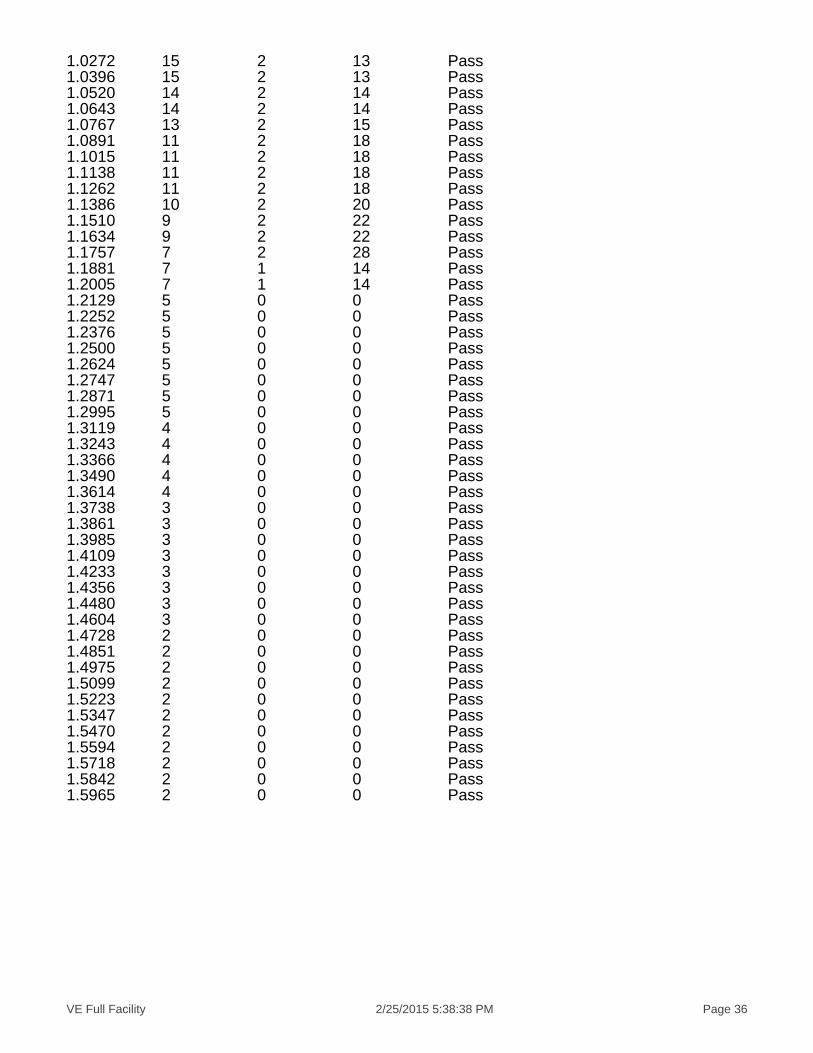
Duration FlowsThe Facility PASSED
Flow(cfs) Predev Mit Percentage Pass/Fail1.6072 1258 1014 80 Pass1.6607 1118 905 80 Pass1.7141 991 800 80 Pass1.7676 896 712 79 Pass1.8210 797 636 79 Pass1.8745 712 564 79 Pass1.9280 644 503 78 Pass1.9814 572 441 77 Pass2.0349 514 396 77 Pass2.0884 455 351 77 Pass2.1418 412 319 77 Pass2.1953 372 288 77 Pass2.2488 332 256 77 Pass2.3022 305 237 77 Pass2.3557 270 215 79 Pass2.4091 251 200 79 Pass2.4626 230 186 80 Pass2.5161 209 169 80 Pass2.5695 199 159 79 Pass2.6230 181 148 81 Pass2.6765 169 136 80 Pass2.7299 158 122 77 Pass2.7834 148 111 75 Pass2.8368 136 104 76 Pass2.8903 124 91 73 Pass2.9438 112 89 79 Pass2.9972 104 83 79 Pass3.0507 99 78 78 Pass3.1042 89 75 84 Pass3.1576 87 70 80 Pass3.2111 79 66 83 Pass3.2645 77 61 79 Pass3.3180 74 57 77 Pass3.3715 70 50 71 Pass3.4249 66 41 62 Pass3.4784 61 39 63 Pass3.5319 56 37 66 Pass3.5853 50 36 72 Pass3.6388 41 34 82 Pass3.6923 39 33 84 Pass3.7457 37 32 86 Pass3.7992 36 30 83 Pass3.8526 34 25 73 Pass3.9061 34 25 73 Pass3.9596 33 24 72 Pass4.0130 30 20 66 Pass4.0665 25 19 76 Pass4.1200 25 17 68 Pass4.1734 24 15 62 Pass4.2269 22 15 68 Pass4.2803 19 14 73 Pass4.3338 18 14 77 Pass4.3873 17 13 76 Pass
VE Full Facility 2/25/2015 5:35:50 PM Page 22
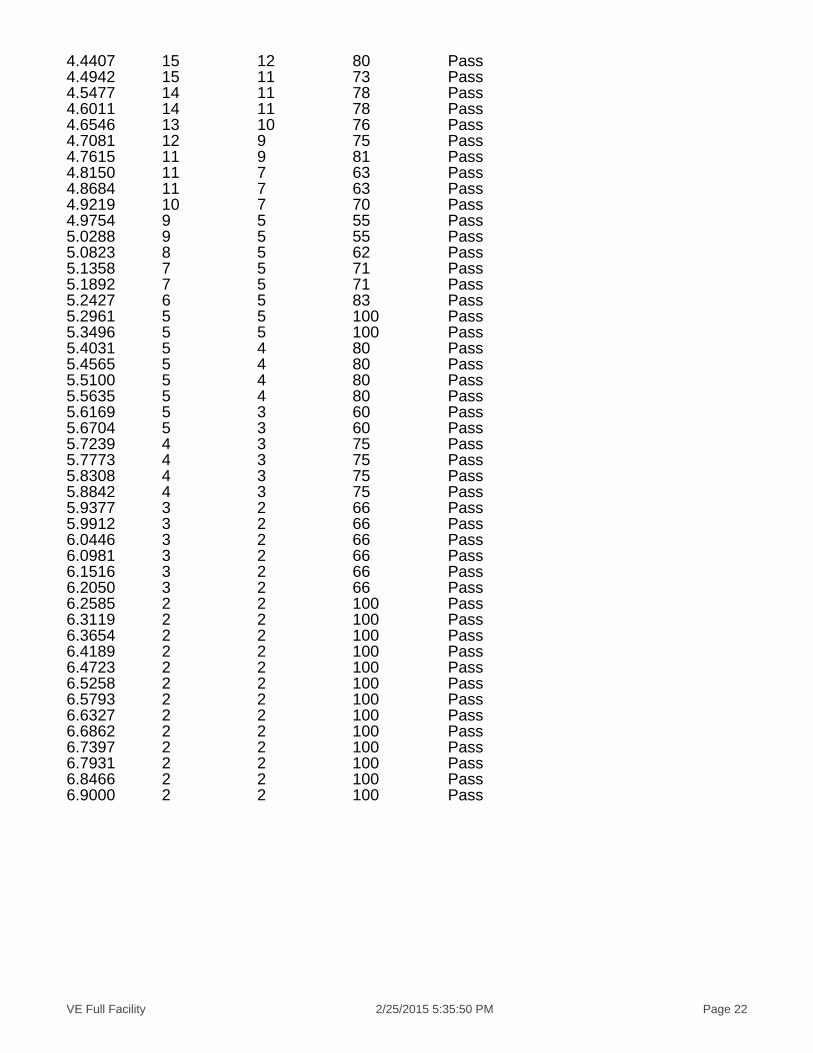
4.4407 15 12 80 Pass4.4942 15 11 73 Pass4.5477 14 11 78 Pass4.6011 14 11 78 Pass4.6546 13 10 76 Pass4.7081 12 9 75 Pass4.7615 11 9 81 Pass4.8150 11 7 63 Pass4.8684 11 7 63 Pass4.9219 10 7 70 Pass4.9754 9 5 55 Pass5.0288 9 5 55 Pass5.0823 8 5 62 Pass5.1358 7 5 71 Pass5.1892 7 5 71 Pass5.2427 6 5 83 Pass5.2961 5 5 100 Pass5.3496 5 5 100 Pass5.4031 5 4 80 Pass5.4565 5 4 80 Pass5.5100 5 4 80 Pass5.5635 5 4 80 Pass5.6169 5 3 60 Pass5.6704 5 3 60 Pass5.7239 4 3 75 Pass5.7773 4 3 75 Pass5.8308 4 3 75 Pass5.8842 4 3 75 Pass5.9377 3 2 66 Pass5.9912 3 2 66 Pass6.0446 3 2 66 Pass6.0981 3 2 66 Pass6.1516 3 2 66 Pass6.2050 3 2 66 Pass6.2585 2 2 100 Pass6.3119 2 2 100 Pass6.3654 2 2 100 Pass6.4189 2 2 100 Pass6.4723 2 2 100 Pass6.5258 2 2 100 Pass6.5793 2 2 100 Pass6.6327 2 2 100 Pass6.6862 2 2 100 Pass6.7397 2 2 100 Pass6.7931 2 2 100 Pass6.8466 2 2 100 Pass6.9000 2 2 100 Pass

VE Full Facility 2/25/2015 5:35:50 PM Page 23
Water QualityWater Quality BMP Flow and Volume for POC #1On-line facility volume: 0.1433 acre-feetOn-line facility target flow: 0.2046 cfs.Adjusted for 15 min: 0.2046 cfs.Off-line facility target flow: 0.1152 cfs.Adjusted for 15 min: 0.1152 cfs.

VE Full Facility 2/25/2015 5:35:50 PM Page 24
LID Report
VE Full Facility 2/25/2015 5:35:53 PM Page 25
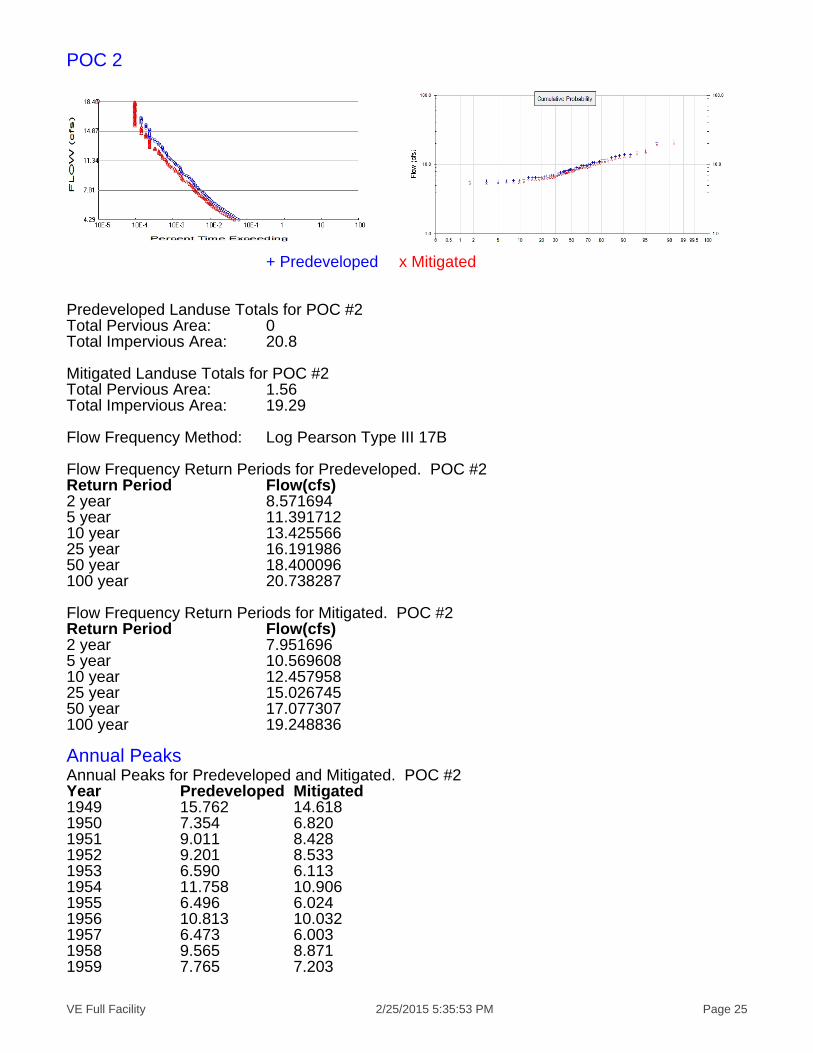
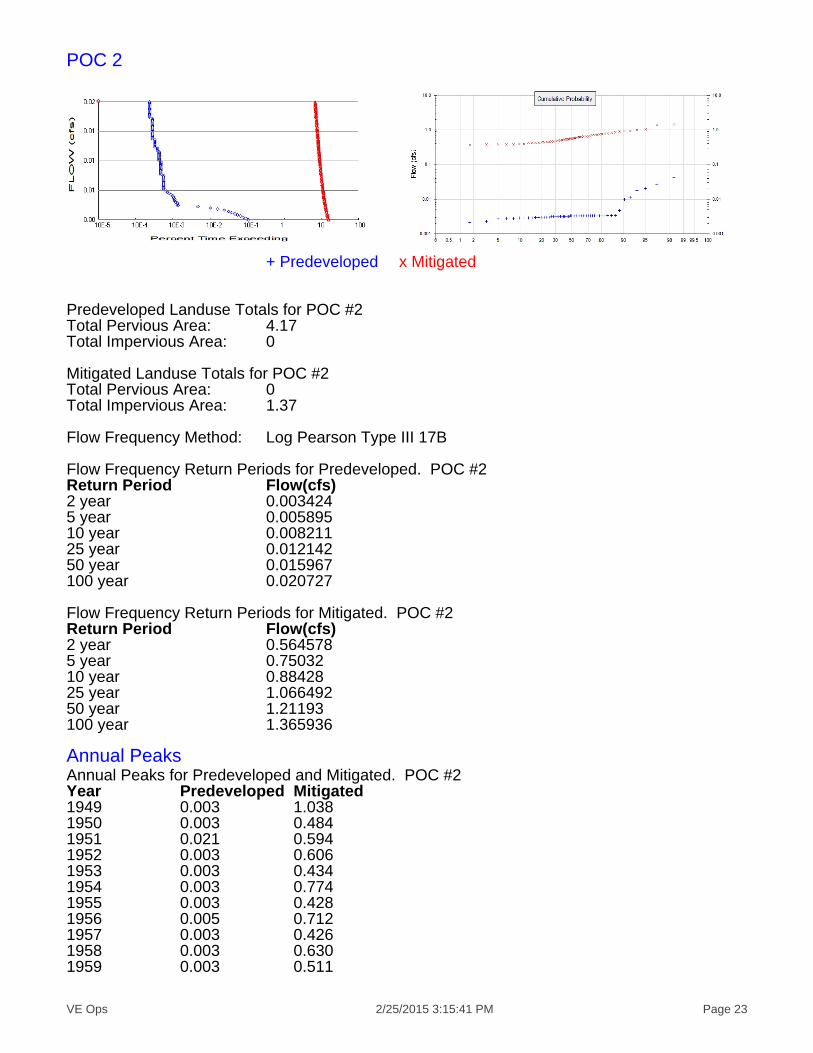
POC 2
+ Predeveloped x Mitigated
Predeveloped Landuse Totals for POC #2Total Pervious Area: 0Total Impervious Area: 20.8
Mitigated Landuse Totals for POC #2Total Pervious Area: 1.56Total Impervious Area: 19.29
Flow Frequency Method: Log Pearson Type III 17B
Flow Frequency Return Periods for Predeveloped. POC #2Return Period Flow(cfs)2 year 8.5716945 year 11.39171210 year 13.42556625 year 16.19198650 year 18.400096100 year 20.738287
Flow Frequency Return Periods for Mitigated. POC #2Return Period Flow(cfs)2 year 7.9516965 year 10.56960810 year 12.45795825 year 15.02674550 year 17.077307100 year 19.248836
Annual PeaksAnnual Peaks for Predeveloped and Mitigated. POC #2Year Predeveloped Mitigated1949 15.762 14.6181950 7.354 6.8201951 9.011 8.4281952 9.201 8.5331953 6.590 6.1131954 11.758 10.9061955 6.496 6.0241956 10.813 10.0321957 6.473 6.0031958 9.565 8.8711959 7.765 7.203
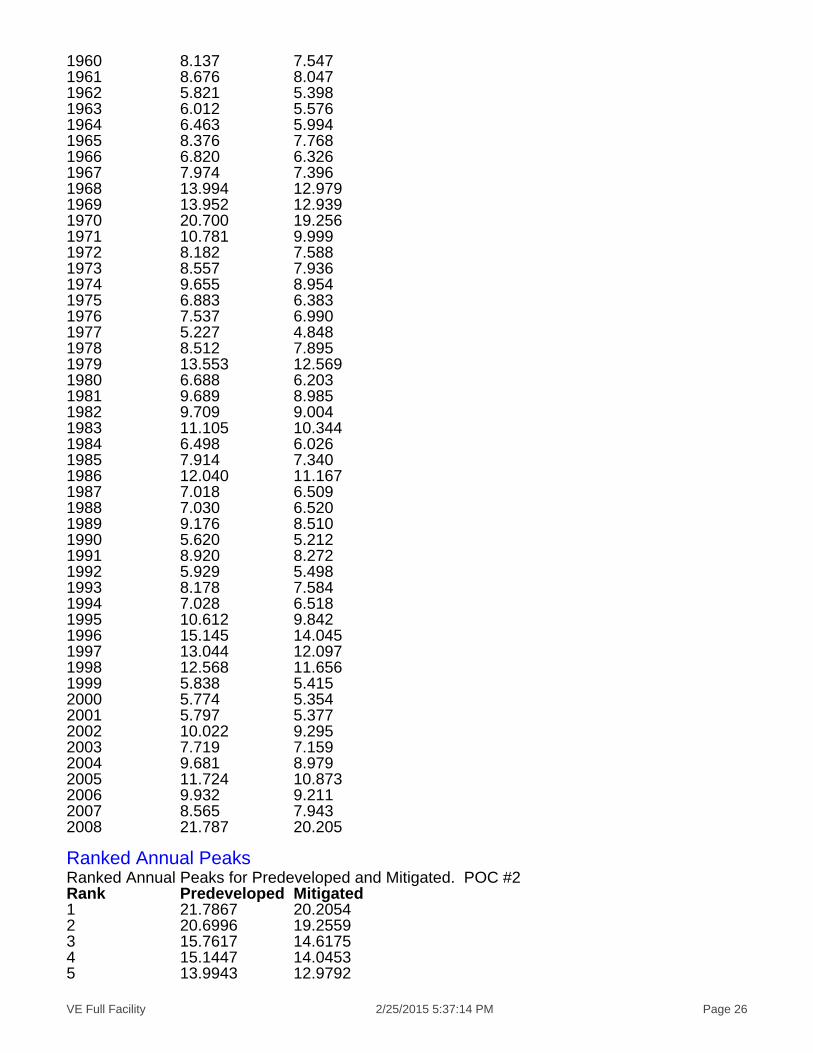
VE Full Facility 2/25/2015 5:37:14 PM Page 26
1960 8.137 7.5471961 8.676 8.0471962 5.821 5.3981963 6.012 5.5761964 6.463 5.9941965 8.376 7.7681966 6.820 6.3261967 7.974 7.3961968 13.994 12.9791969 13.952 12.9391970 20.700 19.2561971 10.781 9.9991972 8.182 7.5881973 8.557 7.9361974 9.655 8.9541975 6.883 6.3831976 7.537 6.9901977 5.227 4.8481978 8.512 7.8951979 13.553 12.5691980 6.688 6.2031981 9.689 8.9851982 9.709 9.0041983 11.105 10.3441984 6.498 6.0261985 7.914 7.3401986 12.040 11.1671987 7.018 6.5091988 7.030 6.5201989 9.176 8.5101990 5.620 5.2121991 8.920 8.2721992 5.929 5.4981993 8.178 7.5841994 7.028 6.5181995 10.612 9.8421996 15.145 14.0451997 13.044 12.0971998 12.568 11.6561999 5.838 5.4152000 5.774 5.3542001 5.797 5.3772002 10.022 9.2952003 7.719 7.1592004 9.681 8.9792005 11.724 10.8732006 9.932 9.2112007 8.565 7.9432008 21.787 20.205
Ranked Annual PeaksRanked Annual Peaks for Predeveloped and Mitigated. POC #2Rank Predeveloped Mitigated1 21.7867 20.20542 20.6996 19.25593 15.7617 14.61754 15.1447 14.04535 13.9943 12.9792

VE Full Facility 2/25/2015 5:37:14 PM Page 27
6 13.9516 12.93887 13.5531 12.56938 13.0439 12.09719 12.5683 11.655910 12.0404 11.166811 11.7583 10.905812 11.7240 10.873213 11.1051 10.344414 10.8132 10.032015 10.7811 9.998616 10.6115 9.841717 10.0221 9.294618 9.9323 9.211419 9.7086 9.004320 9.6886 8.985321 9.6813 8.979022 9.6550 8.954123 9.5651 8.870824 9.2006 8.532725 9.1761 8.510026 9.0113 8.427727 8.9196 8.272128 8.6765 8.046629 8.5648 7.943030 8.5572 7.936131 8.5124 7.894532 8.3765 7.768433 8.1822 7.588334 8.1776 7.584035 8.1373 7.546536 7.9745 7.395637 7.9141 7.340238 7.7653 7.202739 7.7194 7.159240 7.5369 6.989841 7.3538 6.820042 7.0297 6.520143 7.0277 6.518344 7.0183 6.508845 6.8831 6.383446 6.8197 6.325647 6.6883 6.202848 6.5903 6.113149 6.4976 6.025950 6.4959 6.024451 6.4730 6.003152 6.4627 5.993753 6.0120 5.576154 5.9287 5.498355 5.8385 5.414856 5.8208 5.398357 5.7972 5.377458 5.7736 5.354559 5.6201 5.212260 5.2269 4.8477
VE Full Facility 2/25/2015 5:37:14 PM Page 28
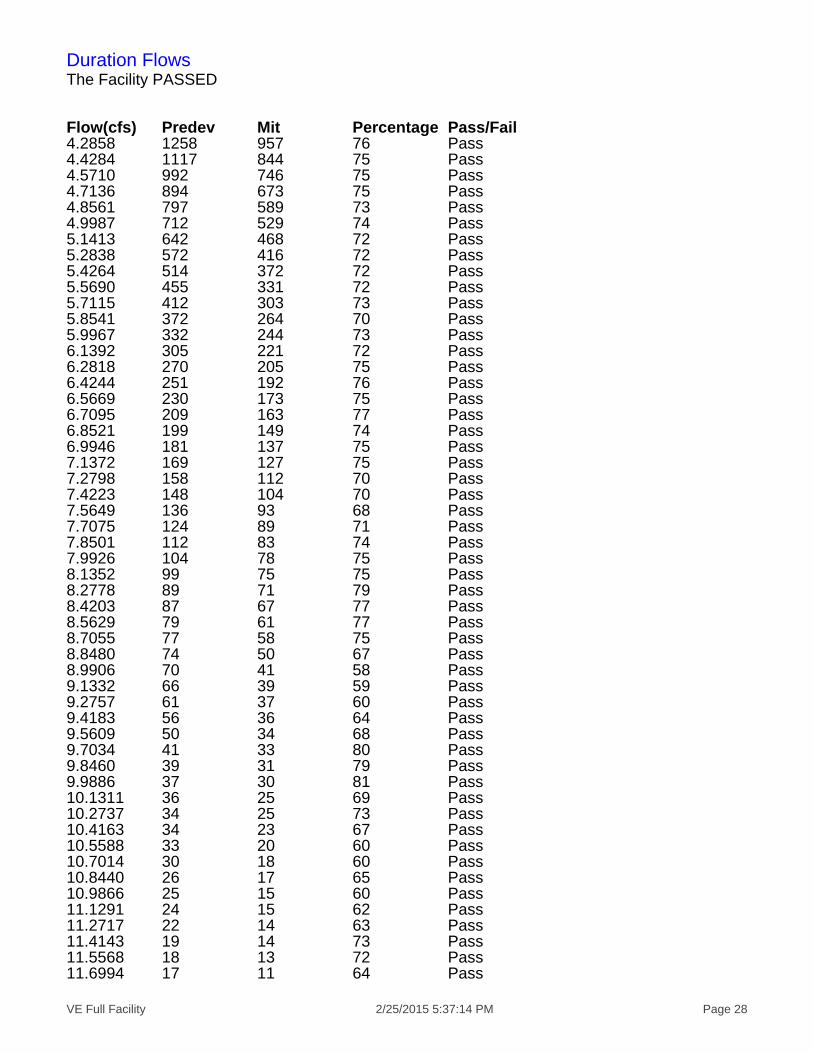
Duration FlowsThe Facility PASSED
Flow(cfs) Predev Mit Percentage Pass/Fail4.2858 1258 957 76 Pass4.4284 1117 844 75 Pass4.5710 992 746 75 Pass4.7136 894 673 75 Pass4.8561 797 589 73 Pass4.9987 712 529 74 Pass5.1413 642 468 72 Pass5.2838 572 416 72 Pass5.4264 514 372 72 Pass5.5690 455 331 72 Pass5.7115 412 303 73 Pass5.8541 372 264 70 Pass5.9967 332 244 73 Pass6.1392 305 221 72 Pass6.2818 270 205 75 Pass6.4244 251 192 76 Pass6.5669 230 173 75 Pass6.7095 209 163 77 Pass6.8521 199 149 74 Pass6.9946 181 137 75 Pass7.1372 169 127 75 Pass7.2798 158 112 70 Pass7.4223 148 104 70 Pass7.5649 136 93 68 Pass7.7075 124 89 71 Pass7.8501 112 83 74 Pass7.9926 104 78 75 Pass8.1352 99 75 75 Pass8.2778 89 71 79 Pass8.4203 87 67 77 Pass8.5629 79 61 77 Pass8.7055 77 58 75 Pass8.8480 74 50 67 Pass8.9906 70 41 58 Pass9.1332 66 39 59 Pass9.2757 61 37 60 Pass9.4183 56 36 64 Pass9.5609 50 34 68 Pass9.7034 41 33 80 Pass9.8460 39 31 79 Pass9.9886 37 30 81 Pass10.1311 36 25 69 Pass10.2737 34 25 73 Pass10.4163 34 23 67 Pass10.5588 33 20 60 Pass10.7014 30 18 60 Pass10.8440 26 17 65 Pass10.9866 25 15 60 Pass11.1291 24 15 62 Pass11.2717 22 14 63 Pass11.4143 19 14 73 Pass11.5568 18 13 72 Pass11.6994 17 11 64 Pass

VE Full Facility 2/25/2015 5:37:14 PM Page 29
11.8420 15 11 73 Pass11.9845 15 11 73 Pass12.1271 14 10 71 Pass12.2697 14 9 64 Pass12.4122 13 9 69 Pass12.5548 12 9 75 Pass12.6974 11 7 63 Pass12.8399 11 7 63 Pass12.9825 11 5 45 Pass13.1251 10 5 50 Pass13.2676 9 5 55 Pass13.4102 9 5 55 Pass13.5528 8 5 62 Pass13.6953 7 5 71 Pass13.8379 7 5 71 Pass13.9805 6 5 83 Pass14.1231 5 4 80 Pass14.2656 5 4 80 Pass14.4082 5 4 80 Pass14.5508 5 4 80 Pass14.6933 5 3 60 Pass14.8359 5 3 60 Pass14.9785 5 3 60 Pass15.1210 5 3 60 Pass15.2636 4 3 75 Pass15.4062 4 3 75 Pass15.5487 4 2 50 Pass15.6913 4 2 50 Pass15.8339 3 2 66 Pass15.9764 3 2 66 Pass16.1190 3 2 66 Pass16.2616 3 2 66 Pass16.4041 3 2 66 Pass16.5467 3 2 66 Pass16.6893 2 2 100 Pass16.8318 2 2 100 Pass16.9744 2 2 100 Pass17.1170 2 2 100 Pass17.2596 2 2 100 Pass17.4021 2 2 100 Pass17.5447 2 2 100 Pass17.6873 2 2 100 Pass17.8298 2 2 100 Pass17.9724 2 2 100 Pass18.1150 2 2 100 Pass18.2575 2 2 100 Pass18.4001 2 2 100 Pass

VE Full Facility 2/25/2015 5:37:14 PM Page 30
Water QualityWater Quality BMP Flow and Volume for POC #2On-line facility volume: 0.1545 acre-feetOn-line facility target flow: 0.2207 cfs.Adjusted for 15 min: 0.2207 cfs.Off-line facility target flow: 0.1243 cfs.Adjusted for 15 min: 0.1243 cfs.

VE Full Facility 2/25/2015 5:37:14 PM Page 31
LID Report

VE Full Facility 2/25/2015 5:37:14 PM Page 32
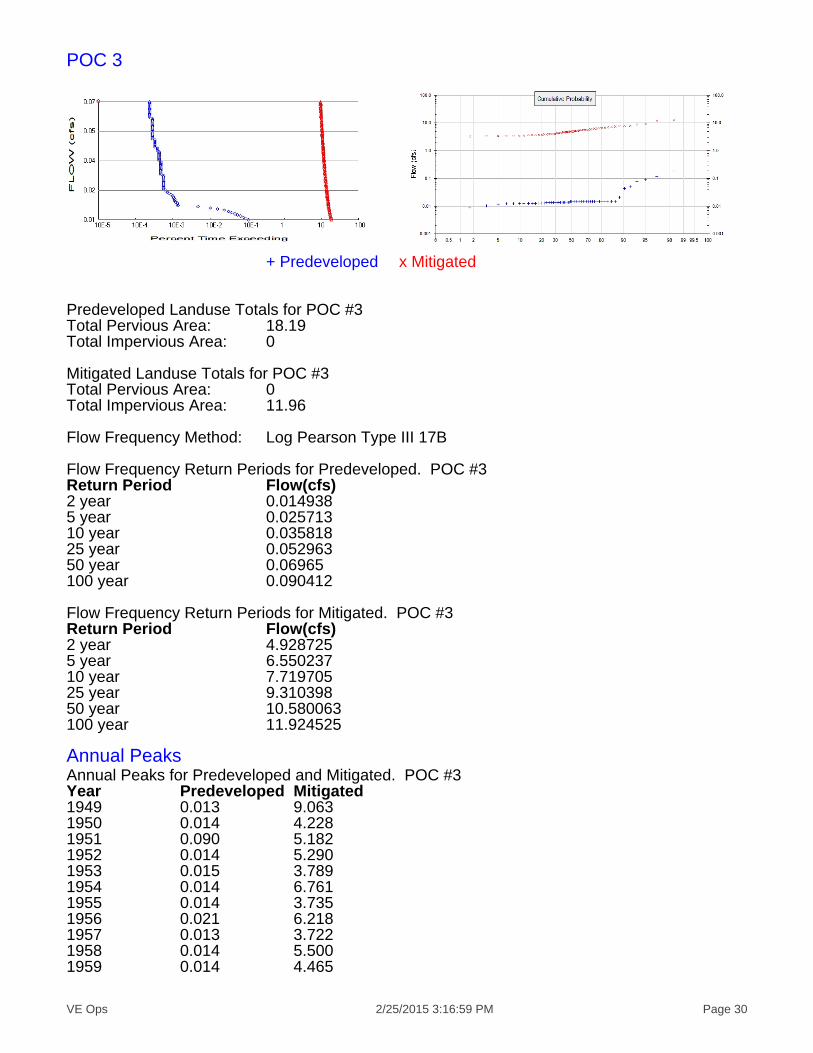
POC 3
+ Predeveloped x Mitigated
Predeveloped Landuse Totals for POC #3Total Pervious Area: 0.5Total Impervious Area: 1.8
Mitigated Landuse Totals for POC #3Total Pervious Area: 0.92Total Impervious Area: 1.15
Flow Frequency Method: Log Pearson Type III 17B
Flow Frequency Return Periods for Predeveloped. POC #3Return Period Flow(cfs)2 year 0.7425045 year 0.98739710 year 1.16410325 year 1.4045550 year 1.596536100 year 1.799887
Flow Frequency Return Periods for Mitigated. POC #3Return Period Flow(cfs)2 year 0.4752195 year 0.63276310 year 0.74655425 year 0.90151450 year 1.025329100 year 1.156546
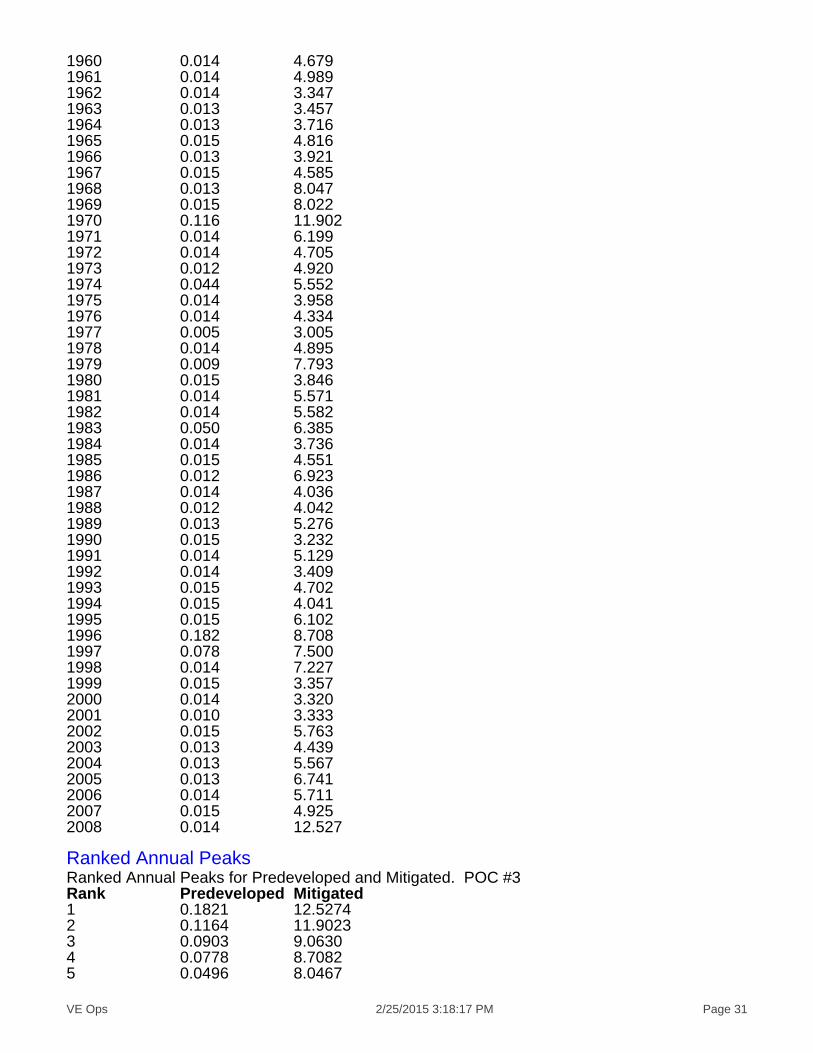
Annual PeaksAnnual Peaks for Predeveloped and Mitigated. POC #3Year Predeveloped Mitigated1949 1.364 0.8721950 0.636 0.4071951 0.802 0.5401952 0.796 0.5091953 0.571 0.3651954 1.018 0.6511955 0.562 0.3591956 0.937 0.6001957 0.560 0.3581958 0.828 0.5291959 0.672 0.430
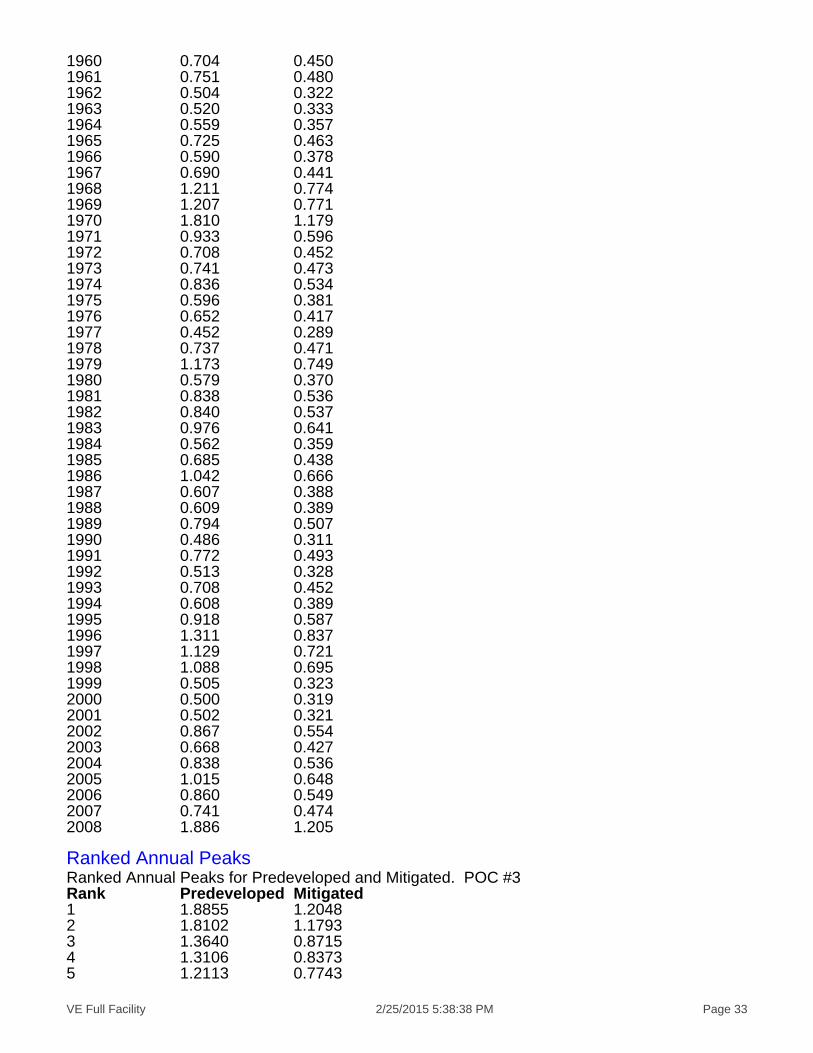
VE Full Facility 2/25/2015 5:38:38 PM Page 33
1960 0.704 0.4501961 0.751 0.4801962 0.504 0.3221963 0.520 0.3331964 0.559 0.3571965 0.725 0.4631966 0.590 0.3781967 0.690 0.4411968 1.211 0.7741969 1.207 0.7711970 1.810 1.1791971 0.933 0.5961972 0.708 0.4521973 0.741 0.4731974 0.836 0.5341975 0.596 0.3811976 0.652 0.4171977 0.452 0.2891978 0.737 0.4711979 1.173 0.7491980 0.579 0.3701981 0.838 0.5361982 0.840 0.5371983 0.976 0.6411984 0.562 0.3591985 0.685 0.4381986 1.042 0.6661987 0.607 0.3881988 0.609 0.3891989 0.794 0.5071990 0.486 0.3111991 0.772 0.4931992 0.513 0.3281993 0.708 0.4521994 0.608 0.3891995 0.918 0.5871996 1.311 0.8371997 1.129 0.7211998 1.088 0.6951999 0.505 0.3232000 0.500 0.3192001 0.502 0.3212002 0.867 0.5542003 0.668 0.4272004 0.838 0.5362005 1.015 0.6482006 0.860 0.5492007 0.741 0.4742008 1.886 1.205
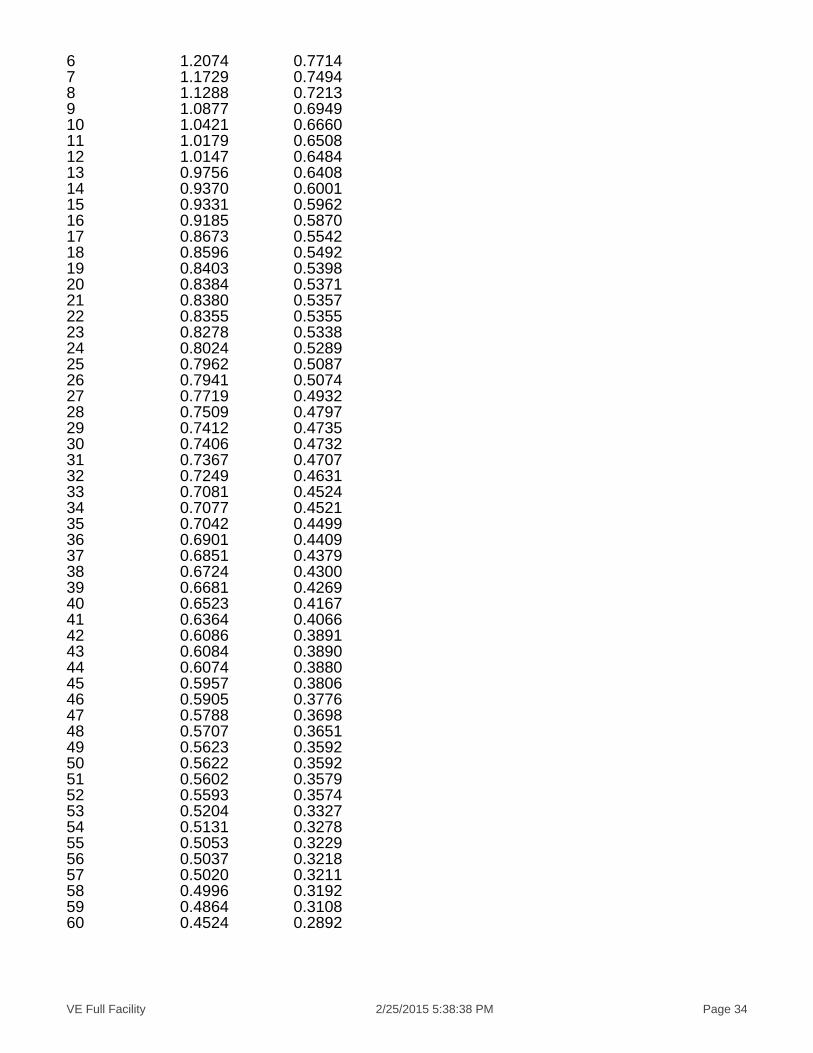
Ranked Annual PeaksRanked Annual Peaks for Predeveloped and Mitigated. POC #3Rank Predeveloped Mitigated1 1.8855 1.20482 1.8102 1.17933 1.3640 0.87154 1.3106 0.83735 1.2113 0.7743
VE Full Facility 2/25/2015 5:38:38 PM Page 34
6 1.2074 0.77147 1.1729 0.74948 1.1288 0.72139 1.0877 0.694910 1.0421 0.666011 1.0179 0.650812 1.0147 0.648413 0.9756 0.640814 0.9370 0.600115 0.9331 0.596216 0.9185 0.587017 0.8673 0.554218 0.8596 0.549219 0.8403 0.539820 0.8384 0.537121 0.8380 0.535722 0.8355 0.535523 0.8278 0.533824 0.8024 0.528925 0.7962 0.508726 0.7941 0.507427 0.7719 0.493228 0.7509 0.479729 0.7412 0.473530 0.7406 0.473231 0.7367 0.470732 0.7249 0.463133 0.7081 0.452434 0.7077 0.452135 0.7042 0.449936 0.6901 0.440937 0.6851 0.437938 0.6724 0.430039 0.6681 0.426940 0.6523 0.416741 0.6364 0.406642 0.6086 0.389143 0.6084 0.389044 0.6074 0.388045 0.5957 0.380646 0.5905 0.377647 0.5788 0.369848 0.5707 0.365149 0.5623 0.359250 0.5622 0.359251 0.5602 0.357952 0.5593 0.357453 0.5204 0.332754 0.5131 0.327855 0.5053 0.322956 0.5037 0.321857 0.5020 0.321158 0.4996 0.319259 0.4864 0.310860 0.4524 0.2892
VE Full Facility 2/25/2015 5:38:38 PM Page 35
Duration FlowsThe Facility PASSED
Flow(cfs) Predev Mit Percentage Pass/Fail0.3713 1259 211 16 Pass0.3836 1120 192 17 Pass0.3960 989 169 17 Pass0.4084 894 152 17 Pass0.4208 800 135 16 Pass0.4331 711 114 16 Pass0.4455 643 102 15 Pass0.4579 573 89 15 Pass0.4703 513 84 16 Pass0.4826 454 77 16 Pass0.4950 410 70 17 Pass0.5074 371 66 17 Pass0.5198 332 59 17 Pass0.5321 304 50 16 Pass0.5445 269 39 14 Pass0.5569 251 36 14 Pass0.5693 230 36 15 Pass0.5817 211 33 15 Pass0.5940 198 30 15 Pass0.6064 180 25 13 Pass0.6188 169 25 14 Pass0.6312 158 20 12 Pass0.6435 147 17 11 Pass0.6559 136 15 11 Pass0.6683 124 14 11 Pass0.6807 111 14 12 Pass0.6930 104 12 11 Pass0.7054 95 11 11 Pass0.7178 89 11 12 Pass0.7302 86 10 11 Pass0.7426 78 9 11 Pass0.7549 77 7 9 Pass0.7673 74 7 9 Pass0.7797 70 5 7 Pass0.7921 67 5 7 Pass0.8044 60 5 8 Pass0.8168 57 5 8 Pass0.8292 48 5 10 Pass0.8416 39 4 10 Pass0.8539 39 4 10 Pass0.8663 37 4 10 Pass0.8787 36 3 8 Pass0.8911 35 3 8 Pass0.9034 33 3 9 Pass0.9158 32 3 9 Pass0.9282 30 3 10 Pass0.9406 25 3 12 Pass0.9530 25 3 12 Pass0.9653 25 3 12 Pass0.9777 21 3 14 Pass0.9901 19 2 10 Pass1.0025 18 2 11 Pass1.0148 17 2 11 Pass
VE Full Facility 2/25/2015 5:38:38 PM Page 36
1.0272 15 2 13 Pass1.0396 15 2 13 Pass1.0520 14 2 14 Pass1.0643 14 2 14 Pass1.0767 13 2 15 Pass1.0891 11 2 18 Pass1.1015 11 2 18 Pass1.1138 11 2 18 Pass1.1262 11 2 18 Pass1.1386 10 2 20 Pass1.1510 9 2 22 Pass1.1634 9 2 22 Pass1.1757 7 2 28 Pass1.1881 7 1 14 Pass1.2005 7 1 14 Pass1.2129 5 0 0 Pass1.2252 5 0 0 Pass1.2376 5 0 0 Pass1.2500 5 0 0 Pass1.2624 5 0 0 Pass1.2747 5 0 0 Pass1.2871 5 0 0 Pass1.2995 5 0 0 Pass1.3119 4 0 0 Pass1.3243 4 0 0 Pass1.3366 4 0 0 Pass1.3490 4 0 0 Pass1.3614 4 0 0 Pass1.3738 3 0 0 Pass1.3861 3 0 0 Pass1.3985 3 0 0 Pass1.4109 3 0 0 Pass1.4233 3 0 0 Pass1.4356 3 0 0 Pass1.4480 3 0 0 Pass1.4604 3 0 0 Pass1.4728 2 0 0 Pass1.4851 2 0 0 Pass1.4975 2 0 0 Pass1.5099 2 0 0 Pass1.5223 2 0 0 Pass1.5347 2 0 0 Pass1.5470 2 0 0 Pass1.5594 2 0 0 Pass1.5718 2 0 0 Pass1.5842 2 0 0 Pass1.5965 2 0 0 Pass
VE Full Facility 2/25/2015 5:38:38 PM Page 37
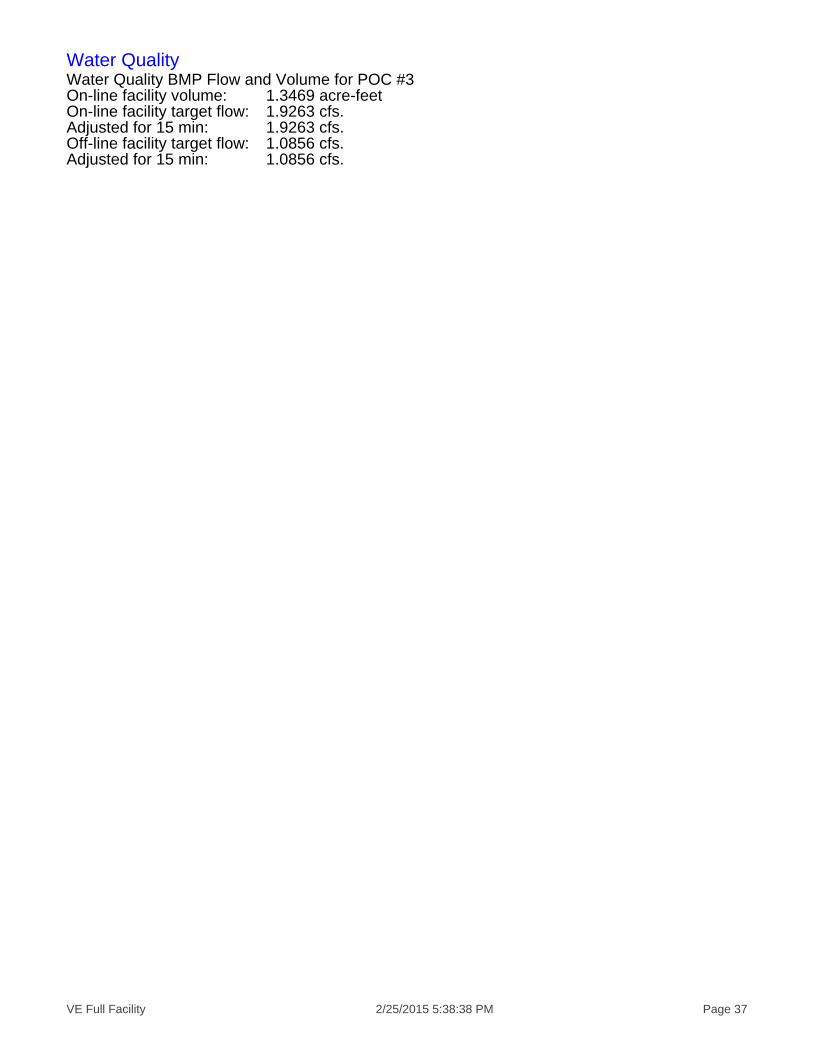
Water QualityWater Quality BMP Flow and Volume for POC #3On-line facility volume: 1.3469 acre-feetOn-line facility target flow: 1.9263 cfs.Adjusted for 15 min: 1.9263 cfs.Off-line facility target flow: 1.0856 cfs.Adjusted for 15 min: 1.0856 cfs.

VE Full Facility 2/25/2015 5:38:38 PM Page 38
LID Report

VE Full Facility 2/25/2015 5:38:38 PM Page 39
POC 4
+ Predeveloped x Mitigated
Predeveloped Landuse Totals for POC #4Total Pervious Area: 1.5Total Impervious Area: 2.4
Mitigated Landuse Totals for POC #4Total Pervious Area: 0Total Impervious Area: 4.89
Flow Frequency Method: Log Pearson Type III 17B
Flow Frequency Return Periods for Predeveloped. POC #4Return Period Flow(cfs)2 year 0.9911815 year 1.31919310 year 1.55602825 year 1.8784650 year 2.136026100 year 2.408937
Flow Frequency Return Periods for Mitigated. POC #4Return Period Flow(cfs)2 year 2.0151725 year 2.67814810 year 3.156325 year 3.80667550 year 4.325794100 year 4.875495
Annual PeaksAnnual Peaks for Predeveloped and Mitigated. POC #4Year Predeveloped Mitigated1949 1.819 3.7061950 0.849 1.7291951 1.108 2.1191952 1.062 2.1631953 0.762 1.5491954 1.358 2.7641955 0.750 1.5271956 1.251 2.5421957 0.747 1.5221958 1.104 2.2491959 0.897 1.826

VE Full Facility 2/25/2015 5:40:00 PM Page 40
1960 0.939 1.9131961 1.001 2.0401962 0.672 1.3681963 0.694 1.4131964 0.746 1.5191965 0.967 1.9691966 0.788 1.6031967 0.920 1.8751968 1.616 3.2901969 1.610 3.2801970 2.445 4.8661971 1.244 2.5351972 0.944 1.9241973 0.988 2.0121974 1.114 2.2701975 0.794 1.6181976 0.870 1.7721977 0.603 1.2291978 0.982 2.0011979 1.564 3.1861980 0.772 1.5721981 1.118 2.2781982 1.121 2.2821983 1.325 2.6111984 0.750 1.5281985 0.914 1.8611986 1.390 2.8311987 0.810 1.6501988 0.812 1.6531989 1.059 2.1571990 0.649 1.3211991 1.029 2.0971992 0.684 1.3941993 0.944 1.9231994 0.812 1.6521995 1.225 2.4951996 1.747 3.5601997 1.505 3.0671998 1.450 2.9551999 0.674 1.3732000 0.666 1.3572001 0.670 1.3632002 1.156 2.3562003 0.891 1.8152004 1.118 2.2762005 1.353 2.7562006 1.146 2.3352007 0.988 2.0142008 2.514 5.122
Ranked Annual PeaksRanked Annual Peaks for Predeveloped and Mitigated. POC #4Rank Predeveloped Mitigated1 2.5142 5.12202 2.4452 4.86643 1.8188 3.70554 1.7475 3.56055 1.6156 3.2900

VE Full Facility 2/25/2015 5:40:00 PM Page 41
6 1.6098 3.28007 1.5639 3.18638 1.5052 3.06669 1.4502 2.954810 1.3897 2.830711 1.3578 2.764312 1.3531 2.756313 1.3251 2.610814 1.2513 2.542215 1.2442 2.534616 1.2250 2.494717 1.1565 2.356218 1.1462 2.335019 1.1207 2.282520 1.1180 2.277821 1.1175 2.276022 1.1141 2.269823 1.1076 2.248724 1.1037 2.163025 1.0616 2.157326 1.0589 2.118527 1.0292 2.097028 1.0011 2.039829 0.9883 2.013630 0.9875 2.011831 0.9822 2.001232 0.9665 1.969333 0.9442 1.923634 0.9436 1.922535 0.9389 1.913036 0.9201 1.874837 0.9138 1.860638 0.8971 1.825639 0.8908 1.814840 0.8697 1.771941 0.8486 1.728942 0.8118 1.652743 0.8116 1.652244 0.8098 1.650045 0.7942 1.618246 0.7878 1.603347 0.7717 1.572448 0.7616 1.549449 0.7497 1.527650 0.7496 1.527251 0.7469 1.521852 0.7459 1.519453 0.6942 1.413454 0.6841 1.393855 0.6739 1.372656 0.6716 1.368557 0.6699 1.362958 0.6662 1.357459 0.6486 1.321360 0.6034 1.2288
VE Full Facility 2/25/2015 5:40:00 PM Page 42
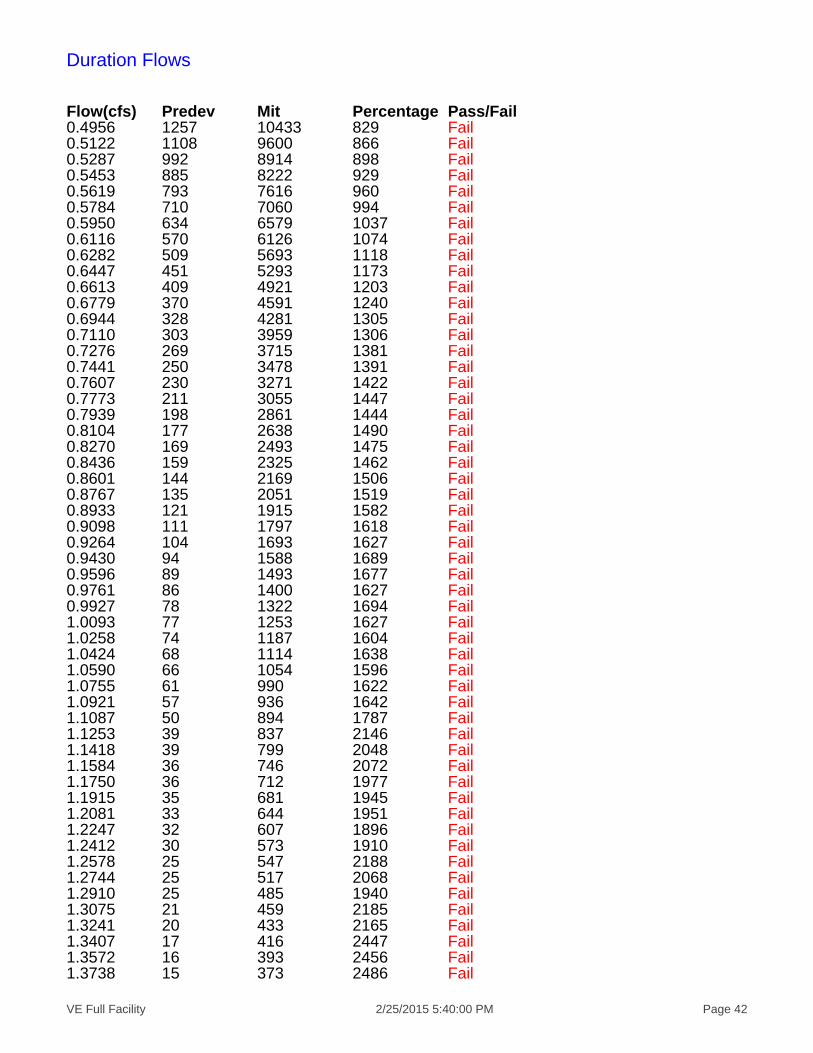
Duration Flows
Flow(cfs) Predev Mit Percentage Pass/Fail0.4956 1257 10433 829 Fail0.5122 1108 9600 866 Fail0.5287 992 8914 898 Fail0.5453 885 8222 929 Fail0.5619 793 7616 960 Fail0.5784 710 7060 994 Fail0.5950 634 6579 1037 Fail0.6116 570 6126 1074 Fail0.6282 509 5693 1118 Fail0.6447 451 5293 1173 Fail0.6613 409 4921 1203 Fail0.6779 370 4591 1240 Fail0.6944 328 4281 1305 Fail0.7110 303 3959 1306 Fail0.7276 269 3715 1381 Fail0.7441 250 3478 1391 Fail0.7607 230 3271 1422 Fail0.7773 211 3055 1447 Fail0.7939 198 2861 1444 Fail0.8104 177 2638 1490 Fail0.8270 169 2493 1475 Fail0.8436 159 2325 1462 Fail0.8601 144 2169 1506 Fail0.8767 135 2051 1519 Fail0.8933 121 1915 1582 Fail0.9098 111 1797 1618 Fail0.9264 104 1693 1627 Fail0.9430 94 1588 1689 Fail0.9596 89 1493 1677 Fail0.9761 86 1400 1627 Fail0.9927 78 1322 1694 Fail1.0093 77 1253 1627 Fail1.0258 74 1187 1604 Fail1.0424 68 1114 1638 Fail1.0590 66 1054 1596 Fail1.0755 61 990 1622 Fail1.0921 57 936 1642 Fail1.1087 50 894 1787 Fail1.1253 39 837 2146 Fail1.1418 39 799 2048 Fail1.1584 36 746 2072 Fail1.1750 36 712 1977 Fail1.1915 35 681 1945 Fail1.2081 33 644 1951 Fail1.2247 32 607 1896 Fail1.2412 30 573 1910 Fail1.2578 25 547 2188 Fail1.2744 25 517 2068 Fail1.2910 25 485 1940 Fail1.3075 21 459 2185 Fail1.3241 20 433 2165 Fail1.3407 17 416 2447 Fail1.3572 16 393 2456 Fail1.3738 15 373 2486 Fail

VE Full Facility 2/25/2015 5:40:00 PM Page 43
1.3904 14 348 2485 Fail1.4069 14 333 2378 Fail1.4235 14 320 2285 Fail1.4401 13 307 2361 Fail1.4567 11 293 2663 Fail1.4732 11 272 2472 Fail1.4898 11 260 2363 Fail1.5064 10 251 2510 Fail1.5229 10 242 2420 Fail1.5395 9 230 2555 Fail1.5561 9 221 2455 Fail1.5726 7 213 3042 Fail1.5892 7 206 2942 Fail1.6058 7 199 2842 Fail1.6224 5 195 3900 Fail1.6389 5 186 3720 Fail1.6555 5 174 3480 Fail1.6721 5 170 3400 Fail1.6886 5 166 3320 Fail1.7052 5 160 3200 Fail1.7218 5 156 3120 Fail1.7383 5 149 2980 Fail1.7549 4 141 3525 Fail1.7715 4 139 3475 Fail1.7881 4 133 3325 Fail1.8046 4 129 3225 Fail1.8212 3 120 4000 Fail1.8378 3 116 3866 Fail1.8543 3 109 3633 Fail1.8709 3 105 3500 Fail1.8875 3 104 3466 Fail1.9040 3 100 3333 Fail1.9206 3 92 3066 Fail1.9372 3 89 2966 Fail1.9538 3 89 2966 Fail1.9703 3 88 2933 Fail1.9869 3 85 2833 Fail2.0035 3 81 2700 Fail2.0200 2 78 3900 Fail2.0366 2 78 3900 Fail2.0532 2 77 3850 Fail2.0697 2 75 3750 Fail2.0863 2 74 3700 Fail2.1029 2 70 3500 Fail2.1195 2 68 3400 Fail2.1360 2 66 3300 Fail
The development has an increase in flow durationsfrom 1/2 Predeveloped 2 year flow to the 2 year flowor more than a 10% increase from the 2 year to the 50year flow.The development has an increase in flow durations formore than 50% of the flows for the range of theduration analysis.

VE Full Facility 2/25/2015 5:40:00 PM Page 44
Water QualityWater Quality BMP Flow and Volume for POC #4On-line facility volume: 1.4917 acre-feetOn-line facility target flow: 2.1329 cfs.Adjusted for 15 min: 2.1329 cfs.Off-line facility target flow: 1.2019 cfs.Adjusted for 15 min: 1.2019 cfs.

VE Full Facility 2/25/2015 5:40:00 PM Page 45
LID Report
VE Full Facility 2/25/2015 5:40:01 PM Page 46
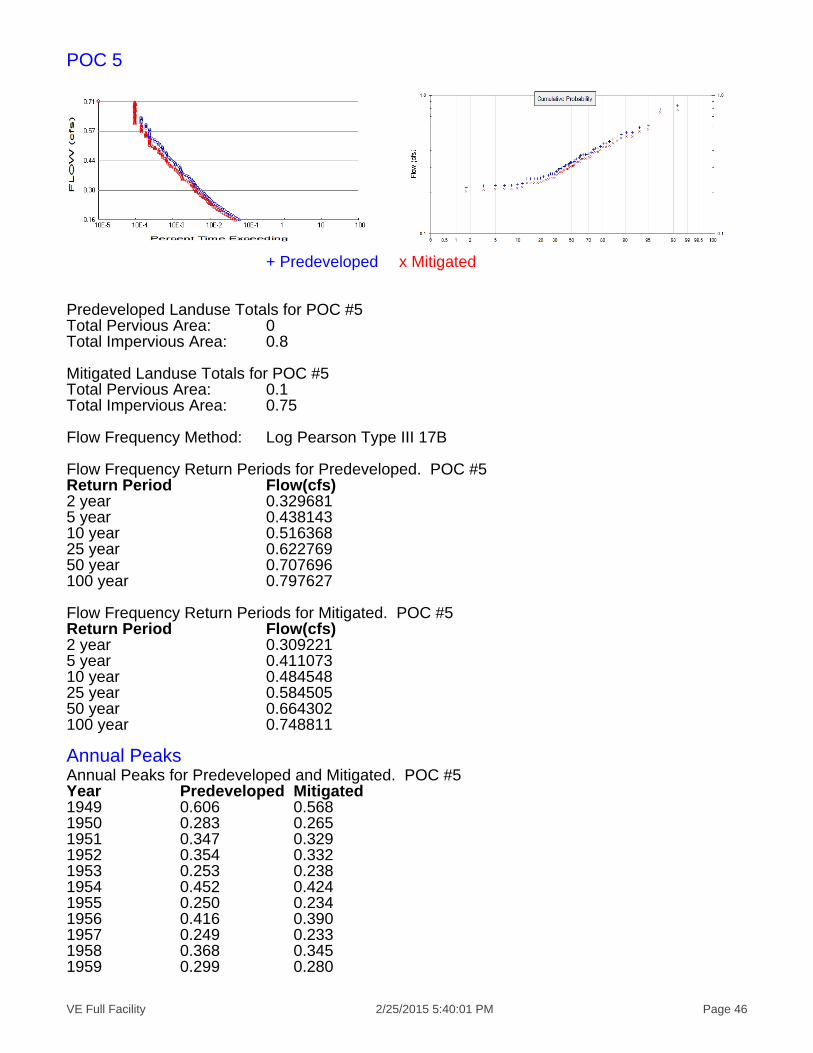
POC 5
+ Predeveloped x Mitigated
Predeveloped Landuse Totals for POC #5Total Pervious Area: 0Total Impervious Area: 0.8
Mitigated Landuse Totals for POC #5Total Pervious Area: 0.1Total Impervious Area: 0.75
Flow Frequency Method: Log Pearson Type III 17B
Flow Frequency Return Periods for Predeveloped. POC #5Return Period Flow(cfs)2 year 0.3296815 year 0.43814310 year 0.51636825 year 0.62276950 year 0.707696100 year 0.797627
Flow Frequency Return Periods for Mitigated. POC #5Return Period Flow(cfs)2 year 0.3092215 year 0.41107310 year 0.48454825 year 0.58450550 year 0.664302100 year 0.748811
Annual PeaksAnnual Peaks for Predeveloped and Mitigated. POC #5Year Predeveloped Mitigated1949 0.606 0.5681950 0.283 0.2651951 0.347 0.3291952 0.354 0.3321953 0.253 0.2381954 0.452 0.4241955 0.250 0.2341956 0.416 0.3901957 0.249 0.2331958 0.368 0.3451959 0.299 0.280

VE Full Facility 2/25/2015 5:41:23 PM Page 47
1960 0.313 0.2931961 0.334 0.3131962 0.224 0.2101963 0.231 0.2171964 0.249 0.2331965 0.322 0.3021966 0.262 0.2461967 0.307 0.2881968 0.538 0.5051969 0.537 0.5031970 0.796 0.7501971 0.415 0.3891972 0.315 0.2951973 0.329 0.3091974 0.371 0.3481975 0.265 0.2481976 0.290 0.2721977 0.201 0.1881978 0.327 0.3071979 0.521 0.4891980 0.257 0.2411981 0.373 0.3491982 0.373 0.3501983 0.427 0.4031984 0.250 0.2341985 0.304 0.2851986 0.463 0.4341987 0.270 0.2531988 0.270 0.2541989 0.353 0.3311990 0.216 0.2031991 0.343 0.3221992 0.228 0.2141993 0.315 0.2951994 0.270 0.2531995 0.408 0.3831996 0.582 0.5461997 0.502 0.4701998 0.483 0.4531999 0.225 0.2112000 0.222 0.2082001 0.223 0.2092002 0.385 0.3612003 0.297 0.2782004 0.372 0.3492005 0.451 0.4232006 0.382 0.3582007 0.329 0.3092008 0.838 0.786
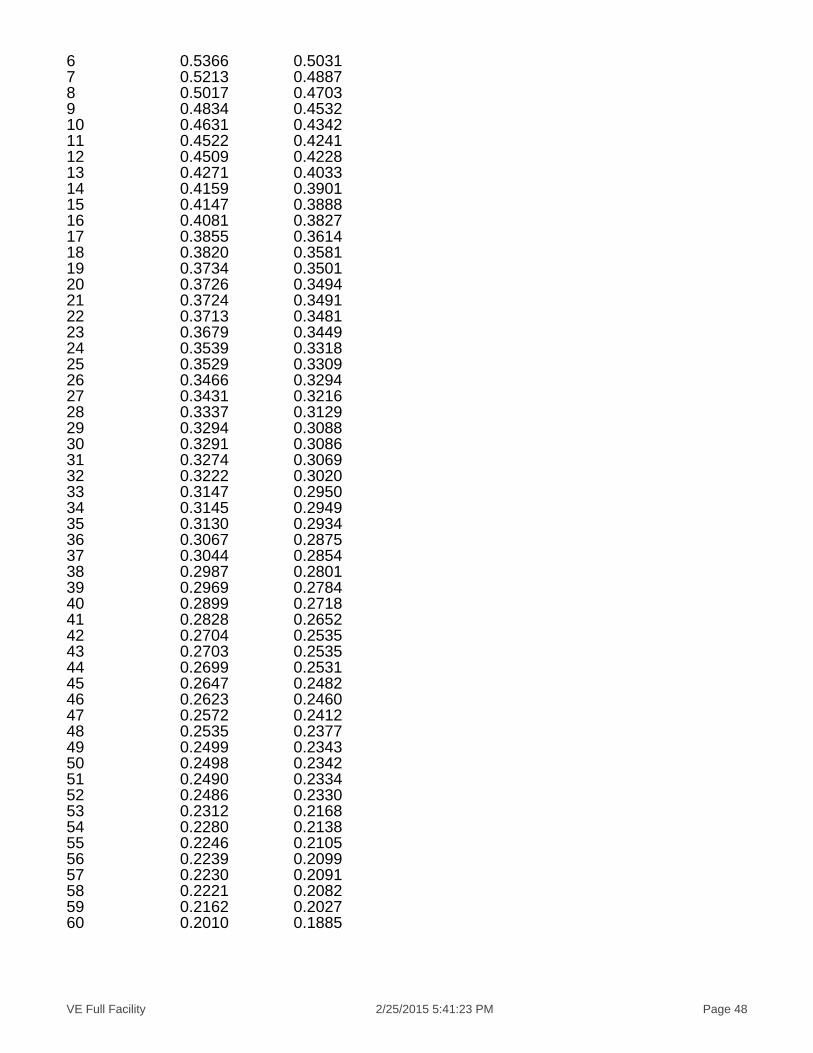
Ranked Annual PeaksRanked Annual Peaks for Predeveloped and Mitigated. POC #5Rank Predeveloped Mitigated1 0.8380 0.78562 0.7961 0.75023 0.6062 0.56834 0.5825 0.54615 0.5382 0.5047
VE Full Facility 2/25/2015 5:41:23 PM Page 48
6 0.5366 0.50317 0.5213 0.48878 0.5017 0.47039 0.4834 0.453210 0.4631 0.434211 0.4522 0.424112 0.4509 0.422813 0.4271 0.403314 0.4159 0.390115 0.4147 0.388816 0.4081 0.382717 0.3855 0.361418 0.3820 0.358119 0.3734 0.350120 0.3726 0.349421 0.3724 0.349122 0.3713 0.348123 0.3679 0.344924 0.3539 0.331825 0.3529 0.330926 0.3466 0.329427 0.3431 0.321628 0.3337 0.312929 0.3294 0.308830 0.3291 0.308631 0.3274 0.306932 0.3222 0.302033 0.3147 0.295034 0.3145 0.294935 0.3130 0.293436 0.3067 0.287537 0.3044 0.285438 0.2987 0.280139 0.2969 0.278440 0.2899 0.271841 0.2828 0.265242 0.2704 0.253543 0.2703 0.253544 0.2699 0.253145 0.2647 0.248246 0.2623 0.246047 0.2572 0.241248 0.2535 0.237749 0.2499 0.234350 0.2498 0.234251 0.2490 0.233452 0.2486 0.233053 0.2312 0.216854 0.2280 0.213855 0.2246 0.210556 0.2239 0.209957 0.2230 0.209158 0.2221 0.208259 0.2162 0.202760 0.2010 0.1885
VE Full Facility 2/25/2015 5:41:23 PM Page 49
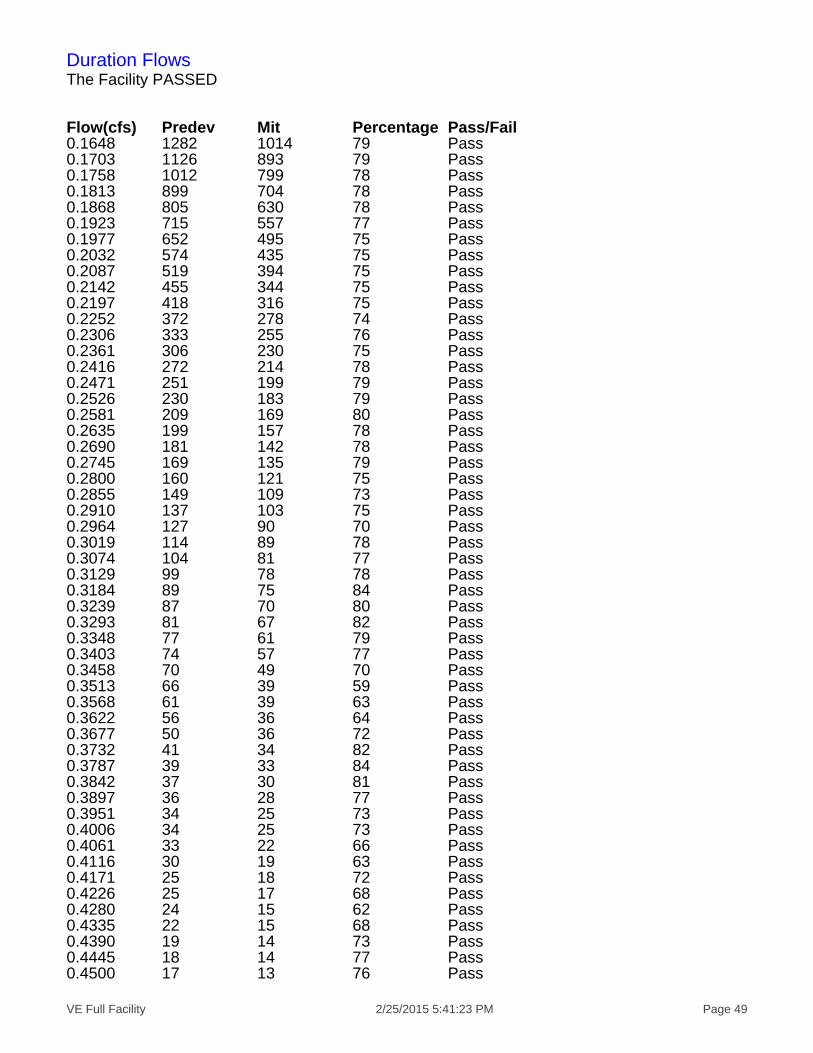
Duration FlowsThe Facility PASSED
Flow(cfs) Predev Mit Percentage Pass/Fail0.1648 1282 1014 79 Pass0.1703 1126 893 79 Pass0.1758 1012 799 78 Pass0.1813 899 704 78 Pass0.1868 805 630 78 Pass0.1923 715 557 77 Pass0.1977 652 495 75 Pass0.2032 574 435 75 Pass0.2087 519 394 75 Pass0.2142 455 344 75 Pass0.2197 418 316 75 Pass0.2252 372 278 74 Pass0.2306 333 255 76 Pass0.2361 306 230 75 Pass0.2416 272 214 78 Pass0.2471 251 199 79 Pass0.2526 230 183 79 Pass0.2581 209 169 80 Pass0.2635 199 157 78 Pass0.2690 181 142 78 Pass0.2745 169 135 79 Pass0.2800 160 121 75 Pass0.2855 149 109 73 Pass0.2910 137 103 75 Pass0.2964 127 90 70 Pass0.3019 114 89 78 Pass0.3074 104 81 77 Pass0.3129 99 78 78 Pass0.3184 89 75 84 Pass0.3239 87 70 80 Pass0.3293 81 67 82 Pass0.3348 77 61 79 Pass0.3403 74 57 77 Pass0.3458 70 49 70 Pass0.3513 66 39 59 Pass0.3568 61 39 63 Pass0.3622 56 36 64 Pass0.3677 50 36 72 Pass0.3732 41 34 82 Pass0.3787 39 33 84 Pass0.3842 37 30 81 Pass0.3897 36 28 77 Pass0.3951 34 25 73 Pass0.4006 34 25 73 Pass0.4061 33 22 66 Pass0.4116 30 19 63 Pass0.4171 25 18 72 Pass0.4226 25 17 68 Pass0.4280 24 15 62 Pass0.4335 22 15 68 Pass0.4390 19 14 73 Pass0.4445 18 14 77 Pass0.4500 17 13 76 Pass
VE Full Facility 2/25/2015 5:41:23 PM Page 50
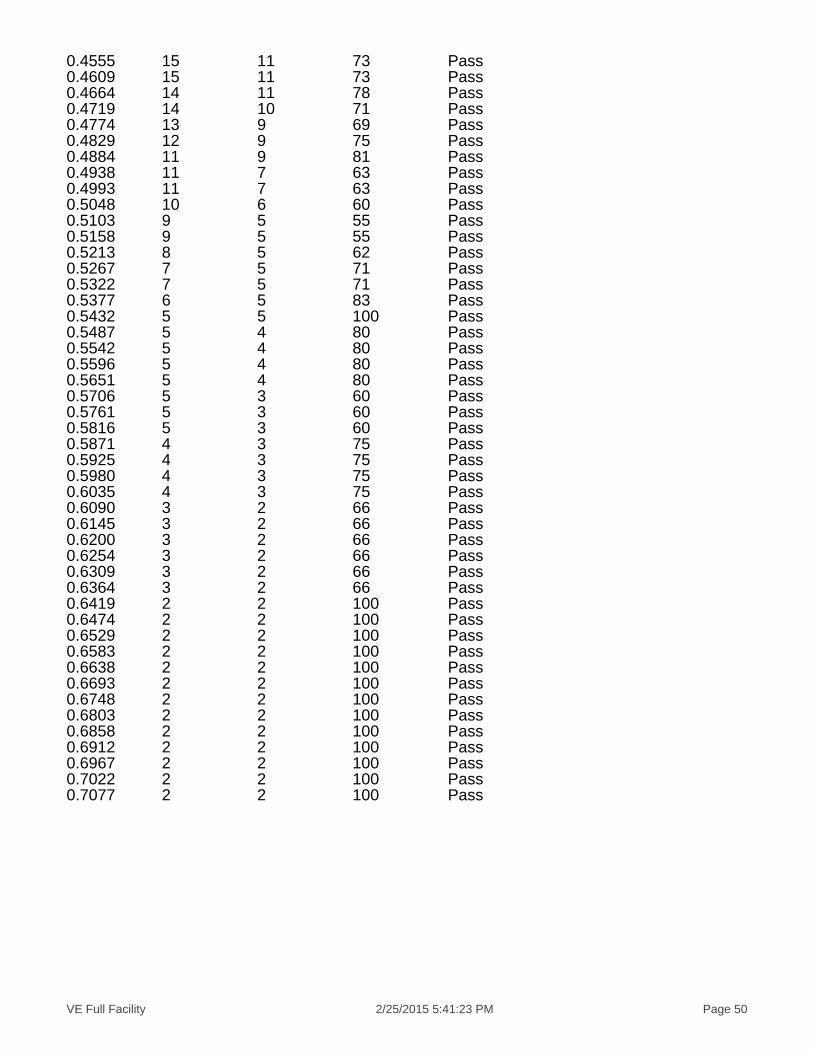
0.4555 15 11 73 Pass0.4609 15 11 73 Pass0.4664 14 11 78 Pass0.4719 14 10 71 Pass0.4774 13 9 69 Pass0.4829 12 9 75 Pass0.4884 11 9 81 Pass0.4938 11 7 63 Pass0.4993 11 7 63 Pass0.5048 10 6 60 Pass0.5103 9 5 55 Pass0.5158 9 5 55 Pass0.5213 8 5 62 Pass0.5267 7 5 71 Pass0.5322 7 5 71 Pass0.5377 6 5 83 Pass0.5432 5 5 100 Pass0.5487 5 4 80 Pass0.5542 5 4 80 Pass0.5596 5 4 80 Pass0.5651 5 4 80 Pass0.5706 5 3 60 Pass0.5761 5 3 60 Pass0.5816 5 3 60 Pass0.5871 4 3 75 Pass0.5925 4 3 75 Pass0.5980 4 3 75 Pass0.6035 4 3 75 Pass0.6090 3 2 66 Pass0.6145 3 2 66 Pass0.6200 3 2 66 Pass0.6254 3 2 66 Pass0.6309 3 2 66 Pass0.6364 3 2 66 Pass0.6419 2 2 100 Pass0.6474 2 2 100 Pass0.6529 2 2 100 Pass0.6583 2 2 100 Pass0.6638 2 2 100 Pass0.6693 2 2 100 Pass0.6748 2 2 100 Pass0.6803 2 2 100 Pass0.6858 2 2 100 Pass0.6912 2 2 100 Pass0.6967 2 2 100 Pass0.7022 2 2 100 Pass0.7077 2 2 100 Pass

VE Full Facility 2/25/2015 5:41:23 PM Page 51
Water QualityWater Quality BMP Flow and Volume for POC #5On-line facility volume: 0.0172 acre-feetOn-line facility target flow: 0.0241 cfs.Adjusted for 15 min: 0.0241 cfs.Off-line facility target flow: 0.0136 cfs.Adjusted for 15 min: 0.0136 cfs.

VE Full Facility 2/25/2015 5:41:23 PM Page 52
LID Report
VE Full Facility 2/25/2015 5:41:23 PM Page 53
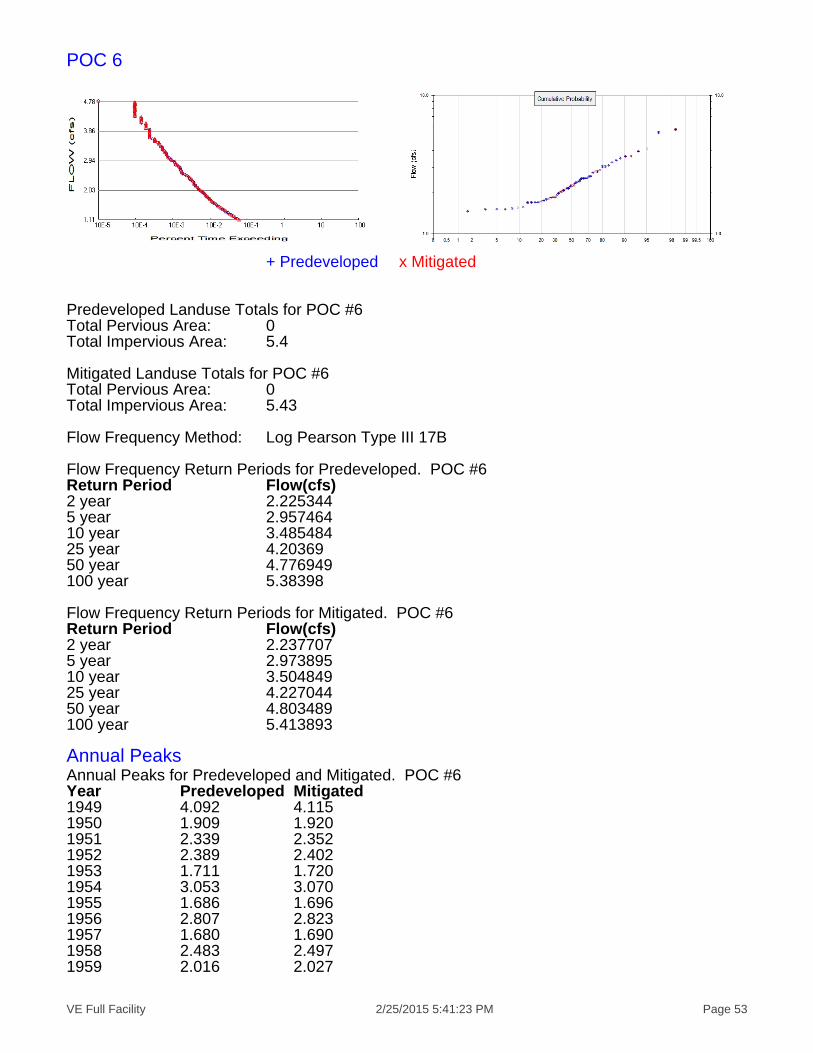
POC 6
+ Predeveloped x Mitigated
Predeveloped Landuse Totals for POC #6Total Pervious Area: 0Total Impervious Area: 5.4
Mitigated Landuse Totals for POC #6Total Pervious Area: 0Total Impervious Area: 5.43
Flow Frequency Method: Log Pearson Type III 17B
Flow Frequency Return Periods for Predeveloped. POC #6Return Period Flow(cfs)2 year 2.2253445 year 2.95746410 year 3.48548425 year 4.2036950 year 4.776949100 year 5.38398
Flow Frequency Return Periods for Mitigated. POC #6Return Period Flow(cfs)2 year 2.2377075 year 2.97389510 year 3.50484925 year 4.22704450 year 4.803489100 year 5.413893
Annual PeaksAnnual Peaks for Predeveloped and Mitigated. POC #6Year Predeveloped Mitigated1949 4.092 4.1151950 1.909 1.9201951 2.339 2.3521952 2.389 2.4021953 1.711 1.7201954 3.053 3.0701955 1.686 1.6961956 2.807 2.8231957 1.680 1.6901958 2.483 2.4971959 2.016 2.027

VE Full Facility 2/25/2015 5:42:45 PM Page 54
1960 2.113 2.1241961 2.253 2.2651962 1.511 1.5201963 1.561 1.5691964 1.678 1.6871965 2.175 2.1871966 1.771 1.7801967 2.070 2.0821968 3.633 3.6531969 3.622 3.6421970 5.374 5.4041971 2.799 2.8141972 2.124 2.1361973 2.222 2.2341974 2.507 2.5211975 1.787 1.7971976 1.957 1.9681977 1.357 1.3651978 2.210 2.2221979 3.519 3.5381980 1.736 1.7461981 2.515 2.5291982 2.521 2.5351983 2.883 2.8991984 1.687 1.6961985 2.055 2.0661986 3.126 3.1431987 1.822 1.8321988 1.825 1.8351989 2.382 2.3951990 1.459 1.4671991 2.316 2.3291992 1.539 1.5481993 2.123 2.1351994 1.825 1.8351995 2.755 2.7701996 3.932 3.9541997 3.386 3.4051998 3.263 3.2811999 1.516 1.5242000 1.499 1.5072001 1.505 1.5132002 2.602 2.6162003 2.004 2.0152004 2.513 2.5272005 3.044 3.0612006 2.579 2.5932007 2.224 2.2362008 5.656 5.688
Ranked Annual PeaksRanked Annual Peaks for Predeveloped and Mitigated. POC #6Rank Predeveloped Mitigated1 5.6562 5.68762 5.3739 5.40383 4.0920 4.11474 3.9318 3.95365 3.6331 3.6533

VE Full Facility 2/25/2015 5:42:45 PM Page 55
6 3.6221 3.64227 3.5186 3.53818 3.3864 3.40529 3.2629 3.281110 3.1259 3.143211 3.0526 3.069612 3.0437 3.060613 2.8831 2.899114 2.8073 2.822915 2.7989 2.814516 2.7549 2.770217 2.6019 2.616418 2.5786 2.592919 2.5205 2.534520 2.5153 2.529321 2.5134 2.527422 2.5066 2.520523 2.4833 2.497024 2.3886 2.401925 2.3823 2.395526 2.3395 2.352527 2.3157 2.328528 2.2525 2.265129 2.2236 2.235930 2.2216 2.233931 2.2100 2.222232 2.1747 2.186833 2.1242 2.136034 2.1230 2.134835 2.1126 2.124336 2.0703 2.081837 2.0546 2.066138 2.0160 2.027239 2.0041 2.015240 1.9567 1.967641 1.9092 1.919842 1.8250 1.835243 1.8245 1.834644 1.8221 1.832245 1.7870 1.796946 1.7705 1.780347 1.7364 1.746048 1.7109 1.720449 1.6869 1.696250 1.6864 1.695851 1.6805 1.689852 1.6778 1.687153 1.5608 1.569554 1.5392 1.547755 1.5158 1.524256 1.5112 1.519657 1.5050 1.513458 1.4989 1.507359 1.4591 1.467260 1.3570 1.3645
VE Full Facility 2/25/2015 5:42:45 PM Page 56
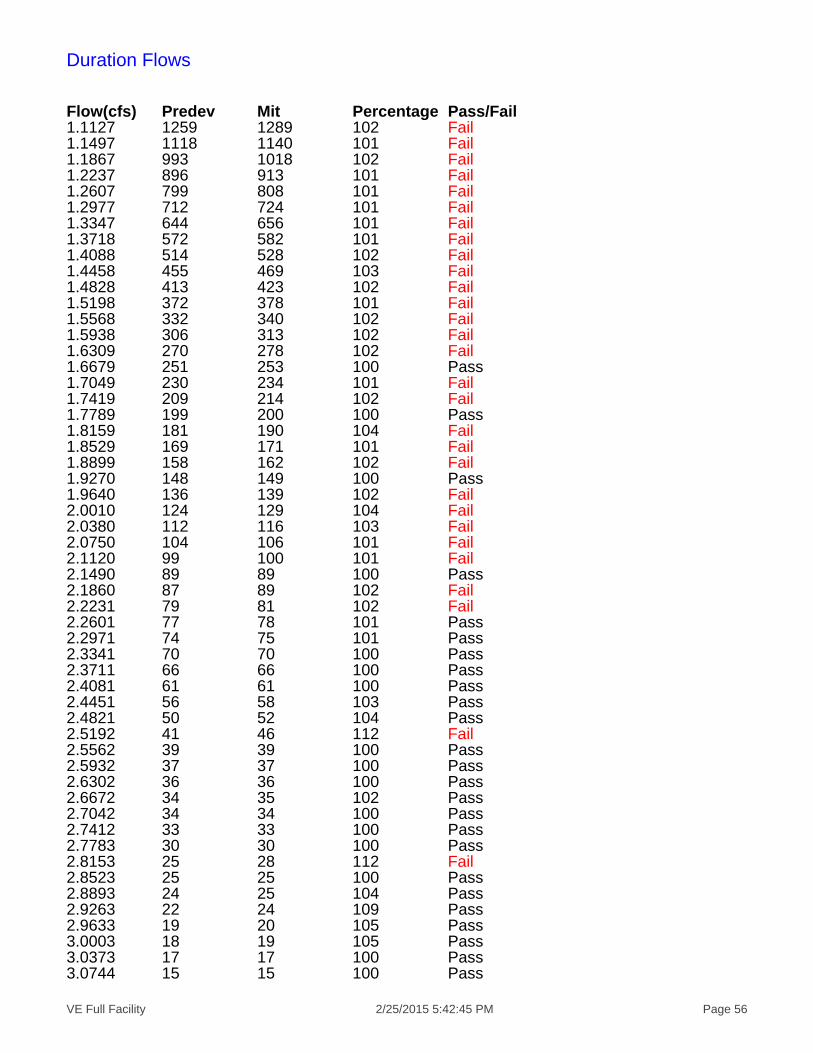
Duration Flows
Flow(cfs) Predev Mit Percentage Pass/Fail1.1127 1259 1289 102 Fail1.1497 1118 1140 101 Fail1.1867 993 1018 102 Fail1.2237 896 913 101 Fail1.2607 799 808 101 Fail1.2977 712 724 101 Fail1.3347 644 656 101 Fail1.3718 572 582 101 Fail1.4088 514 528 102 Fail1.4458 455 469 103 Fail1.4828 413 423 102 Fail1.5198 372 378 101 Fail1.5568 332 340 102 Fail1.5938 306 313 102 Fail1.6309 270 278 102 Fail1.6679 251 253 100 Pass1.7049 230 234 101 Fail1.7419 209 214 102 Fail1.7789 199 200 100 Pass1.8159 181 190 104 Fail1.8529 169 171 101 Fail1.8899 158 162 102 Fail1.9270 148 149 100 Pass1.9640 136 139 102 Fail2.0010 124 129 104 Fail2.0380 112 116 103 Fail2.0750 104 106 101 Fail2.1120 99 100 101 Fail2.1490 89 89 100 Pass2.1860 87 89 102 Fail2.2231 79 81 102 Fail2.2601 77 78 101 Pass2.2971 74 75 101 Pass2.3341 70 70 100 Pass2.3711 66 66 100 Pass2.4081 61 61 100 Pass2.4451 56 58 103 Pass2.4821 50 52 104 Pass2.5192 41 46 112 Fail2.5562 39 39 100 Pass2.5932 37 37 100 Pass2.6302 36 36 100 Pass2.6672 34 35 102 Pass2.7042 34 34 100 Pass2.7412 33 33 100 Pass2.7783 30 30 100 Pass2.8153 25 28 112 Fail2.8523 25 25 100 Pass2.8893 24 25 104 Pass2.9263 22 24 109 Pass2.9633 19 20 105 Pass3.0003 18 19 105 Pass3.0373 17 17 100 Pass3.0744 15 15 100 Pass

VE Full Facility 2/25/2015 5:42:45 PM Page 57
3.1114 15 15 100 Pass3.1484 14 14 100 Pass3.1854 14 14 100 Pass3.2224 13 13 100 Pass3.2594 12 13 108 Pass3.2964 11 11 100 Pass3.3334 11 11 100 Pass3.3705 11 11 100 Pass3.4075 10 10 100 Pass3.4445 9 10 111 Fail3.4815 9 9 100 Pass3.5185 8 9 112 Fail3.5555 7 7 100 Pass3.5925 7 7 100 Pass3.6295 6 7 116 Fail3.6666 5 5 100 Pass3.7036 5 5 100 Pass3.7406 5 5 100 Pass3.7776 5 5 100 Pass3.8146 5 5 100 Pass3.8516 5 5 100 Pass3.8886 5 5 100 Pass3.9257 5 5 100 Pass3.9627 4 4 100 Pass3.9997 4 4 100 Pass4.0367 4 4 100 Pass4.0737 4 4 100 Pass4.1107 3 4 133 Fail4.1477 3 3 100 Pass4.1847 3 3 100 Pass4.2218 3 3 100 Pass4.2588 3 3 100 Pass4.2958 3 3 100 Pass4.3328 2 2 100 Pass4.3698 2 2 100 Pass4.4068 2 2 100 Pass4.4438 2 2 100 Pass4.4808 2 2 100 Pass4.5179 2 2 100 Pass4.5549 2 2 100 Pass4.5919 2 2 100 Pass4.6289 2 2 100 Pass4.6659 2 2 100 Pass4.7029 2 2 100 Pass4.7399 2 2 100 Pass4.7769 2 2 100 Pass
The development has an increase in flow durationsfrom 1/2 Predeveloped 2 year flow to the 2 year flowor more than a 10% increase from the 2 year to the 50year flow.

VE Full Facility 2/25/2015 5:42:45 PM Page 58
Water QualityWater Quality BMP Flow and Volume for POC #6On-line facility volume: 0 acre-feetOn-line facility target flow: 0 cfs.Adjusted for 15 min: 0 cfs.Off-line facility target flow: 0 cfs.Adjusted for 15 min: 0 cfs.

VE Full Facility 2/25/2015 5:42:45 PM Page 59
LID Report
VE Full Facility 2/25/2015 5:42:45 PM Page 60
Model Default Modifications
Total of 0 changes have been made.
PERLND Changes No PERLND changes have been made.
IMPLND ChangesNo IMPLND changes have been made.
VE Full Facility 2/25/2015 5:42:45 PM Page 61
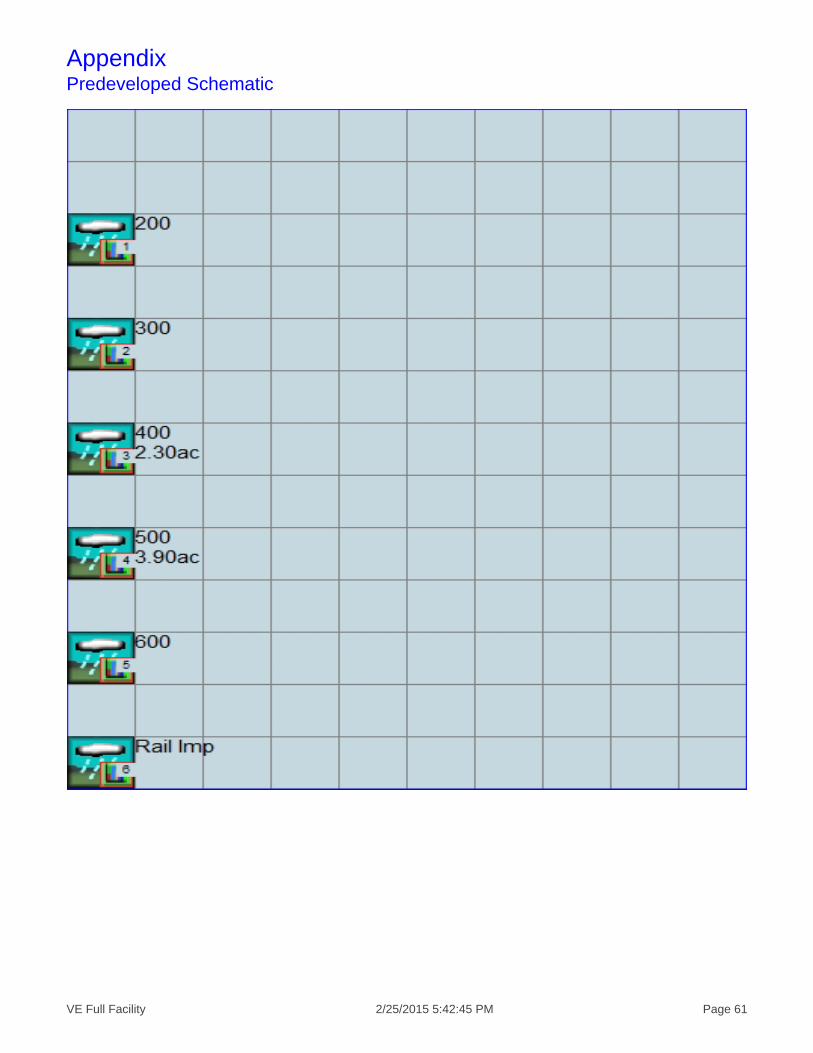
AppendixPredeveloped Schematic

VE Full Facility 2/25/2015 5:42:45 PM Page 62
Mitigated Schematic
VE Full Facility 2/25/2015 5:42:46 PM Page 63
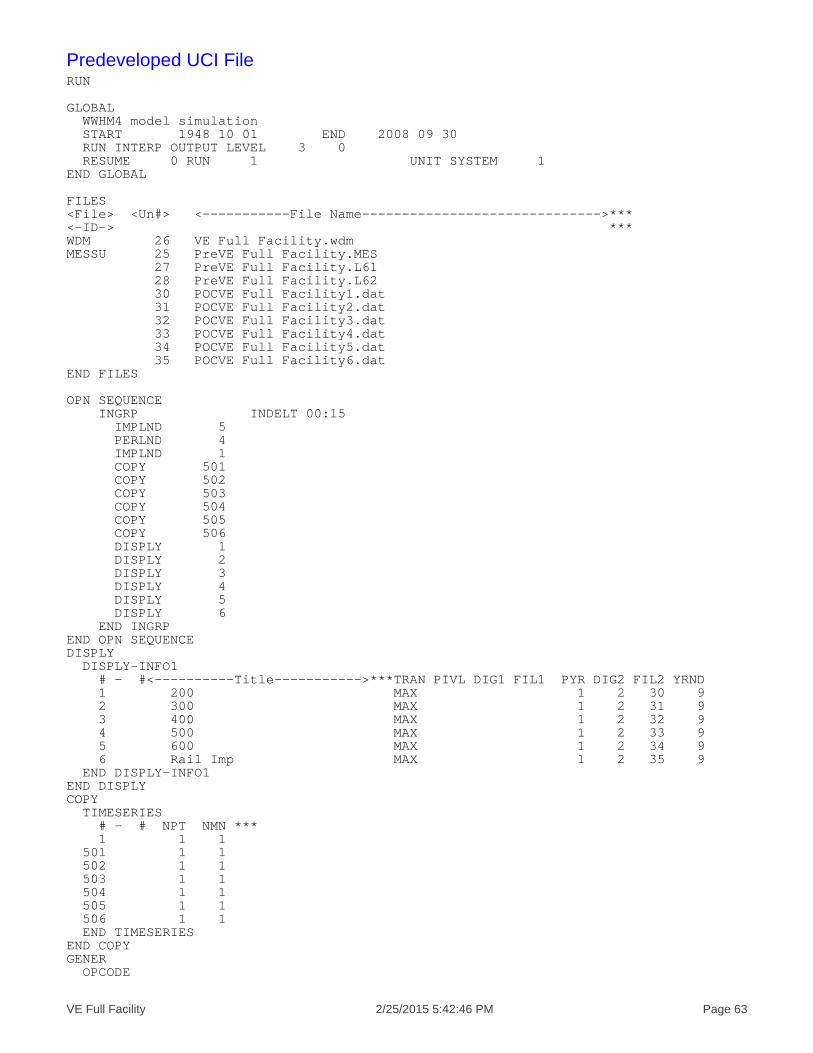
Predeveloped UCI FileRUN
GLOBAL WWHM4 model simulation START 1948 10 01 END 2008 09 30 RUN INTERP OUTPUT LEVEL 3 0 RESUME 0 RUN 1 UNIT SYSTEM 1END GLOBAL
FILES<File> <Un#> <-----------File Name------------------------------>***<-ID-> ***WDM 26 VE Full Facility.wdmMESSU 25 PreVE Full Facility.MES 27 PreVE Full Facility.L61 28 PreVE Full Facility.L62 30 POCVE Full Facility1.dat 31 POCVE Full Facility2.dat 32 POCVE Full Facility3.dat 33 POCVE Full Facility4.dat 34 POCVE Full Facility5.dat 35 POCVE Full Facility6.datEND FILES
OPN SEQUENCE INGRP INDELT 00:15 IMPLND 5 PERLND 4 IMPLND 1 COPY 501 COPY 502 COPY 503 COPY 504 COPY 505 COPY 506 DISPLY 1 DISPLY 2 DISPLY 3 DISPLY 4 DISPLY 5 DISPLY 6 END INGRPEND OPN SEQUENCEDISPLY DISPLY-INFO1 # - #<----------Title----------->***TRAN PIVL DIG1 FIL1 PYR DIG2 FIL2 YRND 1 200 MAX 1 2 30 9 2 300 MAX 1 2 31 9 3 400 MAX 1 2 32 9 4 500 MAX 1 2 33 9 5 600 MAX 1 2 34 9 6 Rail Imp MAX 1 2 35 9 END DISPLY-INFO1END DISPLYCOPY TIMESERIES # - # NPT NMN *** 1 1 1 501 1 1 502 1 1 503 1 1 504 1 1 505 1 1 506 1 1 END TIMESERIESEND COPYGENER OPCODE
VE Full Facility 2/25/2015 5:42:46 PM Page 64
# # OPCD *** END OPCODE PARM # # K *** END PARMEND GENERPERLND GEN-INFO <PLS ><-------Name------->NBLKS Unit-systems Printer *** # - # User t-series Engl Metr *** in out *** 4 A/B, Pasture, Flat 1 1 1 1 27 0 END GEN-INFO *** Section PWATER***
ACTIVITY <PLS > ************* Active Sections ***************************** # - # ATMP SNOW PWAT SED PST PWG PQAL MSTL PEST NITR PHOS TRAC *** 4 0 0 1 0 0 0 0 0 0 0 0 0 END ACTIVITY
PRINT-INFO <PLS > ***************** Print-flags ***************************** PIVL PYR # - # ATMP SNOW PWAT SED PST PWG PQAL MSTL PEST NITR PHOS TRAC ********* 4 0 0 4 0 0 0 0 0 0 0 0 0 1 9 END PRINT-INFO
PWAT-PARM1 <PLS > PWATER variable monthly parameter value flags *** # - # CSNO RTOP UZFG VCS VUZ VNN VIFW VIRC VLE INFC HWT *** 4 0 0 0 0 0 0 0 0 0 0 0 END PWAT-PARM1
PWAT-PARM2 <PLS > PWATER input info: Part 2 *** # - # ***FOREST LZSN INFILT LSUR SLSUR KVARY AGWRC 4 0 5 1.5 400 0.05 0.3 0.996 END PWAT-PARM2
PWAT-PARM3 <PLS > PWATER input info: Part 3 *** # - # ***PETMAX PETMIN INFEXP INFILD DEEPFR BASETP AGWETP 4 0 0 2 2 0 0 0 END PWAT-PARM3 PWAT-PARM4 <PLS > PWATER input info: Part 4 *** # - # CEPSC UZSN NSUR INTFW IRC LZETP *** 4 0.15 0.5 0.3 0 0.7 0.4 END PWAT-PARM4
PWAT-STATE1 <PLS > *** Initial conditions at start of simulation ran from 1990 to end of 1992 (pat 1-11-95) RUN 21 *** # - # *** CEPS SURS UZS IFWS LZS AGWS GWVS 4 0 0 0 0 3 1 0 END PWAT-STATE1
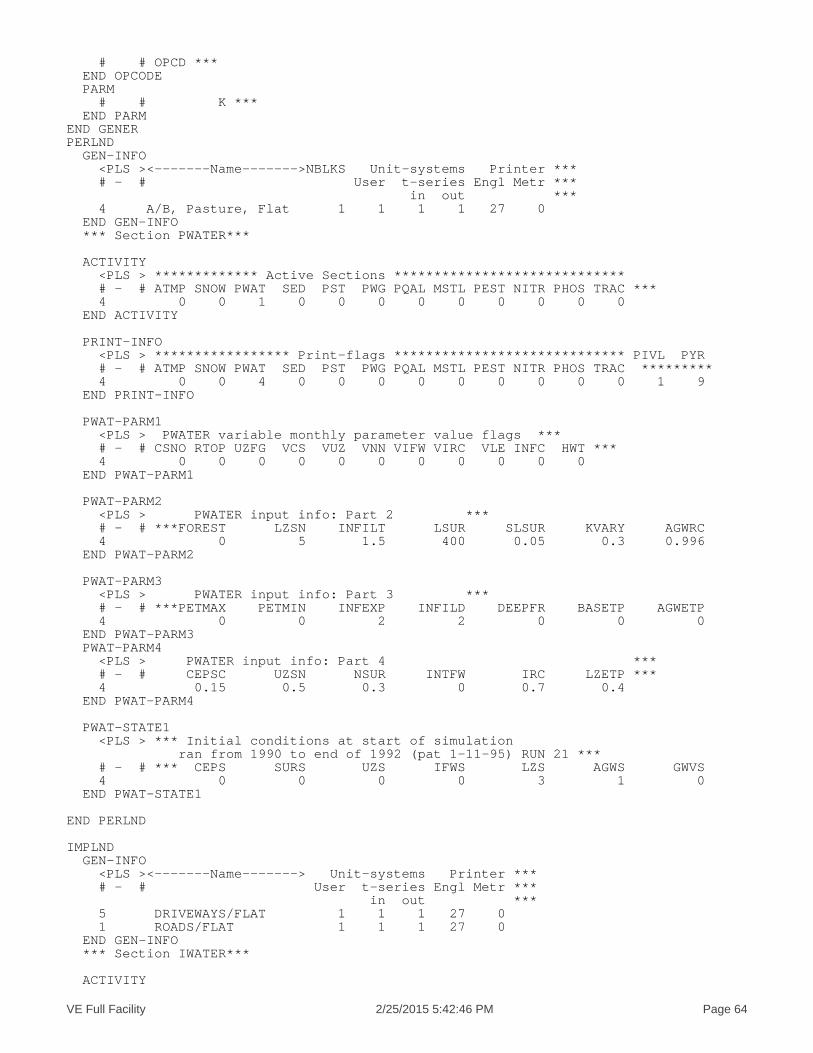
END PERLND
IMPLND GEN-INFO <PLS ><-------Name-------> Unit-systems Printer *** # - # User t-series Engl Metr *** in out *** 5 DRIVEWAYS/FLAT 1 1 1 27 0 1 ROADS/FLAT 1 1 1 27 0 END GEN-INFO *** Section IWATER***
ACTIVITY
VE Full Facility 2/25/2015 5:42:46 PM Page 65
<PLS > ************* Active Sections ***************************** # - # ATMP SNOW IWAT SLD IWG IQAL *** 5 0 0 1 0 0 0 1 0 0 1 0 0 0 END ACTIVITY
PRINT-INFO <ILS > ******** Print-flags ******** PIVL PYR # - # ATMP SNOW IWAT SLD IWG IQAL ********* 5 0 0 4 0 0 0 1 9 1 0 0 4 0 0 0 1 9 END PRINT-INFO
IWAT-PARM1 <PLS > IWATER variable monthly parameter value flags *** # - # CSNO RTOP VRS VNN RTLI *** 5 0 0 0 0 0 1 0 0 0 0 0 END IWAT-PARM1
IWAT-PARM2 <PLS > IWATER input info: Part 2 *** # - # *** LSUR SLSUR NSUR RETSC 5 400 0.01 0.1 0.1 1 400 0.01 0.1 0.1 END IWAT-PARM2
IWAT-PARM3 <PLS > IWATER input info: Part 3 *** # - # ***PETMAX PETMIN 5 0 0 1 0 0 END IWAT-PARM3
IWAT-STATE1 <PLS > *** Initial conditions at start of simulation # - # *** RETS SURS 5 0 0 1 0 0 END IWAT-STATE1
END IMPLND
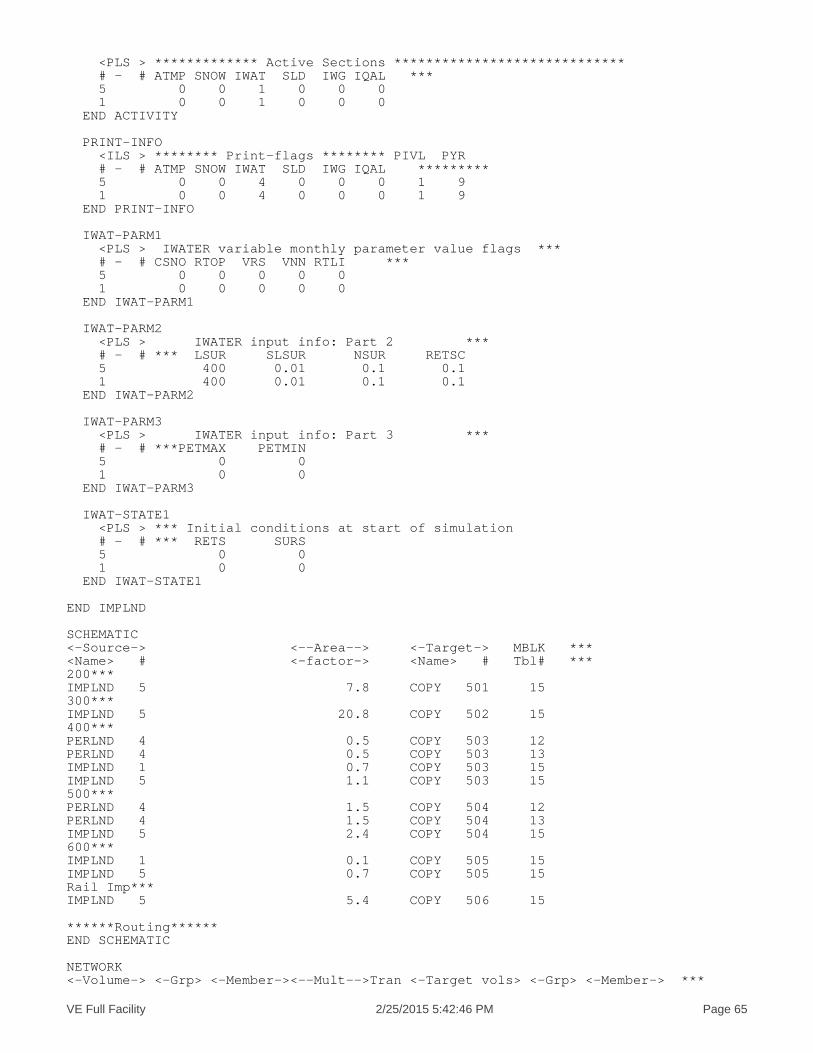
SCHEMATIC<-Source-> <--Area--> <-Target-> MBLK ***<Name> # <-factor-> <Name> # Tbl# ***200***IMPLND 5 7.8 COPY 501 15300***IMPLND 5 20.8 COPY 502 15400***PERLND 4 0.5 COPY 503 12PERLND 4 0.5 COPY 503 13IMPLND 1 0.7 COPY 503 15IMPLND 5 1.1 COPY 503 15500***PERLND 4 1.5 COPY 504 12PERLND 4 1.5 COPY 504 13IMPLND 5 2.4 COPY 504 15600***IMPLND 1 0.1 COPY 505 15IMPLND 5 0.7 COPY 505 15Rail Imp***IMPLND 5 5.4 COPY 506 15
******Routing******END SCHEMATIC
NETWORK<-Volume-> <-Grp> <-Member-><--Mult-->Tran <-Target vols> <-Grp> <-Member-> ***
VE Full Facility 2/25/2015 5:42:46 PM Page 66
<Name> # <Name> # #<-factor->strg <Name> # # <Name> # # ***COPY 501 OUTPUT MEAN 1 1 48.4 DISPLY 1 INPUT TIMSER 1COPY 502 OUTPUT MEAN 1 1 48.4 DISPLY 2 INPUT TIMSER 1COPY 503 OUTPUT MEAN 1 1 48.4 DISPLY 3 INPUT TIMSER 1COPY 504 OUTPUT MEAN 1 1 48.4 DISPLY 4 INPUT TIMSER 1COPY 505 OUTPUT MEAN 1 1 48.4 DISPLY 5 INPUT TIMSER 1COPY 506 OUTPUT MEAN 1 1 48.4 DISPLY 6 INPUT TIMSER 1
<-Volume-> <-Grp> <-Member-><--Mult-->Tran <-Target vols> <-Grp> <-Member-> ***<Name> # <Name> # #<-factor->strg <Name> # # <Name> # # ***END NETWORK
RCHRES GEN-INFO RCHRES Name Nexits Unit Systems Printer *** # - #<------------------><---> User T-series Engl Metr LKFG *** in out *** END GEN-INFO *** Section RCHRES***
ACTIVITY <PLS > ************* Active Sections ***************************** # - # HYFG ADFG CNFG HTFG SDFG GQFG OXFG NUFG PKFG PHFG *** END ACTIVITY
PRINT-INFO <PLS > ***************** Print-flags ******************* PIVL PYR # - # HYDR ADCA CONS HEAT SED GQL OXRX NUTR PLNK PHCB PIVL PYR ********* END PRINT-INFO
HYDR-PARM1 RCHRES Flags for each HYDR Section *** # - # VC A1 A2 A3 ODFVFG for each *** ODGTFG for each FUNCT for each FG FG FG FG possible exit *** possible exit possible exit * * * * * * * * * * * * * * *** END HYDR-PARM1
HYDR-PARM2 # - # FTABNO LEN DELTH STCOR KS DB50 *** <------><--------><--------><--------><--------><--------><--------> *** END HYDR-PARM2 HYDR-INIT RCHRES Initial conditions for each HYDR section *** # - # *** VOL Initial value of COLIND Initial value of OUTDGT *** ac-ft for each possible exit for each possible exit <------><--------> <---><---><---><---><---> *** <---><---><---><---><---> END HYDR-INITEND RCHRES
SPEC-ACTIONSEND SPEC-ACTIONSFTABLESEND FTABLES
EXT SOURCES<-Volume-> <Member> SsysSgap<--Mult-->Tran <-Target vols> <-Grp> <-Member-> ***<Name> # <Name> # tem strg<-factor->strg <Name> # # <Name> # # ***WDM 2 PREC ENGL 1.02 PERLND 1 999 EXTNL PRECWDM 2 PREC ENGL 1.02 IMPLND 1 999 EXTNL PRECWDM 1 EVAP ENGL 0.8 PERLND 1 999 EXTNL PETINPWDM 1 EVAP ENGL 0.8 IMPLND 1 999 EXTNL PETINP
END EXT SOURCES
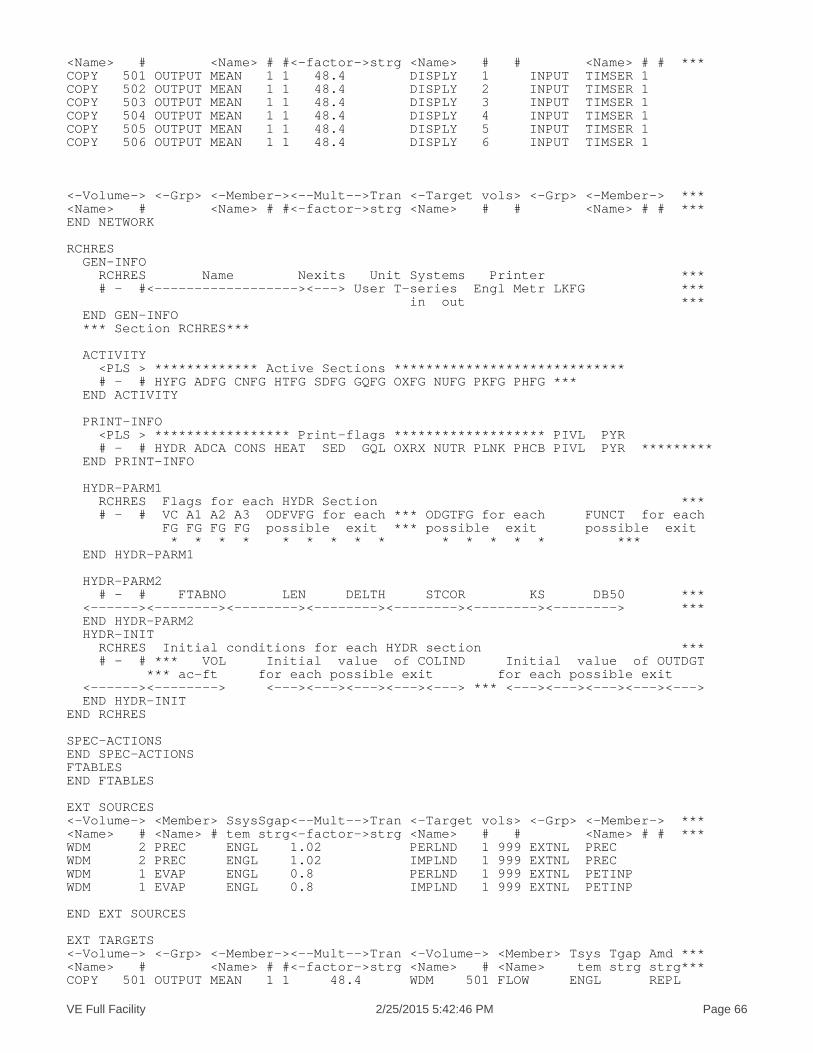
EXT TARGETS<-Volume-> <-Grp> <-Member-><--Mult-->Tran <-Volume-> <Member> Tsys Tgap Amd ***<Name> # <Name> # #<-factor->strg <Name> # <Name> tem strg strg***COPY 501 OUTPUT MEAN 1 1 48.4 WDM 501 FLOW ENGL REPL

VE Full Facility 2/25/2015 5:42:46 PM Page 67
COPY 502 OUTPUT MEAN 1 1 48.4 WDM 502 FLOW ENGL REPLCOPY 503 OUTPUT MEAN 1 1 48.4 WDM 503 FLOW ENGL REPLCOPY 504 OUTPUT MEAN 1 1 48.4 WDM 504 FLOW ENGL REPLCOPY 505 OUTPUT MEAN 1 1 48.4 WDM 505 FLOW ENGL REPLCOPY 506 OUTPUT MEAN 1 1 48.4 WDM 506 FLOW ENGL REPLEND EXT TARGETS
MASS-LINK<Volume> <-Grp> <-Member-><--Mult--> <Target> <-Grp> <-Member->***<Name> <Name> # #<-factor-> <Name> <Name> # #*** MASS-LINK 12PERLND PWATER SURO 0.083333 COPY INPUT MEAN END MASS-LINK 12
MASS-LINK 13PERLND PWATER IFWO 0.083333 COPY INPUT MEAN END MASS-LINK 13
MASS-LINK 15IMPLND IWATER SURO 0.083333 COPY INPUT MEAN END MASS-LINK 15
END MASS-LINK
END RUN
VE Full Facility 2/25/2015 5:42:46 PM Page 68
Mitigated UCI FileRUN
GLOBAL WWHM4 model simulation START 1948 10 01 END 2008 09 30 RUN INTERP OUTPUT LEVEL 3 0 RESUME 0 RUN 1 UNIT SYSTEM 1END GLOBAL
FILES<File> <Un#> <-----------File Name------------------------------>***<-ID-> ***WDM 26 VE Full Facility.wdmMESSU 25 MitVE Full Facility.MES 27 MitVE Full Facility.L61 28 MitVE Full Facility.L62 30 POCVE Full Facility1.dat 31 POCVE Full Facility2.dat 32 POCVE Full Facility3.dat 33 POCVE Full Facility4.dat 34 POCVE Full Facility5.dat 35 POCVE Full Facility6.datEND FILES
OPN SEQUENCE INGRP INDELT 00:15 PERLND 4 IMPLND 1 IMPLND 4 IMPLND 5 IMPLND 8 COPY 501 COPY 502 COPY 503 COPY 504 COPY 505 COPY 506 DISPLY 1 DISPLY 2 DISPLY 3 DISPLY 4 DISPLY 5 DISPLY 6 END INGRPEND OPN SEQUENCEDISPLY DISPLY-INFO1 # - #<----------Title----------->***TRAN PIVL DIG1 FIL1 PYR DIG2 FIL2 YRND 1 200 MAX 1 2 30 9 2 300 MAX 1 2 31 9 3 400 MAX 1 2 32 9 4 500 MAX 1 2 33 9 5 600 MAX 1 2 34 9 6 Rail Imp MAX 1 2 35 9 END DISPLY-INFO1END DISPLYCOPY TIMESERIES # - # NPT NMN *** 1 1 1 501 1 1 502 1 1 503 1 1 504 1 1 505 1 1 506 1 1 END TIMESERIESEND COPY
VE Full Facility 2/25/2015 5:42:46 PM Page 69
GENER OPCODE # # OPCD *** END OPCODE PARM # # K *** END PARMEND GENERPERLND GEN-INFO <PLS ><-------Name------->NBLKS Unit-systems Printer *** # - # User t-series Engl Metr *** in out *** 4 A/B, Pasture, Flat 1 1 1 1 27 0 END GEN-INFO *** Section PWATER***
ACTIVITY <PLS > ************* Active Sections ***************************** # - # ATMP SNOW PWAT SED PST PWG PQAL MSTL PEST NITR PHOS TRAC *** 4 0 0 1 0 0 0 0 0 0 0 0 0 END ACTIVITY
PRINT-INFO <PLS > ***************** Print-flags ***************************** PIVL PYR # - # ATMP SNOW PWAT SED PST PWG PQAL MSTL PEST NITR PHOS TRAC ********* 4 0 0 4 0 0 0 0 0 0 0 0 0 1 9 END PRINT-INFO
PWAT-PARM1 <PLS > PWATER variable monthly parameter value flags *** # - # CSNO RTOP UZFG VCS VUZ VNN VIFW VIRC VLE INFC HWT *** 4 0 0 0 0 0 0 0 0 0 0 0 END PWAT-PARM1
PWAT-PARM2 <PLS > PWATER input info: Part 2 *** # - # ***FOREST LZSN INFILT LSUR SLSUR KVARY AGWRC 4 0 5 1.5 400 0.05 0.3 0.996 END PWAT-PARM2
PWAT-PARM3 <PLS > PWATER input info: Part 3 *** # - # ***PETMAX PETMIN INFEXP INFILD DEEPFR BASETP AGWETP 4 0 0 2 2 0 0 0 END PWAT-PARM3 PWAT-PARM4 <PLS > PWATER input info: Part 4 *** # - # CEPSC UZSN NSUR INTFW IRC LZETP *** 4 0.15 0.5 0.3 0 0.7 0.4 END PWAT-PARM4
PWAT-STATE1 <PLS > *** Initial conditions at start of simulation ran from 1990 to end of 1992 (pat 1-11-95) RUN 21 *** # - # *** CEPS SURS UZS IFWS LZS AGWS GWVS 4 0 0 0 0 3 1 0 END PWAT-STATE1
END PERLND
IMPLND GEN-INFO <PLS ><-------Name-------> Unit-systems Printer *** # - # User t-series Engl Metr *** in out *** 1 ROADS/FLAT 1 1 1 27 0 4 ROOF TOPS/FLAT 1 1 1 27 0 5 DRIVEWAYS/FLAT 1 1 1 27 0 8 SIDEWALKS/FLAT 1 1 1 27 0
VE Full Facility 2/25/2015 5:42:46 PM Page 70
END GEN-INFO *** Section IWATER***
ACTIVITY <PLS > ************* Active Sections ***************************** # - # ATMP SNOW IWAT SLD IWG IQAL *** 1 0 0 1 0 0 0 4 0 0 1 0 0 0 5 0 0 1 0 0 0 8 0 0 1 0 0 0 END ACTIVITY
PRINT-INFO <ILS > ******** Print-flags ******** PIVL PYR # - # ATMP SNOW IWAT SLD IWG IQAL ********* 1 0 0 4 0 0 0 1 9 4 0 0 4 0 0 0 1 9 5 0 0 4 0 0 0 1 9 8 0 0 4 0 0 0 1 9 END PRINT-INFO
IWAT-PARM1 <PLS > IWATER variable monthly parameter value flags *** # - # CSNO RTOP VRS VNN RTLI *** 1 0 0 0 0 0 4 0 0 0 0 0 5 0 0 0 0 0 8 0 0 0 0 0 END IWAT-PARM1
IWAT-PARM2 <PLS > IWATER input info: Part 2 *** # - # *** LSUR SLSUR NSUR RETSC 1 400 0.01 0.1 0.1 4 400 0.01 0.1 0.1 5 400 0.01 0.1 0.1 8 400 0.01 0.1 0.1 END IWAT-PARM2
IWAT-PARM3 <PLS > IWATER input info: Part 3 *** # - # ***PETMAX PETMIN 1 0 0 4 0 0 5 0 0 8 0 0 END IWAT-PARM3
IWAT-STATE1 <PLS > *** Initial conditions at start of simulation # - # *** RETS SURS 1 0 0 4 0 0 5 0 0 8 0 0 END IWAT-STATE1
END IMPLND
SCHEMATIC<-Source-> <--Area--> <-Target-> MBLK ***<Name> # <-factor-> <Name> # Tbl# ***200***PERLND 4 0.48 COPY 501 12PERLND 4 0.48 COPY 501 13IMPLND 1 0.79 COPY 501 15IMPLND 4 4.05 COPY 501 15IMPLND 5 2.36 COPY 501 15IMPLND 8 0.15 COPY 501 15300***

VE Full Facility 2/25/2015 5:42:46 PM Page 71
PERLND 4 1.56 COPY 502 12PERLND 4 1.56 COPY 502 13IMPLND 1 12.35 COPY 502 15IMPLND 4 6.32 COPY 502 15IMPLND 5 0.57 COPY 502 15IMPLND 8 0.05 COPY 502 15400***PERLND 4 0.92 COPY 503 12PERLND 4 0.92 COPY 503 13IMPLND 1 1.02 COPY 503 15IMPLND 4 0.03 COPY 503 15IMPLND 5 0.09 COPY 503 15IMPLND 8 0.01 COPY 503 15500***IMPLND 5 4.89 COPY 504 15600***PERLND 4 0.1 COPY 505 12PERLND 4 0.1 COPY 505 13IMPLND 1 0.16 COPY 505 15IMPLND 4 0.19 COPY 505 15IMPLND 5 0.39 COPY 505 15IMPLND 8 0.01 COPY 505 15Rail Imp***IMPLND 5 5.43 COPY 506 15
******Routing******END SCHEMATIC
NETWORK<-Volume-> <-Grp> <-Member-><--Mult-->Tran <-Target vols> <-Grp> <-Member-> ***<Name> # <Name> # #<-factor->strg <Name> # # <Name> # # ***COPY 501 OUTPUT MEAN 1 1 48.4 DISPLY 1 INPUT TIMSER 1COPY 502 OUTPUT MEAN 1 1 48.4 DISPLY 2 INPUT TIMSER 1COPY 503 OUTPUT MEAN 1 1 48.4 DISPLY 3 INPUT TIMSER 1COPY 504 OUTPUT MEAN 1 1 48.4 DISPLY 4 INPUT TIMSER 1COPY 505 OUTPUT MEAN 1 1 48.4 DISPLY 5 INPUT TIMSER 1COPY 506 OUTPUT MEAN 1 1 48.4 DISPLY 6 INPUT TIMSER 1
<-Volume-> <-Grp> <-Member-><--Mult-->Tran <-Target vols> <-Grp> <-Member-> ***<Name> # <Name> # #<-factor->strg <Name> # # <Name> # # ***END NETWORK
RCHRES GEN-INFO RCHRES Name Nexits Unit Systems Printer *** # - #<------------------><---> User T-series Engl Metr LKFG *** in out *** END GEN-INFO *** Section RCHRES***
ACTIVITY <PLS > ************* Active Sections ***************************** # - # HYFG ADFG CNFG HTFG SDFG GQFG OXFG NUFG PKFG PHFG *** END ACTIVITY
PRINT-INFO <PLS > ***************** Print-flags ******************* PIVL PYR # - # HYDR ADCA CONS HEAT SED GQL OXRX NUTR PLNK PHCB PIVL PYR ********* END PRINT-INFO
HYDR-PARM1 RCHRES Flags for each HYDR Section *** # - # VC A1 A2 A3 ODFVFG for each *** ODGTFG for each FUNCT for each FG FG FG FG possible exit *** possible exit possible exit * * * * * * * * * * * * * * *** END HYDR-PARM1
HYDR-PARM2

VE Full Facility 2/25/2015 5:42:46 PM Page 72
# - # FTABNO LEN DELTH STCOR KS DB50 *** <------><--------><--------><--------><--------><--------><--------> *** END HYDR-PARM2 HYDR-INIT RCHRES Initial conditions for each HYDR section *** # - # *** VOL Initial value of COLIND Initial value of OUTDGT *** ac-ft for each possible exit for each possible exit <------><--------> <---><---><---><---><---> *** <---><---><---><---><---> END HYDR-INITEND RCHRES
SPEC-ACTIONSEND SPEC-ACTIONSFTABLESEND FTABLES
EXT SOURCES<-Volume-> <Member> SsysSgap<--Mult-->Tran <-Target vols> <-Grp> <-Member-> ***<Name> # <Name> # tem strg<-factor->strg <Name> # # <Name> # # ***WDM 2 PREC ENGL 1.02 PERLND 1 999 EXTNL PRECWDM 2 PREC ENGL 1.02 IMPLND 1 999 EXTNL PRECWDM 1 EVAP ENGL 0.8 PERLND 1 999 EXTNL PETINPWDM 1 EVAP ENGL 0.8 IMPLND 1 999 EXTNL PETINP
END EXT SOURCES
EXT TARGETS<-Volume-> <-Grp> <-Member-><--Mult-->Tran <-Volume-> <Member> Tsys Tgap Amd ***<Name> # <Name> # #<-factor->strg <Name> # <Name> tem strg strg***COPY 1 OUTPUT MEAN 1 1 48.4 WDM 701 FLOW ENGL REPLCOPY 501 OUTPUT MEAN 1 1 48.4 WDM 801 FLOW ENGL REPLCOPY 2 OUTPUT MEAN 1 1 48.4 WDM 702 FLOW ENGL REPLCOPY 502 OUTPUT MEAN 1 1 48.4 WDM 802 FLOW ENGL REPLCOPY 3 OUTPUT MEAN 1 1 48.4 WDM 703 FLOW ENGL REPLCOPY 503 OUTPUT MEAN 1 1 48.4 WDM 803 FLOW ENGL REPLCOPY 4 OUTPUT MEAN 1 1 48.4 WDM 704 FLOW ENGL REPLCOPY 504 OUTPUT MEAN 1 1 48.4 WDM 804 FLOW ENGL REPLCOPY 5 OUTPUT MEAN 1 1 48.4 WDM 705 FLOW ENGL REPLCOPY 505 OUTPUT MEAN 1 1 48.4 WDM 805 FLOW ENGL REPLCOPY 6 OUTPUT MEAN 1 1 48.4 WDM 706 FLOW ENGL REPLCOPY 506 OUTPUT MEAN 1 1 48.4 WDM 806 FLOW ENGL REPLEND EXT TARGETS
MASS-LINK<Volume> <-Grp> <-Member-><--Mult--> <Target> <-Grp> <-Member->***<Name> <Name> # #<-factor-> <Name> <Name> # #*** MASS-LINK 12PERLND PWATER SURO 0.083333 COPY INPUT MEAN END MASS-LINK 12
MASS-LINK 13PERLND PWATER IFWO 0.083333 COPY INPUT MEAN END MASS-LINK 13
MASS-LINK 15IMPLND IWATER SURO 0.083333 COPY INPUT MEAN END MASS-LINK 15
END MASS-LINK
END RUN

VE Full Facility 2/25/2015 5:42:46 PM Page 73
Predeveloped HSPF Message File

VE Full Facility 2/25/2015 5:42:46 PM Page 74
Mitigated HSPF Message File

VE Full Facility 2/25/2015 5:42:46 PM Page 75
DisclaimerLegal NoticeThis program and accompanying documentation are provided 'as-is' without warranty of any kind. The entire risk regarding the performance and results of this program is assumed by End User. Clear Creek Solutions Inc. and the governmental licensee or sublicensees disclaim all warranties, either expressed or implied, including but not limited to implied warranties of program and accompanying documentation. In no event shall Clear Creek Solutions Inc. be liable for any damages whatsoever (including without limitation to damages for loss of business profits, loss of business information, business interruption, and the like) arising out of the use of, or inability to use this program even if Clear Creek Solutions Inc. or their authorized representatives have been advised of the possibility of such damages. Software Copyright © by : Clear Creek Solutions, Inc. 2005-2013; All Rights Reserved.
Clear Creek Solutions, Inc.6200 Capitol Blvd. Ste FOlympia, WA. 98501Toll Free 1(866)943-0304Local (360)943-0304
www.clearcreeksolutions.com


Water Quality Model Results

WWHM2012
PROJECT REPORT

VE Ops 2/25/2015 3:14:54 PM Page 2
General Model InformationProject Name: VE Ops
Site Name: VE Operations
Site Address:
City: Vancouver
Report Date: 2/25/2015
Gage: I-5 Bridge
Data Start: 1948/10/01
Data End: 2008/09/30
Timestep: 15 Minute
Precip Scale: 1.02
Version: 2014/04/24
POC Thresholds
Low Flow Threshold for POC1: 50 Percent of the 2 Year
High Flow Threshold for POC1: 50 Year
Low Flow Threshold for POC2: 50 Percent of the 2 Year
High Flow Threshold for POC2: 50 Year
Low Flow Threshold for POC3: 50 Percent of the 2 Year
High Flow Threshold for POC3: 50 Year
Low Flow Threshold for POC4: 50 Percent of the 2 Year
High Flow Threshold for POC4: 50 Year
Low Flow Threshold for POC5: 50 Percent of the 2 Year
High Flow Threshold for POC5: 50 Year
VE Ops 2/25/2015 3:14:55 PM Page 3
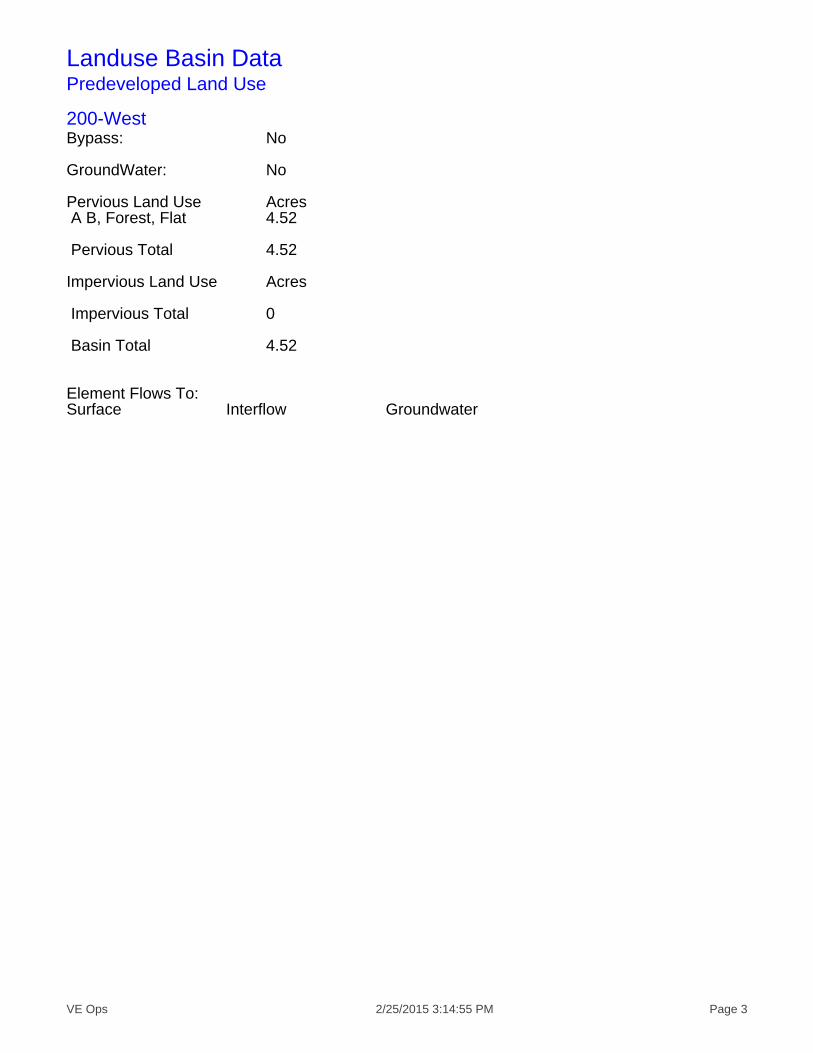
Landuse Basin DataPredeveloped Land Use
200-WestBypass: No
GroundWater: No
Pervious Land Use Acres A B, Forest, Flat 4.52
Pervious Total 4.52
Impervious Land Use Acres
Impervious Total 0
Basin Total 4.52
Element Flows To:Surface Interflow Groundwater

VE Ops 2/25/2015 3:14:55 PM Page 4
200-EastBypass: No
GroundWater: No
Pervious Land Use Acres A B, Forest, Flat 4.17
Pervious Total 4.17
Impervious Land Use Acres
Impervious Total 0
Basin Total 4.17
Element Flows To:Surface Interflow Groundwater

VE Ops 2/25/2015 3:14:55 PM Page 5
300-ContainmentBypass: No
GroundWater: No
Pervious Land Use Acres A B, Forest, Flat 18.19
Pervious Total 18.19
Impervious Land Use Acres
Impervious Total 0
Basin Total 18.19
Element Flows To:Surface Interflow Groundwater

VE Ops 2/25/2015 3:14:55 PM Page 6
300-FullBypass: No
GroundWater: No
Pervious Land Use Acres A B, Forest, Flat 21.03
Pervious Total 21.03
Impervious Land Use Acres
Impervious Total 0
Basin Total 21.03
Element Flows To:Surface Interflow Groundwater
VE Ops 2/25/2015 3:14:55 PM Page 7
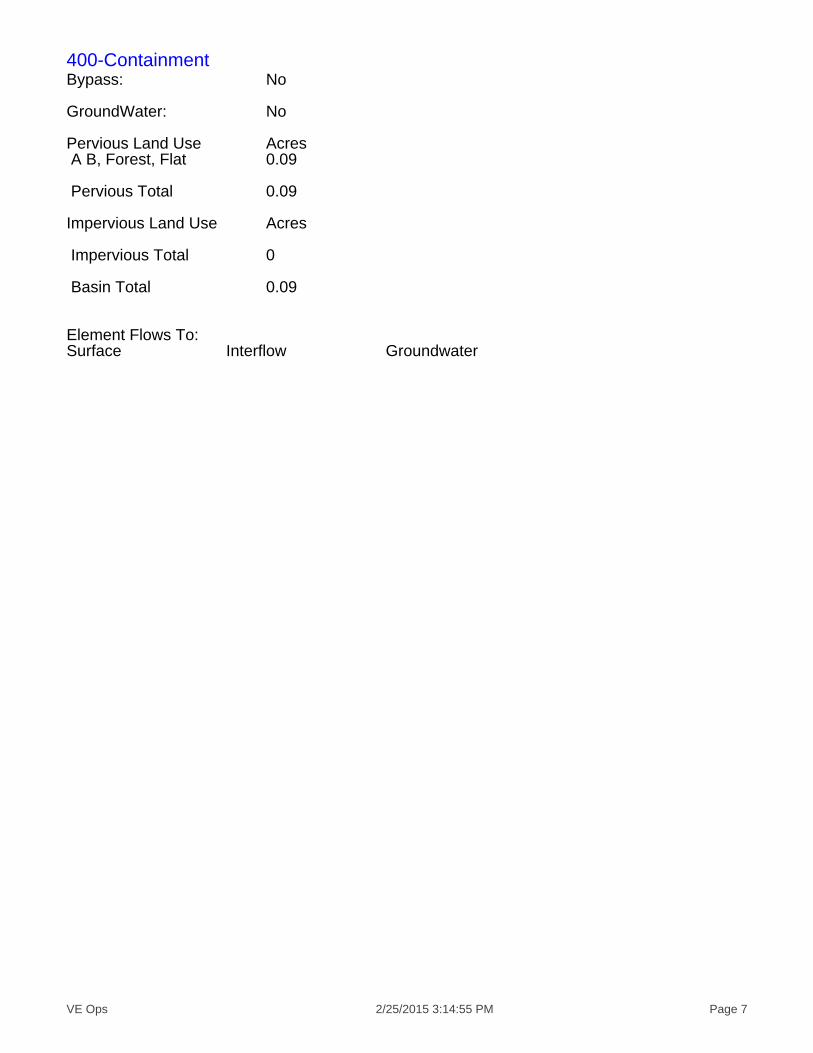
400-ContainmentBypass: No
GroundWater: No
Pervious Land Use Acres A B, Forest, Flat 0.09
Pervious Total 0.09
Impervious Land Use Acres
Impervious Total 0
Basin Total 0.09
Element Flows To:Surface Interflow Groundwater

VE Ops 2/25/2015 3:14:55 PM Page 8
Mitigated Land Use
200-WestBypass: No
GroundWater: No
Pervious Land Use Acres
Pervious Total 0
Impervious Land Use Acres ROADS FLAT 0.91 ROOF TOPS FLAT 0.17 DRIVEWAYS FLAT 0.17 SIDEWALKS FLAT 0.02
Impervious Total 1.27
Basin Total 1.27
Element Flows To:Surface Interflow Groundwater
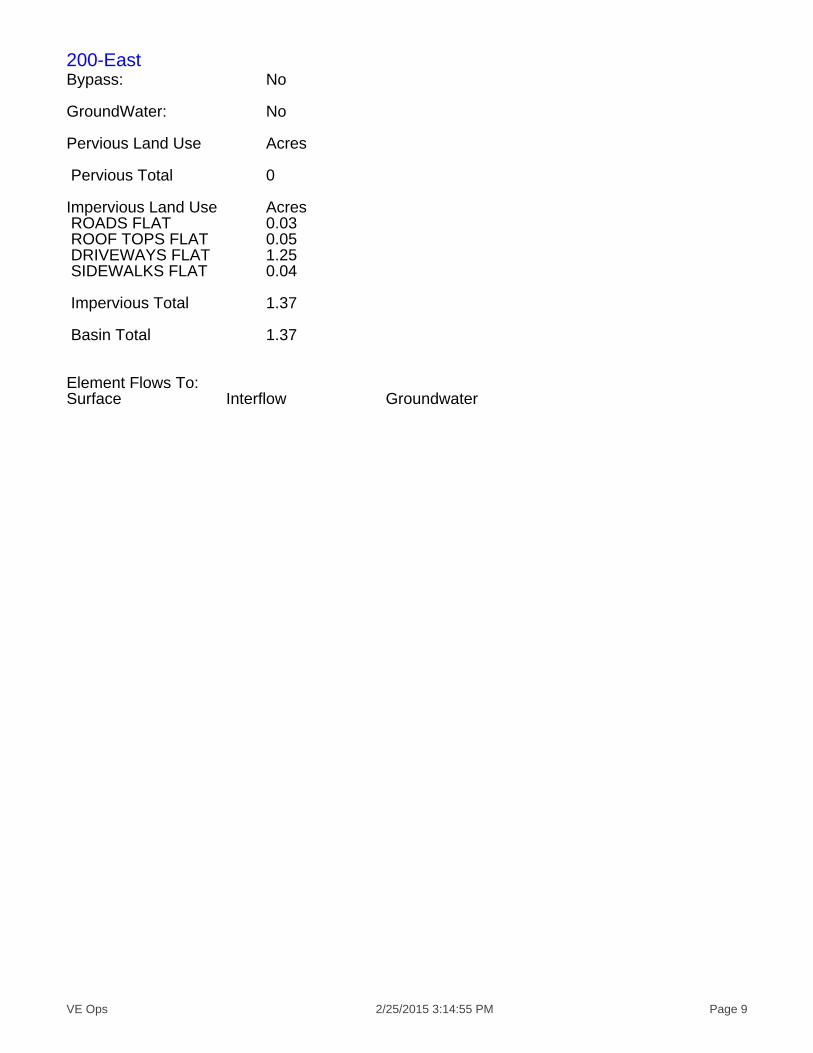
VE Ops 2/25/2015 3:14:55 PM Page 9
200-EastBypass: No
GroundWater: No
Pervious Land Use Acres
Pervious Total 0
Impervious Land Use Acres ROADS FLAT 0.03 ROOF TOPS FLAT 0.05 DRIVEWAYS FLAT 1.25 SIDEWALKS FLAT 0.04
Impervious Total 1.37
Basin Total 1.37
Element Flows To:Surface Interflow Groundwater
VE Ops 2/25/2015 3:14:55 PM Page 10
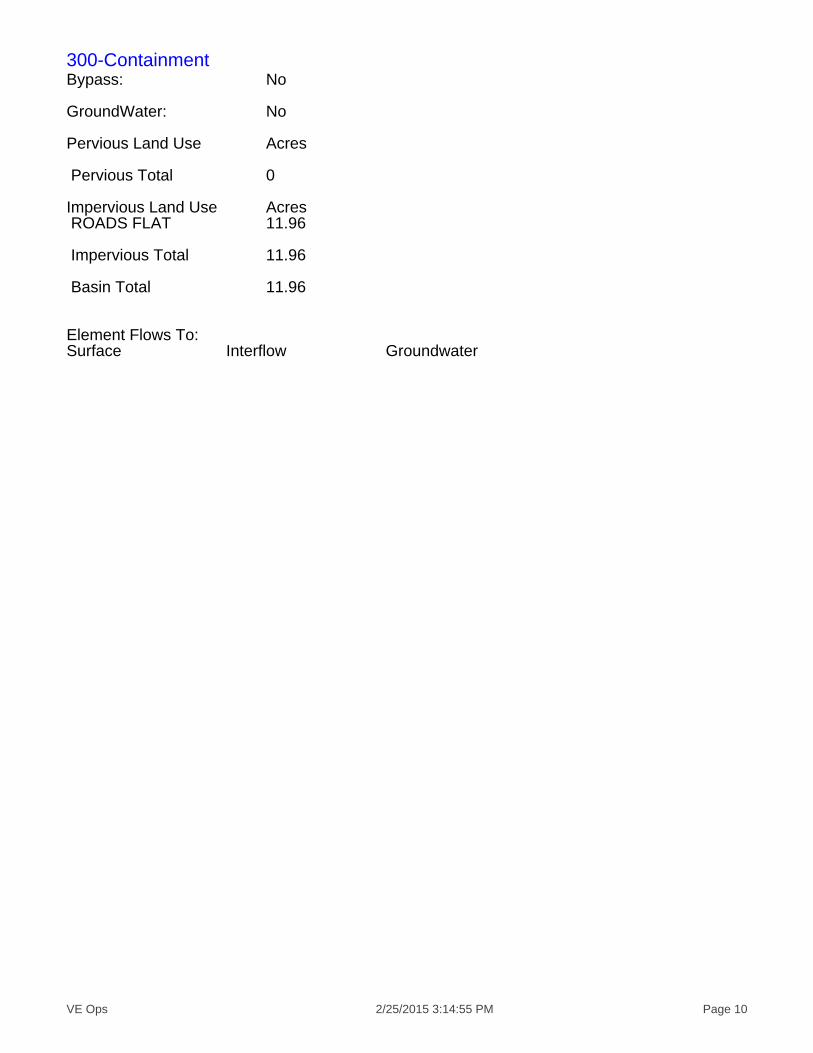
300-ContainmentBypass: No
GroundWater: No
Pervious Land Use Acres
Pervious Total 0
Impervious Land Use Acres ROADS FLAT 11.96
Impervious Total 11.96
Basin Total 11.96
Element Flows To:Surface Interflow Groundwater

VE Ops 2/25/2015 3:14:55 PM Page 11
300-FullBypass: No
GroundWater: No
Pervious Land Use Acres A B, Lawn, Flat 0.36
Pervious Total 0.36
Impervious Land Use Acres ROADS FLAT 12.53 ROOF TOPS FLAT 0.09 DRIVEWAYS FLAT 0.57 SIDEWALKS FLAT 0.05
Impervious Total 13.24
Basin Total 13.6
Element Flows To:Surface Interflow Groundwater
VE Ops 2/25/2015 3:14:55 PM Page 12
400-ContainmentBypass: No
GroundWater: No
Pervious Land Use Acres
Pervious Total 0
Impervious Land Use Acres ROADS FLAT 0.09
Impervious Total 0.09
Basin Total 0.09
Element Flows To:Surface Interflow Groundwater

VE Ops 2/25/2015 3:14:55 PM Page 13
Routing ElementsPredeveloped Routing

VE Ops 2/25/2015 3:14:55 PM Page 14
Mitigated Routing

VE Ops 2/25/2015 3:14:55 PM Page 15
Analysis ResultsPOC 1
+ Predeveloped x Mitigated
Predeveloped Landuse Totals for POC #1Total Pervious Area: 4.52Total Impervious Area: 0
Mitigated Landuse Totals for POC #1Total Pervious Area: 0Total Impervious Area: 1.27
Flow Frequency Method: Log Pearson Type III 17B
Flow Frequency Return Periods for Predeveloped. POC #1Return Period Flow(cfs)2 year 0.0037125 year 0.00638910 year 0.008925 year 0.01316150 year 0.017307100 year 0.022466
Flow Frequency Return Periods for Mitigated. POC #1Return Period Flow(cfs)2 year 0.5233685 year 0.69555210 year 0.81973425 year 0.98864650 year 1.123468100 year 1.266233
Annual PeaksAnnual Peaks for Predeveloped and Mitigated. POC #1Year Predeveloped Mitigated1949 0.003 0.9621950 0.004 0.4491951 0.022 0.5501952 0.004 0.5621953 0.004 0.4021954 0.004 0.7181955 0.003 0.3971956 0.005 0.6601957 0.003 0.3951958 0.003 0.584
VE Ops 2/25/2015 3:15:38 PM Page 16
1959 0.003 0.4741960 0.003 0.4971961 0.004 0.5301962 0.004 0.3551963 0.003 0.3671964 0.003 0.3951965 0.004 0.5111966 0.003 0.4161967 0.004 0.4871968 0.003 0.8541969 0.004 0.8521970 0.029 1.2641971 0.003 0.6581972 0.004 0.5001973 0.003 0.5221974 0.011 0.5901975 0.004 0.4201976 0.004 0.4601977 0.001 0.3191978 0.003 0.5201979 0.002 0.8281980 0.004 0.4081981 0.004 0.5921982 0.003 0.5931983 0.012 0.6781984 0.003 0.3971985 0.004 0.4831986 0.003 0.7351987 0.004 0.4291988 0.003 0.4291989 0.003 0.5601990 0.004 0.3431991 0.004 0.5451992 0.003 0.3621993 0.004 0.4991994 0.004 0.4291995 0.004 0.6481996 0.045 0.9251997 0.019 0.7961998 0.004 0.7671999 0.004 0.3562000 0.003 0.3532001 0.003 0.3542002 0.004 0.6122003 0.003 0.4712004 0.003 0.5912005 0.003 0.7162006 0.003 0.6062007 0.004 0.5232008 0.003 1.330
Ranked Annual PeaksRanked Annual Peaks for Predeveloped and Mitigated. POC #1Rank Predeveloped Mitigated1 0.0453 1.33032 0.0289 1.26393 0.0224 0.96244 0.0193 0.9247

VE Ops 2/25/2015 3:15:38 PM Page 17
5 0.0123 0.85456 0.0109 0.85197 0.0052 0.82758 0.0036 0.79649 0.0036 0.767410 0.0036 0.735211 0.0036 0.717912 0.0036 0.715813 0.0036 0.678114 0.0036 0.660215 0.0036 0.658316 0.0036 0.647917 0.0036 0.611918 0.0036 0.606419 0.0036 0.592820 0.0036 0.591621 0.0036 0.591122 0.0036 0.589523 0.0036 0.584024 0.0036 0.561825 0.0036 0.560326 0.0036 0.550227 0.0036 0.544628 0.0036 0.529829 0.0036 0.522930 0.0035 0.522531 0.0035 0.519832 0.0035 0.511433 0.0035 0.499634 0.0035 0.499335 0.0034 0.496836 0.0034 0.486937 0.0034 0.483238 0.0034 0.474139 0.0034 0.471340 0.0034 0.460241 0.0034 0.449042 0.0034 0.429243 0.0034 0.429144 0.0034 0.428545 0.0033 0.420346 0.0033 0.416447 0.0033 0.408448 0.0033 0.402449 0.0032 0.396750 0.0032 0.396651 0.0032 0.395252 0.0032 0.394653 0.0031 0.367154 0.0031 0.362055 0.0030 0.356556 0.0030 0.355457 0.0029 0.354058 0.0025 0.352559 0.0023 0.343260 0.0012 0.3191

VE Ops 2/25/2015 3:15:38 PM Page 18

VE Ops 2/25/2015 3:15:38 PM Page 19
Duration Flows
Flow(cfs) Predev Mit Percentage Pass/Fail0.0019 2272 313472 13797 Fail0.0020 1952 306529 15703 Fail0.0022 1672 300218 17955 Fail0.0023 1389 294117 21174 Fail0.0025 1160 288647 24883 Fail0.0026 980 283387 28917 Fail0.0028 806 278548 34559 Fail0.0029 663 273710 41283 Fail0.0031 502 269502 53685 Fail0.0033 335 265294 79192 Fail0.0034 213 261297 122674 Fail0.0036 101 257510 254960 Fail0.0037 29 253933 875631 Fail0.0039 28 250567 894882 Fail0.0040 28 247201 882860 Fail0.0042 25 244045 976180 Fail0.0044 24 240890 1003708 Fail0.0045 24 237944 991433 Fail0.0047 22 235209 1069131 Fail0.0048 22 232474 1056700 Fail0.0050 21 229739 1093995 Fail0.0051 19 227215 1195868 Fail0.0053 17 224690 1321705 Fail0.0054 15 222376 1482506 Fail0.0056 14 220062 1571871 Fail0.0058 13 217747 1674976 Fail0.0059 12 215644 1797033 Fail0.0061 12 213329 1777741 Fail0.0062 12 211226 1760216 Fail0.0064 12 209248 1743733 Fail0.0065 12 207186 1726550 Fail0.0067 12 205398 1711650 Fail0.0069 12 203504 1695866 Fail0.0070 12 201716 1680966 Fail0.0072 12 199907 1665891 Fail0.0073 12 198161 1651341 Fail0.0075 12 196415 1636791 Fail0.0076 12 194795 1623291 Fail0.0078 10 193154 1931540 Fail0.0079 10 191597 1915969 Fail0.0081 10 190040 1900400 Fail0.0083 10 188462 1884619 Fail0.0084 10 186989 1869890 Fail0.0086 10 185517 1855169 Fail0.0087 10 184065 1840650 Fail0.0089 10 182719 1827190 Fail0.0090 10 181288 1812880 Fail0.0092 10 179920 1799200 Fail0.0093 10 178574 1785740 Fail0.0095 10 177249 1772490 Fail0.0097 9 175923 1954700 Fail0.0098 9 174619 1940211 Fail0.0100 9 173398 1926644 Fail0.0101 9 172220 1913555 Fail
VE Ops 2/25/2015 3:15:38 PM Page 20
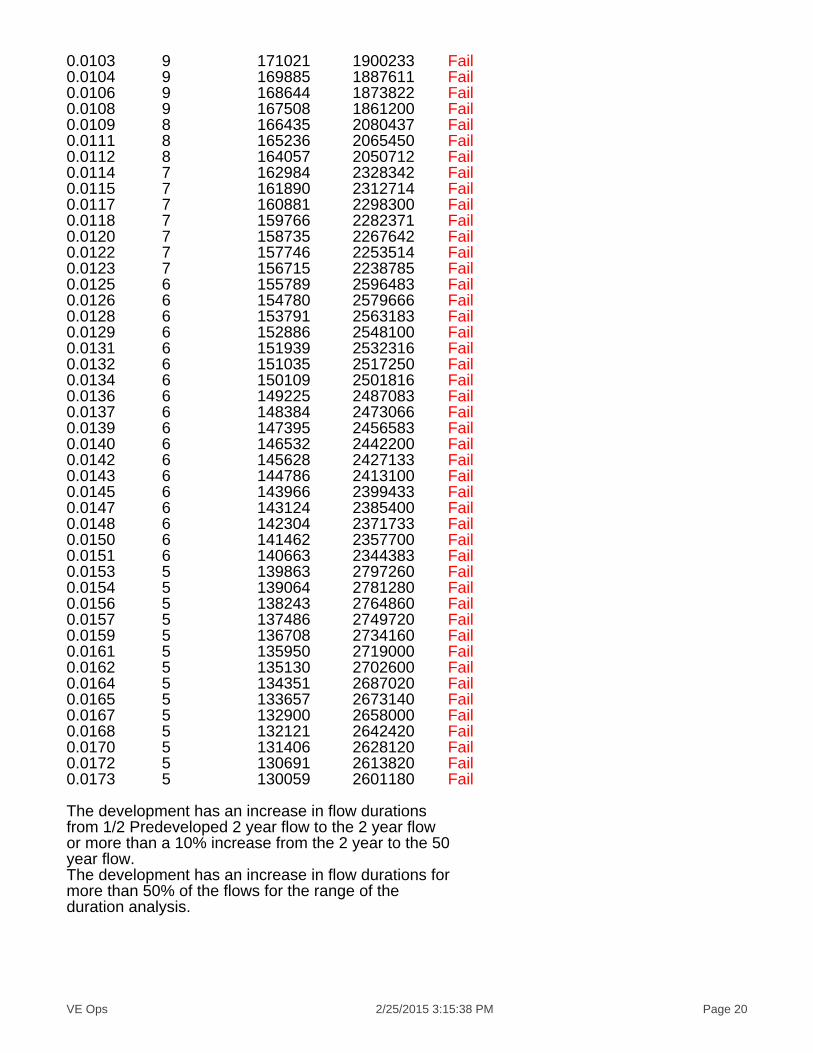
0.0103 9 171021 1900233 Fail0.0104 9 169885 1887611 Fail0.0106 9 168644 1873822 Fail0.0108 9 167508 1861200 Fail0.0109 8 166435 2080437 Fail0.0111 8 165236 2065450 Fail0.0112 8 164057 2050712 Fail0.0114 7 162984 2328342 Fail0.0115 7 161890 2312714 Fail0.0117 7 160881 2298300 Fail0.0118 7 159766 2282371 Fail0.0120 7 158735 2267642 Fail0.0122 7 157746 2253514 Fail0.0123 7 156715 2238785 Fail0.0125 6 155789 2596483 Fail0.0126 6 154780 2579666 Fail0.0128 6 153791 2563183 Fail0.0129 6 152886 2548100 Fail0.0131 6 151939 2532316 Fail0.0132 6 151035 2517250 Fail0.0134 6 150109 2501816 Fail0.0136 6 149225 2487083 Fail0.0137 6 148384 2473066 Fail0.0139 6 147395 2456583 Fail0.0140 6 146532 2442200 Fail0.0142 6 145628 2427133 Fail0.0143 6 144786 2413100 Fail0.0145 6 143966 2399433 Fail0.0147 6 143124 2385400 Fail0.0148 6 142304 2371733 Fail0.0150 6 141462 2357700 Fail0.0151 6 140663 2344383 Fail0.0153 5 139863 2797260 Fail0.0154 5 139064 2781280 Fail0.0156 5 138243 2764860 Fail0.0157 5 137486 2749720 Fail0.0159 5 136708 2734160 Fail0.0161 5 135950 2719000 Fail0.0162 5 135130 2702600 Fail0.0164 5 134351 2687020 Fail0.0165 5 133657 2673140 Fail0.0167 5 132900 2658000 Fail0.0168 5 132121 2642420 Fail0.0170 5 131406 2628120 Fail0.0172 5 130691 2613820 Fail0.0173 5 130059 2601180 Fail
The development has an increase in flow durationsfrom 1/2 Predeveloped 2 year flow to the 2 year flowor more than a 10% increase from the 2 year to the 50year flow.The development has an increase in flow durations formore than 50% of the flows for the range of theduration analysis.

VE Ops 2/25/2015 3:15:38 PM Page 21
Water QualityWater Quality BMP Flow and Volume for POC #1On-line facility volume: 0.1433 acre-feetOn-line facility target flow: 0.2046 cfs.Adjusted for 15 min: 0.2046 cfs.Off-line facility target flow: 0.1152 cfs.Adjusted for 15 min: 0.1152 cfs.

VE Ops 2/25/2015 3:15:38 PM Page 22
LID Report
VE Ops 2/25/2015 3:15:41 PM Page 23
POC 2
+ Predeveloped x Mitigated
Predeveloped Landuse Totals for POC #2Total Pervious Area: 4.17Total Impervious Area: 0
Mitigated Landuse Totals for POC #2Total Pervious Area: 0Total Impervious Area: 1.37
Flow Frequency Method: Log Pearson Type III 17B
Flow Frequency Return Periods for Predeveloped. POC #2Return Period Flow(cfs)2 year 0.0034245 year 0.00589510 year 0.00821125 year 0.01214250 year 0.015967100 year 0.020727
Flow Frequency Return Periods for Mitigated. POC #2Return Period Flow(cfs)2 year 0.5645785 year 0.7503210 year 0.8842825 year 1.06649250 year 1.21193100 year 1.365936
Annual PeaksAnnual Peaks for Predeveloped and Mitigated. POC #2Year Predeveloped Mitigated1949 0.003 1.0381950 0.003 0.4841951 0.021 0.5941952 0.003 0.6061953 0.003 0.4341954 0.003 0.7741955 0.003 0.4281956 0.005 0.7121957 0.003 0.4261958 0.003 0.6301959 0.003 0.511

VE Ops 2/25/2015 3:16:59 PM Page 24
1960 0.003 0.5361961 0.003 0.5711962 0.003 0.3831963 0.003 0.3961964 0.003 0.4261965 0.003 0.5521966 0.003 0.4491967 0.003 0.5251968 0.003 0.9221969 0.003 0.9191970 0.027 1.3631971 0.003 0.7101972 0.003 0.5391973 0.003 0.5641974 0.010 0.6361975 0.003 0.4531976 0.003 0.4961977 0.001 0.3441978 0.003 0.5611979 0.002 0.8931980 0.003 0.4411981 0.003 0.6381982 0.003 0.6391983 0.011 0.7311984 0.003 0.4281985 0.003 0.5211986 0.003 0.7931987 0.003 0.4621988 0.003 0.4631989 0.003 0.6041990 0.003 0.3701991 0.003 0.5871992 0.003 0.3901993 0.003 0.5391994 0.003 0.4631995 0.003 0.6991996 0.042 0.9981997 0.018 0.8591998 0.003 0.8281999 0.003 0.3852000 0.003 0.3802001 0.002 0.3822002 0.003 0.6602003 0.003 0.5082004 0.003 0.6382005 0.003 0.7722006 0.003 0.6542007 0.003 0.5642008 0.003 1.435
Ranked Annual PeaksRanked Annual Peaks for Predeveloped and Mitigated. POC #2Rank Predeveloped Mitigated1 0.0418 1.43502 0.0267 1.36343 0.0207 1.03824 0.0178 0.99755 0.0114 0.9217
VE Ops 2/25/2015 3:16:59 PM Page 25
6 0.0100 0.91897 0.0048 0.89278 0.0034 0.85919 0.0034 0.827810 0.0034 0.793011 0.0033 0.774512 0.0033 0.772213 0.0033 0.731414 0.0033 0.712215 0.0033 0.710116 0.0033 0.698917 0.0033 0.660118 0.0033 0.654219 0.0033 0.639520 0.0033 0.638121 0.0033 0.637722 0.0033 0.635923 0.0033 0.630024 0.0033 0.606025 0.0033 0.604426 0.0033 0.593527 0.0033 0.587528 0.0033 0.571529 0.0033 0.564130 0.0033 0.563631 0.0033 0.560732 0.0032 0.551733 0.0032 0.538934 0.0032 0.538635 0.0032 0.536036 0.0032 0.525237 0.0032 0.521338 0.0031 0.511539 0.0031 0.508440 0.0031 0.496441 0.0031 0.484442 0.0031 0.463043 0.0031 0.462944 0.0031 0.462345 0.0031 0.453446 0.0030 0.449247 0.0030 0.440548 0.0030 0.434149 0.0030 0.428050 0.0029 0.427951 0.0029 0.426352 0.0029 0.425753 0.0029 0.396054 0.0029 0.390555 0.0028 0.384656 0.0027 0.383457 0.0027 0.381858 0.0023 0.380359 0.0021 0.370260 0.0011 0.3443
VE Ops 2/25/2015 3:16:59 PM Page 26
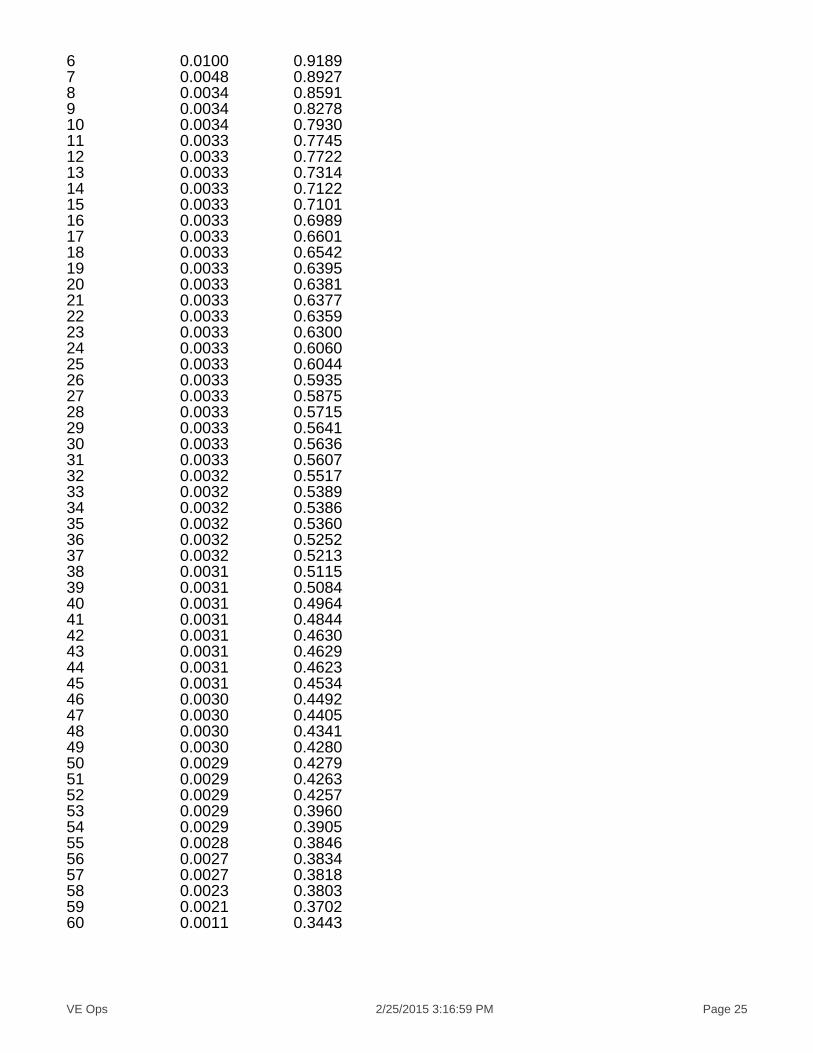
Duration Flows
Flow(cfs) Predev Mit Percentage Pass/Fail0.0017 2272 327147 14399 Fail0.0019 1955 320204 16378 Fail0.0020 1677 313683 18705 Fail0.0021 1389 307581 22144 Fail0.0023 1161 302111 26021 Fail0.0024 982 296852 30229 Fail0.0026 806 291803 36203 Fail0.0027 663 287174 43314 Fail0.0029 504 282756 56102 Fail0.0030 336 278548 82901 Fail0.0032 213 274551 128897 Fail0.0033 101 270764 268083 Fail0.0034 29 267188 921337 Fail0.0036 28 263822 942221 Fail0.0037 28 260455 930196 Fail0.0039 25 257089 1028355 Fail0.0040 24 254144 1058933 Fail0.0042 24 251198 1046658 Fail0.0043 22 248253 1128422 Fail0.0044 22 245518 1115990 Fail0.0046 21 242783 1156109 Fail0.0047 19 240259 1264521 Fail0.0049 17 237734 1398435 Fail0.0050 15 235209 1568060 Fail0.0052 14 232895 1663535 Fail0.0053 13 230581 1773700 Fail0.0055 12 228477 1903975 Fail0.0056 12 226373 1886441 Fail0.0057 12 224269 1868908 Fail0.0059 12 222166 1851383 Fail0.0060 12 220062 1833850 Fail0.0062 12 218168 1818066 Fail0.0063 12 216275 1802291 Fail0.0065 12 214381 1786508 Fail0.0066 12 212698 1772483 Fail0.0068 12 210805 1756708 Fail0.0069 12 209101 1742508 Fail0.0070 12 207354 1727950 Fail0.0072 10 205819 2058190 Fail0.0073 10 204178 2041780 Fail0.0075 10 202642 2026419 Fail0.0076 10 201106 2011060 Fail0.0078 10 199570 1995700 Fail0.0079 10 198055 1980550 Fail0.0080 10 196562 1965619 Fail0.0082 10 195173 1951730 Fail0.0083 10 193806 1938060 Fail0.0085 10 192396 1923960 Fail0.0086 10 191050 1910500 Fail0.0088 10 189724 1897240 Fail0.0089 9 188378 2093088 Fail0.0091 9 187137 2079300 Fail0.0092 9 185895 2065500 Fail0.0093 9 184612 2051244 Fail

VE Ops 2/25/2015 3:16:59 PM Page 27
0.0095 9 183476 2038622 Fail0.0096 9 182277 2025300 Fail0.0098 9 181056 2011733 Fail0.0099 9 179878 1998644 Fail0.0101 8 178742 2234275 Fail0.0102 8 177648 2220600 Fail0.0104 8 176449 2205612 Fail0.0105 7 175355 2505071 Fail0.0106 7 174303 2490042 Fail0.0108 7 173209 2474414 Fail0.0109 7 172199 2459985 Fail0.0111 7 171147 2444957 Fail0.0112 7 170159 2430842 Fail0.0114 7 169170 2416714 Fail0.0115 6 168139 2802316 Fail0.0116 6 167213 2786883 Fail0.0118 6 166224 2770400 Fail0.0119 6 165236 2753933 Fail0.0121 6 164268 2737800 Fail0.0122 6 163300 2721666 Fail0.0124 6 162395 2706583 Fail0.0125 6 161470 2691166 Fail0.0127 6 160523 2675383 Fail0.0128 6 159660 2661000 Fail0.0129 6 158756 2645933 Fail0.0131 6 157935 2632250 Fail0.0132 6 157031 2617183 Fail0.0134 6 156189 2603150 Fail0.0135 6 155411 2590183 Fail0.0137 6 154527 2575450 Fail0.0138 6 153707 2561783 Fail0.0140 6 152865 2547750 Fail0.0141 5 152087 3041740 Fail0.0142 5 151329 3026580 Fail0.0144 5 150509 3010180 Fail0.0145 5 149772 2995440 Fail0.0147 5 148994 2979880 Fail0.0148 5 148279 2965580 Fail0.0150 5 147479 2949580 Fail0.0151 5 146659 2933180 Fail0.0152 5 145922 2918440 Fail0.0154 5 145186 2903720 Fail0.0155 5 144492 2889840 Fail0.0157 5 143776 2875520 Fail0.0158 5 143019 2860380 Fail0.0160 5 142325 2846500 Fail
The development has an increase in flow durationsfrom 1/2 Predeveloped 2 year flow to the 2 year flowor more than a 10% increase from the 2 year to the 50year flow.The development has an increase in flow durations formore than 50% of the flows for the range of theduration analysis.

VE Ops 2/25/2015 3:16:59 PM Page 28
Water QualityWater Quality BMP Flow and Volume for POC #2On-line facility volume: 0.1545 acre-feetOn-line facility target flow: 0.2207 cfs.Adjusted for 15 min: 0.2207 cfs.Off-line facility target flow: 0.1243 cfs.Adjusted for 15 min: 0.1243 cfs.

VE Ops 2/25/2015 3:16:59 PM Page 29
LID Report
VE Ops 2/25/2015 3:16:59 PM Page 30
POC 3
+ Predeveloped x Mitigated
Predeveloped Landuse Totals for POC #3Total Pervious Area: 18.19Total Impervious Area: 0
Mitigated Landuse Totals for POC #3Total Pervious Area: 0Total Impervious Area: 11.96
Flow Frequency Method: Log Pearson Type III 17B
Flow Frequency Return Periods for Predeveloped. POC #3Return Period Flow(cfs)2 year 0.0149385 year 0.02571310 year 0.03581825 year 0.05296350 year 0.06965100 year 0.090412
Flow Frequency Return Periods for Mitigated. POC #3Return Period Flow(cfs)2 year 4.9287255 year 6.55023710 year 7.71970525 year 9.31039850 year 10.580063100 year 11.924525
Annual PeaksAnnual Peaks for Predeveloped and Mitigated. POC #3Year Predeveloped Mitigated1949 0.013 9.0631950 0.014 4.2281951 0.090 5.1821952 0.014 5.2901953 0.015 3.7891954 0.014 6.7611955 0.014 3.7351956 0.021 6.2181957 0.013 3.7221958 0.014 5.5001959 0.014 4.465
VE Ops 2/25/2015 3:18:17 PM Page 31
1960 0.014 4.6791961 0.014 4.9891962 0.014 3.3471963 0.013 3.4571964 0.013 3.7161965 0.015 4.8161966 0.013 3.9211967 0.015 4.5851968 0.013 8.0471969 0.015 8.0221970 0.116 11.9021971 0.014 6.1991972 0.014 4.7051973 0.012 4.9201974 0.044 5.5521975 0.014 3.9581976 0.014 4.3341977 0.005 3.0051978 0.014 4.8951979 0.009 7.7931980 0.015 3.8461981 0.014 5.5711982 0.014 5.5821983 0.050 6.3851984 0.014 3.7361985 0.015 4.5511986 0.012 6.9231987 0.014 4.0361988 0.012 4.0421989 0.013 5.2761990 0.015 3.2321991 0.014 5.1291992 0.014 3.4091993 0.015 4.7021994 0.015 4.0411995 0.015 6.1021996 0.182 8.7081997 0.078 7.5001998 0.014 7.2271999 0.015 3.3572000 0.014 3.3202001 0.010 3.3332002 0.015 5.7632003 0.013 4.4392004 0.013 5.5672005 0.013 6.7412006 0.014 5.7112007 0.015 4.9252008 0.014 12.527
Ranked Annual PeaksRanked Annual Peaks for Predeveloped and Mitigated. POC #3Rank Predeveloped Mitigated1 0.1821 12.52742 0.1164 11.90233 0.0903 9.06304 0.0778 8.70825 0.0496 8.0467

VE Ops 2/25/2015 3:18:17 PM Page 32
6 0.0438 8.02227 0.0208 7.79308 0.0146 7.50029 0.0146 7.226810 0.0146 6.923211 0.0146 6.761012 0.0146 6.741313 0.0146 6.385514 0.0146 6.217615 0.0146 6.199116 0.0146 6.101617 0.0145 5.762718 0.0145 5.711119 0.0145 5.582420 0.0145 5.571021 0.0145 5.566822 0.0145 5.551623 0.0145 5.499924 0.0144 5.290425 0.0144 5.276226 0.0144 5.181527 0.0144 5.128828 0.0144 4.989029 0.0144 4.924830 0.0143 4.920431 0.0143 4.894732 0.0142 4.816533 0.0140 4.704834 0.0139 4.702135 0.0139 4.678936 0.0139 4.585337 0.0137 4.550638 0.0137 4.465139 0.0137 4.438740 0.0137 4.333741 0.0137 4.228542 0.0137 4.042143 0.0136 4.040944 0.0136 4.035545 0.0135 3.957846 0.0132 3.921347 0.0132 3.845848 0.0132 3.789449 0.0129 3.736150 0.0128 3.735151 0.0127 3.722052 0.0127 3.716053 0.0126 3.456954 0.0125 3.409055 0.0120 3.357156 0.0120 3.347057 0.0118 3.333458 0.0102 3.319859 0.0093 3.231660 0.0048 3.0055

VE Ops 2/25/2015 3:18:17 PM Page 33
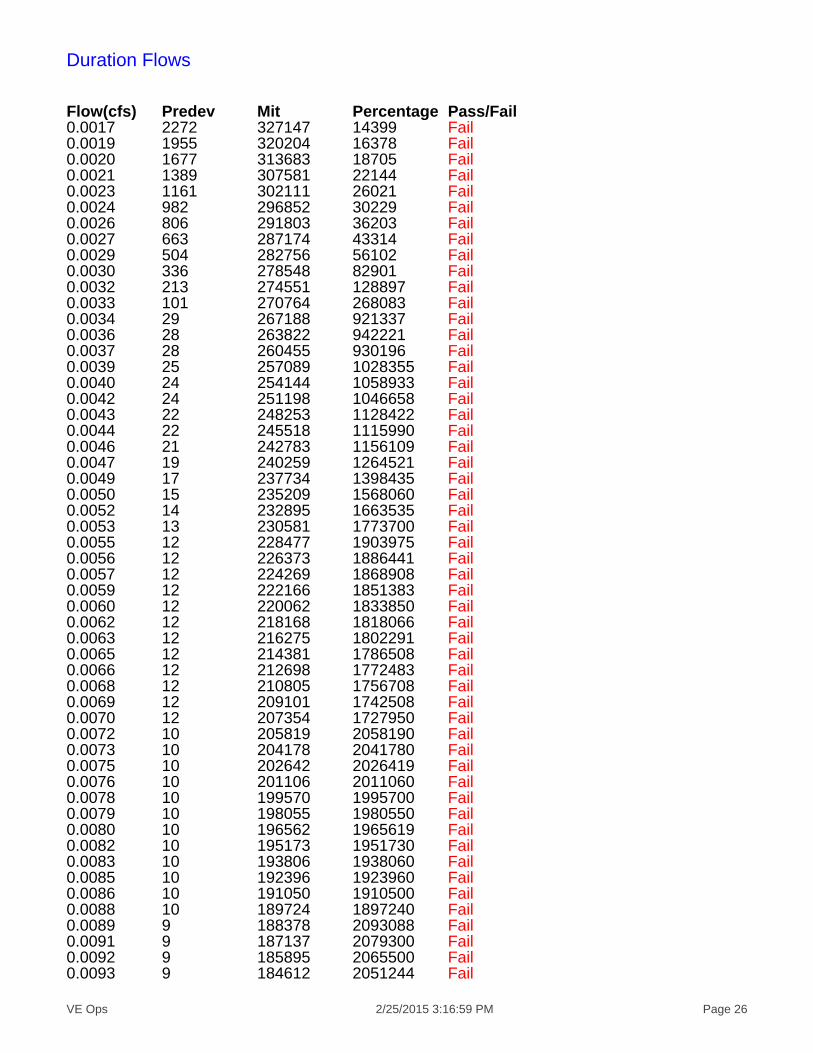
Duration Flows
Flow(cfs) Predev Mit Percentage Pass/Fail0.0075 2272 390683 17195 Fail0.0081 1952 383320 19637 Fail0.0087 1672 376587 22523 Fail0.0094 1388 370276 26676 Fail0.0100 1160 363123 31303 Fail0.0106 984 357653 36346 Fail0.0112 806 352393 43721 Fail0.0119 664 347554 52342 Fail0.0125 502 342926 68311 Fail0.0131 335 338718 101109 Fail0.0137 213 334511 157047 Fail0.0144 101 330724 327449 Fail0.0150 29 326937 1127368 Fail0.0156 28 323360 1154857 Fail0.0163 28 319784 1142085 Fail0.0169 25 316418 1265672 Fail0.0175 24 313262 1305258 Fail0.0181 24 310316 1292983 Fail0.0188 22 307371 1397140 Fail0.0194 22 304636 1384709 Fail0.0200 21 301691 1436623 Fail0.0207 19 299166 1574557 Fail0.0213 17 296641 1744947 Fail0.0219 15 294117 1960780 Fail0.0225 14 291592 2082800 Fail0.0232 13 289278 2225215 Fail0.0238 12 286964 2391366 Fail0.0244 12 284860 2373833 Fail0.0251 12 282546 2354550 Fail0.0257 12 280442 2337016 Fail0.0263 12 278338 2319483 Fail0.0269 12 276445 2303708 Fail0.0276 12 274341 2286175 Fail0.0282 12 272447 2270391 Fail0.0288 12 270554 2254616 Fail0.0295 12 268871 2240591 Fail0.0301 12 266977 2224808 Fail0.0307 12 265294 2210783 Fail0.0313 10 263611 2636110 Fail0.0320 10 261928 2619280 Fail0.0326 10 260245 2602450 Fail0.0332 10 258562 2585620 Fail0.0338 10 257089 2570890 Fail0.0345 10 255406 2554060 Fail0.0351 10 253933 2539330 Fail0.0357 10 252461 2524610 Fail0.0364 10 250988 2509880 Fail0.0370 10 249515 2495150 Fail0.0376 10 248253 2482530 Fail0.0382 10 246780 2467800 Fail0.0389 9 245308 2725644 Fail0.0395 9 244045 2711611 Fail0.0401 9 242783 2697588 Fail0.0408 9 241521 2683566 Fail

VE Ops 2/25/2015 3:18:17 PM Page 34
0.0414 9 240259 2669544 Fail0.0420 9 238786 2653177 Fail0.0426 9 237524 2639155 Fail0.0433 9 236472 2627466 Fail0.0439 8 235209 2940112 Fail0.0445 8 233947 2924337 Fail0.0452 8 232895 2911187 Fail0.0458 7 231843 3312042 Fail0.0464 7 230581 3294014 Fail0.0470 7 229529 3278985 Fail0.0477 7 228267 3260957 Fail0.0483 7 227215 3245928 Fail0.0489 7 226163 3230900 Fail0.0496 7 225111 3215871 Fail0.0502 6 224059 3734316 Fail0.0508 6 223217 3720283 Fail0.0514 6 222166 3702766 Fail0.0521 6 221114 3685233 Fail0.0527 6 220062 3667700 Fail0.0533 6 219220 3653666 Fail0.0539 6 218168 3636133 Fail0.0546 6 217116 3618600 Fail0.0552 6 216275 3604583 Fail0.0558 6 215223 3587050 Fail0.0565 6 214381 3573016 Fail0.0571 6 213540 3559000 Fail0.0577 6 212488 3541466 Fail0.0583 6 211646 3527433 Fail0.0590 6 210805 3513416 Fail0.0596 6 209942 3499033 Fail0.0602 6 209059 3484316 Fail0.0609 6 208217 3470283 Fail0.0615 5 207312 4146239 Fail0.0621 5 206534 4130680 Fail0.0627 5 205777 4115539 Fail0.0634 5 204977 4099539 Fail0.0640 5 204157 4083139 Fail0.0646 5 203357 4067139 Fail0.0653 5 202600 4052000 Fail0.0659 5 201821 4036420 Fail0.0665 5 201064 4021280 Fail0.0671 5 200286 4005720 Fail0.0678 5 199528 3990560 Fail0.0684 5 198771 3975420 Fail0.0690 5 198034 3960680 Fail0.0697 5 197298 3945960 Fail
The development has an increase in flow durationsfrom 1/2 Predeveloped 2 year flow to the 2 year flowor more than a 10% increase from the 2 year to the 50year flow.The development has an increase in flow durations formore than 50% of the flows for the range of theduration analysis.

VE Ops 2/25/2015 3:18:17 PM Page 35
Water QualityWater Quality BMP Flow and Volume for POC #3On-line facility volume: 1.3469 acre-feetOn-line facility target flow: 1.9263 cfs.Adjusted for 15 min: 1.9263 cfs.Off-line facility target flow: 1.0856 cfs.Adjusted for 15 min: 1.0856 cfs.

VE Ops 2/25/2015 3:18:17 PM Page 36
LID Report

VE Ops 2/25/2015 3:18:17 PM Page 37
POC 4
+ Predeveloped x Mitigated
Predeveloped Landuse Totals for POC #4Total Pervious Area: 21.03Total Impervious Area: 0
Mitigated Landuse Totals for POC #4Total Pervious Area: 0.36Total Impervious Area: 13.24
Flow Frequency Method: Log Pearson Type III 17B
Flow Frequency Return Periods for Predeveloped. POC #4Return Period Flow(cfs)2 year 0.017275 year 0.02972710 year 0.0414125 year 0.06123250 year 0.080525100 year 0.104528
Flow Frequency Return Periods for Mitigated. POC #4Return Period Flow(cfs)2 year 5.4596425 year 7.26041110 year 8.55979825 year 10.32789850 year 11.739656100 year 13.234992
Annual PeaksAnnual Peaks for Predeveloped and Mitigated. POC #4Year Predeveloped Mitigated1949 0.015 10.0331950 0.017 4.6811951 0.104 5.7771952 0.017 5.8571953 0.017 4.1951954 0.017 7.4851955 0.016 4.1351956 0.024 6.9341957 0.015 4.1201958 0.016 6.0891959 0.016 4.943

VE Ops 2/25/2015 3:19:33 PM Page 38
1960 0.016 5.1801961 0.017 5.5231962 0.016 3.7051963 0.015 3.8271964 0.014 4.1141965 0.017 5.3341966 0.015 4.3411967 0.017 5.0761968 0.015 8.9081969 0.017 8.8811970 0.135 13.3261971 0.016 6.8631972 0.017 5.2091973 0.014 5.4471974 0.051 6.1491975 0.017 4.3821976 0.016 4.8011977 0.006 3.3271978 0.016 5.4221979 0.011 8.6271980 0.017 4.2571981 0.017 6.1741982 0.016 6.1801983 0.057 7.1241984 0.016 4.1361985 0.017 5.0381986 0.014 7.6641987 0.017 4.4671988 0.014 4.4751989 0.016 5.8411990 0.017 3.5781991 0.017 5.6781992 0.016 3.7741993 0.017 5.2051994 0.017 4.4731995 0.017 6.7551996 0.211 9.6401997 0.090 8.3031998 0.017 8.0001999 0.017 3.7172000 0.016 3.6752001 0.012 3.6902002 0.017 6.3942003 0.015 4.9202004 0.015 6.1632005 0.015 7.4632006 0.016 6.3222007 0.017 5.4522008 0.016 13.869
Ranked Annual PeaksRanked Annual Peaks for Predeveloped and Mitigated. POC #4Rank Predeveloped Mitigated1 0.2106 13.86862 0.1346 13.32593 0.1044 10.03294 0.0899 9.64025 0.0574 8.9079
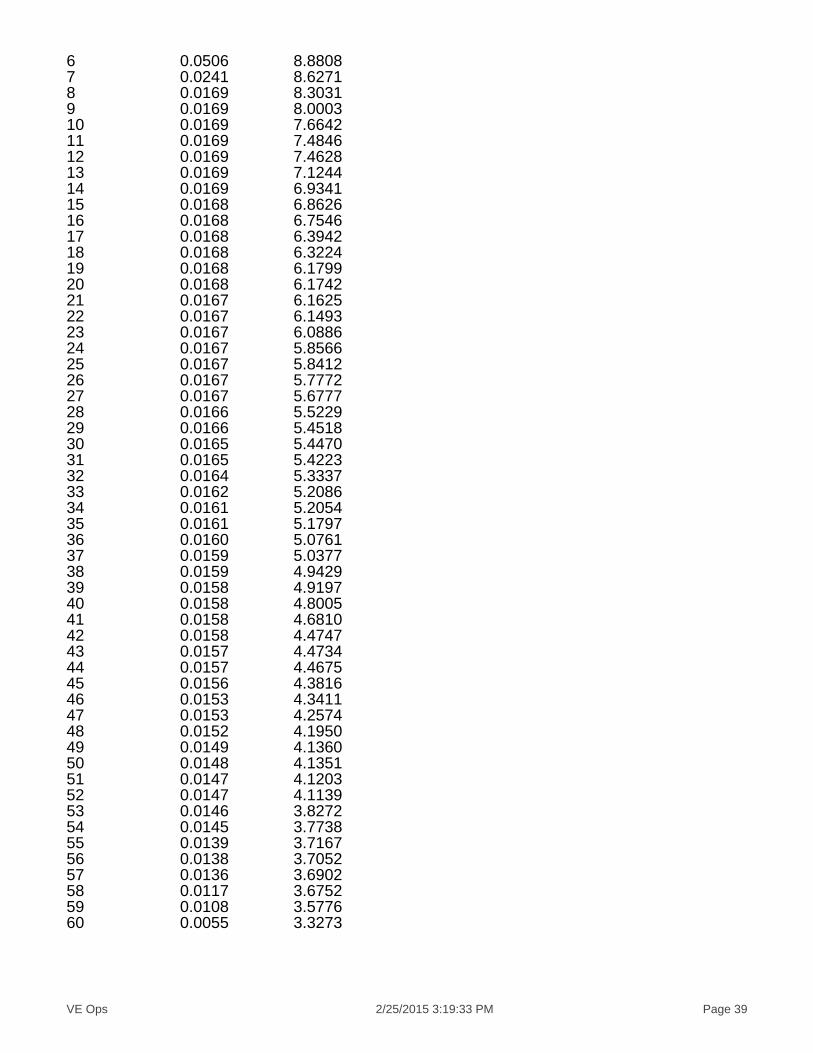
VE Ops 2/25/2015 3:19:33 PM Page 39
6 0.0506 8.88087 0.0241 8.62718 0.0169 8.30319 0.0169 8.000310 0.0169 7.664211 0.0169 7.484612 0.0169 7.462813 0.0169 7.124414 0.0169 6.934115 0.0168 6.862616 0.0168 6.754617 0.0168 6.394218 0.0168 6.322419 0.0168 6.179920 0.0168 6.174221 0.0167 6.162522 0.0167 6.149323 0.0167 6.088624 0.0167 5.856625 0.0167 5.841226 0.0167 5.777227 0.0167 5.677728 0.0166 5.522929 0.0166 5.451830 0.0165 5.447031 0.0165 5.422332 0.0164 5.333733 0.0162 5.208634 0.0161 5.205435 0.0161 5.179736 0.0160 5.076137 0.0159 5.037738 0.0159 4.942939 0.0158 4.919740 0.0158 4.800541 0.0158 4.681042 0.0158 4.474743 0.0157 4.473444 0.0157 4.467545 0.0156 4.381646 0.0153 4.341147 0.0153 4.257448 0.0152 4.195049 0.0149 4.136050 0.0148 4.135151 0.0147 4.120352 0.0147 4.113953 0.0146 3.827254 0.0145 3.773855 0.0139 3.716756 0.0138 3.705257 0.0136 3.690258 0.0117 3.675259 0.0108 3.577660 0.0055 3.3273

VE Ops 2/25/2015 3:19:33 PM Page 40
Duration Flows
Flow(cfs) Predev Mit Percentage Pass/Fail0.0086 2272 386686 17019 Fail0.0094 1952 379322 19432 Fail0.0101 1677 372590 22217 Fail0.0108 1389 365016 26279 Fail0.0115 1163 359125 30879 Fail0.0123 982 353656 36013 Fail0.0130 806 348606 43251 Fail0.0137 665 343767 51694 Fail0.0144 502 339139 67557 Fail0.0152 335 334721 99916 Fail0.0159 213 330724 155269 Fail0.0166 101 326726 323491 Fail0.0173 29 323150 1114310 Fail0.0181 28 319573 1141332 Fail0.0188 28 315997 1128560 Fail0.0195 25 312841 1251364 Fail0.0203 24 309475 1289479 Fail0.0210 24 306529 1277204 Fail0.0217 22 303584 1379927 Fail0.0224 22 300849 1367495 Fail0.0232 22 298114 1355063 Fail0.0239 19 295379 1554626 Fail0.0246 17 292855 1722676 Fail0.0253 15 290330 1935533 Fail0.0261 14 288016 2057257 Fail0.0268 13 285701 2197700 Fail0.0275 12 283177 2359808 Fail0.0282 12 281073 2342275 Fail0.0290 12 278969 2324741 Fail0.0297 12 276865 2307208 Fail0.0304 12 274762 2289683 Fail0.0311 12 272658 2272150 Fail0.0319 12 270764 2256366 Fail0.0326 12 268871 2240591 Fail0.0333 12 266977 2224808 Fail0.0341 12 265084 2209033 Fail0.0348 12 263401 2195008 Fail0.0355 12 261507 2179225 Fail0.0362 10 259824 2598240 Fail0.0370 10 258141 2581410 Fail0.0377 10 256458 2564580 Fail0.0384 10 254985 2549850 Fail0.0391 10 253302 2533020 Fail0.0399 10 251830 2518300 Fail0.0406 10 250357 2503570 Fail0.0413 10 248884 2488840 Fail0.0420 10 247412 2474120 Fail0.0428 10 245939 2459390 Fail0.0435 10 244466 2444660 Fail0.0442 10 243204 2432040 Fail0.0449 9 241731 2685900 Fail0.0457 9 240469 2671877 Fail0.0464 9 238996 2655511 Fail0.0471 9 237734 2641488 Fail
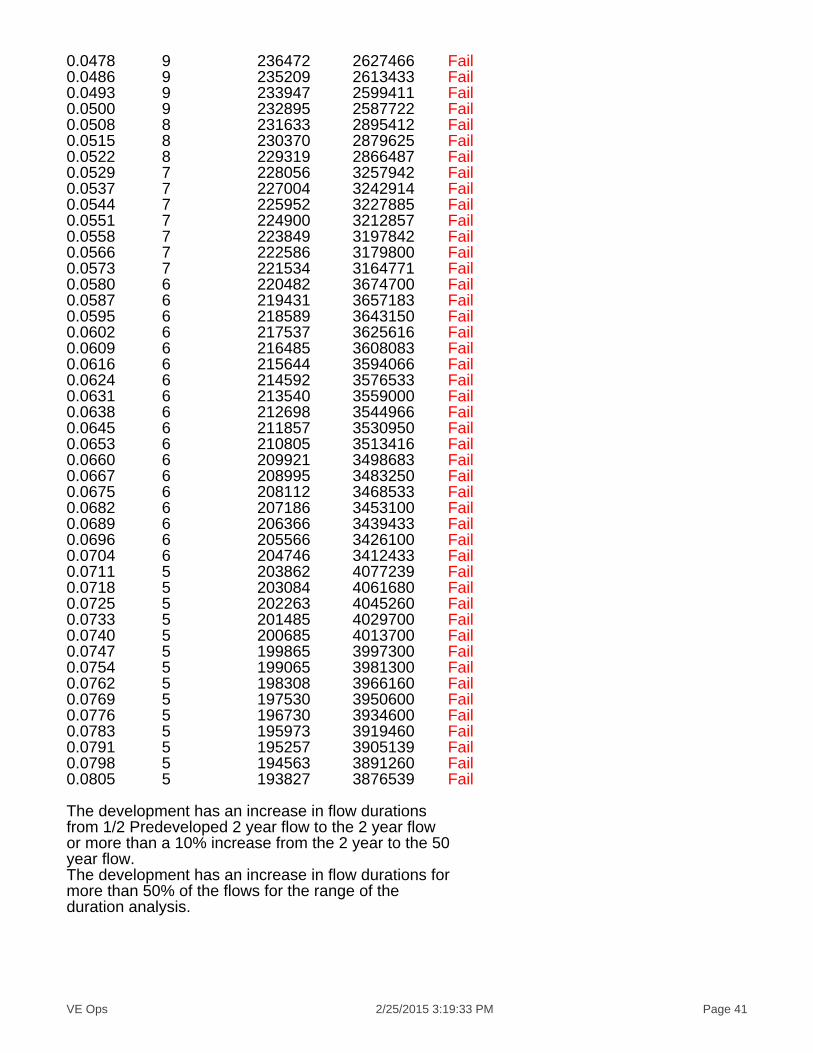
VE Ops 2/25/2015 3:19:33 PM Page 41
0.0478 9 236472 2627466 Fail0.0486 9 235209 2613433 Fail0.0493 9 233947 2599411 Fail0.0500 9 232895 2587722 Fail0.0508 8 231633 2895412 Fail0.0515 8 230370 2879625 Fail0.0522 8 229319 2866487 Fail0.0529 7 228056 3257942 Fail0.0537 7 227004 3242914 Fail0.0544 7 225952 3227885 Fail0.0551 7 224900 3212857 Fail0.0558 7 223849 3197842 Fail0.0566 7 222586 3179800 Fail0.0573 7 221534 3164771 Fail0.0580 6 220482 3674700 Fail0.0587 6 219431 3657183 Fail0.0595 6 218589 3643150 Fail0.0602 6 217537 3625616 Fail0.0609 6 216485 3608083 Fail0.0616 6 215644 3594066 Fail0.0624 6 214592 3576533 Fail0.0631 6 213540 3559000 Fail0.0638 6 212698 3544966 Fail0.0645 6 211857 3530950 Fail0.0653 6 210805 3513416 Fail0.0660 6 209921 3498683 Fail0.0667 6 208995 3483250 Fail0.0675 6 208112 3468533 Fail0.0682 6 207186 3453100 Fail0.0689 6 206366 3439433 Fail0.0696 6 205566 3426100 Fail0.0704 6 204746 3412433 Fail0.0711 5 203862 4077239 Fail0.0718 5 203084 4061680 Fail0.0725 5 202263 4045260 Fail0.0733 5 201485 4029700 Fail0.0740 5 200685 4013700 Fail0.0747 5 199865 3997300 Fail0.0754 5 199065 3981300 Fail0.0762 5 198308 3966160 Fail0.0769 5 197530 3950600 Fail0.0776 5 196730 3934600 Fail0.0783 5 195973 3919460 Fail0.0791 5 195257 3905139 Fail0.0798 5 194563 3891260 Fail0.0805 5 193827 3876539 Fail
The development has an increase in flow durationsfrom 1/2 Predeveloped 2 year flow to the 2 year flowor more than a 10% increase from the 2 year to the 50year flow.The development has an increase in flow durations formore than 50% of the flows for the range of theduration analysis.

VE Ops 2/25/2015 3:19:33 PM Page 42
Water QualityWater Quality BMP Flow and Volume for POC #4On-line facility volume: 1.4917 acre-feetOn-line facility target flow: 2.1329 cfs.Adjusted for 15 min: 2.1329 cfs.Off-line facility target flow: 1.2019 cfs.Adjusted for 15 min: 1.2019 cfs.

VE Ops 2/25/2015 3:19:33 PM Page 43
LID Report
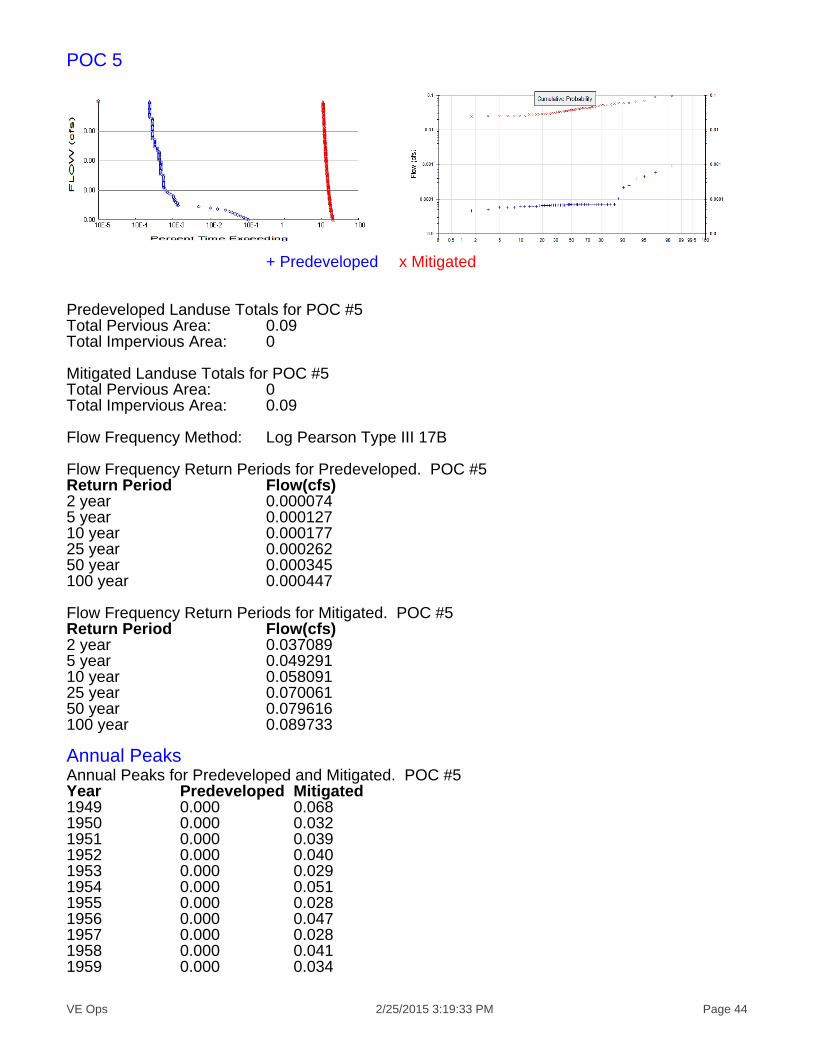
VE Ops 2/25/2015 3:19:33 PM Page 44
POC 5
+ Predeveloped x Mitigated
Predeveloped Landuse Totals for POC #5Total Pervious Area: 0.09Total Impervious Area: 0
Mitigated Landuse Totals for POC #5Total Pervious Area: 0Total Impervious Area: 0.09
Flow Frequency Method: Log Pearson Type III 17B
Flow Frequency Return Periods for Predeveloped. POC #5Return Period Flow(cfs)2 year 0.0000745 year 0.00012710 year 0.00017725 year 0.00026250 year 0.000345100 year 0.000447
Flow Frequency Return Periods for Mitigated. POC #5Return Period Flow(cfs)2 year 0.0370895 year 0.04929110 year 0.05809125 year 0.07006150 year 0.079616100 year 0.089733
Annual PeaksAnnual Peaks for Predeveloped and Mitigated. POC #5Year Predeveloped Mitigated1949 0.000 0.0681950 0.000 0.0321951 0.000 0.0391952 0.000 0.0401953 0.000 0.0291954 0.000 0.0511955 0.000 0.0281956 0.000 0.0471957 0.000 0.0281958 0.000 0.0411959 0.000 0.034
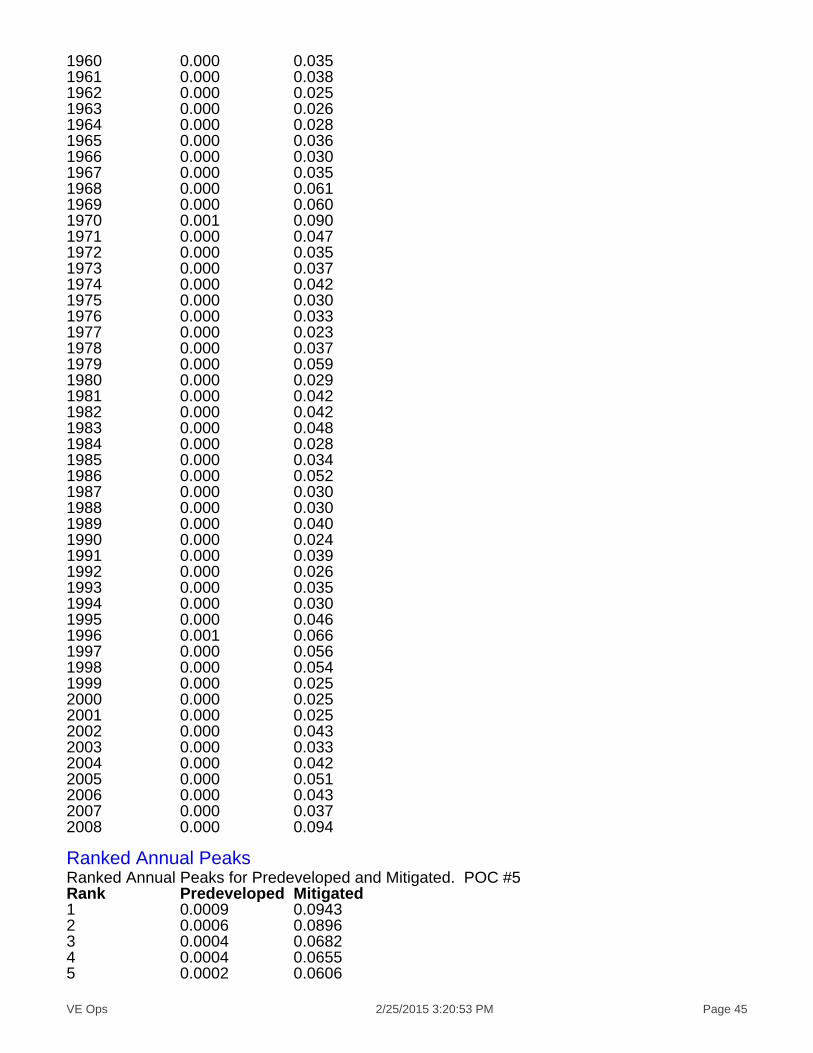
VE Ops 2/25/2015 3:20:53 PM Page 45
1960 0.000 0.0351961 0.000 0.0381962 0.000 0.0251963 0.000 0.0261964 0.000 0.0281965 0.000 0.0361966 0.000 0.0301967 0.000 0.0351968 0.000 0.0611969 0.000 0.0601970 0.001 0.0901971 0.000 0.0471972 0.000 0.0351973 0.000 0.0371974 0.000 0.0421975 0.000 0.0301976 0.000 0.0331977 0.000 0.0231978 0.000 0.0371979 0.000 0.0591980 0.000 0.0291981 0.000 0.0421982 0.000 0.0421983 0.000 0.0481984 0.000 0.0281985 0.000 0.0341986 0.000 0.0521987 0.000 0.0301988 0.000 0.0301989 0.000 0.0401990 0.000 0.0241991 0.000 0.0391992 0.000 0.0261993 0.000 0.0351994 0.000 0.0301995 0.000 0.0461996 0.001 0.0661997 0.000 0.0561998 0.000 0.0541999 0.000 0.0252000 0.000 0.0252001 0.000 0.0252002 0.000 0.0432003 0.000 0.0332004 0.000 0.0422005 0.000 0.0512006 0.000 0.0432007 0.000 0.0372008 0.000 0.094
Ranked Annual PeaksRanked Annual Peaks for Predeveloped and Mitigated. POC #5Rank Predeveloped Mitigated1 0.0009 0.09432 0.0006 0.08963 0.0004 0.06824 0.0004 0.06555 0.0002 0.0606
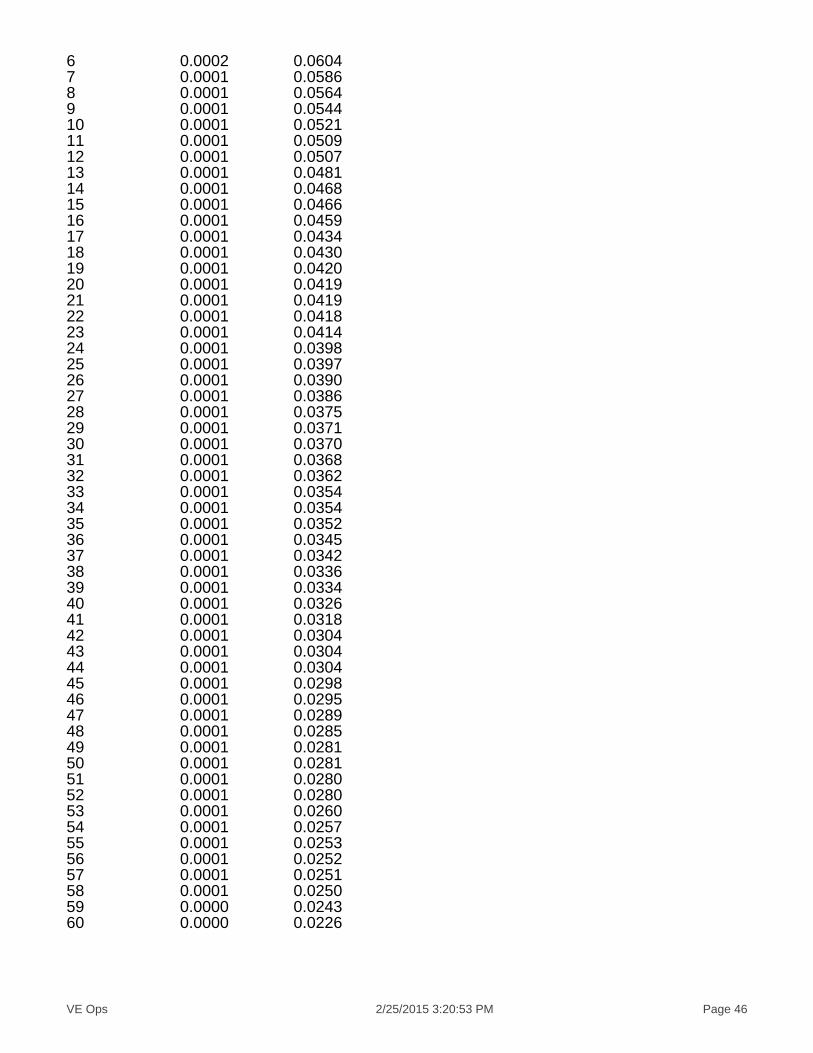
VE Ops 2/25/2015 3:20:53 PM Page 46
6 0.0002 0.06047 0.0001 0.05868 0.0001 0.05649 0.0001 0.054410 0.0001 0.052111 0.0001 0.050912 0.0001 0.050713 0.0001 0.048114 0.0001 0.046815 0.0001 0.046616 0.0001 0.045917 0.0001 0.043418 0.0001 0.043019 0.0001 0.042020 0.0001 0.041921 0.0001 0.041922 0.0001 0.041823 0.0001 0.041424 0.0001 0.039825 0.0001 0.039726 0.0001 0.039027 0.0001 0.038628 0.0001 0.037529 0.0001 0.037130 0.0001 0.037031 0.0001 0.036832 0.0001 0.036233 0.0001 0.035434 0.0001 0.035435 0.0001 0.035236 0.0001 0.034537 0.0001 0.034238 0.0001 0.033639 0.0001 0.033440 0.0001 0.032641 0.0001 0.031842 0.0001 0.030443 0.0001 0.030444 0.0001 0.030445 0.0001 0.029846 0.0001 0.029547 0.0001 0.028948 0.0001 0.028549 0.0001 0.028150 0.0001 0.028151 0.0001 0.028052 0.0001 0.028053 0.0001 0.026054 0.0001 0.025755 0.0001 0.025356 0.0001 0.025257 0.0001 0.025158 0.0001 0.025059 0.0000 0.024360 0.0000 0.0226
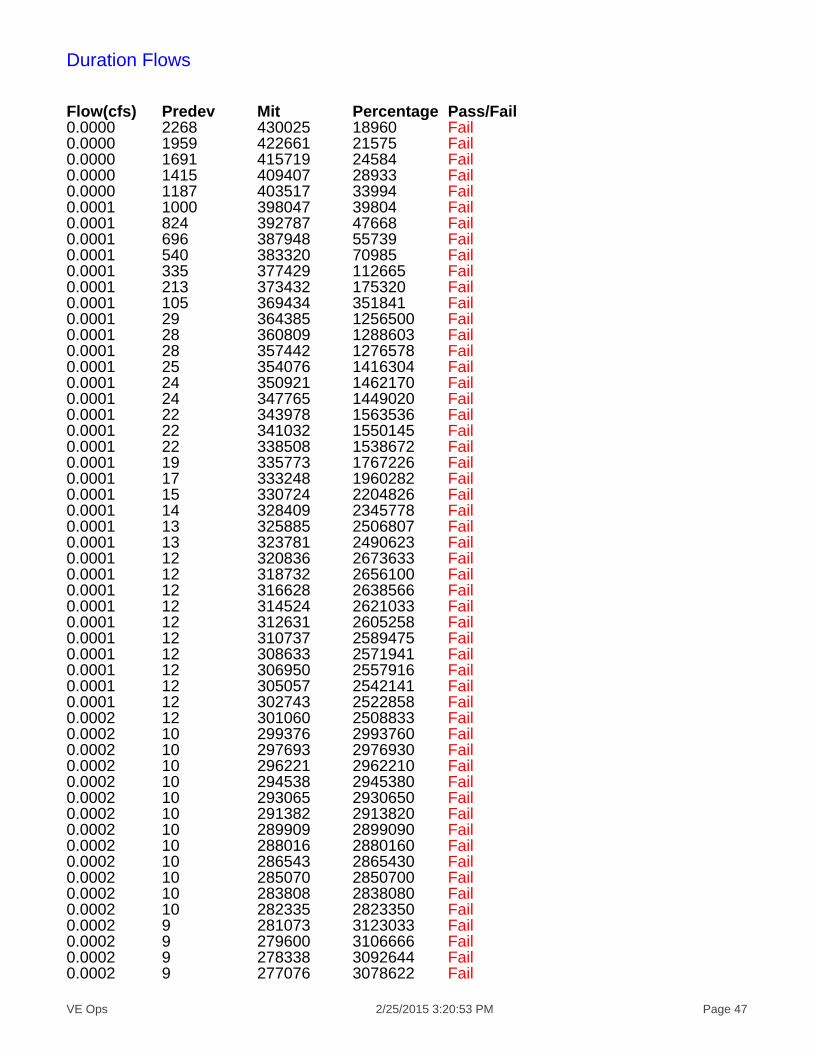
VE Ops 2/25/2015 3:20:53 PM Page 47
Duration Flows
Flow(cfs) Predev Mit Percentage Pass/Fail0.0000 2268 430025 18960 Fail0.0000 1959 422661 21575 Fail0.0000 1691 415719 24584 Fail0.0000 1415 409407 28933 Fail0.0000 1187 403517 33994 Fail0.0001 1000 398047 39804 Fail0.0001 824 392787 47668 Fail0.0001 696 387948 55739 Fail0.0001 540 383320 70985 Fail0.0001 335 377429 112665 Fail0.0001 213 373432 175320 Fail0.0001 105 369434 351841 Fail0.0001 29 364385 1256500 Fail0.0001 28 360809 1288603 Fail0.0001 28 357442 1276578 Fail0.0001 25 354076 1416304 Fail0.0001 24 350921 1462170 Fail0.0001 24 347765 1449020 Fail0.0001 22 343978 1563536 Fail0.0001 22 341032 1550145 Fail0.0001 22 338508 1538672 Fail0.0001 19 335773 1767226 Fail0.0001 17 333248 1960282 Fail0.0001 15 330724 2204826 Fail0.0001 14 328409 2345778 Fail0.0001 13 325885 2506807 Fail0.0001 13 323781 2490623 Fail0.0001 12 320836 2673633 Fail0.0001 12 318732 2656100 Fail0.0001 12 316628 2638566 Fail0.0001 12 314524 2621033 Fail0.0001 12 312631 2605258 Fail0.0001 12 310737 2589475 Fail0.0001 12 308633 2571941 Fail0.0001 12 306950 2557916 Fail0.0001 12 305057 2542141 Fail0.0001 12 302743 2522858 Fail0.0002 12 301060 2508833 Fail0.0002 10 299376 2993760 Fail0.0002 10 297693 2976930 Fail0.0002 10 296221 2962210 Fail0.0002 10 294538 2945380 Fail0.0002 10 293065 2930650 Fail0.0002 10 291382 2913820 Fail0.0002 10 289909 2899090 Fail0.0002 10 288016 2880160 Fail0.0002 10 286543 2865430 Fail0.0002 10 285070 2850700 Fail0.0002 10 283808 2838080 Fail0.0002 10 282335 2823350 Fail0.0002 9 281073 3123033 Fail0.0002 9 279600 3106666 Fail0.0002 9 278338 3092644 Fail0.0002 9 277076 3078622 Fail

VE Ops 2/25/2015 3:20:53 PM Page 48
0.0002 9 275393 3059922 Fail0.0002 9 274130 3045888 Fail0.0002 9 272868 3031866 Fail0.0002 9 271816 3020177 Fail0.0002 8 270554 3381925 Fail0.0002 8 269502 3368775 Fail0.0002 8 268240 3353000 Fail0.0002 7 267188 3816971 Fail0.0002 7 265925 3798928 Fail0.0002 7 264453 3777900 Fail0.0002 7 263611 3765871 Fail0.0002 7 262349 3747842 Fail0.0002 7 261297 3732814 Fail0.0002 7 260245 3717785 Fail0.0002 6 259193 4319883 Fail0.0003 6 258141 4302350 Fail0.0003 6 257300 4288333 Fail0.0003 6 256248 4270800 Fail0.0003 6 254985 4249750 Fail0.0003 6 253933 4232216 Fail0.0003 6 253092 4218200 Fail0.0003 6 252040 4200666 Fail0.0003 6 251198 4186633 Fail0.0003 6 250357 4172616 Fail0.0003 6 249305 4155083 Fail0.0003 6 248464 4141066 Fail0.0003 6 247622 4127033 Fail0.0003 6 246360 4106000 Fail0.0003 6 245518 4091966 Fail0.0003 6 244677 4077950 Fail0.0003 6 243835 4063916 Fail0.0003 6 242994 4049900 Fail0.0003 5 242152 4843040 Fail0.0003 5 241310 4826200 Fail0.0003 5 240469 4809380 Fail0.0003 5 239838 4796760 Fail0.0003 5 238575 4771500 Fail0.0003 5 237734 4754680 Fail0.0003 5 237103 4742060 Fail0.0003 5 236261 4725220 Fail0.0003 5 235630 4712600 Fail0.0003 5 234789 4695780 Fail0.0003 5 233947 4678940 Fail0.0003 5 233316 4666320 Fail0.0003 5 232685 4653700 Fail0.0003 5 231633 4632660 Fail
The development has an increase in flow durationsfrom 1/2 Predeveloped 2 year flow to the 2 year flowor more than a 10% increase from the 2 year to the 50year flow.The development has an increase in flow durations formore than 50% of the flows for the range of theduration analysis.

VE Ops 2/25/2015 3:20:53 PM Page 49
Water QualityWater Quality BMP Flow and Volume for POC #5On-line facility volume: 0.0172 acre-feetOn-line facility target flow: 0.0241 cfs.Adjusted for 15 min: 0.0241 cfs.Off-line facility target flow: 0.0136 cfs.Adjusted for 15 min: 0.0136 cfs.

VE Ops 2/25/2015 3:20:53 PM Page 50
LID Report

VE Ops 2/25/2015 3:20:53 PM Page 51
Model Default Modifications
Total of 0 changes have been made.
PERLND Changes No PERLND changes have been made.
IMPLND ChangesNo IMPLND changes have been made.
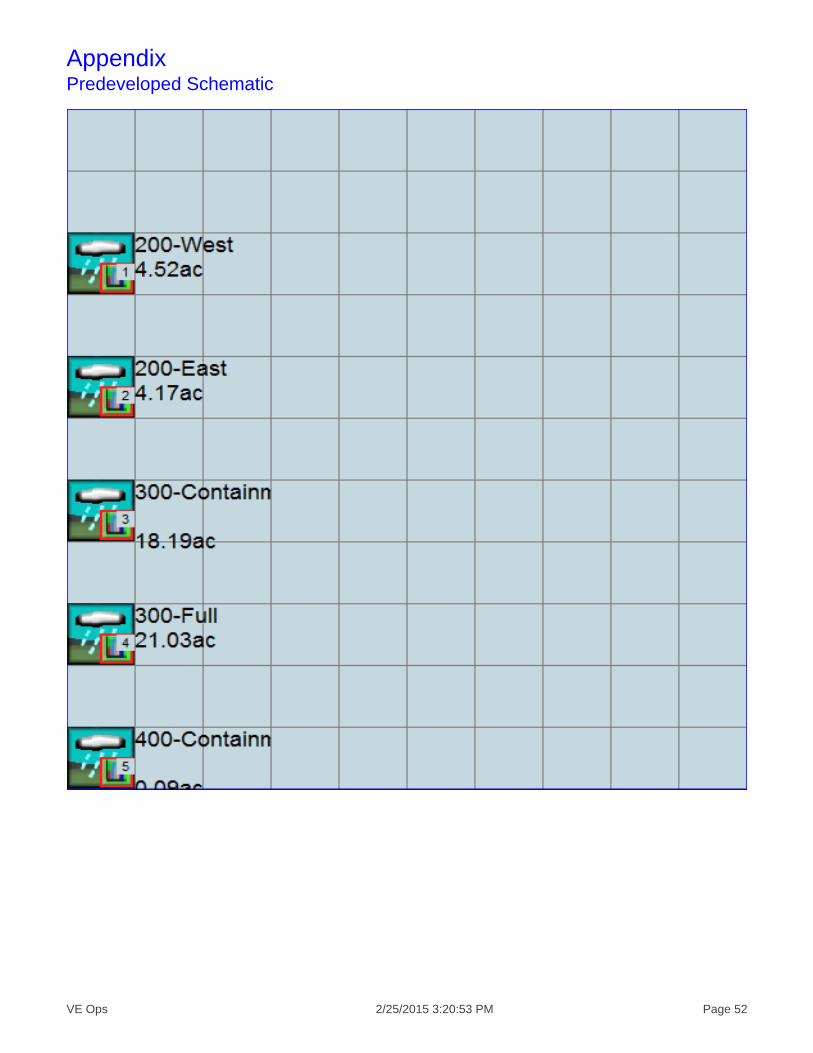
VE Ops 2/25/2015 3:20:53 PM Page 52
AppendixPredeveloped Schematic

VE Ops 2/25/2015 3:20:54 PM Page 53
Mitigated Schematic

VE Ops 2/25/2015 3:20:54 PM Page 54
Predeveloped UCI FileRUN
GLOBAL WWHM4 model simulation START 1948 10 01 END 2008 09 30 RUN INTERP OUTPUT LEVEL 3 0 RESUME 0 RUN 1 UNIT SYSTEM 1END GLOBAL
FILES<File> <Un#> <-----------File Name------------------------------>***<-ID-> ***WDM 26 VE Ops.wdmMESSU 25 PreVE Ops.MES 27 PreVE Ops.L61 28 PreVE Ops.L62 30 POCVE Ops1.dat 31 POCVE Ops2.dat 32 POCVE Ops3.dat 33 POCVE Ops4.dat 34 POCVE Ops5.datEND FILES
OPN SEQUENCE INGRP INDELT 00:15 PERLND 1 COPY 501 COPY 502 COPY 503 COPY 504 COPY 505 DISPLY 1 DISPLY 2 DISPLY 3 DISPLY 4 DISPLY 5 END INGRPEND OPN SEQUENCEDISPLY DISPLY-INFO1 # - #<----------Title----------->***TRAN PIVL DIG1 FIL1 PYR DIG2 FIL2 YRND 1 200-West MAX 1 2 30 9 2 200-East MAX 1 2 31 9 3 300-Containment MAX 1 2 32 9 4 300-Full MAX 1 2 33 9 5 400-Containment MAX 1 2 34 9 END DISPLY-INFO1END DISPLYCOPY TIMESERIES # - # NPT NMN *** 1 1 1 501 1 1 502 1 1 503 1 1 504 1 1 505 1 1 END TIMESERIESEND COPYGENER OPCODE # # OPCD *** END OPCODE PARM # # K *** END PARMEND GENERPERLND
VE Ops 2/25/2015 3:20:54 PM Page 55
GEN-INFO <PLS ><-------Name------->NBLKS Unit-systems Printer *** # - # User t-series Engl Metr *** in out *** 1 A/B, Forest, Flat 1 1 1 1 27 0 END GEN-INFO *** Section PWATER***
ACTIVITY <PLS > ************* Active Sections ***************************** # - # ATMP SNOW PWAT SED PST PWG PQAL MSTL PEST NITR PHOS TRAC *** 1 0 0 1 0 0 0 0 0 0 0 0 0 END ACTIVITY
PRINT-INFO <PLS > ***************** Print-flags ***************************** PIVL PYR # - # ATMP SNOW PWAT SED PST PWG PQAL MSTL PEST NITR PHOS TRAC ********* 1 0 0 4 0 0 0 0 0 0 0 0 0 1 9 END PRINT-INFO
PWAT-PARM1 <PLS > PWATER variable monthly parameter value flags *** # - # CSNO RTOP UZFG VCS VUZ VNN VIFW VIRC VLE INFC HWT *** 1 0 0 0 0 0 0 0 0 0 0 0 END PWAT-PARM1
PWAT-PARM2 <PLS > PWATER input info: Part 2 *** # - # ***FOREST LZSN INFILT LSUR SLSUR KVARY AGWRC 1 0 5 2 400 0.05 0.3 0.996 END PWAT-PARM2
PWAT-PARM3 <PLS > PWATER input info: Part 3 *** # - # ***PETMAX PETMIN INFEXP INFILD DEEPFR BASETP AGWETP 1 0 0 2 2 0 0 0 END PWAT-PARM3 PWAT-PARM4 <PLS > PWATER input info: Part 4 *** # - # CEPSC UZSN NSUR INTFW IRC LZETP *** 1 0.2 0.5 0.35 0 0.7 0.7 END PWAT-PARM4
PWAT-STATE1 <PLS > *** Initial conditions at start of simulation ran from 1990 to end of 1992 (pat 1-11-95) RUN 21 *** # - # *** CEPS SURS UZS IFWS LZS AGWS GWVS 1 0 0 0 0 3 1 0 END PWAT-STATE1
END PERLND
IMPLND GEN-INFO <PLS ><-------Name-------> Unit-systems Printer *** # - # User t-series Engl Metr *** in out *** END GEN-INFO *** Section IWATER***
ACTIVITY <PLS > ************* Active Sections ***************************** # - # ATMP SNOW IWAT SLD IWG IQAL *** END ACTIVITY
PRINT-INFO <ILS > ******** Print-flags ******** PIVL PYR # - # ATMP SNOW IWAT SLD IWG IQAL ********* END PRINT-INFO
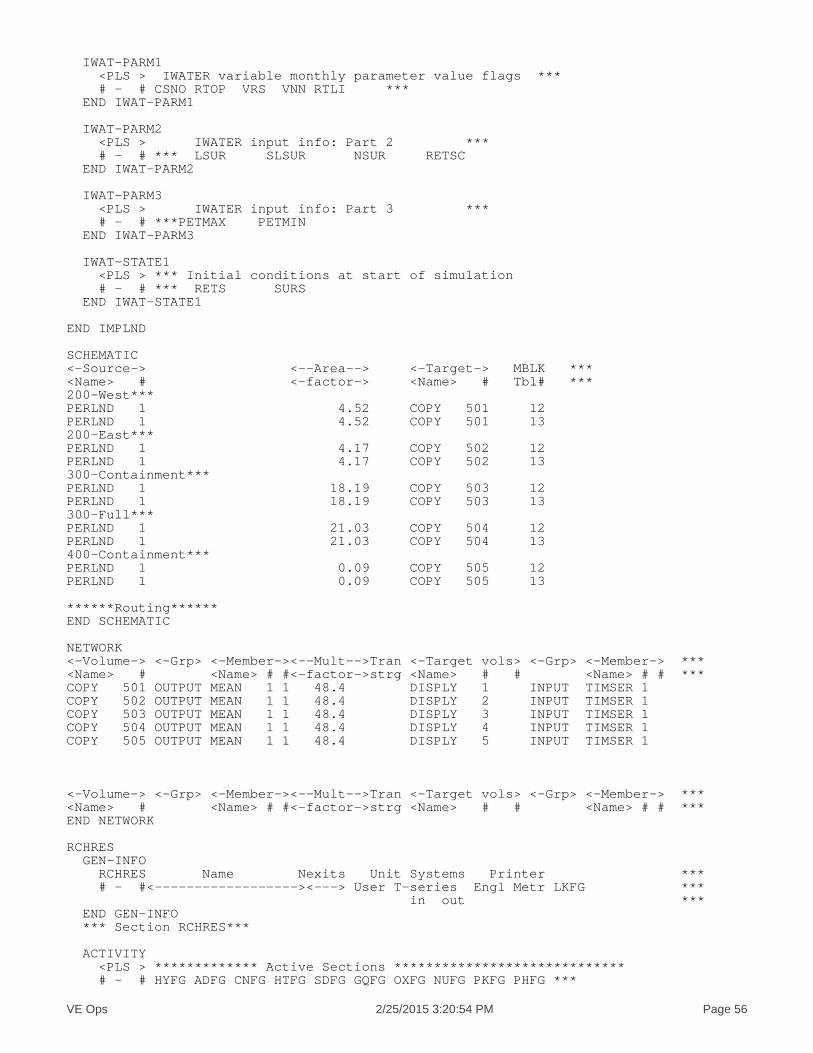
VE Ops 2/25/2015 3:20:54 PM Page 56
IWAT-PARM1 <PLS > IWATER variable monthly parameter value flags *** # - # CSNO RTOP VRS VNN RTLI *** END IWAT-PARM1
IWAT-PARM2 <PLS > IWATER input info: Part 2 *** # - # *** LSUR SLSUR NSUR RETSC END IWAT-PARM2
IWAT-PARM3 <PLS > IWATER input info: Part 3 *** # - # ***PETMAX PETMIN END IWAT-PARM3
IWAT-STATE1 <PLS > *** Initial conditions at start of simulation # - # *** RETS SURS END IWAT-STATE1
END IMPLND
SCHEMATIC<-Source-> <--Area--> <-Target-> MBLK ***<Name> # <-factor-> <Name> # Tbl# ***200-West***PERLND 1 4.52 COPY 501 12PERLND 1 4.52 COPY 501 13200-East***PERLND 1 4.17 COPY 502 12PERLND 1 4.17 COPY 502 13300-Containment***PERLND 1 18.19 COPY 503 12PERLND 1 18.19 COPY 503 13300-Full***PERLND 1 21.03 COPY 504 12PERLND 1 21.03 COPY 504 13400-Containment***PERLND 1 0.09 COPY 505 12PERLND 1 0.09 COPY 505 13
******Routing******END SCHEMATIC
NETWORK<-Volume-> <-Grp> <-Member-><--Mult-->Tran <-Target vols> <-Grp> <-Member-> ***<Name> # <Name> # #<-factor->strg <Name> # # <Name> # # ***COPY 501 OUTPUT MEAN 1 1 48.4 DISPLY 1 INPUT TIMSER 1COPY 502 OUTPUT MEAN 1 1 48.4 DISPLY 2 INPUT TIMSER 1COPY 503 OUTPUT MEAN 1 1 48.4 DISPLY 3 INPUT TIMSER 1COPY 504 OUTPUT MEAN 1 1 48.4 DISPLY 4 INPUT TIMSER 1COPY 505 OUTPUT MEAN 1 1 48.4 DISPLY 5 INPUT TIMSER 1
<-Volume-> <-Grp> <-Member-><--Mult-->Tran <-Target vols> <-Grp> <-Member-> ***<Name> # <Name> # #<-factor->strg <Name> # # <Name> # # ***END NETWORK
RCHRES GEN-INFO RCHRES Name Nexits Unit Systems Printer *** # - #<------------------><---> User T-series Engl Metr LKFG *** in out *** END GEN-INFO *** Section RCHRES***
ACTIVITY <PLS > ************* Active Sections ***************************** # - # HYFG ADFG CNFG HTFG SDFG GQFG OXFG NUFG PKFG PHFG ***
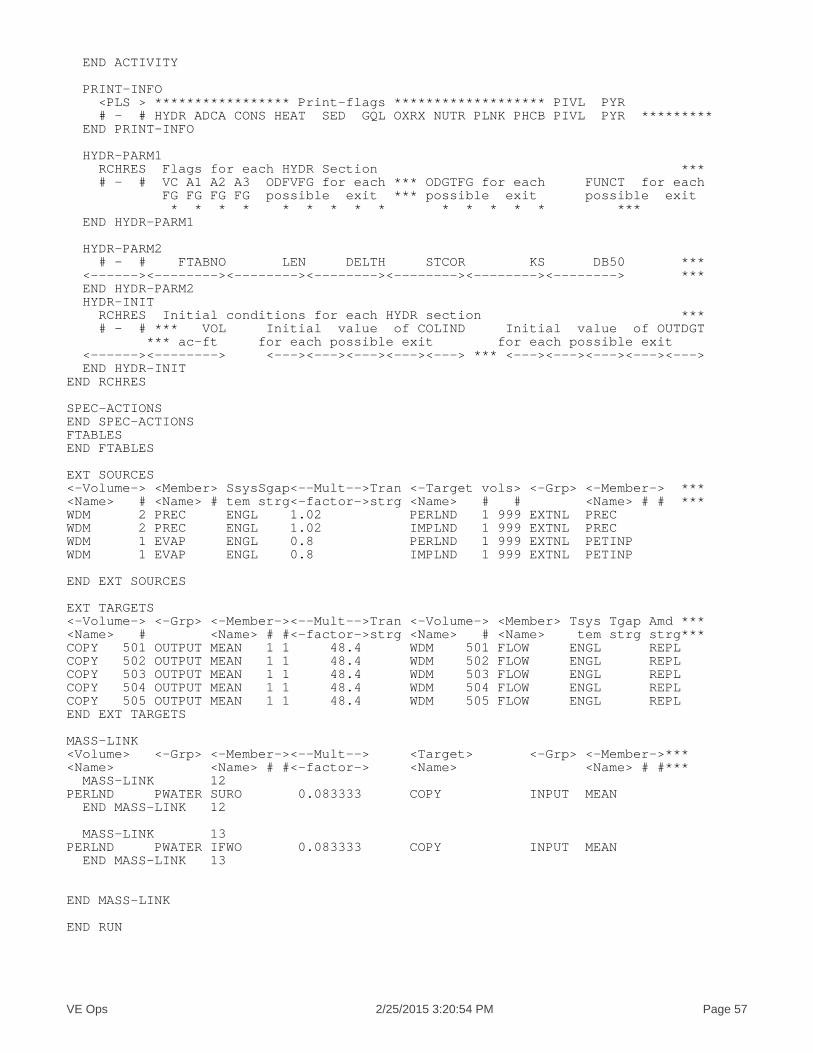
VE Ops 2/25/2015 3:20:54 PM Page 57
END ACTIVITY
PRINT-INFO <PLS > ***************** Print-flags ******************* PIVL PYR # - # HYDR ADCA CONS HEAT SED GQL OXRX NUTR PLNK PHCB PIVL PYR ********* END PRINT-INFO
HYDR-PARM1 RCHRES Flags for each HYDR Section *** # - # VC A1 A2 A3 ODFVFG for each *** ODGTFG for each FUNCT for each FG FG FG FG possible exit *** possible exit possible exit * * * * * * * * * * * * * * *** END HYDR-PARM1
HYDR-PARM2 # - # FTABNO LEN DELTH STCOR KS DB50 *** <------><--------><--------><--------><--------><--------><--------> *** END HYDR-PARM2 HYDR-INIT RCHRES Initial conditions for each HYDR section *** # - # *** VOL Initial value of COLIND Initial value of OUTDGT *** ac-ft for each possible exit for each possible exit <------><--------> <---><---><---><---><---> *** <---><---><---><---><---> END HYDR-INITEND RCHRES
SPEC-ACTIONSEND SPEC-ACTIONSFTABLESEND FTABLES
EXT SOURCES<-Volume-> <Member> SsysSgap<--Mult-->Tran <-Target vols> <-Grp> <-Member-> ***<Name> # <Name> # tem strg<-factor->strg <Name> # # <Name> # # ***WDM 2 PREC ENGL 1.02 PERLND 1 999 EXTNL PRECWDM 2 PREC ENGL 1.02 IMPLND 1 999 EXTNL PRECWDM 1 EVAP ENGL 0.8 PERLND 1 999 EXTNL PETINPWDM 1 EVAP ENGL 0.8 IMPLND 1 999 EXTNL PETINP
END EXT SOURCES
EXT TARGETS<-Volume-> <-Grp> <-Member-><--Mult-->Tran <-Volume-> <Member> Tsys Tgap Amd ***<Name> # <Name> # #<-factor->strg <Name> # <Name> tem strg strg***COPY 501 OUTPUT MEAN 1 1 48.4 WDM 501 FLOW ENGL REPLCOPY 502 OUTPUT MEAN 1 1 48.4 WDM 502 FLOW ENGL REPLCOPY 503 OUTPUT MEAN 1 1 48.4 WDM 503 FLOW ENGL REPLCOPY 504 OUTPUT MEAN 1 1 48.4 WDM 504 FLOW ENGL REPLCOPY 505 OUTPUT MEAN 1 1 48.4 WDM 505 FLOW ENGL REPLEND EXT TARGETS
MASS-LINK<Volume> <-Grp> <-Member-><--Mult--> <Target> <-Grp> <-Member->***<Name> <Name> # #<-factor-> <Name> <Name> # #*** MASS-LINK 12PERLND PWATER SURO 0.083333 COPY INPUT MEAN END MASS-LINK 12
MASS-LINK 13PERLND PWATER IFWO 0.083333 COPY INPUT MEAN END MASS-LINK 13
END MASS-LINK
END RUN
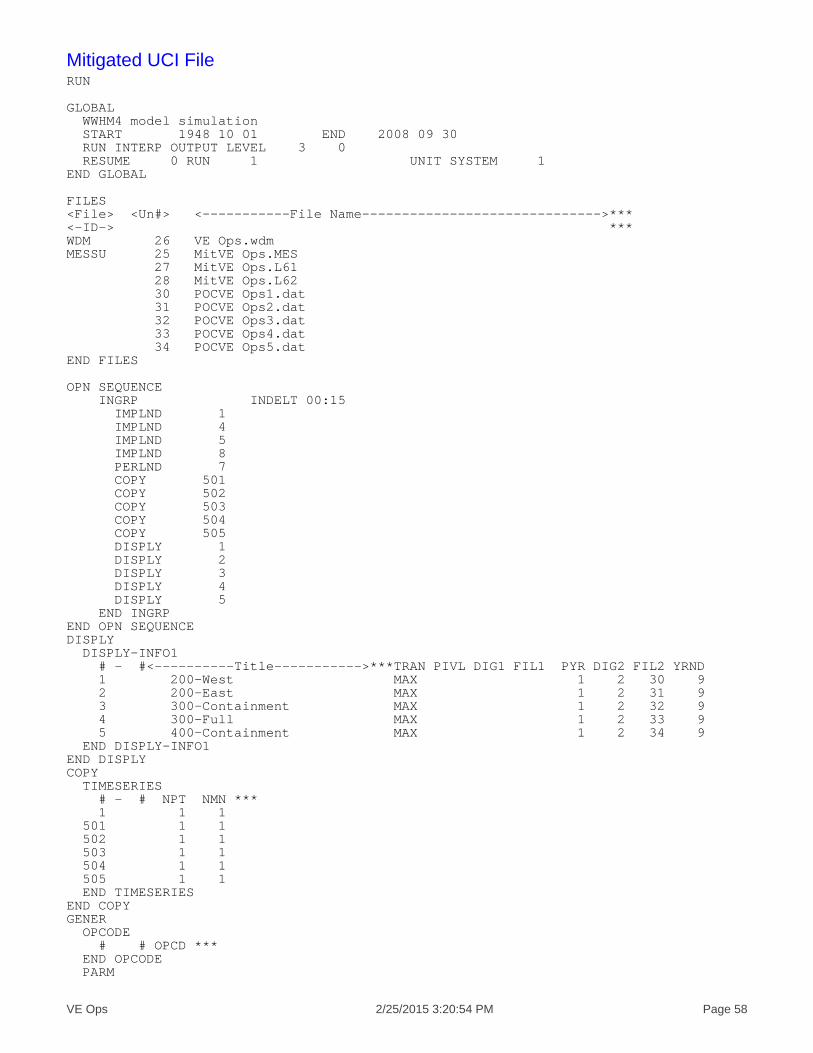
VE Ops 2/25/2015 3:20:54 PM Page 58
Mitigated UCI FileRUN
GLOBAL WWHM4 model simulation START 1948 10 01 END 2008 09 30 RUN INTERP OUTPUT LEVEL 3 0 RESUME 0 RUN 1 UNIT SYSTEM 1END GLOBAL
FILES<File> <Un#> <-----------File Name------------------------------>***<-ID-> ***WDM 26 VE Ops.wdmMESSU 25 MitVE Ops.MES 27 MitVE Ops.L61 28 MitVE Ops.L62 30 POCVE Ops1.dat 31 POCVE Ops2.dat 32 POCVE Ops3.dat 33 POCVE Ops4.dat 34 POCVE Ops5.datEND FILES
OPN SEQUENCE INGRP INDELT 00:15 IMPLND 1 IMPLND 4 IMPLND 5 IMPLND 8 PERLND 7 COPY 501 COPY 502 COPY 503 COPY 504 COPY 505 DISPLY 1 DISPLY 2 DISPLY 3 DISPLY 4 DISPLY 5 END INGRPEND OPN SEQUENCEDISPLY DISPLY-INFO1 # - #<----------Title----------->***TRAN PIVL DIG1 FIL1 PYR DIG2 FIL2 YRND 1 200-West MAX 1 2 30 9 2 200-East MAX 1 2 31 9 3 300-Containment MAX 1 2 32 9 4 300-Full MAX 1 2 33 9 5 400-Containment MAX 1 2 34 9 END DISPLY-INFO1END DISPLYCOPY TIMESERIES # - # NPT NMN *** 1 1 1 501 1 1 502 1 1 503 1 1 504 1 1 505 1 1 END TIMESERIESEND COPYGENER OPCODE # # OPCD *** END OPCODE PARM

VE Ops 2/25/2015 3:20:54 PM Page 59
# # K *** END PARMEND GENERPERLND GEN-INFO <PLS ><-------Name------->NBLKS Unit-systems Printer *** # - # User t-series Engl Metr *** in out *** 7 A/B, Lawn, Flat 1 1 1 1 27 0 END GEN-INFO *** Section PWATER***
ACTIVITY <PLS > ************* Active Sections ***************************** # - # ATMP SNOW PWAT SED PST PWG PQAL MSTL PEST NITR PHOS TRAC *** 7 0 0 1 0 0 0 0 0 0 0 0 0 END ACTIVITY
PRINT-INFO <PLS > ***************** Print-flags ***************************** PIVL PYR # - # ATMP SNOW PWAT SED PST PWG PQAL MSTL PEST NITR PHOS TRAC ********* 7 0 0 4 0 0 0 0 0 0 0 0 0 1 9 END PRINT-INFO
PWAT-PARM1 <PLS > PWATER variable monthly parameter value flags *** # - # CSNO RTOP UZFG VCS VUZ VNN VIFW VIRC VLE INFC HWT *** 7 0 0 0 0 0 0 0 0 0 0 0 END PWAT-PARM1
PWAT-PARM2 <PLS > PWATER input info: Part 2 *** # - # ***FOREST LZSN INFILT LSUR SLSUR KVARY AGWRC 7 0 5 0.8 400 0.05 0.3 0.996 END PWAT-PARM2
PWAT-PARM3 <PLS > PWATER input info: Part 3 *** # - # ***PETMAX PETMIN INFEXP INFILD DEEPFR BASETP AGWETP 7 0 0 2 2 0 0 0 END PWAT-PARM3 PWAT-PARM4 <PLS > PWATER input info: Part 4 *** # - # CEPSC UZSN NSUR INTFW IRC LZETP *** 7 0.1 0.5 0.25 0 0.7 0.25 END PWAT-PARM4
PWAT-STATE1 <PLS > *** Initial conditions at start of simulation ran from 1990 to end of 1992 (pat 1-11-95) RUN 21 *** # - # *** CEPS SURS UZS IFWS LZS AGWS GWVS 7 0 0 0 0 3 1 0 END PWAT-STATE1
END PERLND
IMPLND GEN-INFO <PLS ><-------Name-------> Unit-systems Printer *** # - # User t-series Engl Metr *** in out *** 1 ROADS/FLAT 1 1 1 27 0 4 ROOF TOPS/FLAT 1 1 1 27 0 5 DRIVEWAYS/FLAT 1 1 1 27 0 8 SIDEWALKS/FLAT 1 1 1 27 0 END GEN-INFO *** Section IWATER***
ACTIVITY <PLS > ************* Active Sections *****************************
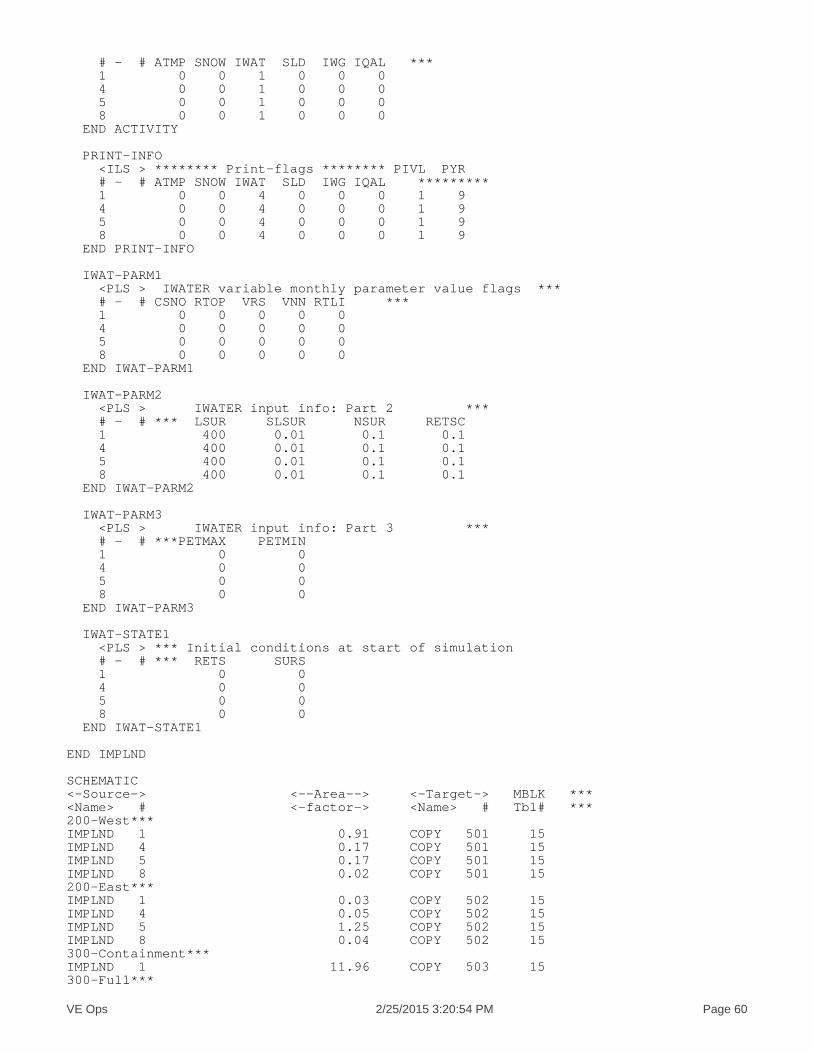
VE Ops 2/25/2015 3:20:54 PM Page 60
# - # ATMP SNOW IWAT SLD IWG IQAL *** 1 0 0 1 0 0 0 4 0 0 1 0 0 0 5 0 0 1 0 0 0 8 0 0 1 0 0 0 END ACTIVITY
PRINT-INFO <ILS > ******** Print-flags ******** PIVL PYR # - # ATMP SNOW IWAT SLD IWG IQAL ********* 1 0 0 4 0 0 0 1 9 4 0 0 4 0 0 0 1 9 5 0 0 4 0 0 0 1 9 8 0 0 4 0 0 0 1 9 END PRINT-INFO
IWAT-PARM1 <PLS > IWATER variable monthly parameter value flags *** # - # CSNO RTOP VRS VNN RTLI *** 1 0 0 0 0 0 4 0 0 0 0 0 5 0 0 0 0 0 8 0 0 0 0 0 END IWAT-PARM1
IWAT-PARM2 <PLS > IWATER input info: Part 2 *** # - # *** LSUR SLSUR NSUR RETSC 1 400 0.01 0.1 0.1 4 400 0.01 0.1 0.1 5 400 0.01 0.1 0.1 8 400 0.01 0.1 0.1 END IWAT-PARM2
IWAT-PARM3 <PLS > IWATER input info: Part 3 *** # - # ***PETMAX PETMIN 1 0 0 4 0 0 5 0 0 8 0 0 END IWAT-PARM3
IWAT-STATE1 <PLS > *** Initial conditions at start of simulation # - # *** RETS SURS 1 0 0 4 0 0 5 0 0 8 0 0 END IWAT-STATE1
END IMPLND
SCHEMATIC<-Source-> <--Area--> <-Target-> MBLK ***<Name> # <-factor-> <Name> # Tbl# ***200-West***IMPLND 1 0.91 COPY 501 15IMPLND 4 0.17 COPY 501 15IMPLND 5 0.17 COPY 501 15IMPLND 8 0.02 COPY 501 15200-East***IMPLND 1 0.03 COPY 502 15IMPLND 4 0.05 COPY 502 15IMPLND 5 1.25 COPY 502 15IMPLND 8 0.04 COPY 502 15300-Containment***IMPLND 1 11.96 COPY 503 15300-Full***
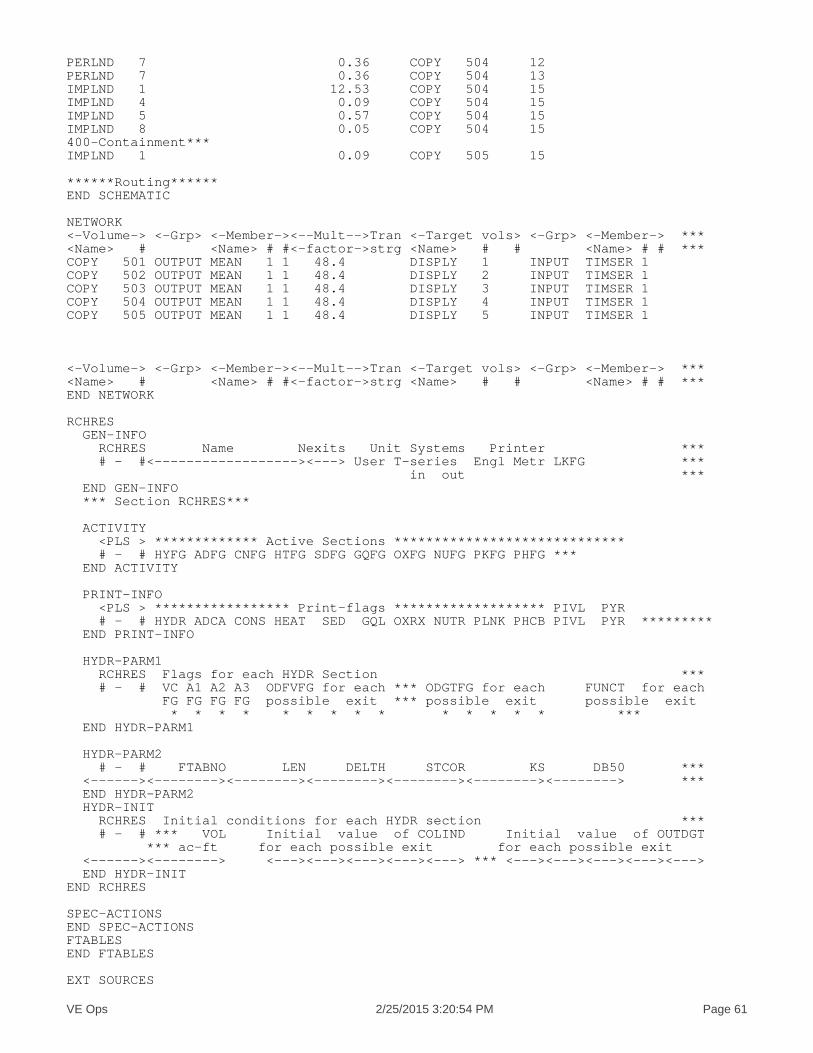
VE Ops 2/25/2015 3:20:54 PM Page 61
PERLND 7 0.36 COPY 504 12PERLND 7 0.36 COPY 504 13IMPLND 1 12.53 COPY 504 15IMPLND 4 0.09 COPY 504 15IMPLND 5 0.57 COPY 504 15IMPLND 8 0.05 COPY 504 15400-Containment***IMPLND 1 0.09 COPY 505 15
******Routing******END SCHEMATIC
NETWORK<-Volume-> <-Grp> <-Member-><--Mult-->Tran <-Target vols> <-Grp> <-Member-> ***<Name> # <Name> # #<-factor->strg <Name> # # <Name> # # ***COPY 501 OUTPUT MEAN 1 1 48.4 DISPLY 1 INPUT TIMSER 1COPY 502 OUTPUT MEAN 1 1 48.4 DISPLY 2 INPUT TIMSER 1COPY 503 OUTPUT MEAN 1 1 48.4 DISPLY 3 INPUT TIMSER 1COPY 504 OUTPUT MEAN 1 1 48.4 DISPLY 4 INPUT TIMSER 1COPY 505 OUTPUT MEAN 1 1 48.4 DISPLY 5 INPUT TIMSER 1
<-Volume-> <-Grp> <-Member-><--Mult-->Tran <-Target vols> <-Grp> <-Member-> ***<Name> # <Name> # #<-factor->strg <Name> # # <Name> # # ***END NETWORK
RCHRES GEN-INFO RCHRES Name Nexits Unit Systems Printer *** # - #<------------------><---> User T-series Engl Metr LKFG *** in out *** END GEN-INFO *** Section RCHRES***
ACTIVITY <PLS > ************* Active Sections ***************************** # - # HYFG ADFG CNFG HTFG SDFG GQFG OXFG NUFG PKFG PHFG *** END ACTIVITY
PRINT-INFO <PLS > ***************** Print-flags ******************* PIVL PYR # - # HYDR ADCA CONS HEAT SED GQL OXRX NUTR PLNK PHCB PIVL PYR ********* END PRINT-INFO
HYDR-PARM1 RCHRES Flags for each HYDR Section *** # - # VC A1 A2 A3 ODFVFG for each *** ODGTFG for each FUNCT for each FG FG FG FG possible exit *** possible exit possible exit * * * * * * * * * * * * * * *** END HYDR-PARM1
HYDR-PARM2 # - # FTABNO LEN DELTH STCOR KS DB50 *** <------><--------><--------><--------><--------><--------><--------> *** END HYDR-PARM2 HYDR-INIT RCHRES Initial conditions for each HYDR section *** # - # *** VOL Initial value of COLIND Initial value of OUTDGT *** ac-ft for each possible exit for each possible exit <------><--------> <---><---><---><---><---> *** <---><---><---><---><---> END HYDR-INITEND RCHRES
SPEC-ACTIONSEND SPEC-ACTIONSFTABLESEND FTABLES
EXT SOURCES

VE Ops 2/25/2015 3:20:54 PM Page 62
<-Volume-> <Member> SsysSgap<--Mult-->Tran <-Target vols> <-Grp> <-Member-> ***<Name> # <Name> # tem strg<-factor->strg <Name> # # <Name> # # ***WDM 2 PREC ENGL 1.02 PERLND 1 999 EXTNL PRECWDM 2 PREC ENGL 1.02 IMPLND 1 999 EXTNL PRECWDM 1 EVAP ENGL 0.8 PERLND 1 999 EXTNL PETINPWDM 1 EVAP ENGL 0.8 IMPLND 1 999 EXTNL PETINP
END EXT SOURCES
EXT TARGETS<-Volume-> <-Grp> <-Member-><--Mult-->Tran <-Volume-> <Member> Tsys Tgap Amd ***<Name> # <Name> # #<-factor->strg <Name> # <Name> tem strg strg***COPY 1 OUTPUT MEAN 1 1 48.4 WDM 701 FLOW ENGL REPLCOPY 501 OUTPUT MEAN 1 1 48.4 WDM 801 FLOW ENGL REPLCOPY 2 OUTPUT MEAN 1 1 48.4 WDM 702 FLOW ENGL REPLCOPY 502 OUTPUT MEAN 1 1 48.4 WDM 802 FLOW ENGL REPLCOPY 3 OUTPUT MEAN 1 1 48.4 WDM 703 FLOW ENGL REPLCOPY 503 OUTPUT MEAN 1 1 48.4 WDM 803 FLOW ENGL REPLCOPY 4 OUTPUT MEAN 1 1 48.4 WDM 704 FLOW ENGL REPLCOPY 504 OUTPUT MEAN 1 1 48.4 WDM 804 FLOW ENGL REPLCOPY 5 OUTPUT MEAN 1 1 48.4 WDM 705 FLOW ENGL REPLCOPY 505 OUTPUT MEAN 1 1 48.4 WDM 805 FLOW ENGL REPLEND EXT TARGETS
MASS-LINK<Volume> <-Grp> <-Member-><--Mult--> <Target> <-Grp> <-Member->***<Name> <Name> # #<-factor-> <Name> <Name> # #*** MASS-LINK 12PERLND PWATER SURO 0.083333 COPY INPUT MEAN END MASS-LINK 12
MASS-LINK 13PERLND PWATER IFWO 0.083333 COPY INPUT MEAN END MASS-LINK 13
MASS-LINK 15IMPLND IWATER SURO 0.083333 COPY INPUT MEAN END MASS-LINK 15
END MASS-LINK
END RUN

VE Ops 2/25/2015 3:20:54 PM Page 63
Predeveloped HSPF Message File

VE Ops 2/25/2015 3:20:54 PM Page 64
Mitigated HSPF Message File
VE Ops 2/25/2015 3:20:54 PM Page 65
DisclaimerLegal NoticeThis program and accompanying documentation are provided 'as-is' without warranty of any kind. The entire risk regarding the performance and results of this program is assumed by End User. Clear Creek Solutions Inc. and the governmental licensee or sublicensees disclaim all warranties, either expressed or implied, including but not limited to implied warranties of program and accompanying documentation. In no event shall Clear Creek Solutions Inc. be liable for any damages whatsoever (including without limitation to damages for loss of business profits, loss of business information, business interruption, and the like) arising out of the use of, or inability to use this program even if Clear Creek Solutions Inc. or their authorized representatives have been advised of the possibility of such damages. Software Copyright © by : Clear Creek Solutions, Inc. 2005-2013; All Rights Reserved.
Clear Creek Solutions, Inc.6200 Capitol Blvd. Ste FOlympia, WA. 98501Toll Free 1(866)943-0304Local (360)943-0304
www.clearcreeksolutions.com
