van ness avenue bus rapid transit (brt) citizens advisory ... · van ness avenue bus rapid transit...
TRANSCRIPT
Van Ness Avenue Bus Rapid Transit (BRT) Citizens Advisory Committee (CAC)
Meeting 25
Date: 5:00 p.m., Tuesday, July 9, 2013 Location: 1455 Market Street, 22nd Floor
5:00 1. Committee Meeting Call to Order
5:05 2. Select CAC Moderator for Meeting #25 and Meeting #26 – ACTION
5:10 3. Adoption of Minutes of the November May 1st, 2012 Meeting – ACTION*
5:15 4. Public Availability of the Van Ness Avenue Bus Rapid Transit Final Environmental Impact Statement/Environmental Impact Report – INFORMATION *
After significant technical analysis following selection of the LPA – center running right side
platforms with limited left turns – by both the SFCTA and SFMTA boards last Spring, the
project team has synthesized the feedback received from partner agencies and members of the
public, and have made Final Environmental Impact Statement/Environmental Impact Report
(EIS/EIR) publicly available. The Authority Board is scheduled to certify the final
Environmental Impact Report (the CEQA – State of California – part of the document) and
approve the Van Ness Avenue BRT Project in September. This will be followed by
consideration of project approvals by the SFMTA board, and finally by federal approval in the
form of a Federal Transit Administration “Record of Decision” (ROD). The Final EIS/EIR
confirms that the environmental impacts of the LPA were represented through the alternatives
included in the Draft EIS/EIR. The purpose of this item is to provide an overview of the Final
EIS/EIR to the committee as well as the process for project approval. The project team is also
seeking feedback on the notification process underway. This is an information item.
5:50 5. Overview of Conceptual Engineering Report, Final Design, and Construction – INFORMATION
Upon completion of the environmental process, lead of the Van Ness Avenue BRT Project will
transfer from the Authority to the SFMTA for project engineering, design, and implementation.
During these phases, the project will address outstanding issues such as platform/station
design, the project construction plan (including a traffic management plan), landscaping,
branding, vehicle procurement and features, lighting/poles, and further Caltrans approvals. In
addition, the project will continue to perform significant outreach, including the formation of a
new Citizens Advisory Committee. The purpose of this item is to provide an overview to the
committee on the design and construction process and to seek feedback on outreach for these
ongoing phases. This is an information item.
6:15 6. Public Comment
6:30 7. Adjourn
* - Materials Attached + - Materials Available at Meeting
Van Ness Avenue Bus Rapid Transit (BRT) Citizens Advisory Committee (CAC)
Meeting 24
Date: 5:30 p.m., Tuesday, May 1, 2012 Location: 100 Van Ness Avenue, 26th Floor
1. Committee Meeting Call to Order
The committee was called to order by Michelle Brant at 5:37 p.m. Van Ness CAC members present were Michelle Brant (moderator), Bob Bardell, Dave Goggin, Jason Henderson, Lawrence Li, Steve Kendrick, and Henry Pan, Howard Strassner, Marla Taylor. Staff present included Michael Schwartz, Lee Saage, Shari Tavafrashti, Colin Dentel-Post, and Bob Masys of the Authority; and Paul Bignardi of SFMTA.
2. Adoption of Minutes of the November 15th, 2011 Meeting – ACTION *
Michelle Brant asked Marla Taylor if the original meeting minutes for the April 22nd, 2011 meeting correctly reflected her statement regarding time savings. Marla Taylor responded that the original meeting minutes were correct. Michael Schwartz said the original minutes would be considered the final version.
Jason Henderson requested a correction to the minutes from the November 15, 2011 meeting. He said that he wanted to express that the discussion on mitigations in the Draft EIS/EIR was better than discussions of mitigations Planning had produced in their previous documents. Michael Schwartz confirmed that the minutes would be updated.
Dave Goggin identified a typo on page 5. Michael Schwartz said the minutes would be updated.
Howard Strassner made a motion to approve the minutes with the noted corrections. Jason Henderson seconded the motion.
There was no public comment.
The item passed unanimously.
3. Project Status and Schedule – INFORMATION
Michael Schwartz, Transportation Planner, presented the item.
Steve Kendrick asked if the San Francisco Board of Supervisors would certify the EIR. Michael Schwartz responded that the members of the Board of Supervisors, acting as commissioners of the Authority Board, would certify the EIR. He said that the SFMTA Board would also act to select the Locally Preferred Alternative and that the Federal Transit Administration would also approve the Final EIS with a Record of Decision.
Howard Strassner asked when construction would begin on the project. Michael
Schwartz responded that staff is working on ways to expedite the schedule and construction was currently anticipated to begin in 2015.
There was no public comment.
4. Staff Recommendation of a Locally Preferred Alternative – ACTION
Michael Schwartz, Transportation Planner, presented the item, per the staff memorandum.
Michelle Brant said there was no visualization for the No Build Alternative. Michael Schwartz said the No Build Alternative would look similar to existing conditions, since the planned improvements would not have a different look.
Steve Kendrick asked to list the features included in the No Build Alternative. Michael Schwartz read the features noted in Table 2-2 of the Draft EIS/EIR. Steve Kendrick asked if the No Build Alternative would provide level boarding. Michael Schwartz said the No Build Alternative would not provide level boarding because it would require raised station platforms that were considered part of the BRT.
Steve Kendrick asked if transit signal priority was included in the No Build Alternative. Michael Schwartz said that transit signal priority was only modeled as part of the build alternatives.
Steve Kendrick asked if there would be fewer stops in the No Build Alternative. Michael Schwartz said no.
Steve Kendrick asked if there had been a calculation of improvement with the No Build Alternative. Michael Schwartz said the performance of the No Build Alternative was shown in Chapter 10 of the Draft EIS/EIR for each performance indicator.
Steve Kendrick asked if the analysis had separated out the effect of limited transit stops.
Dave Goggin said the No Build would be very similar to existing conditions.
Michelle Brant said that the No Build Alternative would include improvements.
Michelle Brant asked if the transit improvements presented were compared with existing conditions. Michael Schwartz said yes, but because of projected residential and employment growth in San Francisco and the project area, transit performance did not improve dramatically in the 2015 No Build Alternative versus existing conditions, even factoring in the improvements.
Michelle Brant asked if the projected growth was the reason for the poor transit performance in the No Build Alternative.
Michael Schwartz said growth projections were calculated at the regional level and assigned to San Francisco. He said that the project was required to use the regional projections, including the anticipated growth for San Francisco.
Michelle Brant asked whether the analysis performed on the Final EIS/EIR would include the Build and the No Build Alternatives if the staff recommended Locally Preferred Alternative (LPA) were to be supported by the SFMTA and Authority Boards. Michael Schwartz replied that the analysis in the Final EIS/EIR would compare the project, as defined by the LPA, with the No Build Alternative.
Steve Kendrick asked whether accommodating the new LPA design required the elimination of left turns. Michael Schwartz said that elimination of left turns was
included as part of the recommended LPA for the increased transit benefit shown in the Draft EIS/EIR, not for engineering design purposes. Steve Kendrick asked whether the new design would still work if the left turns were kept. Michael Schwartz said the left turn removals were not related to the revised design, and had always been proposed as an option for Build Alternatives 3 and 4. He noted that originally they had been included as a way to reduce potential traffic delays on Van Ness Avenue, but that analysis indicated they also improved transit performance.
Steve Kendrick asked how many left turns there would be before and after the project is implemented. Michael Schwartz replied that there were 10-11 left turn pockets in each direction between Mission and Lombard currently, and that the LPA would only include the double left turn southbound at Broadway.
Steve Kendrick responded that eliminating one lane in each direction was already a big change, and combined with reducing the number of left turns to 1, there was potential for chaos. He said this was a major impact.
Michael Schwartz agreed it would be a significant change in the street function. He said there were precedents for streets without left turns in San Francisco, and that good messaging and outreach would help people understand that Van Ness would be more of a through route than exists currently, and that drivers should use other routes for localized left turns.
Dave Goggin said he would like to tell a short story. He related that he was waiting for the 47 bus that afternoon, and that the Nextbus sign said 9 minutes, but the bus actually took 12 minutes to arrive. He said the bus was shorter bus and packed, and that auto traffic was zooming by while the bus was delayed. He said that when he got to California and Polk, the signals were not accessible, so he had to guess if he would be able to cross safely. He said the existing system was inequitable, and that although the City had a written Transit First policy for 37 years, the system now was not good for seniors and people who were low-income or had disabilities. He said he had some nitpicky questions regarding the details of the hybrid alternative, but given the hard work and analysis that went into its development, he was ready to vote in favor.
Howard Strassner said he lived on 19th Avenue, and that having no left turns was perfectly reasonable to move traffic, and it was also reasonable to move transit faster. He asked if transit vehicles would be able to pass each other, particularly Golden Gate Transit buses. Michael Schwartz said that outside station locations, buses would be able to use the mixed flow lanes if they wanted to pass.
Jason Henderson said he liked the recommended LPA and was embarrassed the CAC and staff had not thought of it previously. He said he wished to reiterate that developing BRT was supposed to happen quickly, and expressed frustration that the decision on the Final EIS/EIR would occur in the Fall, when it should have happened in spring 2012, or even three years ago. He said the Market-Octavia Plan Area has 3000 housing units planned, and that 1,500 are being developed in the near future, many of them near Van Ness Avenue. He said that BRT was needed to accommodate this growth.
Jason Henderson made a motion to recommend approval of the Locally Preferred Alternative. Marla Taylor seconded the motion.
Bob Bardell said he could not believe the project was moving forward with an LPA with so little community comment. He said the spirit of the process was that staff should take the proposal to the public and let them comment. He said there were questions
remaining that people could raise in a public comment period. He said that his concerns included the fact that Golden Gate Transit was not going to stop on Van Ness Avenue and he was also worried about the platforms. He said he realized center-running BRT was the only way to go if it was going to be implemented. He expressed disappointment that there was not money to reconstruct utilities under the street, given their age. He said the project would convert Van Ness Avenue from a traffic circulator to a throughway, and that commuter buses would love it. He said the left lane would be straight shot, but the right lane will be clogged with turning traffic.
Steve Kendrick said he had asked for an incremental analysis of the different components that improved transit speed, which he said was the main goal of the project.
Michael Schwartz noted that there were multiple goals for the project, and that reliability was equally as important as travel speed.
Steve Kendrick said that he wished to focus on transit travel speed. He asked if the project team could perform a sensitivity analysis with modeling to identify the benefits of each individual project element. He noted that all-door boarding, curb-level loading, proof-of-payment, transit signal priority, fewer bus stops, left turn elimination, and dedicated bus lanes would all improve speed. He said he would like to know if most of the project benefits were from the combination of these benefits that would not require the conversion of a travel lane to be dedicated to transit, but he had not seen the analysis. He said he had a hunch that if the project was defined as those benefits only, the project would likely get 90% of the improvement as the recommended LPA. He said he also thought most of cost, maybe 90%, was in the conversion of the lane. He said he thought most of the benefit was not in the lane, but most of the cost was. He said he that for the same capital, he said the project team could build a system 5 times as long. He said he would like to see an incremental analysis of the total speed improvement and cost for each of the project elements. He said the incremental analysis was how staff developed the recommended LPA, and he congratulated them on that. He said he knew the agencies were trying to complete the planning process, but he still wanted to see the analysis. He said he would vote no without that recommended analysis. He said he would like to make the performance of the analysis a motion.
Marla Taylor said she heard the California Pacific Medical Center (CPMC) was going to provide funding for the project and asked if that was being coordinated. Michael Schwartz responded that the CPMC developer agreement included $5 million for BRT.
Lawrence Li said the CAC agreed early on to prioritize transit performance, and that was an important moment in terms of figuring out how to evaluate the project. He said when the project team added Design Option B with limited left turns, that helped transit performance. He said the group had reviewed the modeling and he understood that there were tradeoffs, but was pretty pleased with the staff recommended LPA. He said the recommended LPA reduced many of tradeoffs, and he thought it was a good solution. He said the analysis was solid, and he said it was time to move forward with completion of the EIS/EIR.
Howard Strassner said Design Option B with limited left turns provided 5% additional travel time savings in the Draft EIS/EIR. He said the Draft EIS/EIR showed that even above and beyond the all-door boarding and the other benefits included in the No Build Alternative, the project still had a big benefit. He said the element-by-element analysis had been done.
Dave Goggin asked if landscaping was an issue in that the public preferred leafy trees rather than palm trees? Michael Schwartz responded that the wider median allowed more landscaping possibilities. Mr. Schwartz said the center median kept the overhead contact system (OCS) wires further from the landscaping to reduce maintenance issues.
Dave Goggin expressed concern about buses bobbing and weaving in the proposed design, and asked if the transitions could be longer so they are less abrupt? Michael Schwartz replied that the drawing in the memo and presentation was conceptual, and would be refined if approved by the two boards. He said staff was comfortable with the recommended LPA because staff anticipated that the environmental impacts would likely fall within the bookends of impacts established by the alternatives in Draft EIS/EIR. He noted that a few areas would need more analysis, such as the amount of permeable surface. He said Alternative 3 had some weaving and the LPA would likely be similar.
Dave Goggin asked if the CAC would have an opportunity to look at the selection of lighting fixture options. Michael Schwartz said the CAC would discuss its role in the remainder of the project at the next CAC meeting. He said there would certainly be a design process with opportunities for input, whether as a CAC or as members of the public.
Bob Bardell asked if Golden Gate Transit would be able to turn onto Van Ness Avenue at Lombard under the recommended LPA or if they would need to detour to Chestnut Street. He said Lombard master planning has raised concerns about BRT and the effect of buses turning onto Chestnut Street. Michael Schwartz responded that Golden Gate Transit buses would turn onto Van Ness Avenue from Lombard Street under the LPA, similar to the turn under existing conditions. Mr. Schwartz noted that the Golden Gate Transit buses would use the BRT transit lanes and stations as part of the recommended LPA. He clarified that the reroute onto Chestnut Street was only an option as part of Build Alternative 4, but was no longer necessary since the stations could accommodate right-side loading vehicles as part of the staff recommended LPA.
Henry Pan thanked staff for working on the LPA and said it looked great. He said he agreed with Dave Goggin that the City needed to prioritize transit.
Michelle Brant said the recommended LPA would only save 4 to 5 minutes of transit travel time and she agreed with Steve Kendrick that the project team should pursue incremental changes that do not require converting one of the lanes to transit only.
Paul Bignardi said that one of the most important goals for the project was an improvement in reliability. He noted that the bus did not have to interact with traffic under the staff recommended LPA, and this was very integral for improving reliability.
Steve Kendrick said the fact that the project did not improve the portions of the routes outside of Van Ness Avenue would erode the reliability benefit.
Paul Bignardi said that traveling south, reliability benefits should be strong for the BRT since that was near the start of the route. He said that traveling north, the SFMTA would likely include line management to improve reliability getting to the BRT corridor.
Jason Henderson said the Transit Effectiveness Project (TEP) should improve the reliability of the Mission corridor.
Michael Schwartz said the current TEP proposals included a variety of treatments on different corridors. He said that Mission Street was one of first corridors to move
forward, and SFMTA was looking at options to improve service and reliability there which would provide co-benefits to the BRT.
During public comment, Mary Anne Kayiatos said the public needed to know about the recommended LPA, and that very few people know about the project at all. She asked how many median trees would be preserved as part of the project. Michael Schwartz responded that the project did not yet have an exact number of trees that would be removed because the designs were not yet completed for the staff recommended LPA. He said the number of trees removed would be between the numbers established for Build Alternatives 3 and 4 in the Draft EIS/EIR, so between 72 and 101 of the 101 trees would be removed or significantly pruned.
Steve Kendrick asked if the trees would be replaced. Michael Schwartz replied that the intention would be to replace and supplement as many trees as feasible. Paul Bignardi said the eucalyptus trees would need to be significantly pruned to accommodate the OCS wires, and they might not survive the pruning. He said the trees would also be stressed during construction, so the project team did not really know how many would remain. He said that if the project did not use electric buses, there would probably be fewer trees removed. He said the project team was looking for as many opportunities as possible to preserve them.
Mary Anne Kayiatos said that eliminating so many trees was a crime, and that Van Ness Avenue would be ugly with so many trees replaced. She said the bus should be on the side but she understood that parking was a reason to keep the bus in the center. She said the center would make it dangerous for pedestrians to get to stations. She said palm trees were ugly, terrible, and did not grow well in San Francisco. She asked how many stops there would be. Michael Schwartz said there would be eight southbound and nine northbound stops.
Mary Anne Kayiatos asked if the trees could be kept without the electric buses. Michael Schwartz said how many could be kept is not known, but the SFMTA had a zero emissions policy and so did not plan to eliminate the electric buses.
Mary Anne Kayiatos said traffic was already bad, and she did not understand why the City was doing this project. Michael Schwartz said in the near-term there would be a similar number of congested intersections, with or without the project, and that staff was planning for long-term improvements that could not be shown in the Draft EIS/EIR in order to reduce citywide congestions.
George Sery said he lived in the corridor and wanted to echo Steve Kendrick’s request for a sensitivity analysis. He said he was concerned about the cost-effectiveness of the project, and implementing the project without a sensitivity test was hard to fathom. He said he had worked in hardware manufacturing, and sensitivity analysis was critical because it weighted what gave the best return for the budget. He said bus transit speed was mostly limited by loading time. He said if the project could speed that up, it would constitute a large improvement. He said that he felt the twelve second improvement of the No Build Alternative hard to believe. Michael Schwartz responded that the No Build Alternative included the congestion associated with background growth between 2007 existing conditions and 2015.
George Sery said improvements should be focused on loading, and what can be done with all-door boarding. He said the project cost was too high for 2 to 3 minutes in savings, and the money should be invested in a systemwide improvement. He stated that
this was a narrow corridor and there would be a large construction impact. He said no additional people would choose to ride transit with only a three minute travel time benefit. He said most of the improvement in transit ridership would come from riders on Polk Street. He noted that staff has his comment letter on the Draft EIS/EIR, and he said that he wanted a real cost-benefit analysis. He said the project was wonderfully modeled and planned, but staff should be able to look at changes like a No Build Alternative with a few more options like bus bulbs. Michael Schwartz thanked him for the comment.
Chris Peterson said he disagreed with the previous speakers and supported BRT. He said the other commenters’ suggestions, including reducing stops and transit signal priority, were variations on side-lane BRT. He noted that side-lane BRT performed much worse than center in the Draft EIS/EIR. He said citywide performance may finally be addressed by the TEP after many years of environmental review. He said center BRT improved service not just in terms of speed, but also reliability. He said that over time, reliability could have a huge benefit to transit riders, and he thought the City needed to make significant commitments to bold improvements.
Steve Kendrick asked to clarify his motion to not vote on the final motion of what we prefer to do before we perform the additional analysis.
Jason Henderson noted that he had a motion on the floor, and another motion could not be made.
Michael Schwartz said Steve Kendrick could amend the motion, for example to recommend approval pending an analysis showing the analysis.
Howard Strassner suggested taking a vote on Jason Henderson’s motion.
Michael Schwartz said Jason Henderson could withdraw his motion so Steve Kendrick could make his.
Jason Henderson withdrew his motion, and noted that he would reintroduce it after the vote on Steve Kendrick’s motion.
Steve Kendrick made a motion to defer the vote on whether to recommend approval until the CAC has the benefit of an additional study, and to schedule a meeting at the earliest date when the study would be available where the CAC will make a motion on whether to approve the staff recommendation, and to request that staff do a study comparing the benefits and costs of the existing alternatives to improvements without dedicated lanes, including removal of left turns so the factors are constant and to focus on the incremental improvement of the transit-only lane.
Michael Schwartz asked to clarify if the study would have center- or side-running buses under the modified No Build Alternative. Steve Kendrick replied that the buses would run on the side. Michael Schwartz asked if the left turns would be eliminated. Steve Hendrick said they would. Michael Schwartz asked if bus bulbs would be included, because they are a significant portion of the side-running alternative’s cost.
Howard Strassner said it sounded like Steve Kendrick was asking for Build Alternative 2.
Steve Kendrick said the study would not include bulbs, but would include transit signal priority and low-floor buses.
Michelle Brant asked how long the additional analysis would take. Michael Schwartz responded that he could not reply with certainty.
Steve Kendrick asked if this would delay the project schedule. Michael Schwartz said the analysis would not be complete in time for the SFMTA and Authority board votes, so either it would delay the schedule or boards would vote without the benefit of a CAC recommendation.
Steve Kendrick said saving a significant amount of funds would be worth an extra month, which he anticipated would be the duration of the analysis. He said that staff had all the building blocks and has modeled all these elements, and he thought the study could be done in a month.
Michelle Brant seconded Steve Kendrick’s motion and opened the item for public comment.
Bob Bardell said he was confused about what the difference was between this alternative and the No Build Alternative, and asked if there is signal priority in the No Build. Michael Schwartz responded that there was not transit signal priority in the No Build Alternative in the Draft EIS/EIR.
Mary Anne Kayiatos asked what a bus bulb was. Michael Schwartz explained that it was a sidewalk extension, and that they were a significant part of the Build Alternative 2 cost.
During public comment, Chris Peterson said the motion sounded like another delay, with just a slight variation of the No Build Alternative and Alternative 2. He said nominally Build Alternative 2 proposed bus lanes, but they were not fully exclusive since right turning vehicles and parking vehicles would use the lane. He said the project had taken scandalously long already.
Michelle Brant said this was not just a slight variation, and was worth the time.
Mary Anne Kayiatos said a cost-effectiveness analysis was worthwhile.
The motion failed with two in favor (Steve Kendrick and Michelle Brant) and seven opposed (Bob Bardell, Jason Henderson, Howard Strassner, Lawrence Li, Dave Goggin, Marla Taylor, and Henry Pan).
Jason Henderson moved to recommend approval of the staff-recommended alternative. Howard Strassner seconded the motion.
During public comment, Mary Anne Kayiatos asked if staff could let the public know about this alternative before approving, and said the public knew very little about the BRT project. Michael Schwartz responded that staff had conducted significant outreach in the past and continued to do so surrounding the LPA. Mary Anne Kayiatos expressed concern that the vote was happening before the outreach was completed. Michael Schwartz explained that the CAC vote was a recommendation, and the SFMTA and Authority Board public meetings would happen later in May. He also noted that the binding decision on the LPA would only happen in the fall with the certification of the Final EIS/EIR.
The motion passed with six votes in favor (Jason Henderson, Howard Strassner, Lawrence Li, Dave Goggin, Marla Taylor, and Henry Pan) and three opposed (Michelle Brant, Bob Bardell, and Steve Kendrick).
Paul Bignardi noted that the SFMTA board would consider the item on May 15th.
Michael Schwartz said www.vannessbrt.org has a list of all project meetings. He said that on the same day as the SFMTA Board meeting, the Authority Board Plans and Programs
Committee would make a recommendation to the full Board in a meeting at City Hall at 11. He said that the full Authority Board will hear the item on May 22 at City Hall.
Michelle Brant asked if Michael Schwartz could email the CAC members the meeting dates. Michael Schwartz said he would email it out.
Jason Henderson said that other CACs have a designated person who speaks for the CAC, and that this CAC does not so people should be careful about whether they are speaking for themselves or for the CAC.
Michael Schwartz noted that this CAC does not have a chair, and speaking for the CAC is usually the chair’s duty. He said staff will provide a summary of public comment, including at CAC meetings, to the boards.
Mary Anne Kayiatos asked if the summary would include public comments, as well. Michael Schwartz said yes.
Dave Goggin complimented the refreshments.
Howard Strassner asked where Rachel Hiatt was. Michael Schwartz said she was back at the Authority, but working on other projects.
5. Upcoming CAC Meeting Topics – INFORMATION
Michael Schwartz said staff would reconvene the CAC in advance of certification of the Final EIS/EIR.
6. Public Comment
Mary Anne Kayiatos said the City should not do the BRT project.
George Sery requested that staff do the additional study outlined by Steve Kendrick.
7. Adjourn
The meeting was adjourned at 7:20 p.m.
07.05.13 re: Van Ness BRT Citizens Advisory Committee
July 9, 2013
Van Ness Avenue BRT Citizens Advisory Committee
Michael Schwartz – Senior Transportation Planner
Public Availability of the Van Ness Avenue Bus Rapid Transit Final Environmental Impact
Statement/Environmental Impact Report –
After significant technical analysis following selection of the LPA – center running right side platforms with limited left turns – by both the SFCTA and SFMTA boards last Spring, the project team has synthesized the feedback received from partner agencies and members of the public, and have made Final Environmental Impact Statement/Environmental Impact Report (EIS/EIR) publicly available. The Authority Board is scheduled to certify the final Environmental Impact Report (the CEQA – State of California – part of the document) and approve the Van Ness Avenue BRT Project in September. This will be followed by consideration of project approvals by the SFMTA board, and finally by federal approval in the form of a Federal Transit Administration “Record of Decision” (ROD). The Final EIS/EIR confirms that the impacts of the LPA were represented through the alternatives included in the Draft EIS/EIR. The purpose of this item is to provide an overview of the Final EIS/EIR to the committee as well as the process for project approval. The project team is also seeking feedback on the notification process underway. We are seeking feedback and input from the committee. This is an information item.
On July 12, 2013, a federal Notice of Availability for the Final Environmental Impact Statement/Environmental Impact Report (EIS/EIR) will appear in the Federal Register. This will mark the beginning of 30 day circulation period where the public can submit comments they wish the FTA to consider before issuing its Record of Decision (ROD). The period closes on August 12. Once that period closes, there will be a series of actions considered for EIS/EIR certification (completing the California Environmental Quality Act – CEQA -- process), local project approvals, and issuance of the ROD (completing the National Environmental Policy Act – NEPA -- process). The purpose of this item is to review findings in the Final EIS/EIR.
The Authority, working in partnership with the SFMTA, is leading the current phase of the project which encompasses environmental review. The Final EIS/EIR has been prepared pursuant to the requirements of both NEPA and CEQA. FTA serves as the Lead Agency under NEPA, and the Authority is the Lead Agency under CEQA. Caltrans and the SFMTA serve as Participating Agencies under NEPA and as Responsible Agencies under CEQA for purposes of environmental review. Other participating agencies include Golden Gate Bridge Highway and Transportation District (parent agency of Golden Gate Transit), Metropolitan Transportation Commission (MTC), San Francisco Department of Public Works, San Francisco Planning Department, San Francisco Public Utilities Commission, and the San Francisco Mayor’s Office on Disability.
Since the Draft EIS/EIR was circulated for public comment from November 4, 2011 – December 23, 2011, the project team has worked to respond to all comments on
the document. At the same time, Authority and SFMTA staff worked hard to determine the staff recommendation for the Locally Preferred Alternative (LPA). The LPA, Center-Lane BRT with Right-Side Boarding/Single Median and Limited Left Turns, is a refinement of the two center running alternatives in the Draft EIS/EIR, and was approved by the Authority and SFMTA boards for inclusion in the Final EIS/EIR. Over the last year, staff performed analysis to confirm that any significant environmental impacts related to the LPA were disclosed as part of the alternatives included in the Draft EIS/EIR. The final environmental document reflects updates based on responses to comments (Appendix I of Volume II) and also incorporates the LPA.
In addition to the above activities, the project team also worked closely with Caltrans to get approval on design of the LPA. This is required in order to complete the Caltrans planning process, and must be consistent with the LPA shown in the Final EIS/EIR. In May 2013, the team received design exceptions (i.e., instances where the design varies versus Caltrans standards) in more than 120 locations in order to meet local priorities such as parking and tree preservation.
The Final EIS/EIR includes a section responding to agency, individual, and organization public comment on the Draft EIS/EIR during the public circulation period. Appendix I begins with master comments and responses for those comments most frequently submitted on the Draft EIS/EIR.
In addition to responses to comments, the Final EIS/EIR also includes a Mitigation, Monitoring, and Reporting Program (MMRP). A requirement of CEQA, the MMRP outlines the mitigations and improvement measures that would be performed as part of project design and implementation. The table also reflects responsible parties for performance and environmental oversight. In general, the SFMTA (or its contractor) would be performing most of the mitigation and improvement measures. The Authority, as the CEQA lead agency, would be responsible for environmental compliance, receiving all reports. If the project is approved by the SFMTA Board of Directors, they would adopt the findings of the Final EIS/EIR as well as the MMRP.
NEPA and CEQA require that projects with a potential for significant adverse environmental effects be reviewed in an EIS and EIR, respectively. This Final EIS/EIR identifies three build alternatives and the LPA for the Van Ness Avenue BRT Project that would each meet the project’s purpose and need, and evaluates the environmental effects that would result from each project alternative. This document also identifies measures to avoid, minimize, and mitigate impacts.
The project team undertook extensive project studies and design efforts to achieve project objectives while responding to a multitude of stakeholder needs. Ultimately, the report finds that the Van Ness Avenue BRT LPA would generate significant transit rider, operator and transportation system benefits. Moreover, the build alternatives result in no impacts, or less-than-significant impacts, in the following areas:
Agricultural Resources
Greenhouse Gas Emissions
Mineral Resources
Population, Housing, and Recreation
Wind and Shadow
Hydrology and Water Quality
Land Use
Noise and Vibration
Non-motorized Transportation
With implementation of avoidance and mitigation measures, the project would result in less than significant impacts in the following areas:
Aesthetics/Visual Resources
Air Quality
Biological Resources
Community Impacts
Cultural Resources
Geology and Soils
Hazardous Waste and Materials
Public Services
Transit Crowding
Utilities and Service Systems
Implementation of any of the build alternatives would result in significant and unavoidable impacts in one environmental category: traffic circulation. With implementation of the LPA, significant traffic circulation impacts would occur at three intersection locations in Year 2015 and eight intersections in the future year 2035. A detailed discussion of impacts, and potential improvement and mitigation measures, is provided in Chapters 3 and 4 of the Final EIS/EIR.
In response to comments, there are a couple of areas in the document with significantly more detail than what was included in the Draft EIS/EIR. The first such area is aesthetics/visual resources (Chapter 4.4). In particular, the age, size, and health of all potentially impacted trees was assessed, and a detailed analysis of existing trees that would be removed and new trees that would be planted is now documented in the Final EIS/EIR. There are 28 existing mature trees in the median of Van Ness Avenue. Under the LPA, 23 of those trees would be removed and replaced. Overall, 90 trees would be removed from the median under the LPA, with 95 replacement trees in the median and 48 new sidewalk trees anticipated, thus increasing the total number of trees along the corridor.
The second area of increased detail is the transportation analysis. Some of the information already included in the Vehicular Traffic Analysis Technical Memorandum for the Draft EIS/EIR is now included in the body text of Chapters 3.1 and 3.3 of the Final EIS/EIR.
Finally, LPA was refined to meet Caltrans design standards and more specific and updated SFMTA BRT transit lane design standards. Since this impacted parking, the project team used the opportunity to also incorporate updated existing conditions data. Under the LPA, approximately 105 parking spaces would be removed, or 23% of parking along the two miles. More specific details on parking loss can be found in Chapter 3.5 of the Final EIS/EIR. In addition, some additional businesses would have their loading zones (either white or yellow) removed under the LPA and the project would not be able to replace them on the same block face. As a mitigation measure, the project team will work with those businesses to find replacement zones in alleys or adjacent streets. The businesses are identified in Chapter 4.2 of the Final EIS/EIR.
The Final EIS/EIR is available for download at the project website www.vannessbrt.org. Paper copies are available for review at the Authority offices (1455
Market Street, 22nd Floor), the SFMTA Office (One South Van Ness Avenue, 7th Floor), the Planning Information Counter at the Planning Department (1660 Mission Street, 1st Floor), and at the Main Branch of the San Francisco Public Library (100 Larkin Street). CD copies are available at the Authority Office. For those who wish to obtain a paper copy, the price is the cost of production.
To support the availability of the document, the following noticing steps will be undertaken.
Letter or email to all commenters on the Draft EIS/EIR informing them of the availability of document.
Email to project list announcing availability of Final EIS/EIR
Legal notices in English, Spanish, and Chinese newspapers
Radius mailing
After the close of the federal availability period on August 12, 2013, the Authority Board will consider certification of the EIS/EIR and project approval at a meeting in September. After certification, the SFMTA Board would consider project approval. The date and time of all certification and approval related meetings, including the certification hearing, will be posted on the project website (www.vannessbrt.org) when finalized. Finally, the FTA would consider the issuance of a ROD to complete the environmental process. At that point, the SFMTA would become the project lead for engineering, design, and construction while the Authority would perform environmental compliance services as well as funding oversight.
We are seeking feedback and input from the committee. This is an information item.
Attachments (1): 1. Master Comments and Reponses on Draft EIS/EIR for the Van Ness Avenue Bus Rapid Transit
Project
Volume II of the
Final EIS/EIR for the Van Ness Avenue BRT Project
Appendices I & J

Van Ness Avenue Bus Rapid Transit Project Appendix I: Comment Letters and Responses Final Environmental Impact Statement/ Environmental Impact Report
Appendix I
Response to Comments
Van Ness Avenue Bus Rapid Transit Project Appendix I: Comment Letters and Responses Final Environmental Impact Statement/ Environmental Impact Report
1
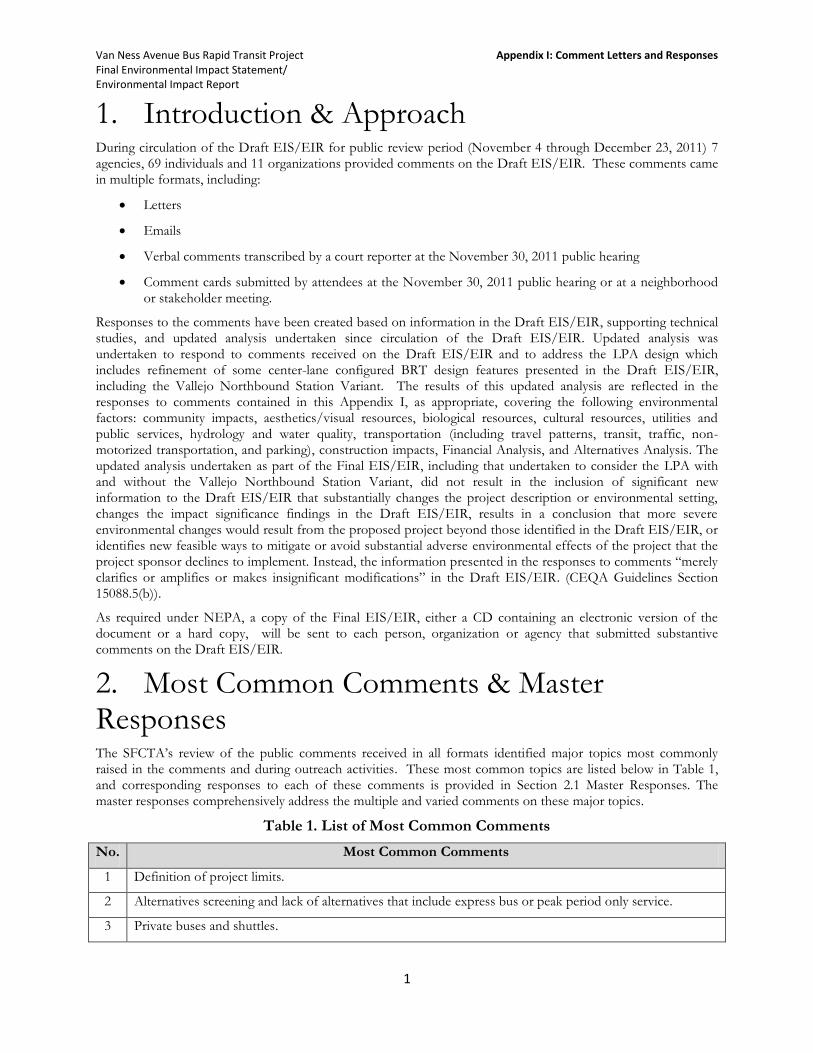
1. Introduction & Approach During circulation of the Draft EIS/EIR for public review period (November 4 through December 23, 2011) 7 agencies, 69 individuals and 11 organizations provided comments on the Draft EIS/EIR. These comments came in multiple formats, including:
Letters
Emails
Verbal comments transcribed by a court reporter at the November 30, 2011 public hearing
Comment cards submitted by attendees at the November 30, 2011 public hearing or at a neighborhood
or stakeholder meeting.
Responses to the comments have been created based on information in the Draft EIS/EIR, supporting technical studies, and updated analysis undertaken since circulation of the Draft EIS/EIR. Updated analysis was undertaken to respond to comments received on the Draft EIS/EIR and to address the LPA design which includes refinement of some center-lane configured BRT design features presented in the Draft EIS/EIR, including the Vallejo Northbound Station Variant. The results of this updated analysis are reflected in the responses to comments contained in this Appendix I, as appropriate, covering the following environmental factors: community impacts, aesthetics/visual resources, biological resources, cultural resources, utilities and public services, hydrology and water quality, transportation (including travel patterns, transit, traffic, non-motorized transportation, and parking), construction impacts, Financial Analysis, and Alternatives Analysis. The updated analysis undertaken as part of the Final EIS/EIR, including that undertaken to consider the LPA with and without the Vallejo Northbound Station Variant, did not result in the inclusion of significant new information to the Draft EIS/EIR that substantially changes the project description or environmental setting, changes the impact significance findings in the Draft EIS/EIR, results in a conclusion that more severe environmental changes would result from the proposed project beyond those identified in the Draft EIS/EIR, or identifies new feasible ways to mitigate or avoid substantial adverse environmental effects of the project that the project sponsor declines to implement. Instead, the information presented in the responses to comments “merely clarifies or amplifies or makes insignificant modifications” in the Draft EIS/EIR. (CEQA Guidelines Section 15088.5(b)).
As required under NEPA, a copy of the Final EIS/EIR, either a CD containing an electronic version of the document or a hard copy, will be sent to each person, organization or agency that submitted substantive comments on the Draft EIS/EIR.
2. Most Common Comments & Master Responses
The SFCTA’s review of the public comments received in all formats identified major topics most commonly raised in the comments and during outreach activities. These most common topics are listed below in Table 1, and corresponding responses to each of these comments is provided in Section 2.1 Master Responses. The master responses comprehensively address the multiple and varied comments on these major topics.
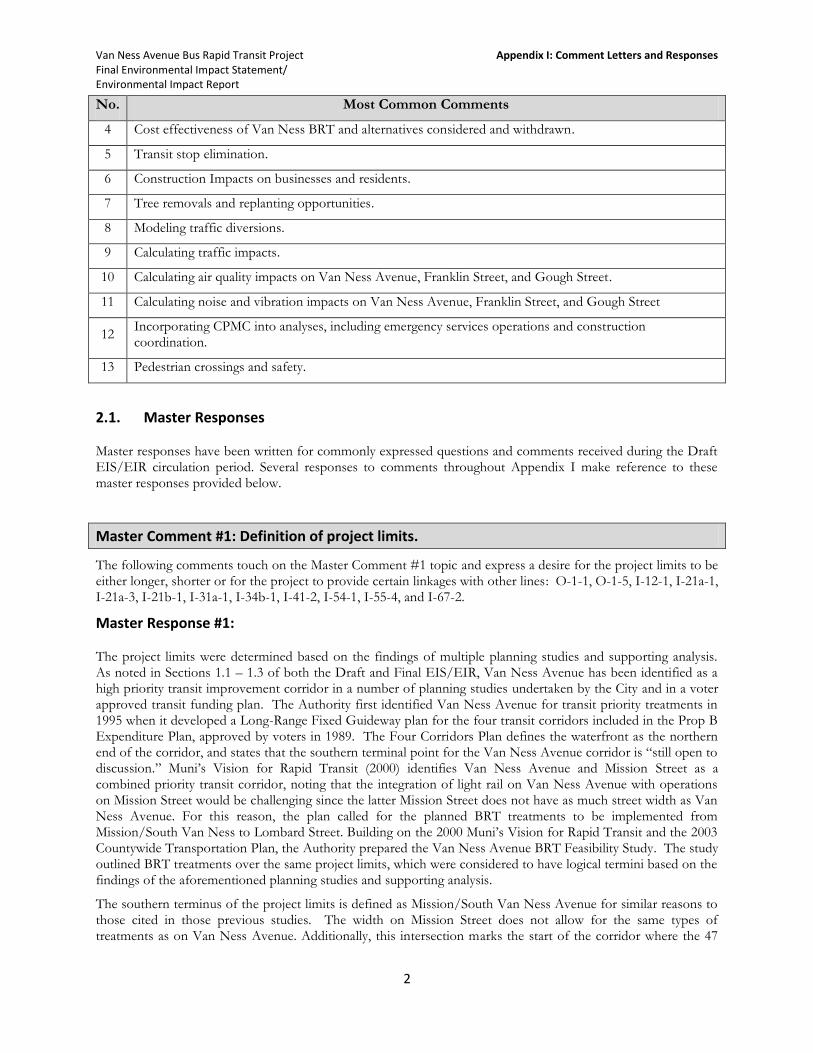
Table 1. List of Most Common Comments
No. Most Common Comments
1 Definition of project limits.
2 Alternatives screening and lack of alternatives that include express bus or peak period only service.
3 Private buses and shuttles.
Van Ness Avenue Bus Rapid Transit Project Appendix I: Comment Letters and Responses Final Environmental Impact Statement/ Environmental Impact Report
2
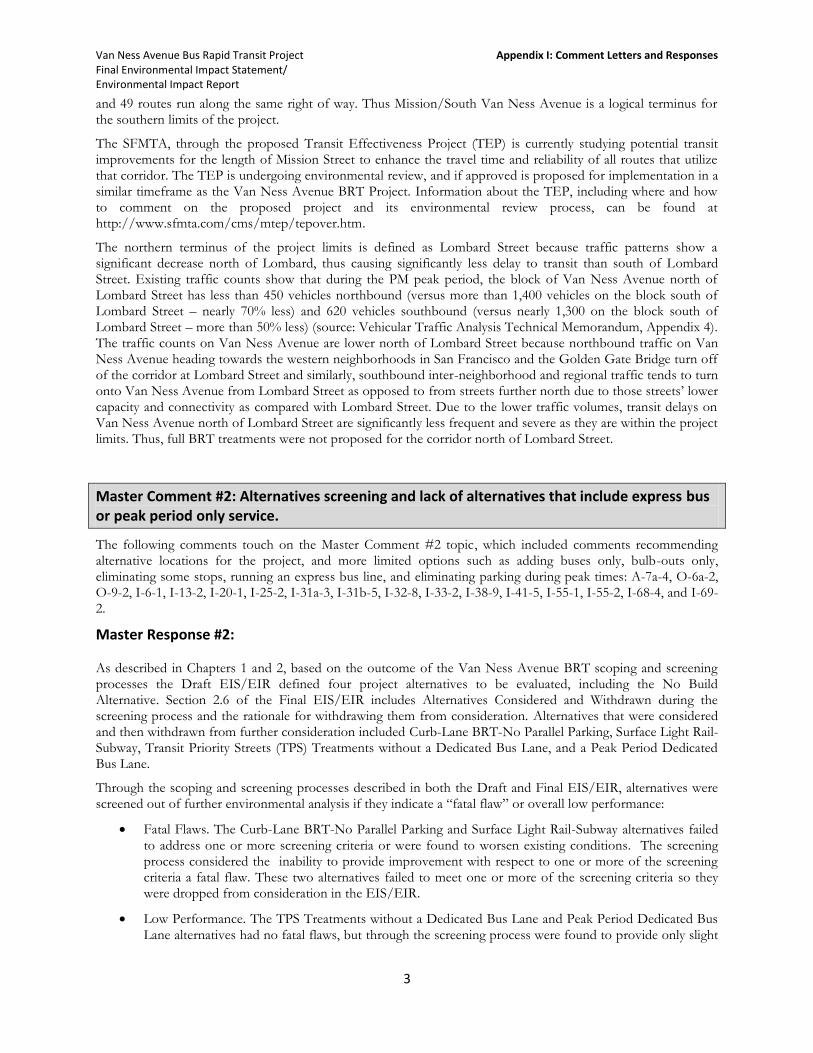
No. Most Common Comments
4 Cost effectiveness of Van Ness BRT and alternatives considered and withdrawn.
5 Transit stop elimination.
6 Construction Impacts on businesses and residents.
7 Tree removals and replanting opportunities.
8 Modeling traffic diversions.
9 Calculating traffic impacts.
10 Calculating air quality impacts on Van Ness Avenue, Franklin Street, and Gough Street.
11 Calculating noise and vibration impacts on Van Ness Avenue, Franklin Street, and Gough Street
12 Incorporating CPMC into analyses, including emergency services operations and construction coordination.
13 Pedestrian crossings and safety.
2.1. Master Responses
Master responses have been written for commonly expressed questions and comments received during the Draft EIS/EIR circulation period. Several responses to comments throughout Appendix I make reference to these master responses provided below.
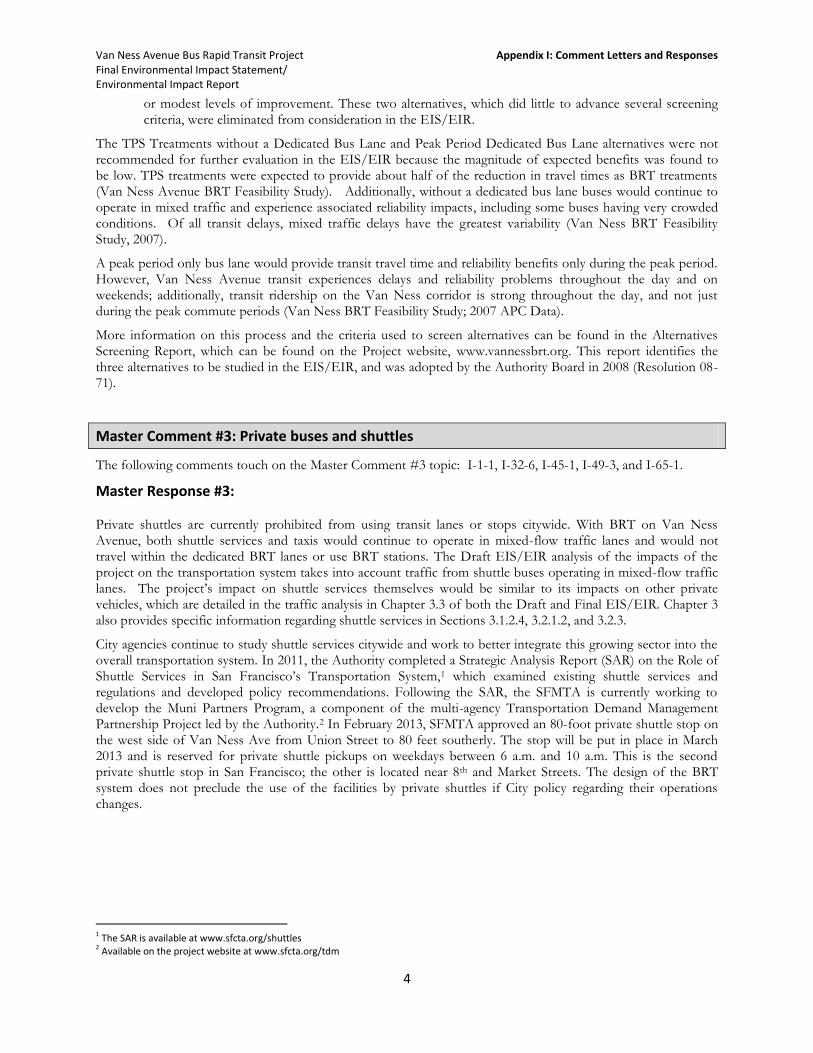
Master Comment #1: Definition of project limits.
The following comments touch on the Master Comment #1 topic and express a desire for the project limits to be either longer, shorter or for the project to provide certain linkages with other lines: O-1-1, O-1-5, I-12-1, I-21a-1, I-21a-3, I-21b-1, I-31a-1, I-34b-1, I-41-2, I-54-1, I-55-4, and I-67-2.
Master Response #1:
The project limits were determined based on the findings of multiple planning studies and supporting analysis. As noted in Sections 1.1 – 1.3 of both the Draft and Final EIS/EIR, Van Ness Avenue has been identified as a high priority transit improvement corridor in a number of planning studies undertaken by the City and in a voter approved transit funding plan. The Authority first identified Van Ness Avenue for transit priority treatments in 1995 when it developed a Long-Range Fixed Guideway plan for the four transit corridors included in the Prop B Expenditure Plan, approved by voters in 1989. The Four Corridors Plan defines the waterfront as the northern end of the corridor, and states that the southern terminal point for the Van Ness Avenue corridor is “still open to discussion.” Muni’s Vision for Rapid Transit (2000) identifies Van Ness Avenue and Mission Street as a combined priority transit corridor, noting that the integration of light rail on Van Ness Avenue with operations on Mission Street would be challenging since the latter Mission Street does not have as much street width as Van Ness Avenue. For this reason, the plan called for the planned BRT treatments to be implemented from Mission/South Van Ness to Lombard Street. Building on the 2000 Muni’s Vision for Rapid Transit and the 2003 Countywide Transportation Plan, the Authority prepared the Van Ness Avenue BRT Feasibility Study. The study outlined BRT treatments over the same project limits, which were considered to have logical termini based on the findings of the aforementioned planning studies and supporting analysis.
The southern terminus of the project limits is defined as Mission/South Van Ness Avenue for similar reasons to those cited in those previous studies. The width on Mission Street does not allow for the same types of treatments as on Van Ness Avenue. Additionally, this intersection marks the start of the corridor where the 47
Van Ness Avenue Bus Rapid Transit Project Appendix I: Comment Letters and Responses Final Environmental Impact Statement/ Environmental Impact Report
3
and 49 routes run along the same right of way. Thus Mission/South Van Ness Avenue is a logical terminus for the southern limits of the project.
The SFMTA, through the proposed Transit Effectiveness Project (TEP) is currently studying potential transit improvements for the length of Mission Street to enhance the travel time and reliability of all routes that utilize that corridor. The TEP is undergoing environmental review, and if approved is proposed for implementation in a similar timeframe as the Van Ness Avenue BRT Project. Information about the TEP, including where and how to comment on the proposed project and its environmental review process, can be found at http://www.sfmta.com/cms/mtep/tepover.htm.
The northern terminus of the project limits is defined as Lombard Street because traffic patterns show a significant decrease north of Lombard, thus causing significantly less delay to transit than south of Lombard Street. Existing traffic counts show that during the PM peak period, the block of Van Ness Avenue north of Lombard Street has less than 450 vehicles northbound (versus more than 1,400 vehicles on the block south of Lombard Street – nearly 70% less) and 620 vehicles southbound (versus nearly 1,300 on the block south of Lombard Street – more than 50% less) (source: Vehicular Traffic Analysis Technical Memorandum, Appendix 4). The traffic counts on Van Ness Avenue are lower north of Lombard Street because northbound traffic on Van Ness Avenue heading towards the western neighborhoods in San Francisco and the Golden Gate Bridge turn off of the corridor at Lombard Street and similarly, southbound inter-neighborhood and regional traffic tends to turn onto Van Ness Avenue from Lombard Street as opposed to from streets further north due to those streets’ lower capacity and connectivity as compared with Lombard Street. Due to the lower traffic volumes, transit delays on Van Ness Avenue north of Lombard Street are significantly less frequent and severe as they are within the project limits. Thus, full BRT treatments were not proposed for the corridor north of Lombard Street.
Master Comment #2: Alternatives screening and lack of alternatives that include express bus or peak period only service.
The following comments touch on the Master Comment #2 topic, which included comments recommending alternative locations for the project, and more limited options such as adding buses only, bulb-outs only, eliminating some stops, running an express bus line, and eliminating parking during peak times: A-7a-4, O-6a-2, O-9-2, I-6-1, I-13-2, I-20-1, I-25-2, I-31a-3, I-31b-5, I-32-8, I-33-2, I-38-9, I-41-5, I-55-1, I-55-2, I-68-4, and I-69-2.
Master Response #2:
As described in Chapters 1 and 2, based on the outcome of the Van Ness Avenue BRT scoping and screening processes the Draft EIS/EIR defined four project alternatives to be evaluated, including the No Build Alternative. Section 2.6 of the Final EIS/EIR includes Alternatives Considered and Withdrawn during the screening process and the rationale for withdrawing them from consideration. Alternatives that were considered and then withdrawn from further consideration included Curb-Lane BRT-No Parallel Parking, Surface Light Rail-Subway, Transit Priority Streets (TPS) Treatments without a Dedicated Bus Lane, and a Peak Period Dedicated Bus Lane.
Through the scoping and screening processes described in both the Draft and Final EIS/EIR, alternatives were screened out of further environmental analysis if they indicate a “fatal flaw” or overall low performance:
Fatal Flaws. The Curb-Lane BRT-No Parallel Parking and Surface Light Rail-Subway alternatives failed
to address one or more screening criteria or were found to worsen existing conditions. The screening process considered the inability to provide improvement with respect to one or more of the screening criteria a fatal flaw. These two alternatives failed to meet one or more of the screening criteria so they were dropped from consideration in the EIS/EIR.
Low Performance. The TPS Treatments without a Dedicated Bus Lane and Peak Period Dedicated Bus
Lane alternatives had no fatal flaws, but through the screening process were found to provide only slight
Van Ness Avenue Bus Rapid Transit Project Appendix I: Comment Letters and Responses Final Environmental Impact Statement/ Environmental Impact Report
4
or modest levels of improvement. These two alternatives, which did little to advance several screening criteria, were eliminated from consideration in the EIS/EIR.
The TPS Treatments without a Dedicated Bus Lane and Peak Period Dedicated Bus Lane alternatives were not recommended for further evaluation in the EIS/EIR because the magnitude of expected benefits was found to be low. TPS treatments were expected to provide about half of the reduction in travel times as BRT treatments (Van Ness Avenue BRT Feasibility Study). Additionally, without a dedicated bus lane buses would continue to operate in mixed traffic and experience associated reliability impacts, including some buses having very crowded conditions. Of all transit delays, mixed traffic delays have the greatest variability (Van Ness BRT Feasibility Study, 2007).
A peak period only bus lane would provide transit travel time and reliability benefits only during the peak period. However, Van Ness Avenue transit experiences delays and reliability problems throughout the day and on weekends; additionally, transit ridership on the Van Ness corridor is strong throughout the day, and not just during the peak commute periods (Van Ness BRT Feasibility Study; 2007 APC Data).
More information on this process and the criteria used to screen alternatives can be found in the Alternatives Screening Report, which can be found on the Project website, www.vannessbrt.org. This report identifies the three alternatives to be studied in the EIS/EIR, and was adopted by the Authority Board in 2008 (Resolution 08-71).
Master Comment #3: Private buses and shuttles
The following comments touch on the Master Comment #3 topic: I-1-1, I-32-6, I-45-1, I-49-3, and I-65-1.
Master Response #3:
Private shuttles are currently prohibited from using transit lanes or stops citywide. With BRT on Van Ness Avenue, both shuttle services and taxis would continue to operate in mixed-flow traffic lanes and would not travel within the dedicated BRT lanes or use BRT stations. The Draft EIS/EIR analysis of the impacts of the project on the transportation system takes into account traffic from shuttle buses operating in mixed-flow traffic lanes. The project’s impact on shuttle services themselves would be similar to its impacts on other private vehicles, which are detailed in the traffic analysis in Chapter 3.3 of both the Draft and Final EIS/EIR. Chapter 3 also provides specific information regarding shuttle services in Sections 3.1.2.4, 3.2.1.2, and 3.2.3.
City agencies continue to study shuttle services citywide and work to better integrate this growing sector into the overall transportation system. In 2011, the Authority completed a Strategic Analysis Report (SAR) on the Role of Shuttle Services in San Francisco’s Transportation System,1 which examined existing shuttle services and regulations and developed policy recommendations. Following the SAR, the SFMTA is currently working to develop the Muni Partners Program, a component of the multi-agency Transportation Demand Management Partnership Project led by the Authority.2 In February 2013, SFMTA approved an 80-foot private shuttle stop on the west side of Van Ness Ave from Union Street to 80 feet southerly. The stop will be put in place in March 2013 and is reserved for private shuttle pickups on weekdays between 6 a.m. and 10 a.m. This is the second private shuttle stop in San Francisco; the other is located near 8th and Market Streets. The design of the BRT system does not preclude the use of the facilities by private shuttles if City policy regarding their operations changes.
1 The SAR is available at www.sfcta.org/shuttles 2 Available on the project website at www.sfcta.org/tdm
Van Ness Avenue Bus Rapid Transit Project Appendix I: Comment Letters and Responses Final Environmental Impact Statement/ Environmental Impact Report
5
Master Comment #4: Cost effectiveness of Van Ness BRT and alternatives considered and withdrawn
The following comments touch on the Master Comment #4 topic: O-7-1, I-13-2, and I-13-3; I-31b-4
Master Response #4:
Cost effectiveness was a key consideration in selecting the BRT build alternatives for the Van Ness Avenue corridor in the Feasibility Study, the Screening Report, and in the Draft EIS/EIR. As part of the screening process, a wide range of alternatives was considered for further evaluation, including potentially lower-cost transit improvements such as Transit Preferential Streets (TPS) treatments without a dedicated bus lane, express buses, and more expensive alternatives including surface rail or a subway. As explained in greater detail in Master Response #2, alternatives were screened out of further environmental analysis if they contained a “fatal flaw” or overall low performance in meeting the project purpose and need. Section 2.6 of both the Draft and Final EIS/EIR includes additional information on alternatives considered and withdrawn (and the rationale for withdrawing them from consideration). Transit improvements that did not include a dedicated bus lane were screened out due to low performance, while the rail options were eliminated from further consideration based on high capital costs and construction intensity/duration.
The capital cost estimates for BRT range from $93 to $136 million. BRT would provide annual operating cost savings because faster speeds and reduced travel times allow fewer vehicles to provide the same service frequency. These savings would range from $1.2 to $2.4 million annually. Thus, the BRT project is expected to have a positive impact on Muni’s annual operating budget. The BRT project is expected to result in operational cost savings, reducing strain on Muni’s operating budget. By increasing transit speeds, fewer vehicles are needed on Van Ness Avenue to provide the same service frequency.3 As a result, the project is projected to reduce annual transit operating costs by 2.4 million for the LPA. These savings could be reinvested in additional service for the 47 or 49 which would further reduce crowding or elsewhere in the Muni system. In 2035, Mitigation M-TR-1 calls for an additional vehicle to be added into service on both the 47 and the 49. The operations costs analysis indicates that these vehicles could be added at no additional operating costs due to the costs savings from lower BRT travel times. For more information on project operations and maintenance costs, see Section 9.2 of the Final EIS/EIR.
Alternatives without the full BRT features, like express bus service, showed significantly lower benefits than the alternatives under consideration in the EIS/EIR (Van Ness BRT Screening Summary Report, 2008; Van Ness BRT Feasibility Study, 2007). Adding express or limited-stop buses on Van Ness Avenue would save capital cost compared with the BRT project, but would require higher SFMTA annual operating costs.
Lastly, the Van Ness Avenue BRT has received the Federal Transit Administration’s highest cost-effectiveness rating several years in a row. It is the only Small Starts Project in the country to receive at least a “medium-high” rating for Project Justification (which incorporates cost effectiveness), and is one of only two projects in Bay Area identified for Small Starts funding through MTC’s Resolution 3434, in part due to its cost effectiveness. Funding to construct the BRT project is not interchangeable with Muni operations funding for existing operations or additional vehicle operations. The identified funding sources for the project primarily include the Federal Transit Administration’s Small Starts program and San Francisco’s Prop K sales tax, both of which are legally restricted to providing funding to construct capital transit improvements. They are not permitted to fund ongoing transit operations. For more detail on project funding sources, please see Sections 9.1.3 and 9.1.4 of the EIS/EIR.
Master Comment #5: Transit stop elimination
3 The project will increase the size of buses from 40 ft to 60 ft, increasing capacity by 25 percent between the two SFMTA bus lines
operating on the Van Ness BRT corridor (49 and 47) without adding any additional vehicle.
Van Ness Avenue Bus Rapid Transit Project Appendix I: Comment Letters and Responses Final Environmental Impact Statement/ Environmental Impact Report
6
The following comments touch on the Master Comment #5 topic: A-7a-41, O-7-2, O-11b-2, I-3-2, I-42-4, I-49-6, I-53-3, I-56-4, I-56-5, I-57-3, and I-57-5.
Master Response #5:
As described in Section 2.2.2, under all build alternatives, six northbound and six southbound existing Muni bus stops on Van Ness Avenue which serve the 47 and 49 Muni lines would be discontinued. Under the LPA, a seventh northbound stop at Mission/South Van Ness would be discontinued, with the nearby 47 stop located on South Van Ness Avenue, just south of Mission Street. Under the LPA, the proposed project would have 8 or 9 northbound stations depending on if the Vallejo Northbound Station Variant is included, and 9 southbound BRT stations instead of the 15 northbound and 14 southbound Muni stops in each direction currently on Van Ness Avenue. The reason for eliminating, or consolidating, stops is to reduce dwell and overall travel time and to achieve greater reliability of service, which are key features of rapid transit such as BRT. Existing bus stops on intersecting and nearby streets would not be affected by the proposed project. For example, stop spacing would remain unchanged on the 19-Polk Muni line, which provides local Muni service one block east of Van Ness Avenue. Table 2-3 in the Final EIS/EIR shows the locations of proposed stations in each build alternative, including the LPA. All proposed stations would be within one block of Muni Rapid cross routes. Figures 2-2 and 2-3 show the locations of existing Muni bus stops, and the locations of the proposed LPA stations.
The average spacing of the proposed BRT station locations under the LPA would be approximately 1,130 feet, requiring an average walk of up to 565 feet (two blocks) from a location halfway between two stops; this would constitute an increase, on average, of up to approximately 215 feet of additional walking to access stops if a person had an origin or destination exactly between the proposed BRT station locations. A distance of 215 feet is less than one block along Van Ness Avenue. On average, the proposed project complies with the applicable 1,000- to 1,200-foot spacing guideline for light rail lines (source: SFMTA FY 2008-FY2027 Draft Short Range Transit Plan, 2007).4
In addition to considering Muni’s stop spacing guideline, the BRT station locations are based on three goals: 1) place stops as evenly spread out as possible within the project corridor; 2) consider ridership and place stations where the largest numbers of passengers board and alight; and 3) facilitate easy connections with other Muni lines, particularly other Rapid network lines. Grade was also considered, and stations were not proposed on blocks with a grade of greater than 8 percent, consistent with ADA standards. Within the study area, more than 70% of the blocks along Van Ness Avenue have grades less than 5%, and there are no blocks with grades greater than 10 percent. The proposed BRT station locations were then refined based on public and agency input into the design process, including from the Van Ness BRT Citizens Advisory Committee, the Mayor’s Office on Disability, and accessibility coordinators at the SFDPW and SFMTA. In recent public meetings, considerable concern was expressed by local residents regarding the lack of transit stations proposed in the vicinity of the Van Ness Avenue and Vallejo Street intersection. In response to this public concern, a southbound transit station at the intersection of Van Ness Avenue and Vallejo Street has been incorporated into the LPA. A northbound transit station in this same location, referred to as the Vallejo Northbound Station Variant, could also be implemented, and will be decided upon at the time of project approval.
The project team has also met with local groups and organizations that focus on accessibility issues during preparation of the Feasibility Study and EIS/EIR, including the Lighthouse for the Blind and Visually Impaired, the Mayors Disability Council Physical Access Committee, and the Muni Accessibility Advisory Committee, to gather input for the BRT project. Chapter 8 of the Final EIS/EIR provides additional detail on the public participation process.
As described in Section 2.2.2, existing stops for the 47 and 49 bus lines are approximately 700 feet apart on Van Ness Avenue. This is approximately 100 feet closer together than Muni recommends for the local bus network. Consolidation of existing stops will mean that some bus patrons will need to walk further to reach a bus stop compared with existing conditions. The project proponents recognize that the proposed project would increase the distance between stops, which would increase the physical effort required to reach transit relative to existing conditions for some bus patrons. This may pose a burden to some bus patrons. The Van Ness BRT project is
4 There are no SFMTA stop spacing guidelines for BRT.
Van Ness Avenue Bus Rapid Transit Project Appendix I: Comment Letters and Responses Final Environmental Impact Statement/ Environmental Impact Report
7
designed to be as universally accessible as possible. The Draft EIS/EIR provided a full evaluation of the project’s accessibility for all users, which was updated and included in Section 3.4.3.1 of the Final EIS/EIR. The evaluation is based on the principles of Universal Design and recognizes that users, including the elderly and disabled, may have different concerns. Some may depend on transit to meet their need for efficient travel in the Van Ness corridor, while others prefer more frequent stops to minimize walking distances. The evaluation identifies the increase in physical effort required to reach a transit stop as posing a challenge to some riders, but also notes other benefits the project provides to improve accessibility in the corridor. For example, level or near level boarding at BRT stations would reduce the physical effort required to board transit vehicles, while curb bulbs, nose cones, pedestrian countdown signals, and accessible pedestrian signals at intersections would allow people with a greater range of physical abilities to safely cross the street.
Master Comment #6 Construction impacts on businesses and residents
The following comments touch on the Master Comment #6 topic: O-5-1, O-5-5, O-5-7, O-5-8, O-5-14, O-5-16, I-
8-1, I-4-1, I-11-2, I-20-3, I-31a-1, and I-36-1, and I-36-8.
As explained in Section 4.15 Construction Impacts of both the Draft and Final EIS/EIR, residents and businesses
would experience temporary impacts during project construction related to increased noise, dust, vibration, and air
emissions from construction equipment. Also, transit patrons may be inconvenienced by relocation of transit stops
and delayed transit service; and drivers would experience slower speeds along Van Ness Avenue. In addition,
parking may be temporarily converted to mixed-flow traffic lanes, resulting in a loss of colored and non-colored
parking spaces along Van Ness Avenue. A description of the construction plan is provided below, followed by a
discussion of construction impacts and how they would be addressed.
Construction would include the following major activities along the length of the proposed project: pavement
rehabilitation as needed along the transitway, pavement resurfacing of Van Ness Avenue from curb to curb,
reconstruction of curb and gutters (including curb bulbs), replacement of the sewer pipeline, reconfiguration of the
median, construction of BRT stations, replacement of the OCS support poles/streetlights system, replacement of
traffic signal infrastructure, and associated utility relocations. BRT station construction would involve installing
components such as platforms, canopies, ticket vending equipment, railings, lighting, signage, and station furniture.
Project construction is anticipated to last a period of 20 months for the LPA. With the exception of replacement
of the overhead contact system support poles/streetlights and equipment staging and transport, all construction
activities would occur within the existing Van Ness Avenue right-of-way. There would be no complete sidewalk
closures, and merchant access would be maintained throughout construction. Two traffic lanes would remain open
in each direction during peak periods, although additional closures may be necessary during off-peak hours. The
preferred construction approach is to have three-block segments of Van Ness Avenue in spaced out locations in
the corridor under construction at time, limiting the disruption to particular businesses. In other words,
construction activities would primarily occur on multiple 3-block segments on Van Ness Avenue at one time.
Thus, multiple construction crews would be working at different 3-block segments along the corridor at one time.
This approach would stagger the impacts of construction along the corridor and minimize the duration of the
disruption at any one location, although it would involve the most intensive environmental impacts (i.e. traffic,
parking and air quality) at one location. The preferred construction approach would be the most efficient
approach in terms of resource management and mobilization and would minimize the effect of delays at one
location greatly impacting the entire project schedule.
During construction, temporary conversion of existing parking lanes to mixed-flow traffic lanes would be
implemented on the three-block segments where construction is taking place, resulting in removal of on-street
parking on both sides of Van Ness Avenue within the 3-block segments. This allows for a minimum of two lanes
of traffic open in each direction while construction in the segment is underway. Parking would be maintained on
Van Ness Avenue Bus Rapid Transit Project Appendix I: Comment Letters and Responses Final Environmental Impact Statement/ Environmental Impact Report
8
the blocks where construction is not underway, aside from completed blocks where parking would be permanently
removed by the project design. Temporary removal of curbside parking would include colored parking spaces,
including truck and passenger loading spaces, which could affect surrounding land uses. As part of the TMP
described below, the SFMTA will work with affected land uses to determine modified loading operations during
construction. Sidewalks will remain open during construction, therefore, it is not anticipated that access to
businesses and other properties along Van Ness Avenue would be disrupted. During construction, there would be
a temporary increase in traffic, slower speeds along Van Ness Avenue, and reduced road capacity due to the
closure of one southbound and one northbound traffic lane. Existing transit service would be disrupted; bus stops
would be relocated along Van Ness Avenue, and buses would experience reduced speeds as well.
Lastly, the affected community would be subject to noise, dust, vibration, and air emissions from construction
equipment during project construction. These impacts would cause temporary inconvenience to area residents,
businesses, and people traveling through the corridor, and would therefore be considered less than significant.
They could be minimized by implementing a Transportation Management Plan (TMP) and keeping the public
informed about the construction schedule and activities throughout the construction period. The following
mitigation measures will be implemented through the TMP:
A TMP that includes traffic rerouting, a detour plan, and public information procedures will be
developed during the design phase with participation from local agencies, other major project
proponents in the area (e.g., CPMC Cathedral Hill, Hayes Two-Way Conversion, and the Geary Corridor
BRT projects), local communities, business associations, and affected drivers. Early and well-publicized
announcements and other public information measures will be implemented prior to and during
construction to minimize confusion, inconvenience, and traffic congestion.
As part of the TMP, construction planning will minimize nighttime construction in residential areas and
minimize daytime construction impacts on retail and commercial areas.
As part of the TMP, construction scheduling and planning in the Civic Center area will take into
consideration major civic and performing arts events.
As part of the TMP public information program, SFMTA will coordinate with adjacent properties along
Van Ness Avenue to determine the need for colored parking spaces and work to identify locations for
replacement spaces or plan construction activities to minimize impacts from the loss of these spaces.
As part of the TMP public information program, SFMTA will coordinate with adjacent properties along
Van Ness Avenue to ensure that pedestrian access to these properties is maintained at all times.
As part of the TMP, the SFMTA’s process for accepting and addressing complaints would be
implemented. This includes provision of contact information for the Project Manager, Resident
Engineer, and Contractor on project signage with direction to call if there are any concerns. Complaints
are logged and tracked to ensure they are addressed.
As part of the TMP, adequate passenger and truck loading zones would be maintained for adjacent land
uses, including maintaining access to driveways and providing adequate loading zones on the same or
adjoining street block face.
In addition to these measures, during construction coordination with relevant City and State agencies will occur to
minimize temporary impacts to traffic, transit, parking and non-motorized users. The SFMTA would also have
advisory committees throughout design and construction; these committees would have community members as
business representatives present for input.
Van Ness Avenue Bus Rapid Transit Project Appendix I: Comment Letters and Responses Final Environmental Impact Statement/ Environmental Impact Report
9
Furthermore, all construction activities would be coordinated with other projects planned in the Van Ness Avenue corridor, including the CPMC Cathedral Hill and Geary BRT projects, and repaving along Franklin, Gough and Polk streets as part of the Road Repaving and Street Safety Bond Program (including the Polk Street Corridor Improvement Project). A Project Construction Plan (PCP) has been prepared to provide detailed information, schedules, and maps on construction of the Van Ness Avenue BRT Project. This document will be kept current in coordination with the TMP. The PCP and TMP take into account potential impacts of other planned projects under construction in the general vicinity of the Van Ness Avenue BRT Project. Coordination of all planned construction activities and permanent utility relocation and modification activities with the other projects in the vicinity would minimize cumulative construction impacts. Coordination and planning efforts are facilitated through the San Francisco Committee for Utility Liaison on Construction and Other Projects (CULCOP), the San Francisco Street Construction Coordination Center which include representatives from multiple city agencies like the Planning Department and Department of Public Works, and Caltrans with the emphasis on the most efficient construction planning to minimize disruption to the community.
Master Comment #7: Tree removals and replanting opportunities The following comments touch on the Master Comment #7 topic and express a desire for the preservation of
trees, ask for more information about the quality of trees to be removed, or question the if the tree removal
information is accurate: O-6a-3, I-14-1, I-15-1, I-16-1, I-36-6, I-39-4, I-40d-27, I-42-3, I-47-1, I-57-6, I-64-2, I-
68-3, A-7a-2,Aa-7a-4, A-7a-29, A-7a-30, A-7a-31, A-7a-32, A-7a-35, A-7b-2, A-7c-3, A-7c-13, A-7c-15, A-7c-18,
A-7c-22, A-7c-26, A-7c-31, A-7c-35, A-7c-38, A-7c-42, A-7e-2, A-7e-3, A-7f-2, A-7f-3, A-7f-4, A-7f-5, A-7f-6, A-
7h-2, A-7h-12, A-7h-18, A-7h-26, A-7i-1, A-7i-4.
Master Response #7:
The effect of the proposed project on existing trees was another major concern expressed in comments. There is a strong desire among the public and local agencies to preserve existing trees. The San Francisco Department of Public Works (SFDPW) requested additional analysis be completed pertaining to removal of median trees, which is reflected in Sections 4.4.2.5 and 4.4.3.4 of this document.
Thus in response to comments received and developments in project design explained below, a more comprehensive Tree Removal Evaluation and Planting Opportunity Analysis was undertaken in 2012 to identify the maturity and health of trees in the corridor and therefore better understand the impacts of tree removal and the opportunities for preserving trees, and the parameters of new tree plantings (BMS, 2013). This analysis was undertaken for all of the build alternatives, including the LPA. The 2012 survey took into account the following factors that were not taken into account in the 2009 survey, the results of which were presented in the Draft EIS/EIR:
In October 2012, Caltrans issued a design requirement for the project that new tree plantings must be set back by 35 feet from each intersection. This 35-foot setback must be applied to all new, or replacement, tree plantings and is not being applied to existing trees. In other words, existing median trees must not be removed to achieve the 35-foot setback. The 35-foot setback reduces the number of replacement trees that can be planted under all of the build alternatives, including the LPA.
Sidewalk trees that would be removed under Build Alternative 2 were quantified, as well as locations where median trees would need to be removed to accommodate turn pockets.
The maturity and condition of all median trees, as well as each sidewalk tree that would be removed under build Alternative 2, were evaluated to better understand the biological and aesthetic value of these trees and the impacts that would result from removal of existing trees under each build alternative, including the LPA. This evaluation informed impacts, as well as opportunities, for tree preservation reported in Sections 4.4 and 4.13.
A 15-foot separation etween existing trees to be preserved and new trees to be planted was assumed in determining the number of new trees that could be planted.
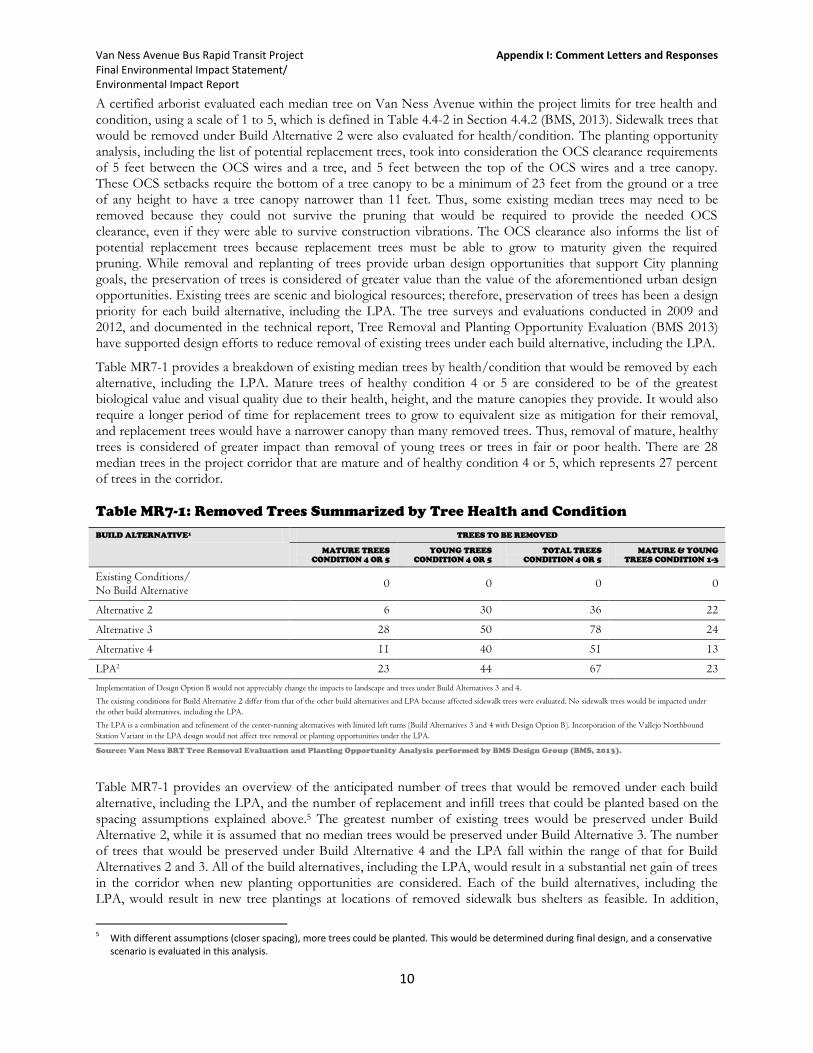
Van Ness Avenue Bus Rapid Transit Project Appendix I: Comment Letters and Responses Final Environmental Impact Statement/ Environmental Impact Report
10
A certified arborist evaluated each median tree on Van Ness Avenue within the project limits for tree health and condition, using a scale of 1 to 5, which is defined in Table 4.4-2 in Section 4.4.2 (BMS, 2013). Sidewalk trees that would be removed under Build Alternative 2 were also evaluated for health/condition. The planting opportunity analysis, including the list of potential replacement trees, took into consideration the OCS clearance requirements of 5 feet between the OCS wires and a tree, and 5 feet between the top of the OCS wires and a tree canopy. These OCS setbacks require the bottom of a tree canopy to be a minimum of 23 feet from the ground or a tree of any height to have a tree canopy narrower than 11 feet. Thus, some existing median trees may need to be removed because they could not survive the pruning that would be required to provide the needed OCS clearance, even if they were able to survive construction vibrations. The OCS clearance also informs the list of potential replacement trees because replacement trees must be able to grow to maturity given the required pruning. While removal and replanting of trees provide urban design opportunities that support City planning goals, the preservation of trees is considered of greater value than the value of the aforementioned urban design opportunities. Existing trees are scenic and biological resources; therefore, preservation of trees has been a design priority for each build alternative, including the LPA. The tree surveys and evaluations conducted in 2009 and 2012, and documented in the technical report, Tree Removal and Planting Opportunity Evaluation (BMS 2013) have supported design efforts to reduce removal of existing trees under each build alternative, including the LPA.
Table MR7-1 provides a breakdown of existing median trees by health/condition that would be removed by each alternative, including the LPA. Mature trees of healthy condition 4 or 5 are considered to be of the greatest biological value and visual quality due to their health, height, and the mature canopies they provide. It would also require a longer period of time for replacement trees to grow to equivalent size as mitigation for their removal, and replacement trees would have a narrower canopy than many removed trees. Thus, removal of mature, healthy trees is considered of greater impact than removal of young trees or trees in fair or poor health. There are 28 median trees in the project corridor that are mature and of healthy condition 4 or 5, which represents 27 percent of trees in the corridor.
Table MR7-1: Removed Trees Summarized by Tree Health and Condition
BUILD ALTERNATIVE1 TREES TO BE REMOVED
MATURE TREES
CONDITION 4 OR 5
YOUNG TREES
CONDITION 4 OR 5
TOTAL TREES
CONDITION 4 OR 5
MATURE & YOUNG
TREES CONDITION 1-3
Existing Conditions/ No Build Alternative
0 0 0 0
Alternative 2 6 30 36 22
Alternative 3 28 50 78 24
Alternative 4 11 40 51 13
LPA2 23 44 67 23
Implementation of Design Option B would not appreciably change the impacts to landscape and trees under Build Alternatives 3 and 4.
The existing conditions for Build Alternative 2 differ from that of the other build alternatives and LPA because affected sidewalk trees were evaluated. No sidewalk trees would be impacted under
the other build alternatives, including the LPA.
The LPA is a combination and refinement of the center-running alternatives with limited left turns (Build Alternatives 3 and 4 with Design Option B). Incorporation of the Vallejo Northbound
Station Variant in the LPA design would not affect tree removal or planting opportunities under the LPA.
Source: Van Ness BRT Tree Removal Evaluation and Planting Opportunity Analysis performed by BMS Design Group (BMS, 2013).
Table MR7-1 provides an overview of the anticipated number of trees that would be removed under each build alternative, including the LPA, and the number of replacement and infill trees that could be planted based on the spacing assumptions explained above.5 The greatest number of existing trees would be preserved under Build Alternative 2, while it is assumed that no median trees would be preserved under Build Alternative 3. The number of trees that would be preserved under Build Alternative 4 and the LPA fall within the range of that for Build Alternatives 2 and 3. All of the build alternatives, including the LPA, would result in a substantial net gain of trees in the corridor when new planting opportunities are considered. Each of the build alternatives, including the LPA, would result in new tree plantings at locations of removed sidewalk bus shelters as feasible. In addition,
5 With different assumptions (closer spacing), more trees could be planted. This would be determined during final design, and a conservative
scenario is evaluated in this analysis.
Van Ness Avenue Bus Rapid Transit Project Appendix I: Comment Letters and Responses Final Environmental Impact Statement/ Environmental Impact Report
11
under each of the build alternatives, including the LPA, trees would be planted in areas of the median where trees do not currently exist, and where existing trees would require removal because they would not survive project construction. Increased sidewalk and median tree plantings over existing conditions would improve the visual setting, with improvements growing over time as plantings mature, resulting in long-term, beneficial effects. At the same time, however, there would be a plant establishment period lasting for several years for new trees to reach maturity. This would be a period of reduced benefits compared with the benefits offered by mature trees and their canopies. The trade-offs between increased plantings in the corridor and the loss of existing trees is discussed for each build alternative, including the LPA, in Section 4.4.3.4 of this document.
Master Comment #8: Calculating and Modeling Existing and Future Traffic, Including Traffic Diversions
The following comments touch on the Master Comment #8 topic: O-1-3, O-2-8, O-7-3, O-9-1, I-8-3, I-31b-1, I-31b-4, I-31b-5, I-31b-7, I-32-1, I-32-2, I-38-5, I-38-10, I-40d-6, I-40d-10, I-40d-11, I-40d-13, I-40d-16, I-40d-19, I-40d-24, I-40d-34, I-55-3, I-67-2, and I-69-1.
Due to the complexity and large scale of the traffic study area, a multi-step process was used to calculate and model changes in traffic volumes that would result from the implementation of BRT, including the diversion of traffic from Van Ness Avenue onto other streets, as well as to calculate the associated transportation impacts. An overview of the process is shown in the bullet points below, and is further described through this response, Master Response #10, and in greater detail in the Vehicular Traffic Analysis Technical Memorandum (CHS, 2011):
1. Traffic turning movement counts were collected at 91 of the 139 intersections in the traffic study area (see Figure 3.3-1 of the Final EIS/EIR for a map of traffic study area) in the spring of 2007. The counts were collected at all intersections on Gough, Franklin, and Van Ness Avenue within the traffic study area and an additional 11 intersections on Polk, Larkin and Hyde streets within the traffic study area.
2. The specific turning movement counts collected as part of Step 1 were used, along with a signal timing plan provided by the SFMTA, to calibrate the existing conditions (2007) Synchro traffic analysis model.
3. Separately, 24-hour traffic counts were collected in March 2007 at five locations along Van Ness Avenue and one location each along Franklin and Gough streets. These locations were selected because they represent blocks in the traffic study area with arterial roads as cross streets in the northern, middle, and southern sections. These 24-hour counts (different than the turning movement counts taken at 91 intersections) were taken to determine the peak hour to perform the intersection LOS analysis (as shown in Table 3.3.1 of the EIS/EIR), -
4. San Francisco Chained Activity Modeling Process (SF-CHAMP), San Francisco’s Travel Demand forecasting model was used to predict changes in origin/destination choice, travel mode (i.e., auto, transit, bicycle, etc.) choice, and route choice for the entire San Francisco area with the implementation of anticipated land use changes (i.e., development projects) and transportation changes (i.e., Van Ness BRT and other anticipated projects such as Central Subway and the Presidion Parkway). The direction and amount of change (i.e., percent of growth or reduction) in traffic volumes were then applied to the existing traffic volumes and those volumes used in the existing conditions (2007) Synchro traffic analysis model. This provided turning movement traffic counts for every intersection in the traffic study area for the No Build Alternative and each build alternative in 2015 and 2035.
5. A series of refinements were made to the modeled intersection traffic volumes for each scenario to account for factors SF-CHAMP isn’t designed to capture (e.g., grades, signal timing, etc.).
6. The final volumes for the No Build Alternative and each build alternative, in both 2015 and 2035, created through steps 1 through 5 were used as inputs to Synchro traffic analysis models which were used to calculate traffic impacts on Van Ness Avenue and five parallel streets in Chapter 3.3 of the EIS/EIR. The volumes were also used to create the inputs for the localized Air Quality and Noise and Vibration impacts analysis in Chapter 4.10 and 4.11 (see Master Responses #11 and #12).
Van Ness Avenue Bus Rapid Transit Project Appendix I: Comment Letters and Responses Final Environmental Impact Statement/ Environmental Impact Report
12
7. The LOS analysis, based on outputs of the existing conditions Synchro model which was calibrated using the PM peak turning movement traffic counts at 91 intersections, showed that all of the intersections in the traffic study area, except for the intersection of Gough Street and Green Street, operated at LOS D or better conditions in 2007 (see Section 3.3.2.4 and Figure 3.3-2). This method is consistent with standard traffic engineering practice to evaluate LOS conditions for both existing conditions and future year baselines in NEPA and CEQA.
Use of SF-CHAMP
SF-CHAMP is the San Francisco travel demand forecasting model developed by SFCTA, and it was used to determine how the project would change traffic patterns or modes of transport as described in Chapter 3 of the EIS/EIR. SF-CHAMP is a computer-based tool that can be used to assess the impacts of land use, socioeconomic, and transportation system changes on the performance of the local transportation system. SF-CHAMP was developed to reflect San Francisco’s unique transportation system and socioeconomic and land use characteristics. The relationships and parameters in SF-CHAMP were statistically estimated from San Francisco residents’ observed travel patterns and then tested to make sure the model matched observed transit line boardings, roadway volumes, and numbers of vehicles. For each modeled scenario, a detailed representation of San Francisco’s transportation system is used, as well as population and employment characteristics, to produce measures relevant to transportation and land use planning. Using future year transportation, land use, and socioeconomic inputs, the model forecasts future travel demand.
The SF-CHAMP Model incorporates a state-of-the-art approach to forecasting travel demand called “tour”, or “activity-based travel demand modeling”. This activity-based model is more sensitive than traditional four-step models to a broader array of conditions that influence travelers’ choices. The federal government, as part of the Travel Model Improvement Program (TMIP), Transportation Research Board, and the Second Strategic Highway Research Program (SHRP2) has recently invested a great deal of resources to get as many metropolitan areas as possible to adopt this state-of-the-art approach (see tmiponline.org, TRB Special Report 288, and SHRP2 C10 and C46 scope of work).
SF-CHAMP has been reviewed by local, regional, and federal agencies, and published in numerous peer reviewed transportation and modeling journals, and has been approved for use on federal projects by the MTC as part of their bi-annual model consistency process. SF-CHAMP is the primary tool for travel demand forecasting in San Francisco, and is commonly used by multiple San Francisco agencies, including the SFMTA and the Planning Department’s Environmental Planning section for the travel demand forecasting component of transportation impact analyses. More information on the SF-CHAMP model can be found at www.sfcta.org/modeling and a validation report can be found in Appendix 1 of the Van Ness BRT Vehicular Traffic Analysis Technical Memorandum (CHS, 2013).
For purposes of this project, SF-CHAMP incorporated projected land use growth for both the 2015 and 2035 scenarios as inputs, using ABAG 2007 projections which were used in the most recently adopted Regional Transportation Plan (RTP), Transportation 2035, for which an EIR was prepared.6State of California Government Code 65089 states that data bases (i.e., land use inputs) for models such as SF-CHAMP used to determine quantitative impacts of development on the circulation system “…shall be consistent with the data bases used by the regional planning agency [i.e., MTC]”. For this reason, land use projections used in the SF-CHAMP model for EIRs led by the San Francisco Planning Department as well as this EIS/EIR are required to use land use projections that are within one percent of regional ABAG projections for population, employed residents, households, and employment. . The San Francisco Planning Department takes San Francisco’s employment and housing growth provided by ABAG and distributes the growth to better reflect anticipated developments in San Francisco such as the California Pacific Medical Center and the Market and Octavia Area Plan. This methodology has been approved by the MTC such that the project remains federally compliant. . See Appendix 2 of the Van Ness BRT Vehicular Traffic Analysis Technical Memorandum (CHS,
6 The land use projections used for the Van Ness Avenue BRT EIS/EIR modeling effort are discussed briefly in
Section 3.1.2 of the EIS/EIR and in more detail in the Traffic Analysis Technical Memorandum (CHS, 2013),
Van Ness Avenue Bus Rapid Transit Project Appendix I: Comment Letters and Responses Final Environmental Impact Statement/ Environmental Impact Report
13
2013) for details on how the Planning Department allocates future growth in San Francisco. SF-CHAMP also incorporates all anticipated transportation network changes separate from the Van Ness BRT Project in both the 2015 and 2035 scenarios. A list of these improvements can be found in Chapter 2 of the Final EIS/EIR.
SF-CHAMP was used as the primary technical modeling tool to predict changes in travel patterns for private vehicles with the implementation of BRT in both the near term (2015) and horizon year (2035). The SF-CHAMP model takes into account the “attractiveness” (i.e., relative capacity, driving travel time, left turn opportunities, etc.) of streets relative to each other, as well as the relative “attractiveness” of other modes (e.g., cost, travel time, frequency, etc.) when determining the changes in traveler behavior with the implementation of BRT. In other words, Van Ness Avenue would be less attractive to drivers when compared with the No Build Alternative and BRT service on Van Ness Avenue would be slightly more attractive than the 47/49 service under the No Build Alternative. SF-CHAMP does not take into account changes in signal timing (although it does take into account transit travel time improvements through the implementation of TSP) or the nuances of operations such as queuing for specific directional movements (i.e., a right turn at a specific intersection).
For the build alternatives, SF-CHAMP was coded to show one lane of mixed traffic converted to transit only in each direction, representing a reduced capacity of slightly less than 1/3 (the buses would no longer be operating in the mixed traffic lanes). SF-CHAMP was also coded to reflect the BRT benefits that are proposed as part of the project 47 and 49 with benefits meant to represent BRT (see Appendix 2 of the Vehicular Traffic Analysis Technical Memorandum, CHS, 2013). Since SF-CHAMP calculations are based on observed San Francisco traveler behavior in circumstances that reflect changes in streets’ auto capacity or increases in transit performance, the outputs are representative of behavior change with the implementation of BRT.
Calculating Traffic Volumes for No Build and Build Alternatives
Traffic volumes for the existing conditions were collected based on actual field counts. Volumes for 2015 and 2035 No Build and Build Alternatives were developed based on series of modeling and manual refinement processes, as described below.
1). Existing traffic counts: Traffic turning movement counts were collected at 91 of the 139 intersections in the traffic study area (see Figure 3.3-1 of the EIS/EIR for a map of intersections in the traffic study area) in the spring of 2007 with a few additional intersections collected in 2008 and 2009 to better model the traffic south of Market within the traffic study area. The counts were collected at all intersections on Gough, Franklin, and Van Ness Avenue within the traffic study area and an additional 11 intersections on Polk, Larkin and Hyde streets within the traffic study area. Traffic counts were also collected at the intersection of Duboce/13th/US 101 Freeway offramp. Intersections where turning movement counts were collected can be found in Appendix 4 of the Vehicular Traffic Analysis Technical Memorandum (CHS, 2013) 7.
2) Traffic volume balancing: The specific turning movement counts collected as part of Step 1 were used, along with a signal timing plan provided by the SFMTA, to create the existing conditions (2007) Synchro traffic model. This original set of volumes was balanced for all 139 study area intersections between the total number of vehicles arriving at an intersection and departure from an intersection. For study area intersections along Polk, Larkin, and Hyde streets where existing conditions volumes were not collected using field counts, this balancing exercise was used to estimate the amount of traffic in the existing conditions Synchro Model. Section 2.2 of the Vehicular Traffic Analysis Technical Memorandum (CHS, 2013) describes the results of the existing conditions (2007) Synchro traffic model.
3) 2015 and 2035 traffic volume estimation: The traffic volume estimates generated by SF-CHAMP for the near-term 2015 and long-term 2035 horizon years were used to calculate growth factors (i.e., percent change in volumes) between 20058 and 2015 and between 2005 and 2035 for each north-south street in four different sections of the corridor from the Duboce/13th/US 101 Freeway offramp to Lombard Street. and for the east-west streets by facility type (e.g. arterial, collector, and local streets) in the traffic study area from Mission to
7 Please note that these intersection level traffic counts are different than the 24-hour traffic counts described in Section 3.3.2.2 (Table 3.3-1) which were used to determine the time period with peak traffic volumes in the traffic study area. 8 SF-CHAMP represents transportation in 5-year increments. The 2005 estimates most closely match the 2007 existing conditions traffic volumes collected through field data
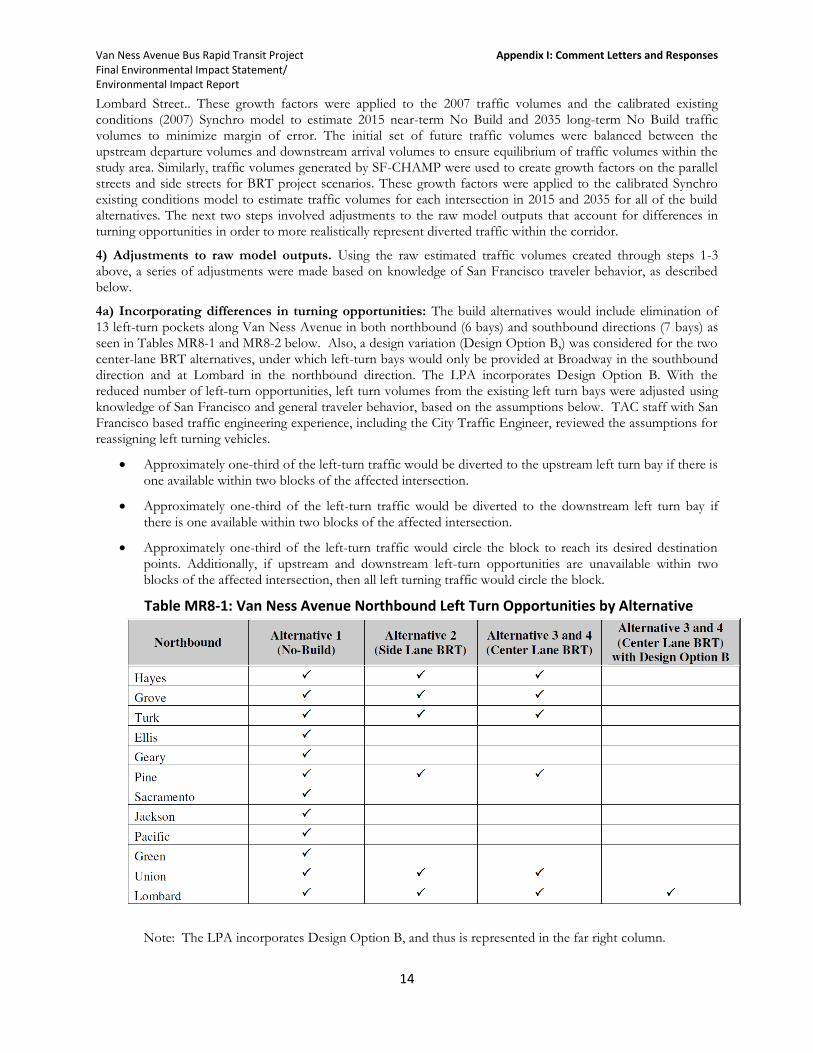
Van Ness Avenue Bus Rapid Transit Project Appendix I: Comment Letters and Responses Final Environmental Impact Statement/ Environmental Impact Report
14
Lombard Street.. These growth factors were applied to the 2007 traffic volumes and the calibrated existing conditions (2007) Synchro model to estimate 2015 near-term No Build and 2035 long-term No Build traffic volumes to minimize margin of error. The initial set of future traffic volumes were balanced between the upstream departure volumes and downstream arrival volumes to ensure equilibrium of traffic volumes within the study area. Similarly, traffic volumes generated by SF-CHAMP were used to create growth factors on the parallel streets and side streets for BRT project scenarios. These growth factors were applied to the calibrated Synchro existing conditions model to estimate traffic volumes for each intersection in 2015 and 2035 for all of the build alternatives. The next two steps involved adjustments to the raw model outputs that account for differences in turning opportunities in order to more realistically represent diverted traffic within the corridor.
4) Adjustments to raw model outputs. Using the raw estimated traffic volumes created through steps 1-3 above, a series of adjustments were made based on knowledge of San Francisco traveler behavior, as described below.
4a) Incorporating differences in turning opportunities: The build alternatives would include elimination of 13 left-turn pockets along Van Ness Avenue in both northbound (6 bays) and southbound directions (7 bays) as seen in Tables MR8-1 and MR8-2 below. Also, a design variation (Design Option B,) was considered for the two center-lane BRT alternatives, under which left-turn bays would only be provided at Broadway in the southbound direction and at Lombard in the northbound direction. The LPA incorporates Design Option B. With the reduced number of left-turn opportunities, left turn volumes from the existing left turn bays were adjusted using knowledge of San Francisco and general traveler behavior, based on the assumptions below. TAC staff with San Francisco based traffic engineering experience, including the City Traffic Engineer, reviewed the assumptions for reassigning left turning vehicles.
Approximately one-third of the left-turn traffic would be diverted to the upstream left turn bay if there is
one available within two blocks of the affected intersection.
Approximately one-third of the left-turn traffic would be diverted to the downstream left turn bay if
there is one available within two blocks of the affected intersection.
Approximately one-third of the left-turn traffic would circle the block to reach its desired destination
points. Additionally, if upstream and downstream left-turn opportunities are unavailable within two blocks of the affected intersection, then all left turning traffic would circle the block.
Table MR8-1: Van Ness Avenue Northbound Left Turn Opportunities by Alternative
Note: The LPA incorporates Design Option B, and thus is represented in the far right column.
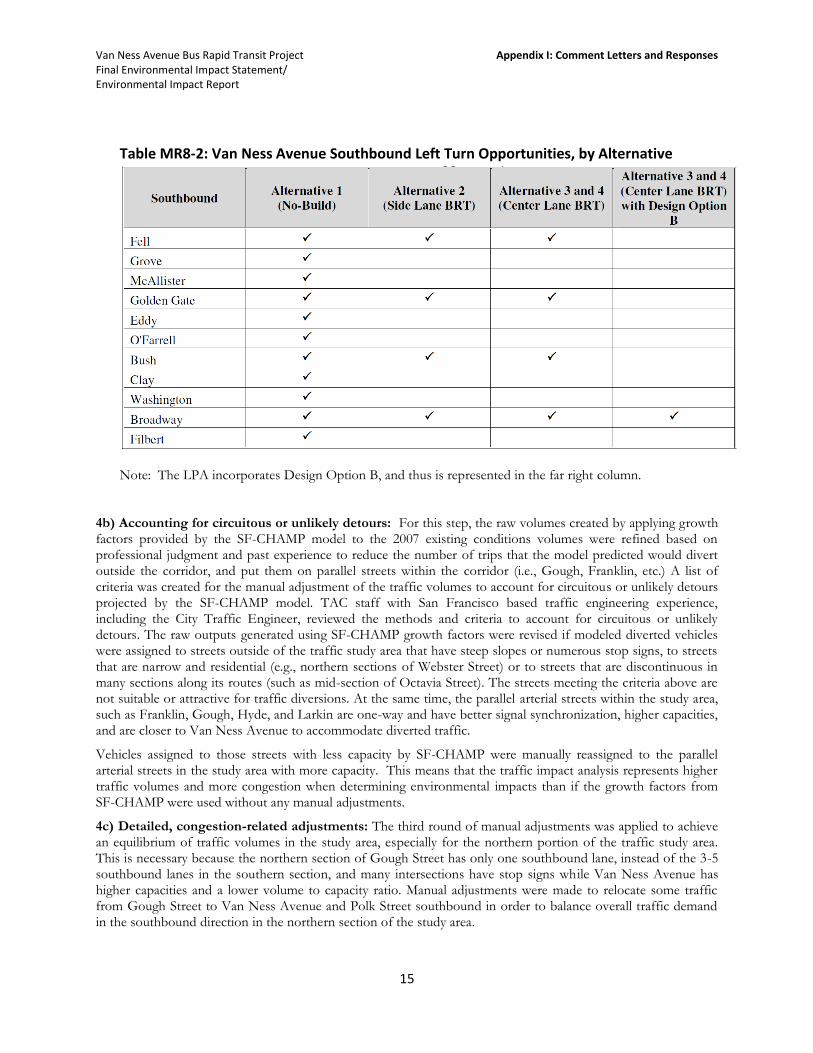
Van Ness Avenue Bus Rapid Transit Project Appendix I: Comment Letters and Responses Final Environmental Impact Statement/ Environmental Impact Report
15
Table MR8-2: Van Ness Avenue Southbound Left Turn Opportunities, by Alternative
Note: The LPA incorporates Design Option B, and thus is represented in the far right column.
4b) Accounting for circuitous or unlikely detours: For this step, the raw volumes created by applying growth factors provided by the SF-CHAMP model to the 2007 existing conditions volumes were refined based on professional judgment and past experience to reduce the number of trips that the model predicted would divert outside the corridor, and put them on parallel streets within the corridor (i.e., Gough, Franklin, etc.) A list of criteria was created for the manual adjustment of the traffic volumes to account for circuitous or unlikely detours projected by the SF-CHAMP model. TAC staff with San Francisco based traffic engineering experience, including the City Traffic Engineer, reviewed the methods and criteria to account for circuitous or unlikely detours. The raw outputs generated using SF-CHAMP growth factors were revised if modeled diverted vehicles were assigned to streets outside of the traffic study area that have steep slopes or numerous stop signs, to streets that are narrow and residential (e.g., northern sections of Webster Street) or to streets that are discontinuous in many sections along its routes (such as mid-section of Octavia Street). The streets meeting the criteria above are not suitable or attractive for traffic diversions. At the same time, the parallel arterial streets within the study area, such as Franklin, Gough, Hyde, and Larkin are one-way and have better signal synchronization, higher capacities, and are closer to Van Ness Avenue to accommodate diverted traffic.
Vehicles assigned to those streets with less capacity by SF-CHAMP were manually reassigned to the parallel arterial streets in the study area with more capacity. This means that the traffic impact analysis represents higher traffic volumes and more congestion when determining environmental impacts than if the growth factors from SF-CHAMP were used without any manual adjustments.
4c) Detailed, congestion-related adjustments: The third round of manual adjustments was applied to achieve an equilibrium of traffic volumes in the study area, especially for the northern portion of the traffic study area. This is necessary because the northern section of Gough Street has only one southbound lane, instead of the 3-5 southbound lanes in the southern section, and many intersections have stop signs while Van Ness Avenue has higher capacities and a lower volume to capacity ratio. Manual adjustments were made to relocate some traffic from Gough Street to Van Ness Avenue and Polk Street southbound in order to balance overall traffic demand in the southbound direction in the northern section of the study area.
Van Ness Avenue Bus Rapid Transit Project Appendix I: Comment Letters and Responses Final Environmental Impact Statement/ Environmental Impact Report
16
This adjustment is reasonable because the roadway network in downtown San Francisco is a grid system, and driver behavior indicates that travelers in San Francisco will find the fastest alternative routes to reach their destinations if one street is overly congested. This is especially the case if the congested street is more constrained, has numerous stop signs, and has a steep grade (e.g., northern sections of Gough Street) whereas alternative streets have comparatively more lanes and capacities (e.g., Van Ness Avenue). Approximately 100 to 120 vehicles were reassigned for the 2015 build alternatives. Approximately 150 to 170 vehicles were reassigned for the 2035 build alternatives. TAC staff with San Francisco based traffic engineering experience, including the City Traffic Engineer, reviewed the methodology for making these detailed, congestion-related adjustments.
4d) Accounting for different left turning opportunities for Design Option B and the LPA: Design Option B and the LPA only have one left turn opportunity SB (Broadway) and one left turn opportunity NB (Lombard) within the BRT corridor. Based on data about the origins and destinations of left-turning drivers from SF-CHAMP, as well as the relative capacities, operations, and characteristics of the numerous intersections in the Van Ness BRT Traffic Study Area, left-turning traffic at the left turn bays for Build Alternatives 3 and 4 was reassigned to other routes within the study area to develop the 2015 and 2035 Build Alternatives 3 and 4 Design Option B (and the LPA) traffic volumes. All vehicles for each left turn opportunity were reassigned based on the likely diversion of traffic for that particular movement. Figure MR8-1 below provides an example of how the reassignment was done for NB left turns at Pine Street. Appendix 7 of the Vehicular Traffic Analysis Technical Memorandum shows how the reassignment was done for all eight remaining left turn opportunities. TAC staff, including the City Traffic Engineer, reviewed the approach to reassignment of the left turning traffic for Design Option B.
4e) Balancing: The forecast traffic volumes were then balanced between the upstream departure volumes and downstream arrival volumes to ensure equilibrium of traffic volumes within the study area for all No Build and Build alternatives.
The adjustment method described above provided the resulting changes in travel demand and vehicle traffic volumes for each No Build and build alternative in 2015 and 2035. The Vehicular Traffic Impact Analysis Technical Memorandum (CHS, 2013), Appendix 8, shows the volumes of all turning movements at all intersections in all scenarios in this EIS/EIR.
The resulting volumes indicate that on average, there would be 19 percent to 32 percent fewer private vehicles on Van Ness Avenue in 2015 with the implementation of BRT. This equates to roughly 315 to 650 fewer vehicles in each direction, depending on the location than under the No Build Alternative in 2015.9 This also means that in almost all locations along the corridor, the majority (67%-81%) of drivers on Van Ness Avenue in the No Build Alternative would likely continue to drive on Van Ness Avenue with the implementation of BRT because it would still be the quickest/most direct route to their destinations.
9For Design Option B (LPA), due to the elimination of left turns along Van Ness Avenue and subsequent traffic diversions to other streets, the very southern end of the corridor near Market Street would experience a significantly greater reduction in vehicle traffic volumes on Van Ness Avenue, particularly in the NB direction (up to 965 fewer vehicles per hour than in the No Build Alternative – nearly 50%).
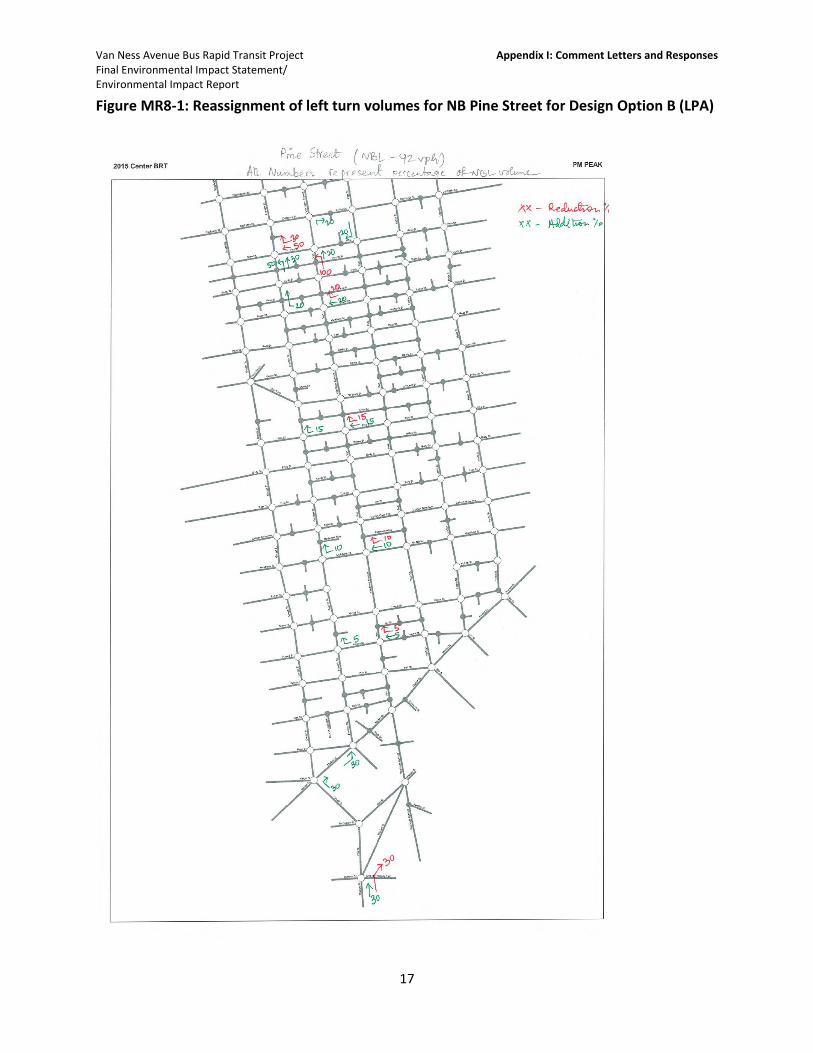
Van Ness Avenue Bus Rapid Transit Project Appendix I: Comment Letters and Responses Final Environmental Impact Statement/ Environmental Impact Report
17
Figure MR8-1: Reassignment of left turn volumes for NB Pine Street for Design Option B (LPA)
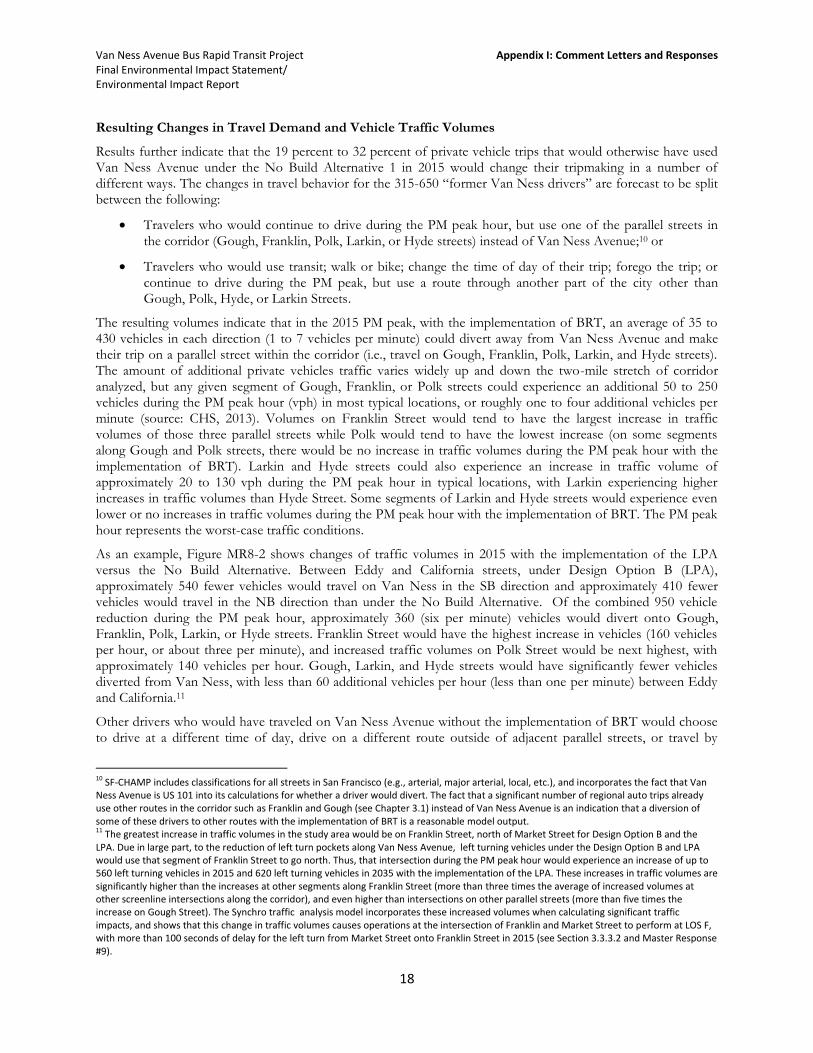
Van Ness Avenue Bus Rapid Transit Project Appendix I: Comment Letters and Responses Final Environmental Impact Statement/ Environmental Impact Report
18
Resulting Changes in Travel Demand and Vehicle Traffic Volumes
Results further indicate that the 19 percent to 32 percent of private vehicle trips that would otherwise have used Van Ness Avenue under the No Build Alternative 1 in 2015 would change their tripmaking in a number of different ways. The changes in travel behavior for the 315-650 “former Van Ness drivers” are forecast to be split between the following:
Travelers who would continue to drive during the PM peak hour, but use one of the parallel streets in
the corridor (Gough, Franklin, Polk, Larkin, or Hyde streets) instead of Van Ness Avenue;10 or
Travelers who would use transit; walk or bike; change the time of day of their trip; forego the trip; or
continue to drive during the PM peak, but use a route through another part of the city other than Gough, Polk, Hyde, or Larkin Streets.
The resulting volumes indicate that in the 2015 PM peak, with the implementation of BRT, an average of 35 to 430 vehicles in each direction (1 to 7 vehicles per minute) could divert away from Van Ness Avenue and make their trip on a parallel street within the corridor (i.e., travel on Gough, Franklin, Polk, Larkin, and Hyde streets). The amount of additional private vehicles traffic varies widely up and down the two-mile stretch of corridor analyzed, but any given segment of Gough, Franklin, or Polk streets could experience an additional 50 to 250 vehicles during the PM peak hour (vph) in most typical locations, or roughly one to four additional vehicles per minute (source: CHS, 2013). Volumes on Franklin Street would tend to have the largest increase in traffic volumes of those three parallel streets while Polk would tend to have the lowest increase (on some segments along Gough and Polk streets, there would be no increase in traffic volumes during the PM peak hour with the implementation of BRT). Larkin and Hyde streets could also experience an increase in traffic volume of approximately 20 to 130 vph during the PM peak hour in typical locations, with Larkin experiencing higher increases in traffic volumes than Hyde Street. Some segments of Larkin and Hyde streets would experience even lower or no increases in traffic volumes during the PM peak hour with the implementation of BRT. The PM peak hour represents the worst-case traffic conditions.
As an example, Figure MR8-2 shows changes of traffic volumes in 2015 with the implementation of the LPA versus the No Build Alternative. Between Eddy and California streets, under Design Option B (LPA), approximately 540 fewer vehicles would travel on Van Ness in the SB direction and approximately 410 fewer vehicles would travel in the NB direction than under the No Build Alternative. Of the combined 950 vehicle reduction during the PM peak hour, approximately 360 (six per minute) vehicles would divert onto Gough, Franklin, Polk, Larkin, or Hyde streets. Franklin Street would have the highest increase in vehicles (160 vehicles per hour, or about three per minute), and increased traffic volumes on Polk Street would be next highest, with approximately 140 vehicles per hour. Gough, Larkin, and Hyde streets would have significantly fewer vehicles diverted from Van Ness, with less than 60 additional vehicles per hour (less than one per minute) between Eddy and California.11
Other drivers who would have traveled on Van Ness Avenue without the implementation of BRT would choose to drive at a different time of day, drive on a different route outside of adjacent parallel streets, or travel by
10 SF-CHAMP includes classifications for all streets in San Francisco (e.g., arterial, major arterial, local, etc.), and incorporates the fact that Van Ness Avenue is US 101 into its calculations for whether a driver would divert. The fact that a significant number of regional auto trips already use other routes in the corridor such as Franklin and Gough (see Chapter 3.1) instead of Van Ness Avenue is an indication that a diversion of some of these drivers to other routes with the implementation of BRT is a reasonable model output. 11 The greatest increase in traffic volumes in the study area would be on Franklin Street, north of Market Street for Design Option B and the LPA. Due in large part, to the reduction of left turn pockets along Van Ness Avenue, left turning vehicles under the Design Option B and LPA would use that segment of Franklin Street to go north. Thus, that intersection during the PM peak hour would experience an increase of up to 560 left turning vehicles in 2015 and 620 left turning vehicles in 2035 with the implementation of the LPA. These increases in traffic volumes are significantly higher than the increases at other segments along Franklin Street (more than three times the average of increased volumes at other screenline intersections along the corridor), and even higher than intersections on other parallel streets (more than five times the increase on Gough Street). The Synchro traffic analysis model incorporates these increased volumes when calculating significant traffic impacts, and shows that this change in traffic volumes causes operations at the intersection of Franklin and Market Street to perform at LOS F, with more than 100 seconds of delay for the left turn from Market Street onto Franklin Street in 2015 (see Section 3.3.3.2 and Master Response #9).
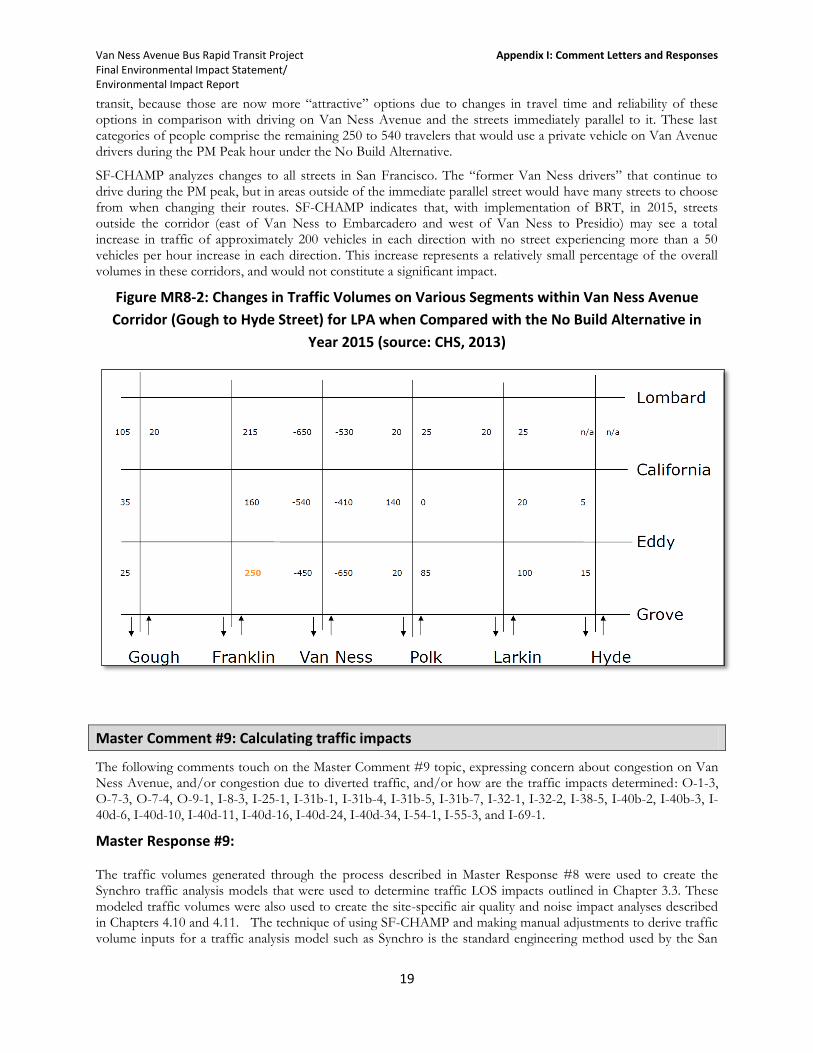
Van Ness Avenue Bus Rapid Transit Project Appendix I: Comment Letters and Responses Final Environmental Impact Statement/ Environmental Impact Report
19
transit, because those are now more “attractive” options due to changes in travel time and reliability of these options in comparison with driving on Van Ness Avenue and the streets immediately parallel to it. These last categories of people comprise the remaining 250 to 540 travelers that would use a private vehicle on Van Avenue drivers during the PM Peak hour under the No Build Alternative.
SF-CHAMP analyzes changes to all streets in San Francisco. The “former Van Ness drivers” that continue to drive during the PM peak, but in areas outside of the immediate parallel street would have many streets to choose from when changing their routes. SF-CHAMP indicates that, with implementation of BRT, in 2015, streets outside the corridor (east of Van Ness to Embarcadero and west of Van Ness to Presidio) may see a total increase in traffic of approximately 200 vehicles in each direction with no street experiencing more than a 50 vehicles per hour increase in each direction. This increase represents a relatively small percentage of the overall volumes in these corridors, and would not constitute a significant impact.
Figure MR8-2: Changes in Traffic Volumes on Various Segments within Van Ness Avenue
Corridor (Gough to Hyde Street) for LPA when Compared with the No Build Alternative in
Year 2015 (source: CHS, 2013)
Master Comment #9: Calculating traffic impacts
The following comments touch on the Master Comment #9 topic, expressing concern about congestion on Van Ness Avenue, and/or congestion due to diverted traffic, and/or how are the traffic impacts determined: O-1-3, O-7-3, O-7-4, O-9-1, I-8-3, I-25-1, I-31b-1, I-31b-4, I-31b-5, I-31b-7, I-32-1, I-32-2, I-38-5, I-40b-2, I-40b-3, I-40d-6, I-40d-10, I-40d-11, I-40d-16, I-40d-24, I-40d-34, I-54-1, I-55-3, and I-69-1.
Master Response #9:
The traffic volumes generated through the process described in Master Response #8 were used to create the Synchro traffic analysis models that were used to determine traffic LOS impacts outlined in Chapter 3.3. These modeled traffic volumes were also used to create the site-specific air quality and noise impact analyses described in Chapters 4.10 and 4.11. The technique of using SF-CHAMP and making manual adjustments to derive traffic volume inputs for a traffic analysis model such as Synchro is the standard engineering method used by the San
Van Ness Avenue Bus Rapid Transit Project Appendix I: Comment Letters and Responses Final Environmental Impact Statement/ Environmental Impact Report
20
Francisco Planning Department for environmental review. The Synchro model developed for this EIS/EIR can account for roadway striping, signal phasing and timing, pedestrian volumes, and conflicts between pedestrian crossing and turning vehicles. Its results include LOS and delay, for each movement and for the intersection as a whole, as well as vehicle queue length.
In the near term (2015), the EIS/EIR (Chapter 3.3) indicates that there would be up to four intersections in the traffic study area that would operate at LOS E or F with the implementation of BRT (the LPA represents the highest number of intersections that would operate at LOS E or F of any of the alternatives), all of which would be on streets parallel to Van Ness Avenue. In 2035, the EIS/EIR indicates that up to 12 intersections in the traffic study area would operate at LOS E or F with the implementation of BRT (the LPA represents the highest number of traffic delay intersections).
Chapter 3.3 states that there would be significant traffic delay (LOS) impacts associated with the build alternatives in both 2015 (two to three intersections, depending on the alternative) and 2035 (five to eight intersections, depending on the alternative). The EIS/EIR identifies three intersections with significant impacts in 2015 (Franklin/Market, Gough/Hayes, and Franklin/O’Farrell). These impacts would apply to the LPA may be determined to be unavoidable, as described below. The EIS/EIR identifies eight intersections with significant impacts in the long term (2035) with the implementation of BRT. These impacts would apply to the LPA and may be determined to be unavoidable, as described below:
Gough/Sacramento
Gough/Eddy
Gough/Hayes
Franklin/O’Farrell
Franklin/Eddy
Franklin/McAllister
Franklin/Market/Page
South Van Ness/Mission/Otis
There are no intersections operating at LOS E or F on Van Ness Avenue in existing conditions (2007). The perceived congestion is due mostly to operational constraints (uncoordinated signals, left turns, etc.) which can create long queuing for certain movements at certain intersections. However, the overall delay at these intersections operates at acceptable levels. Results indicate that there would be no significant traffic impacts at intersections on Van Ness Avenue in 2015 and only one (South Van Ness/Mission/Otis) in 2035. This is, in part, due to the reduction in traffic volumes. However, the remaining traffic on Van Ness Avenue would also benefit from the reduction in left turns as well as the transit signal priority, reducing delays for the north-south traffic traveling on Van Ness Avenue. These improvements, coupled with SFgo traffic signal technology on Gough Street, Franklin Street, and Van Ness Avenue, can help ensure that traffic operations in the corridor are managed such that the impacts do not exceed those identified in this EIS/EIR.
This EIS/EIR identifies mitigation measures such as restriping lane markings for additional turn lanes, changing signal timing, or adding traffic signals. However, Sections 3.3.4.1 (2015 Build Alternative) and 3.3.4.2 (2035 Build Alternative) of the EIS/EIR explain in detail that these potential mitigation measures have various problems that may result in findings of infeasibility, as summarized below::
1. Pedestrian Conflicts. At the intersections of Gough/Hayes, Van Ness/Hayes, Franklin/Pine, Franklin/Eddy, Franklin/McAllister, Gough/Sacramento, Gough/Eddy, and South Van Ness/Mission/Otis, potential mitigation measure scould include the removal of parking during peak periods to create a tow-away lane and/or creating a right-turn pocket, or changing intersection signal timing. These changes would potentially increase pedestrian safety risks by increasing traffic that would otherwise not use these intersections (induced traffic) and eliminating on-street parking, which provides a buffer between moving vehicles and pedestrians.
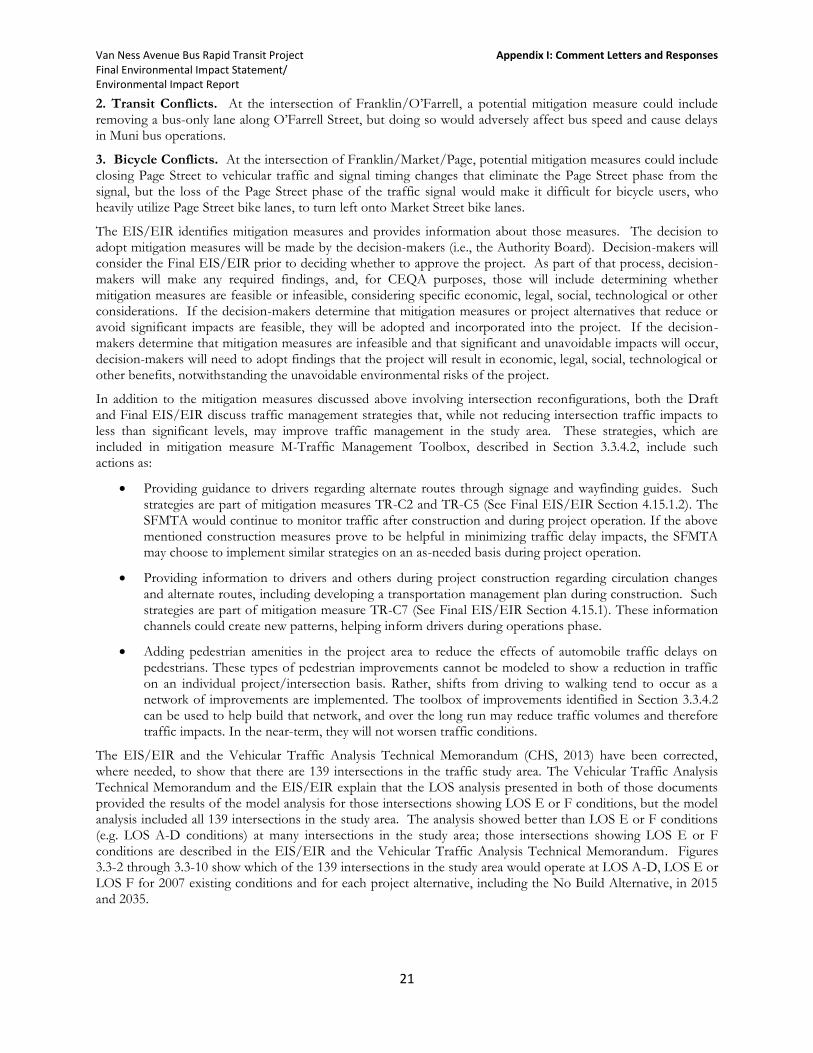
Van Ness Avenue Bus Rapid Transit Project Appendix I: Comment Letters and Responses Final Environmental Impact Statement/ Environmental Impact Report
21
2. Transit Conflicts. At the intersection of Franklin/O’Farrell, a potential mitigation measure could include removing a bus-only lane along O’Farrell Street, but doing so would adversely affect bus speed and cause delays in Muni bus operations.
3. Bicycle Conflicts. At the intersection of Franklin/Market/Page, potential mitigation measures could include closing Page Street to vehicular traffic and signal timing changes that eliminate the Page Street phase from the signal, but the loss of the Page Street phase of the traffic signal would make it difficult for bicycle users, who heavily utilize Page Street bike lanes, to turn left onto Market Street bike lanes.
The EIS/EIR identifies mitigation measures and provides information about those measures. The decision to adopt mitigation measures will be made by the decision-makers (i.e., the Authority Board). Decision-makers will consider the Final EIS/EIR prior to deciding whether to approve the project. As part of that process, decision-makers will make any required findings, and, for CEQA purposes, those will include determining whether mitigation measures are feasible or infeasible, considering specific economic, legal, social, technological or other considerations. If the decision-makers determine that mitigation measures or project alternatives that reduce or avoid significant impacts are feasible, they will be adopted and incorporated into the project. If the decision-makers determine that mitigation measures are infeasible and that significant and unavoidable impacts will occur, decision-makers will need to adopt findings that the project will result in economic, legal, social, technological or other benefits, notwithstanding the unavoidable environmental risks of the project.
In addition to the mitigation measures discussed above involving intersection reconfigurations, both the Draft and Final EIS/EIR discuss traffic management strategies that, while not reducing intersection traffic impacts to less than significant levels, may improve traffic management in the study area. These strategies, which are included in mitigation measure M-Traffic Management Toolbox, described in Section 3.3.4.2, include such actions as:
Providing guidance to drivers regarding alternate routes through signage and wayfinding guides. Such
strategies are part of mitigation measures TR-C2 and TR-C5 (See Final EIS/EIR Section 4.15.1.2). The SFMTA would continue to monitor traffic after construction and during project operation. If the above mentioned construction measures prove to be helpful in minimizing traffic delay impacts, the SFMTA may choose to implement similar strategies on an as-needed basis during project operation.
Providing information to drivers and others during project construction regarding circulation changes
and alternate routes, including developing a transportation management plan during construction. Such strategies are part of mitigation measure TR-C7 (See Final EIS/EIR Section 4.15.1). These information channels could create new patterns, helping inform drivers during operations phase.
Adding pedestrian amenities in the project area to reduce the effects of automobile traffic delays on
pedestrians. These types of pedestrian improvements cannot be modeled to show a reduction in traffic on an individual project/intersection basis. Rather, shifts from driving to walking tend to occur as a network of improvements are implemented. The toolbox of improvements identified in Section 3.3.4.2 can be used to help build that network, and over the long run may reduce traffic volumes and therefore traffic impacts. In the near-term, they will not worsen traffic conditions.
The EIS/EIR and the Vehicular Traffic Analysis Technical Memorandum (CHS, 2013) have been corrected, where needed, to show that there are 139 intersections in the traffic study area. The Vehicular Traffic Analysis Technical Memorandum and the EIS/EIR explain that the LOS analysis presented in both of those documents provided the results of the model analysis for those intersections showing LOS E or F conditions, but the model analysis included all 139 intersections in the study area. The analysis showed better than LOS E or F conditions (e.g. LOS A-D conditions) at many intersections in the study area; those intersections showing LOS E or F conditions are described in the EIS/EIR and the Vehicular Traffic Analysis Technical Memorandum. Figures 3.3-2 through 3.3-10 show which of the 139 intersections in the study area would operate at LOS A-D, LOS E or LOS F for 2007 existing conditions and for each project alternative, including the No Build Alternative, in 2015 and 2035.
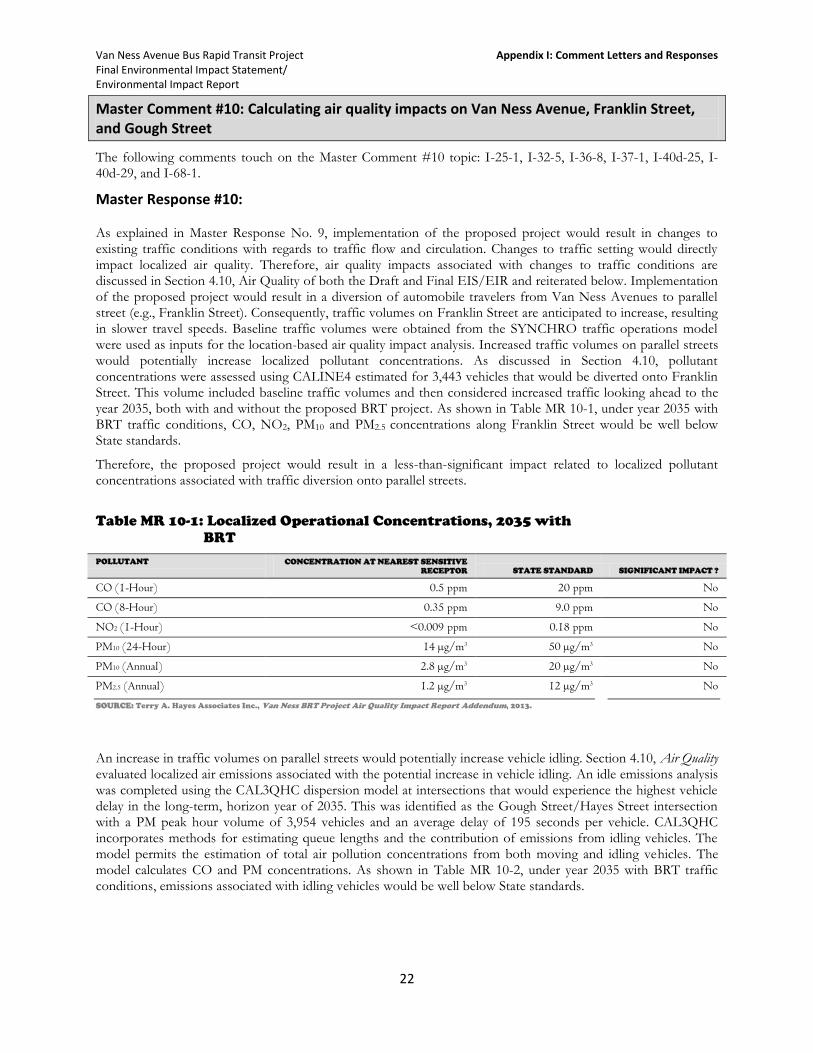
Van Ness Avenue Bus Rapid Transit Project Appendix I: Comment Letters and Responses Final Environmental Impact Statement/ Environmental Impact Report
22
Master Comment #10: Calculating air quality impacts on Van Ness Avenue, Franklin Street, and Gough Street
The following comments touch on the Master Comment #10 topic: I-25-1, I-32-5, I-36-8, I-37-1, I-40d-25, I-40d-29, and I-68-1.
Master Response #10:
As explained in Master Response No. 9, implementation of the proposed project would result in changes to existing traffic conditions with regards to traffic flow and circulation. Changes to traffic setting would directly impact localized air quality. Therefore, air quality impacts associated with changes to traffic conditions are discussed in Section 4.10, Air Quality of both the Draft and Final EIS/EIR and reiterated below. Implementation of the proposed project would result in a diversion of automobile travelers from Van Ness Avenues to parallel street (e.g., Franklin Street). Consequently, traffic volumes on Franklin Street are anticipated to increase, resulting in slower travel speeds. Baseline traffic volumes were obtained from the SYNCHRO traffic operations model were used as inputs for the location-based air quality impact analysis. Increased traffic volumes on parallel streets would potentially increase localized pollutant concentrations. As discussed in Section 4.10, pollutant concentrations were assessed using CALINE4 estimated for 3,443 vehicles that would be diverted onto Franklin Street. This volume included baseline traffic volumes and then considered increased traffic looking ahead to the year 2035, both with and without the proposed BRT project. As shown in Table MR 10-1, under year 2035 with BRT traffic conditions, CO, NO2, PM10 and PM2.5 concentrations along Franklin Street would be well below State standards.
Therefore, the proposed project would result in a less-than-significant impact related to localized pollutant concentrations associated with traffic diversion onto parallel streets.
Table MR 10-1: Localized Operational Concentrations, 2035 with
BRT
POLLUTANT CONCENTRATION AT NEAREST SENSITIVE
RECEPTOR STATE STANDARD SIGNIFICANT IMPACT ?
CO (1-Hour) 0.5 ppm 20 ppm No
CO (8-Hour) 0.35 ppm 9.0 ppm No
NO2 (1-Hour) <0.009 ppm 0.18 ppm No
PM10 (24-Hour) 14 µg/m3 50 µg/m3 No
PM10 (Annual) 2.8 µg/m3 20 µg/m3 No
PM2.5 (Annual) 1.2 µg/m3 12 µg/m3 No
SOURCE: Terry A. Hayes Associates Inc., Van Ness BRT Project Air Quality Impact Report Addendum, 2013.
An increase in traffic volumes on parallel streets would potentially increase vehicle idling. Section 4.10, Air Quality evaluated localized air emissions associated with the potential increase in vehicle idling. An idle emissions analysis was completed using the CAL3QHC dispersion model at intersections that would experience the highest vehicle delay in the long-term, horizon year of 2035. This was identified as the Gough Street/Hayes Street intersection with a PM peak hour volume of 3,954 vehicles and an average delay of 195 seconds per vehicle. CAL3QHC incorporates methods for estimating queue lengths and the contribution of emissions from idling vehicles. The model permits the estimation of total air pollution concentrations from both moving and idling vehicles. The model calculates CO and PM concentrations. As shown in Table MR 10-2, under year 2035 with BRT traffic conditions, emissions associated with idling vehicles would be well below State standards.
Van Ness Avenue Bus Rapid Transit Project Appendix I: Comment Letters and Responses Final Environmental Impact Statement/ Environmental Impact Report
23
Table MR10-2: Idle Emissions, 2035 with BRT
POLLUTANT SIDEWALK CONCENTRATIONS STATE STANDARD SIGNIFICANT IMPACT ?
CO (1-Hour) 0.1 ppm 20 ppm No
CO (8-Hour) 0.07 ppm 9.0 ppm No
PM10 (24-Hour) 4 µg/m3 50 µg/m3 No
PM10 (Annual) 0.8 µg/m3 20 µg/m3 No
PM2.5 (Annual) 0.3 µg/m3 12 µg/m3 No
SOURCE: Terry A. Hayes Associates Inc., Van Ness BRT Project Air Quality Impact Report Addendum, 2013.
Moreover, localized CO concentrations, known as hotspots, were assessed due to associated heavy traffic congestion, which most frequently occurs at signalized intersections of high-volume roadways. The Bay Area Air Quality Management District (BAAQMD) has developed the following screening criteria for determining whether a project should be further analyzed for localized CO impacts:
The project traffic would not increase traffic volumes at affected intersections to more than 44,000
vehicles per hour; and
The project traffic would not increase traffic volumes at affected intersections to more than 24,000
vehicles per hour where vertical and/or horizontal mixing is substantially limited (e.g., tunnel, parking garage, bridge underpass, natural or urban street canyon, below-grade roadway).
The proposed project would not increase traffic volumes at any intersections in the traffic study area (including Van Ness Avenue and five parallel streets: Gough, Franklin, Polk, Larkin, and Hayden) to more than 24,000 vehicles per hour.. For example, the maximum PM peak hour volumes on Franklin Street with the proposed project would be approximately 3,023 and 3,443 vehicles in 2015 and2035, respectively. As a result, the proposed project would be consistent with the criteria above and further analysis of CO concentrations is not required. Therefore, the proposed project would result in a less-than-significant impact related to localized CO concentrations.
Master Comment #11: Calculating noise and vibration impacts on Van Ness Avenue, Franklin Street, and Gough Street
The following comments touch on the Master Comment #11 topic: A-5a-4, A-5a-8, , A-5a-9, I-25-1, I-32-4, I-40d-26, I-40d-29, and I-68-1.
Master Response #11:
Traffic impacts related to traffic diversion are discussed in Chapter 3.3, while noise and vibration impacts related to traffic diversion are discussed in Chapter 4.11 of the both the Draft and Final EIS/EIR.
The criteria in the federal Transit Noise and Vibration Impact Assessment guidelines (FTA, 2006) were used to assess existing ambient noise levels and future noise impacts from BRT operations. They are founded on well-documented research on community reaction to noise and are based on change in noise exposure using a sliding scale. The amount that transit projects are allowed to change the overall noise environment is reduced with increasing levels of existing noise. The noise impact criteria for human annoyance are based on a comparison of the existing outdoor noise levels and the future outdoor noise levels from a proposed transit project. They incorporate activity interference caused by the transit project alone and annoyance due to the change in the noise environment caused by the project. There are two levels of impact included in the FTA criteria, as shown in Figure 4.11-3. The interpretations of these two levels of impact are summarized as follows:
Van Ness Avenue Bus Rapid Transit Project Appendix I: Comment Letters and Responses Final Environmental Impact Statement/ Environmental Impact Report
24
Severe Impact. Project noise above the upper curve is considered to cause Severe Impact because a significant percentage of people would be highly annoyed by the new noise.
Moderate Impact. The change in the cumulative noise level is noticeable to most people, but it may not be sufficient to cause strong, adverse reactions from the community. In this transitional area, other project-specific factors must be considered to determine the magnitude of the impact and the need for mitigation, such as the existing level, predicted level of increase over existing noise levels, and the types and numbers of noise-sensitive land uses affected.
The evaluation of vibration impacts can be divided into two categories: (1) human annoyance, and (2) building damage. Generally, human annoyance criteria are used to assess potential impacts associated with operational vibration, whereas building damage criteria are used to estimate vibration impacts due to construction activities.
Noise monitoring was conducted at various sites along Van Ness Avenue to assess the existing noise conditions throughout noise-sensitive regions in the project area. The monitoring sites include noise-sensitive locations, such as residences, a concert hall, and a hotel. The primary objectives of the measurements are to evaluate the existing noise environment and determine the appropriate impact criteria per FTA guidelines. BRT noise levels were calculated using the operation schedule, speed, and distance of the proposed project limits. The calculated noise levels were then compared to the “Moderate Impact” and “Severe Impact” criteria, established according to the ambient noise conditions. Calculation results demonstrate no anticipated noise impacts along Van Ness Avenue from the proposed BRT service.
Section 4.11.5.2 describes the noise and vibration effects of the project on parallel streets that would receive the most diverted traffic under project conditions. This analysis takes into account the diversions of private vehicles to parallel streets within the Van Ness Avenue corridor, using the Synchro numbers from Appendix 10 of the Vehicular Traffic Analysis Technical Memorandum (CHS, 2013) as inputs for location based noise and vibration impact analysis. (See Section 4.11.5.2.) The traffic related noise increases were calculated using the ratios of the existing and projected traffic volumes for the no-build alternative and the build alternatives, including the LPA, with or without the Vallejo NB station variant.
The analysis in Chapter 4.11 indicates that there would be a less than significant noise and vibration impact due to traffic diverted onto parallel streets during project operation. Noise-sensitive land uses (receivers) were analyzed along and between Franklin and Gough streets, including primarily residential buildings as well as schools, churches, hotels, and two small museums (see Section 4.11.4). Franklin and Gough streets are expected to attract more of the traffic that will divert from Van Ness Avenue with the BRT than any other routes; worst-case traffic noise levels were calculated on these streets using traffic volumes representing LOS C conditions, the loudest hour conditions (see Section 4.11.5.2). Along segments of these two roadways paralleling Van Ness Avenue, future traffic noise levels under the build alternatives are predicted to be zero to 1.5 dB higher than future no-project noise levels and, relative to existing traffic noise levels, future project traffic noise levels would increase by zero to 2.2 dB; typically, a noise level change of 3 dB or less is not noticeable (see Section 4.11.5.2). The project noise study also concluded that the potential for vibration impact from rubber-tire-fitted vehicles, such as those used in BRT projects, can be reasonably dismissed (see Section 4.11.5.3).
Master Comment #12: Incorporating CPMC into analyses, including emergency services operations and construction coordination.
The following comments touch on the Master Comment #12 topic: I-36-5, I-56-2, I-56-6, I-56-7, and O-1-4.
Master Response #12:
Traffic Analysis Incorporation of the CPMC Project
The Draft EIS/EIR traffic analysis accounted for the California Pacific Medical Center (CPMC) expansion project in the 2035 horizon year and the document identifies cumulative environmental impacts of Van Ness BRT in combination with CPMC and other planned projects consistent with regional residential and employment growth projections (see Section 5.5.1.5 of the Final EIS/EIR for a description of the updated analysis). CPMC
Van Ness Avenue Bus Rapid Transit Project Appendix I: Comment Letters and Responses Final Environmental Impact Statement/ Environmental Impact Report
25
expansion is considered a reasonably foreseeable project for purposes of the cumulative impacts analysis, with expected completion in 2016. As explained in Section 5.5 of the EIS/EIR, the travel demand forecasting model used to project traffic volumes for the 2015 opening year and 2035 horizon year included trips generated by foreseeable projects. Also, to ensure consistency between the CPMC and Van Ness BRT environmental analyses, traffic volumes for intersections in the vicinity of CPMC were modified to reflect the projected vehicle trip generation in the CPMC EIR for the 2035 alternatives.
The 2035 trip volumes accounting for CPMC were used to simulate the traffic speeds and delays presented in Section 3.3 of the EIS/EIR (since CPMC construction is not scheduled for completion until after 2016, it was not reflected in the 2015 models). That section compares the modeled 2035 build alternatives traffic speeds and delays with the baseline year (2007) as well as the 2035 No Build Alternative. Using the significance criteria specified in Section 3.3.3, it identifies cumulate traffic impacts of Van Ness BRT in combination with CPMC and other planned projects.
For more information, Section 2.7 of the EIS/EIR describes the CPMC project and other planned land use and transportation projects that could be implemented during the same timeframe but independent of Van Ness BRT in or near the project corridor. Section 3.3 and the Vehicular Traffic Impact Analysis Technical Memorandum describes the traffic analysis methodology and lists all project-specific and cumulative traffic impacts. Section 5.3 provides a full list of reasonably foreseeable projects and their expected completion dates, while Section 5.5 further explains the cumulative traffic impact analysis and summarizes cumulative impacts.
As discussed in Section 5.5.1.5, construction of multiple projects, such as CPMC and the Van Ness Avenue BRT, within close vicinity would escalate the traffic impacts during the construction period. The impacts would be adverse, but they could be lessened by closely coordinating the projects to implement a Transportation Management Plan (TMP) and to keep the public informed about the construction schedule and activities throughout the construction period. A TMP that includes traffic rerouting, a detour plan, and public information procedures will be developed during the design phase with participation from local agencies including Caltrans, other major project sponsors in the area (e.g., the CPMC and Geary Boulevard BRT projects), local communities, and affected travelers. Early and well-publicized announcements and outreach will help to minimize confusion and traffic congestion at the start of construction.
Ambulance Access to CPMC
Van Ness Avenue BRT will facilitate ambulance access to CPMC. Emergency vehicles may use transit-only lanes throughout San Francisco, and would be allowed full use of the BRT lanes on Van Ness Avenue to bypass traffic in the mixed-flow lanes. The BRT lanes in the LPA are physically separated from the mixed-flow lanes only at stations, allowing emergency vehicles to enter or exit the lanes as necessary throughout the corridor, including at every intersection, as discussed in Chapter 2 of the EIS/EIR. Thus, emergency vehicles would have access to the same number of lanes under the build alternatives as the No Build Alternative. Chapter 2 of the both the Draft and Final EIS/EIR also explains that emergency vehicles would be able to trigger Transit Signal Priority similar to the BRT vehicles.
Ambulances would not access CPMC directly from Van Ness Avenue. CPMC plans to locate the ambulance entrance on Post Street just east of Franklin Street (San Francisco, 2012).
Master Comment #13: Pedestrian crossings and safety.
The following comments touch on the Master Comment #13 topic: A-5b-1, A-5b-4, A-5b-5, A-5b-6, A-7a-6, A-7h-8, O-3-1, 0-7-3, O-7-9, I-10-1,I-10-2, I-28-3, I-57-4, and I-63-1.
Master Response #13:
As explained in Section 3.4 Non-motorized Transportation of both the Draft and Final EIS/EIR, Van Ness Avenue has relatively long crossing distances, and not all intersections currently provide median refuges for pedestrians unable to cross the entirety of Van Ness Avenue during one light cycle. To address this existing condition of pedestrian crossing distance and time, a crossing speed analysis was completed for the project to
Van Ness Avenue Bus Rapid Transit Project Appendix I: Comment Letters and Responses Final Environmental Impact Statement/ Environmental Impact Report
26
estimate how quickly pedestrians would have to cross an intersection given the allotted signal time, which is discussed in Section 3.4.3.1, Pedestrian Signals and Timing. The study found that each of the build alternatives, including Design Option B and the LPA, would improve the conditions and meet required crossing speeds for pedestrians set by the City and the Federal Highway Administration at nearly all intersections.
A center lane configuration, including the configuration identified in the LPA, would require transit patrons to cross only as far as the median to reach the station platform. The proposed project would improve crossing conditions significantly in the following ways:
1) Shortening crossing distances with provision of curb bulbs at most signalized intersections.
2) Providing consistent, ADA compliant (i.e., 6 feet wide or greater) pedestrian refuges across Van Ness Avenue with protective nose cones on east-west crossings of each intersection.
3) Installing accessible pedestrian signals (APS), which communicate when to cross the street in a nonvisual manner, on all crosswalk legs at all signalized intersections.
These improvements are in addition to the planned installation of countdown pedestrian signals at all
intersections under the No Build Alternative, and would be implemented as part of BRT construction. In addition, the project will provide a landscaped buffer along the sidewalk for the blocks where there would be
no parking and no striped buffer between vehicle traffic and the sidewalk (for the LPA, this would include the block between O’Farrell and Geary streets as well as the two blocks between Broadway and Green streets). The LPA will also include guardrails along the sidewalk side of the platform except at station entrances next to crosswalks, as described for Alternative 3 in both the Draft and Final EIS/EIR. This design will reduce the amount of transit riders crossing outside of crosswalks to reach the station.
The aforementioned pedestrian design features would improve crossing conditions and reduce the chance, when compared to existing conditions, for pedestrians to be caught in the crosswalk before the light changes. Also, countdown signals display the remaining seconds to cross the street and thereby provide additional information to crossing pedestrians. Lastly, pedestrian safety would be improved with the addition of a landscaped buffer for the blocks where there would be no parking.
3. Response to Comments
Approximately 86 comment letters, emails, transcribed verbal comments, and comment cards in total were submitted during the Draft EIS/EIR public review period. Within each of these, the project team identified and numbered specific comments that pertain to the information presented in the Draft EIS/EIR. Underlined text and an adjacent number indicate these individual comments within each letter, email, transcribed verbal comments or comment card. Then on the page following each numbered letter, email, transcribed verbal comment and comment card, responses to comments are provided.
In the pages that follow, the written and transcribed comments are provided and are organized according the following groups: Agencies, Organizations, and Individuals. At the beginning of each section a table is provided that lists the commenters, and the page numbers on which the commenter’s comments and response to the comments may be found.