valuing the health benefits of improving indoor air quality in residences
TRANSCRIPT

S C I E N C E O F T H E T O T A L E N V I R O N M E N T 3 9 4 ( 2 0 0 8 ) 2 5 – 3 8
ava i l ab l e a t www.sc i enced i rec t . com
www.e l sev i e r. com/ loca te / sc i to tenv
Valuing the health benefits of improving indoor air qualityin residences
C.K. Chau⁎, W.K. Hui, M.S. TseDepartment of Building Services Engineering, The Hong Kong Polytechnic University, Hung Hom, Kowloon, Hong Kong, China
A R T I C L E I N F O
⁎ Corresponding author. Tel.: +852 2766 7780;E-mail address: [email protected] (C
0048-9697/$ – see front matter © 2008 Elsevidoi:10.1016/j.scitotenv.2008.01.033
A B S T R A C T
Article history:Received 15 August 2007Received in revised form14 January 2008Accepted 16 January 2008
Unlike commercial premises, the indoor air quality of residences ismore dynamic, uncontrolled,and prone to human behavioral changes. In consequence, measuring the health benefit gainsderived from improving indoor air quality in residences ismore complicated. To overcome this, ahuman thermal comfortmodel was first integrated with indoormicroenvironmentmodels, andsubsequently linkedwith appropriate concentration–response and economic data for estimatingthe economic benefit gains derived from improving indoor air quality in residences for an adultandanelderly person. In this study, thedevelopment of themodel is illustrated byusing a typicalresidential apartment locating at the worst air quality neighborhood in Hong Kong and the dailyweather profiles between 2002 and 2006. Three types of personal intervention measures wereexamined in the study: (i) using air cleaner in residence, (ii) changing timespent in residence, and(iii) relocating to a better air quality neighborhood. Our results revealed that employing aircleaners with windows closed in residence throughout the entire year was the most beneficialmeasure as it couldprovide the greatest annual health benefit gains. Itwould give amaximumofHK$2072 in 5-year cumulative benefit gain for an adult and HK$1700 for an elderly person.Employing air cleaners with windows closed in only cool season (October through March) couldgive the highestmarginal return per dollar spent. The benefit gainswould become smaller whenwindows were opened to a greater extent. By contrast, relocating to a better air qualityneighborhood and changing the time spent in residence did not appeal to be beneficialintervention measures.
© 2008 Elsevier B.V. All rights reserved.
Keywords:Cost–benefit analysisIntervention measuresIndoor air qualityResidential buildings
1. Introduction
Being aware of the ill-health effects, many governments havelaunched a variety of new policy initiatives and innovativeabatementmeasures to combat adverse outdoor air quality. Inthe meantime, they are interested in unveiling the economicconsequences of ambient air pollution and abatement mea-sures, and ensuring that the implemented measures andpolicies are value for money. Many studies have been focusedon estimating how much health benefit gains can be derivedby society as a result of improvement in outdoor air quality.Pearce (1996a) estimated the annual health damage caused by
fax: +852 2774 6146..K. Chau).
er B.V. All rights reserved
ambient particulate matters (PM10) in the UK could be up to₤17.4 billion. Ostro and Chestnut (1998) estimated the damagecaused by fine ambient particulate matters (PM2.5) in the UScould be up to US$32 billion.
Economic valuation studies on ambient air pollution havealso been initiated in the other developing nations. Zaim (1997)estimated the annual health benefit gains for Turkey wereabout 0.12% and 0.08% of its gross national product in 1990 and1993 if the annual averaged ambient PM10 and sulfur dioxidelevels were reduced to 70 μg/m3 and 50 μg/m3 respectively.Wong et al. (2002a) estimated the annual direct medical costson health problems attributed to major ambient air pollutants
.

Table 1 – List of major characteristics for the baselineresidential apartment
Parameter Values
Floor to ceiling height 2.7 mTotal floor area 40 m2–69.9 m2
Window-to-wall ratio 0.65
26 S C I E N C E O F T H E T O T A L E N V I R O N M E N T 3 9 4 ( 2 0 0 8 ) 2 5 – 3 8
inHongKongwould be amountedup toHK$1.3 billion. KanandChen (2004) estimated the economic impact caused by PM10
accounted for 1.0% of the gross domestic product (GDP) ofShanghai in China. Likewise, Quah and Boon (2003) estimatedthe impact to be about 4.3% of GDP in Singapore. Almost allthese studies pointed to the same conclusion that the healthbenefit gains for society derived from a reduction in ambientair pollutant level are quite substantial. However, all thesestudies suffer fromacommondrawback that they are only ableto link the changes in ambient pollutant levels with thenumber of health incidences without addressing the cleardistinction between ambient and personal exposures (Pearce,1996b; Saksena and Dayal, 1997).
Indeed, it would be extremely valuable to link the healthbenefit gains with the reduction in the indoor pollutant levelsas people in the developed nations spend most of their timesindoors (US EPA, 1996; Chau et al., 2002; Nazaroff andWeschler, 2001). Several studies attempted to estimate thehealth impacts of improved indoor air quality. Zuraimi (2007)employed a time-weighted microenvironment model forevaluating the health benefit gains derived from changes inventilation rates and filter efficiencies of central air-condi-tioning systems in office buildings. On the other hand, Chauet al. (2007) employed their exposure-weighted models forevaluating the health benefit gains due to changes in timespent of occupants and introduction of indoor air qualityimprovement measures in office buildings. However, thesestudies only addressed the benefit gains derived fromintroducing intervention measures under controlled air-con-ditioned environments. Of equal or even more important is toevaluate the health benefit gains that can be derived fromchanges in behavior and application of intervention measuresin residences where people spend most of their times.
The evaluation of health benefit gains derived fromimproved indoor air quality in residences is more complicatedthan in controlled indoor office environments as a majority ofend uses are dictated by the lifestyle and preferences of theoccupants rather than factors that can be influenced throughdesign. As residential building designs and usage patterns aremuch more variable, the financial benefits cannot be quanti-fied easily without a reasonable prediction of the lifestyle andpreferences of the occupants.
In view of these shortcomings, the major objective of thisstudy is to estimate the health benefit gains for an adult (15–64 years of age) and elderly person (N64 years of age) afterapplication of different intervention measures in their dwell-ings. This objective was examined by focusing on an averageadult or an elderly person residing in a residential apartmentwith a common configuration in Hong Kong. It is anticipatedthat the developed protocol can help evaluate the healthbenefits that can be derived from the application of interven-tion measures in residences to mitigate the adverse outdoorair quality.
Number of adults (15–64 years of age) livingin the apartment
2.21a
Number of elderly persons (N64 yearsof age) living in the apartment
0.35a
Type of air-conditioning system/air coolers Window orsplit-type units
a Extracted from HK Census (2006a).
2. Methodology
Of particular interest of this study was to evaluate the healthbenefit gains for an adult and an elderly person afterimplementing intervention measures to combat the adverse
ambient air quality in residence neighborhood. Our focus wasconfined to the residence locating at the worst air qualityneighborhood in Hong Kong between 2002 and 2006. The airquality of the neighborhood, in turn, was defined throughoutthe study with reference to the concentration of particulatesthat are less than 10 μm in aerodynamic diameter (PM10).
The protocol developed by Chau et al. (2007) was adoptedfor evaluating the relevant health benefit gains. Basically, theprotocol employed the damage function approach to estimatethe change in health outcomes and the correspondingmonetary gains associated with a change in indoor air quality.Its details are summarized again in the following:
i) construct a baseline apartment and a baseline resi-dent's behavior;
ii) evaluate the reduction in personal PM10 exposures forresidence after application of different interventionmeasures;
iii) evaluate the corresponding reduction in health out-comes; and
iv) evaluate the corresponding financial benefit gains.
Three types of personal interventionmeasures were exam-ined in the study: (i) using air cleaner in residence, (ii) changingtime spent in residence, and (iii) relocating to a better airquality neighborhood.
2.1. Baseline apartment configuration
A baseline apartment was constructed by reference to acommon configuration in a residential building in HongKong. Given about one third of its population lives in publicrental housing estates (HKHA, 2006), the baseline residentialapartment was defined by reference to a typical residentialapartment in a high-rise public housing estate. Table 1summarizes its major characteristics.
In this study, no indoor sourceswere assumed as ourmajorobjective was to evaluate the health benefit gains that can bederived from the application of various interventionmeasuresin residences to mitigate the outdoor PM10 concentrations.
2.2. Baseline resident's window-opening behavior
In couple with the baseline apartment, a baseline resident'swindow-opening behavior was also constructed. This is

27S C I E N C E O F T H E T O T A L E N V I R O N M E N T 3 9 4 ( 2 0 0 8 ) 2 5 – 3 8
necessary as window-opening behavior affects air exchangerate and PM10 infiltration rate, and thus the interactionbetween indoor and outdoor environments. Similar to otherliterature, the resident's window-opening behavior wasassumed to be governed by quest for thermal comfort, whichis affected by temperature, humidity, wind, rain, as well asthermal experiences, changes in clothing, availability ofcontrol and different occupant expectation (Hensen, 1991;Yoshida and Kono, 2002; Eftekhari and Marjanovic, 2003;Breesh et al., 2005; Mankibi et al., 2006; Zhang et al., 2006).
The widely used predicted mean vote (PMV) as defined byASHRAE Standard 55 (2004) was employed for predicting thethermal responses of occupants more accurately. PMV, whichwas derived from heat transfer physics in conjunction with anempirical fit to sensation, represents the thermal sensation ofa large population of people when exposed to a certainenvironment. PMV, which depends on a number of para-meters like clothing value and metabolic rate, defines thefollowing ordinal category rating scale by coupling with themean vote of thermal comfort by a population of people:
+3 hot+2 warm+1 slightly warm0 neutral−1 slightly cool−2 cool−3 cold
In this study, we assumed that the residents would weartrousers and short-sleeve shirts in summer (with a clothingvalue of 0.51), and would wear trousers, long-sleeve sweatersand T-shirts in winter (with a clothing value of 1.0). They had asedentary lifestyle at home (with a metabolic rate of 1.02).Besides, the indoor air velocities at home were assumed to besmaller than 0.2 m/s, and the radiant temperature wasassumed to be the same as the indoor air temperature. Withthese assumptions, PMV can be determined based on outdoortemperature and relative humidity. Besides, a resident wasassumed to act daily in accordance with the followingmanner:
i) If daily rainfall exceeded 10 mm, windows would beclosed for avoiding any rainwater seepage.
ii) If PMV was smaller than −2, windows would be closed.iii) If PMV was greater than +0.5, room air coolers would be
turned on with windows closed for the purpose ofsaving energy.
iv) If PMV was within the range of −2 and +0.5, windowswould be halfway opened3.
However, windows cannot be closed completely for a longtime without taking in enough fresh air for human breathing.
1 1 clothing unit=1 clo=0.155 m2 °C/W.2 1 metrabolic unit=1 met=58.2 W/m2.3 As the extent to which windows are opened by a resident is
difficult to predict, it was assumed that an average ventilationrate were obtained by halfway opened windows.
Hence, in the following context, whenever windows wereassumed to be closed, we implied that they were opened to aminimum extent that is just suffice to meet the minimumquantity of fresh air as recommended for ventilation purpose,i.e. be able to comply with 7.5 l/s per person as recommendedby ASHARE Standard 62 (2001).
2.3. Estimating the reduction in PM10 levels afterapplication of intervention measures
Assuming the air inside the apartment was well-mixed, asteady-state one compartment mass-balance model wasconstructed to link the indoor with the outdoor PM10
concentrations. The model is shown as follows:
Ci ¼Phah
ah þ ar þ kh
� �Ca ð1Þ
where
Ci indoor PM10 concentration (μg/m3);Ca outdoor PM10 concentration (μg/m3);Ph penetration factor for homeαh air exchange rate for home (h−1)αr PM10 removal rate after application of intervention
measures, such as provision of room air coolers or aircleaners (h−1)
kh PM10 deposition rate (h−1)
Table 2 shows the ranges of values for the model inputparameters. They were determined from the relevant localresearch studies so as to better reflect the actual localcircumstances. Besides, the daily average outdoor PM10 con-centrations between 2002 and 2006 were extracted from theHong Kong Observatory Records (HKO, 2006).
Both the upper and lower bound values for daily indoorPM10 concentrations were determined for revealing the rangesof resulting indoor PM10 concentrations as a result of applica-tion of various intervention measures. They were determinedby varying the maximum and minimum values of relevantinput parameters.
2.4. Estimating the changes in health outcomes
The change in health outcomes (dHi) due to a change in indoorPM10 concentrations was determined by using the concept ofequivalent ambient concentrations:
dHi ¼ biPOPiDCa;eqv ð2Þ
Where bi is the concentration–response coefficient (ormore correctly the slope of the concentration–responsecurve); POPi is the population who is suffering from the healthoutcome i; ΔCa,eqv is the equivalent change in ambient PM10
concentration for which its health impacts are equivalent tothose caused by a change in indoor PM10 concentrations; and iis the specific category of health outcome.
2.4.1. Concentration–response coefficients, biConcentration–response coefficients for hospital admissions,restricted activity days andmortality in relation to cardiovascular

Table 2 – Values of input parameters used for the baseline apartment
Variable Description Unit Range Sources
Ph Penetration factor Dimensionless 0.36 (with windows closed) Chao and Tung (2001)0.68a (with windows halfway opened1 (with maximum window openings)
kh PM10 deposition rate h−1 0.36 Chao and Tung (2001),Koutraks et al. (1992)
αh Air exchange rate h−1 1.6 (with windows closed) ASHARE Standard 62 (2001),Chao and Tung (2001)6.4a (with windows halfway opened
11.2 (with maximum window openings)αr PM10 removal rate as a result of
application of room air coolersh−1 3.40 to 7.98 Carrier catalogue (2005)
0 if not usePM10 removal rate as a result ofapplication of air cleaners
h−1 4.65 to 6.45 Choice magazine (2005)0 if not use
a Arithmetic mean of maximum and minimum values.
28 S C I E N C E O F T H E T O T A L E N V I R O N M E N T 3 9 4 ( 2 0 0 8 ) 2 5 – 3 8
and respiratory diseases are needed before estimating thecorresponding avoidable number of incidences. Despite some ofthe coefficients for adult and elderly could be extracted fromrelevant local studies, a majority of them were transferred fromoverseas studies. The validity in transferring the use of concen-tration–response functions for estimating health effects attrib-uted to a change in total PM10 levels is, however, reliant upon thefollowing assumptions:
▪ There is no threshold below which PM10 is harmless or nota cause of mortality.
▪ There is a casual relationship between the particulateconcentrations and the health outcomes.
▪ There is no difference in susceptibility or exposuredifference between different populations.
▪ Reviewed studies are of similar quality and thus are notneeded to weigh for differences in methodology or samplesize.
▪ Concentration–response functions are linear down to eachof the target PM10 levels considered.
▪ Concentration–response functions are similar betweenoutdoor and indoor environment despite the fact that thechemical and physical composition of indoor and outdoorparticles may vary.
▪ Uncertainties might come from difference in samplingmethods, diagnoses of health incidences; methods ofstatistical modeling; chemical and physical compositionof particles; difference in cultural context, pollutionexposure pattern and health characteristics. However, inthe absence of local epidemiological data, data weretransferred from other developed countries.
▪ Time activity characteristics for population do not differsubstantially between countries.
Noticeably, the values of estimates vary significantly for alldifferent types of health outcomes. Meta-analysis was usedfor statistically pooling of the results obtained from a numberof studies conducted in different countries (Calthrop andMaddison, 1996). Table 3 shows the resulting values of pooledconcentration–response coefficients derived from the type ofmeta-analyses that estimated the coefficients by means ofgeneral variance-based method (Petitti, 1994).
2.4.2. The equivalent change in ambient PM10 concentration,ΔCa,eqvThe equivalent ambient level was determined by:
DCP
a;eqv ¼ DEP
measure
DPEa
DCP
a ð3Þ
where,
ΔCa change in ambient PM10 concentration,ΔE−a change in integrated PM10 exposure induced by a
change in the ambient PM10 concentrations,ΔE−measure change in integrated PM10 exposure after applica-
tion of an intervention measure.
In turn, ΔE−a was determined by:
DEP
a ¼ Phahah þ kh;r
� �DC
P
a tP
h þPoao
ao þ ko;r
� �DC
P
a tP
o þDCP
a tP
a ð4Þ
where
Ph penetration factor for home,Po penetration factor for other major microenviron-
ments, e.g. office or shopping mallαh air exchange rate for home (h−1),αo air exchange rate for other major microenviron-
ments, e.g. office or shopping mall (h−1),kh,r M10 deposition/removal rate for home (h−1),ko,r M10 deposition/removal rate for other major micro-
environments, e.g. office or shopping mall (h−1).
And t̄h, t̄a, t̄o denote the average time spent at home,ambient environment, and other major microenvironments(e.g. office in case for an adult, and shopping mall in case foran elderly person), respectively.
On the other hand, ΔE−measure in Eq. (3) was determined bysummation of products of change in the average time spent byan adult or elderly person in a particular microenvironmentand the change in average concentrations of the samemicroenvironments after implementing an intervention mea-sure i, i.e. ∑ΔCiΔti. The daily exposure levels for an adult

Table 3 – Concentration–response coefficients of different health outcomes for a 10μg/m3 increase in ambient PM10concentrations
Source Country/cityconcerned
Disease codes(ICD-9)
Concentration–responsecoefficients (b) in %obtained by previousstudies (percentageincrease in no. of
incidence/10 μg m−3)
Concentration–responsecoefficients (b) in %
obtained by meta-analyses(Percentage increase in no.of incidence/10 μg m−3)
Hospital admissionsRespiratory diseases (adult)Anderson et al. (2001) UK 460–519 0.6 (−0.29–1.48)Oftedal et al. (2003) Norway 460–519 1.9 (−0.91–4.80)Fusco et al. (2001) Italy 460–519 0.087 (−0.43–0.61) 0.26 (S.E.=0.002)
Respiratory diseases (elderly person)Wong et al. (1999) Hong Kong 460–519 1.8 (1–2.6)Wong et al. (2002a) Hong Kong 460–519 1.04 (0.78–1.3)Prescott et al. (1998) UK 460–519 2.2 (−3.8–8.8) 1.8 (S.E.=0.004)
Cardiovascular diseases (adult)Ballester et al. (2002) Spain (14 cities) 390–459 0.91 (0.35–1.47)Zanobetti et al. (2000) US (10 cities) 390–429 1.09 (S.E.=0.08)Le Tertre et al. (2002) Europe (8 cities) 390–429 0.5 (0.3–0.7) 0.56 (S.E.=0.001)
Cardiovascular diseases (elderly person)Wong et al. (1999) Hong Kong 390–459 0.8 (0.2–1.3)Wong et al. (2002a) Hong Kong 390–429 0.57 (0.33–0.8)Prescott et al. (1998) UK 390–429 4.8 (0.9–8.9) 0.62 (S.E.=0.001)
MortalityRespiratory diseases (adult)Wong et al. (2002b) Hong Kong 461–519 0.8 (0.1–0.14)Bremner et al. (1999) UK 460–519 1.3 (0.29–2.38)Tsai and Huang (2003) Taiwan 460–519 0.34 (−0.03–3.94) 0.65 (S.E.=0.002)
Respiratory diseases (elderly person)Wong et al. (2002a) Hong Kong 460–519 0.4 (−0.11–0.91)Bremner et al. (1999) UK 460–519 1.4 (0.08–2.9)Gouveia and Fletcher (2000) Brazil 460–519 0.9 (0.08–1.8) 0.62 (S.E.=0.001)
Cardiovascular diseases (adult)Wong et al. (2002b) Hong Kong 390–459 0.3 (−0.2–0.8)Bremner et al. (1999) UK 390–459 0.55 (−0.07–1.21)Ballester et al. (2002) Spain 390–459 1.2 (0.5–1.8) 0.60 (S.E.=0.002)
Cardiovascular diseases (elderly person)Wong et al. (2002a) Hong Kong 390–459 0.45 (0.01–0.9)Bremner et al. (1999) UK 390–459 0.2 (−0.14–0.5)Gouveia and Fletcher (2000) Brazil 390–459 0.6 (0.02–1.2) 0.35 (S.E.=0.001)
Restricted activity day (for adult and elderly person)Ostro and Rothschild (1989) US 390–519 0.0475 Same
0.03030.0213
29S C I E N C E O F T H E T O T A L E N V I R O N M E N T 3 9 4 ( 2 0 0 8 ) 2 5 – 3 8
between 2002 and 2006 were then aggregated for estimatinghis cumulative exposure level over the 5-year period. Similaraggregation exercise was done to estimate the cumulativeexposure level for an elderly person.
Besides the concentration–response coefficients andequivalent ambient PM10 concentrations, the base numbersof different types of concerned health outcomes inHong Kong(POPi) are also needed for estimating the annual number ofavoided cases for different categories of health outcomes. Thebase numbers of three categories of health outcomes were
extracted from the records of the Hospital Authority in HongKong between 1999 and 2003 (HKHA, 2004). They had beenfurther segmented according to the specific health outcomesbefore they were used for estimating the total number ofavoided health outcomes.
2.4.3. Estimating the health benefit gains due to reducedincidences in health outcomesAfter determining the number of reduced incidences in healthoutcomes, the total benefit gains for an adult or elderly person

Fig. 1 –Annual and cool season averaged ambient PM10
concentrations in the worst neighborhood between 2002and 2006.
30 S C I E N C E O F T H E T O T A L E N V I R O N M E N T 3 9 4 ( 2 0 0 8 ) 2 5 – 3 8
and/or society that could be derived from applying anintervention measure was estimated by:
Vi ¼ dHi⁎uVi ð5Þ
Where Vi and uVi are the total benefits and unit benefitsresulting from the reduced impact of a particular healthoutcome i, respectively; and dHi is the change in populationwho is suffering from the health outcome i. Table 4 shows theupper and lower bounds of monetary benefit gain estimatesfor various types of health outcomes by adult, elderly personand/or the society. These estimates were derived based on theassumptions that individuals were responsible for only part oftheir health expenses incurred by hospitalization and thehealth expenses incurred by medical practitioner visits werein accordance with a fixed rate schedule issued by thegovernment (HKMA, 2003; HKHA, 2005). The outstandingamount would be responsible by the government.
The cumulative benefit gains and costs from 2002 to 2006after application of intervention measures were converted topresent values by using a 10% discount rate. Wheneverappropriate, benefit–cost ratios were also computed for indivi-dual measures to reflect their financial viability. A specificmeasure is considered to be financially viable if the ratio of thepresent value of benefits to the present value of costs is greaterthan1.0. The life-cycle costwasdeterminedbysummingup theinitial, discounted operating and maintenance costs of theintervention measure throughout the study period.
3. Results and analysis
3.1. Annual average ambient PM10 concentrations
Fig. 1 shows the 5-year annual and cool season (Octoberthrough March) averaged ambient PM10 concentrations in the
Table 4 – Estimated monetary benefit gains for different health
Health outcome Estimate per incident (
Lower Centra
Benefit for the societyMortality (adult) $ 1,928,000 $ 27,110,Mortality (elderly) $ 649,000 $ 19,937,Hospital admission (adult) c $ 19,000 $ 28,500Hospital admission (elderly) c $ 31,900 $ 47,850Restricted activity day – –
Benefit for the individualsMortality – –Hospital admission (adult) $ 3100 $ 4650Hospital admission (elderly) $ 3560 $ 5340Restricted activity day (adult) $ 468 $ 702Restricted activity day (elderly) $ 323 $ 485
Notes:a Central value was taken the arithmetic mean of the upper and lower eb Sources include Aunan et al. (1998), Ostro and Chestnut (1998), US EPA(1999) with adjustment by an income multiplier of 0.87.c The expenses by the government associated with hospital admissions wday/person).7 The current exchange rate of HK dollar is fixed at US$1=HK$7.8.
worst air quality neighborhood in Hong Kong between 2002and 2006 (HKEPD, 2006). The profile of the 5-year annualaveraged ambient PM10 concentrations is similar to that of the5-year cool season averaged ambient concentrations. Theyboth increased significantly from 2002 to a peak in 2004, andthen declined gradually from2004 to 2006, which suggests thatthe ambient air quality was improved after reaching the peakin 2004. However, both the annual average and cool seasonaverage for these years exceeded 55 μg/m3 as laid down by theannual health-based standard within the Hong Kong AirQuality Objective (HKAQO), with 138–223 days of exceedanceper year. When assessing against the stricter 40 μg/m3
European Union (EU) standard, the number of days ofexceedance per year went up to 212–282. To meet theHKAQO, the annual averaged ambient concentrations must
outcomes
HK dollars 7 in 2006) Type of estimate
l a Upper
000 $ 52,300,000b Human capital, Adjusted WTP000 $ 39,225,000b
$ 38,000 COI, Adjusted WTP$ 63,800– –
– –$ 6200 COI, Adjusted WTP$ 7120$ 936 COI, Adjusted WTP$ 646
stimates.(1999). The upper estimate was taken from the study by the US EPA
ere mainly related to subsidies for general class inpatient (HK$3,200/

Table 5 – Yearly average numbers of days for whichparticular actions were taken by the residents to combatthermal discomfort
Actions taken by the residents No. of days(% of a year)
Windows closed due to daily rainfallexceeded 10 mm
19 (5%)
Windows closed due to thermaldiscomfort during cold days
73 (20%)
Room air coolers switched on to combatthermal discomfort in hot days
121a (33%)
Windows were halfway opened8
during thermal comfort days152 (42%)
Total 365
a No. of days for which room air coolers were switched on, and thenumber included those days with daily rainfall exceed 10 mm.8 See footnote 3 for reference.
31S C I E N C E O F T H E T O T A L E N V I R O N M E N T 3 9 4 ( 2 0 0 8 ) 2 5 – 3 8
be reduced by 7 μg/m3 (11% of the original concentrations).And to meet more stringent EU standard, the annual averagedambient concentrations must be reduced by 22 μg/m3 (35%).
Upon close examination, the PM10 concentrations weretypically elevated in cool seasons within the past 5 years,which suggests that air is unhealthy onmost cool season days.This is in line with the finding from the Brajer's study that aseasonal component was observed for air pollution in HongKong (Brajer et al., 2006). The cool season averaged PM10
concentrations were 13–21 μg/m3 (25–34%) higher than theannual averages. This indicates that the government shouldspend greater efforts on developing action plans and strate-gies to combat high PM10 levels in unhealthy cool seasons.
3.2. Residents' window-opening behaviors
With the thermal comfort model and major assumptions, thethermal responses of residents and their subsequent actionswere predicted for different outdoor weather conditions.Table 5 shows the annual averaged number of days forwhich different actions were taken by the residents underdifferent outdoor weather conditions. Based on the past5 years weather data, 33% of the total number of days (or121 days) within a year, on average, required room air coolersto be switched on for combating the excessive heat from hotweather. Twenty-five percent of the days (or 92 days) within ayear required windows to be closed in response to coldweather and rainy days. Forty-two percent of the days (or152 days) for which individuals felt comfortable thermally,with windows being halfway opened4.
3.3. Intervention measures
3.3.1. Air cleanersPortable air cleaners could be used in indoor residence formitigating the adverse impacts of ambient air quality. More-over, their benefit returns depend on the effectiveness of aircleaners as well as the extent to which windows were openedwhen air cleaners were used. High Efficiency Particulate Air(HEPA) filters are often installed inside the portable air
4 See footnote 3 for reference.
cleaners. However, our results indicate that variations in theefficiency of HEPA filters do not exert a significant impact onthe overall PM10 removal effectiveness. Considerably, thehealth benefit return is greatly influenced by the extent towhich windows are opened.
Fig. 2 shows that an adult and elderly person would derivehigher returns in health benefits if air cleaners were usedthroughout the entire year with window closed. A monetaryequivalent of up to HK$2072 in cumulative benefit returnswould be derived by an adult and HK$1700 by an elderlyperson over the 5-year period. However, the benefit gainswould become smaller if air cleaner was turned on withwindows opened. If the windows were halfway opened5, thebenefit return would be dropped to HK$919 for an adult andHK$736 for an elderly person. It is interesting to reckon thatmore than 80% of these gains could be acquired by using aircleaner in cool season only. By doing so, this would provide acumulative benefit of HK$743–1,971 for an adult and HK$616–1,596 for an elderly person.
Besides, it is also of our interest to reveal the marginalreturn for a given measure. More often, the marginal return isexpressed in terms of benefit–cost ratio. Fig. 3 gives the 5-yearbenefit–cost ratios for an adult and elderly person after usingair cleaners in residence. Generally, an elderly person couldderive some benefit returns when windows were closed. Thehighest marginal return for an elderly person occurred whenair cleaner was turned on with windows closed in cool seasononly, with a maximum benefit–cost ratio of 2.1. By contrast,turning on air cleaner with windows closed throughout theyear did not provide such a high marginal return, with amaximum benefit return of $1.45 for every dollar invested inair cleaners.
However, an adult could only reach breakeven (i.e. abenefit–cost ratio of 1.0) if he elected to turn on air cleanerwith windows closed only in cool season. If he elected to turnon the air cleaner with windows opened, he would even incura loss (i.e. annual benefit–cost ratio b0.9, cool season benefit–cost ratio b1.0).
3.3.2. Behavioral changesChanging individual's time spent at home will change theamount of benefit gains that can be derived by an adult andelderly person. Nevertheless, it is difficult to give a definitiveestimate as many possibilities exist. For instance, an indivi-dual can spend less time at home but more time in the othermicroenvironments in which their indoor PM10 concentra-tions differ significantly. For simplicity, we assumed that anadult would spendmore time in his office as a tradeoff againsthis time spent in residence, and an elderly person wouldspend more time at home as a tradeoff against his timeoutdoors. As expected, as shown in Fig. 4, the benefit gainsderived by an adult and elderly person varied with their timespent at home. Spending 1–4 h shorter at home could give anadult a yearly average return of HK$115–671 in benefits andHK$96–577 if he chose to do this only for cool seasons. The adultcould be benefited from his act since the indoor air-condi-tioned office environments are usually cleaner. By contrast, anelderly person could derive greater benefits by spending more
5 See footnote 3 for reference.
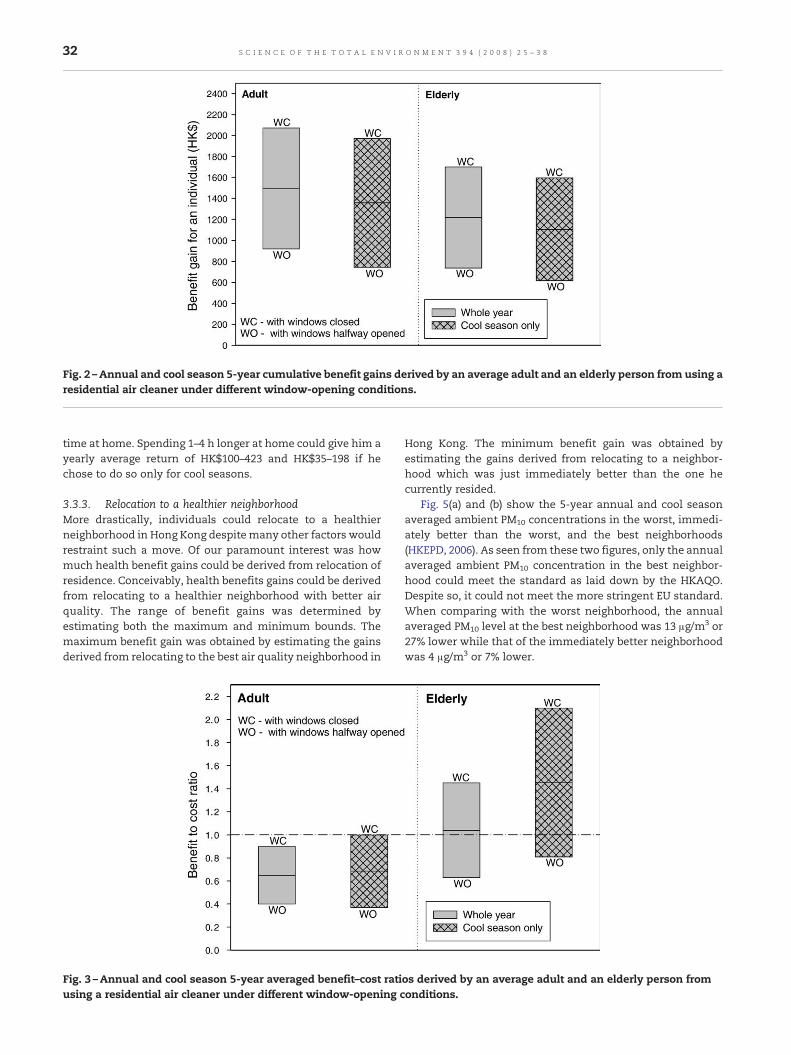
Fig. 2 –Annual and cool season 5-year cumulative benefit gains derived by an average adult and an elderly person from using aresidential air cleaner under different window-opening conditions.
32 S C I E N C E O F T H E T O T A L E N V I R O N M E N T 3 9 4 ( 2 0 0 8 ) 2 5 – 3 8
time at home. Spending 1–4 h longer at home could give him ayearly average return of HK$100–423 and HK$35–198 if hechose to do so only for cool seasons.
3.3.3. Relocation to a healthier neighborhoodMore drastically, individuals could relocate to a healthierneighborhood in Hong Kong despitemany other factors wouldrestraint such a move. Of our paramount interest was howmuch health benefit gains could be derived from relocation ofresidence. Conceivably, health benefits gains could be derivedfrom relocating to a healthier neighborhood with better airquality. The range of benefit gains was determined byestimating both the maximum and minimum bounds. Themaximum benefit gain was obtained by estimating the gainsderived from relocating to the best air quality neighborhood in
Fig. 3 –Annual and cool season 5-year averaged benefit–cost ratiusing a residential air cleaner under different window-opening c
Hong Kong. The minimum benefit gain was obtained byestimating the gains derived from relocating to a neighbor-hood which was just immediately better than the one hecurrently resided.
Fig. 5(a) and (b) show the 5-year annual and cool seasonaveraged ambient PM10 concentrations in the worst, immedi-ately better than the worst, and the best neighborhoods(HKEPD, 2006). As seen from these two figures, only the annualaveraged ambient PM10 concentration in the best neighbor-hood could meet the standard as laid down by the HKAQO.Despite so, it could not meet the more stringent EU standard.When comparing with the worst neighborhood, the annualaveraged PM10 level at the best neighborhood was 13 μg/m3 or27% lower while that of the immediately better neighborhoodwas 4 μg/m3 or 7% lower.
os derived by an average adult and an elderly person fromonditions.

Fig. 4 –Annual and cool season 5-year cumulative benefit gains derived by an average adult and an elderly person fromspending different time periods in a residence.
Fig. 5 – (a) Annual averaged ambient PM10 concentrationbetween 2002 and 2006 for different quality neighborhoods.(b) Cool season averaged ambient PM10 concentrationbetween 2002 and 2006 for different quality neighborhoods.
33S C I E N C E O F T H E T O T A L E N V I R O N M E N T 3 9 4 ( 2 0 0 8 ) 2 5 – 3 8
Table 6 shows the benefit gains for an adult and elderlyperson derived from relocating from the worst to the bestneighborhood.With such amove, an adult could have a 5-yearcumulative health benefit return of HK$404–854, and anelderly person could have a return of HK$292–648. Meanwhile,the society could be benefited by HK$106–224 per adult and HK$3080–6851 per elderly person. The society could be benefitedmore from the elderly person than the adult as the former hadhigher rates of hospital admissions and deaths. Just forreduced number of incidences for hospital admissions alone,the 5-year cumulative benefit gains for the society amountedto HK$3.2–6.8 per adult and HK$220–490 per elderly person.
On the other hand, the benefit gain for an adult dependspredominantly on the monetary values being placed onrestricted activity days, which in turn depends mainly on anindividual's average salary. If his average salary was doubledour original estimate of HK$14,000, his 5-year cumulativebenefit gains would be increased fromHK$404–854 to HK$727–1,538. The benefit gains for the society, however, did notincrease with his average salary.
3.4. Beneficial intervention measures
All in all, it is worthwhile to identify the most beneficialpersonal intervention measures by comparing their 5-yearcumulative benefit returns. Fig. 6 shows the average yearlyreturn for an adult as a result of application of different typesof personal intervention measures, while Fig. 7 shows thesame for an elderly person. It is apparent that, for both adultand elderly, the option of turning on air cleaners withwindows closed throughout the entire year was found to bethe most beneficial measure. This could provide a maximumbenefit of HK$2072 for an adult and HK$1700 for an elderlyperson over the 5-year period. With windows opened and aircleaners were used in cool season, the yearly average returnwould drop to HK$743 for an adult and HK$616 for an elderlyperson. Interestingly, from the perspective of net health

Table 6 – 5-year cumulative health benefit gains that couldbe derived by an individual from relocating to a betterneighborhood
Health benefitgains for anadult (HK$)
Health benefitgains for an
elderly person(HK$)
Lowerbound
Upperbound
Lowerbound
Upperbound
Benefits for individualsHospital admissionexpenses by individuals
0.5 (0.9) 1.1 (1.9) 25 55
Restricted activitiesdays (RAD)
403 (726) 853 (1536) 267 593
Sub-total 404 (727) 854 (1538) 292 648
Benefits for societyHospital admissionexpenses beingsubsidized bygovernment
3.2 (3.2) 6.8 (6.8) 220 490
Mortality 103 (103) 217 (217) 2860 6361Sub-total 106 (106) 224 (224) 3080 6851Total 510 (833) 1078 (1762) 3372 7499
Note: Average monthly salaries for estimating health benefits foran adult and elderly person are HK$11,400 and HK$7000respectively (HK Census, 2006b).Windows were halfway opened9 during thermal comfort days.Value in parenthesis ( ) indicates the monetary benefits for adult in
Note: Average monthly salaries for estimating health benefits foran adult and elderly person are HK$11,400 and HK$7000 respec-tively (HK Census, 2006b).Windows were halfway opened9 during thermal comfort days.Value in parenthesis ( ) indicates the monetary benefits for adult incase his salary was doubled.
34 S C I E N C E O F T H E T O T A L E N V I R O N M E N T 3 9 4 ( 2 0 0 8 ) 2 5 – 3 8
benefit gains, using air cleanerwithwindows halfway opened6
throughout the year would be a better option than relocatingto a better neighborhood.
Contrary to our original expectation, relocating to a betterneighborhood did not appeal to be an attractive measure.Indeed, relocation would not provide the greatest healthbenefit gains as compared to the other examined measures.Changing the time spent at home did not do any good either. Itcould only bring a maximum yearly return of HK$671 for anadult. However, if an adult chose to spend 4 h longer in officesat the expense of his time at home for the whole year (or justfor the cool season), he could derive a greater benefit thanrelocating to the neighborhood with its air quality immedi-ately better than the worst. By contrast, if an elderly personchose to spend 4 h longer at home at the expense of his timeoutdoors in cool season only, he could derive smaller benefitthan relocating to a better neighborhood.
4. Discussions and conclusions
This pioneering work is intended to bridge the knowledge gapin estimating the health benefit gains after application ofvarious personal intervention measures in residence. Incontrast to the controlled indoor environments in mechani-cally ventilated commercial buildings, the indoor environ-
6 See footnote 3 for reference.9 See footnote 3 for reference.
ments in residential buildings are more uncontrolled as thedynamic outdoor climate and residents' behavior increase thecomplexity in deriving reasonable health estimates. In resol-ving this complexity, this work successfully developed aninnovative protocol by first linking the thermal comfortmodel, mass-balance model with exposure adjusted concen-tration–response coefficients. This was subsequently followedby assigning economic values to the estimated health out-comes. The use of well-established thermal comfort modelenables to predict thewindow-opening behavior as well as thehealth benefits gains for residents more accurately.
The findings also provide valuable insights on identifyingbeneficial measures that can help reduce the health damagescaused by adverse outdoor air quality. Turning on air cleanerswith windows closed could bring the greatest benefits for bothan adult and an elderly person despite the most beneficialmeasure was to use air cleaners with windows closed in coolseason only. Nevertheless, the effectiveness of air cleanersand hence the health benefit gains are found to be greatlyinfluenced by the window-opening behavior of the residents.The benefit returns brought by air cleaner would becomelowered as windowswere opened to a greater extent. It shouldbe emphasized that this finding is only valid in the absence ofindoor pollutant sources, e.g. smoking and cooking activities.In the presence of strong indoor pollutant sources, closingwindowsmay in fact lead to other possible adverse effects as aresult of lack of adequate ventilation to remove the indoorpollutants (Chao, 2001; Lee et al., 1999, 2002; Zhao et al., 2004).
In contrast to the health advice given by the governmentfor high pollution days, changes in individual behavior byaltering the time spent in residence would not provide muchreturn in benefits. In fact, their benefit returns were found tobe much lower as compared with those obtained by using aircleaner at home. Relocating to a better neighborhood withinHong Kong did not appeal to be a beneficial solution either.Themaximumhealth benefit gain derived by individuals fromrelocating to a neighborhood, whose average annual PM10
concentration was 13 μg/m3 lower than the average in HongKong, was even much lower as compared to that derived fromusing air cleaner in residence.
More importantly, our findings led us realize that indivi-dual own actions can also help effectively reduce theexposures and health damages caused by adverse ambientair quality. Obviously, individuals should take a more proac-tive role by taking appropriate actions, e.g. using air cleaners,rather than solely relying on the government to combatadverse outdoor air quality.
Nevertheless, the values of estimates presented hereshould be regarded as indicative rather than conclusive. Yet,there are still unresolved uncertainties in relation to theconcentration–response coefficients, value of life estimateswhich are inherent in this type of environmental damagevaluation. As these types of uncertainties have been discussedrepeatedly elsewhere (Chau et al., 2004, 2007), we are not goingto discuss in details here. On top of those, the varyingresident's behavioral pattern becomes another major sourceof uncertainties for estimating the health benefit gainsderived from improved air quality in residences. We havemodeled this behavior by linking with a well-establishedthermal comfortmodel, however, evidences are still needed to

Fig. 6 –Annual and cool season 5-year cumulative benefit gains derived by an average adult from the application of varioustypes of personal intervention measures.
35S C I E N C E O F T H E T O T A L E N V I R O N M E N T 3 9 4 ( 2 0 0 8 ) 2 5 – 3 8
show that the assumptions that we have made perfectlyreflect the resident's actual behavior.
A series of sensitivity analysis had been performed forrevealing the effects of different input parameters for thethermal comfort model on the estimated health benefit gainsfor individuals. The baseline case was defined with referenceto the conditions as given in Tables 1, 2, and 5 and Section 3.2.A ±20% had been introduced to the input parameters for thethermal comfort and window-opening behavior models. Theexamined parameters include the total number of thermalcomfort days over the 5-year period, and the extent ofwindows opened throughout the 5-year period as well asonly on thermal comfort days.
Fig. 8 shows the results of the sensitivity analysis on the 5-year cumulative benefit gains derived by an average adult and
Fig. 7 –Annual and cool season 5-year cumulative benefit gains dtypes of personal intervention measures.
an elderly person from using a residential air cleaner. Ifwindows were kept fully opened or closed on thermal comfortdays only, instead of halfway opened on the thermal comfortdays as assumed in the baseline case, a −83% or +125% changeover the baseline cumulative benefit gain estimates would beobserved for an adult and a −79% or +131% change for anelderly person. On the other hand, if the total number ofthermal comfort days was changed by ±20% with a corre-sponding change in the total number of cold days, a ±15%change over the baseline cumulative benefit gains would beobserved for an adult, and a −14% and +15% change would beobserved for an elderly person. By contrast, a −11% or +14%change over the baseline cumulative benefit gains would beobserved for both an adult and an elderly person in case therewas an ±20% change in the total number of thermal comfort
erived by an elderly person from the application of various

Fig. 8 –Sensitivity analysis showing the effects of change in the total number of thermal comfort days and resident's window-opening behavior on the 5-year cumulative benefit gains or losses.
36 S C I E N C E O F T H E T O T A L E N V I R O N M E N T 3 9 4 ( 2 0 0 8 ) 2 5 – 3 8
days with a corresponding change in the total number of hotdays. It can be reckoned that the estimated benefit gains forindividuals are more sensitive to the extent that windowswere opened on the thermal days than a ±20% change in thetotal number of thermal comfort days over the 5-year period.
Meanwhile, it is important to examine the validity ofincorporating the thermal comfort and window-openingbehavioral models in estimating the health benefit gains forresidents. This was demonstrated by assuming the ventilationrates for the residence to be average in values throughout the5-year period (i.e. assuming the windows to be halfwayopened throughout the 5 year period) without a detailedaccount of the varying thermal comfort responses to andwindow-opening behaviors for the changing weather profiles.In line with our expectation, the results demonstrated thenecessity of incorporating the thermal comfort model toaccount for residents' window-opening behaviors as consid-erable discrepancies are found between benefit gain estimatesderived with and without incorporation of thermal comfortand window-opening model. From Fig. 8, it can be seen that a41% reduction over the cumulative benefit gain estimatewould have found for an adult, and a 39% reduction for anelderly person if the thermal comfort and window-openingmodels had not been adopted in this study.
Given that the residents' window-opening behaviors haveshown to exert considerable impact on the individual's healthbenefit gain estimates, further research studies should be
directed in verifying the behavioral patterns in response tovarious weather conditions so as to help refine the estimates.Meanwhile, methodology advancements and data availabilityare still awaitedon inclusionof indoor sources, e.g. smokingandcooking activities, in the exposure-weighted models as theirdevelopment would be extremely valuable in mimics the realdaily life scenarios. The inclusion of indoor sources, such asenvironmental tobacco smoke, heating and cooking appliances,may have considerable influences on the final outcomes.
Acknowledgements
The authors would like to thank the University Grant Councilin Hong Kong for their partial financial support through theCompetitive Research Grant No. PolyU 5115/04E, and the HongKong Polytechnic University for their partial financial supportthrough the Intra-faculty Central Allocation Grant No. GY-F98.
R E F E R E N C E S
Anderson HR, Bremner SA, Atkinson RW, Harrison RM, Walters S.Particular matter and daily mortality and hospital admissionsin the west midlands conurbation of the United Kingdom:associations with fine and coarse particles, back smoke andsulphate. Occup Environ Med 2001;58:504–10.

37S C I E N C E O F T H E T O T A L E N V I R O N M E N T 3 9 4 ( 2 0 0 8 ) 2 5 – 3 8
ASHRAE Standard 55 (American society of Heating, Refrigeratingand Air-conditioning Engineers). Thermal environmentalconditions for human occupancy. American Society ofHeating. Refrigerating and Air-conditioning Engineers, Inc.;2004.
ASHRAE Standard 62 (American society of Heating, Refrigeratingand Air-conditioning Engineers). Ventilation for acceptableindoor air quality. American Society of Heating. Refrigeratingand Air-conditioning Engineers, Inc.; 2001.
Aunan K, Patzay G, Aaheim HA, Seip HM. Health andenvironmental benefits from air pollution reductions inHungary. Sci Total Environ 1998;212:245–68.
Ballester F, Saez M, Perez-Hoyos S, Iniguez C, Gandarillas A, TobiasA, et al. The EMECAM project: a multicentre study on airpollution and morality in Spain: combined results forparticulates and for sulfur dioxide. Occup Environ Med2002;59:300–8.
Brajer V, Mead RW, Xiao F. Valuing the health impacts of airpollution in Hong Kong. J Asian Econ 2006;17:85–102.
Breesh H, Bossaer A, Janssens A. Passive cooling in a low-energyoffice building. Sol Energy 2005;79:682–96.
Bremner SA, Anderson HR, Atkinson RW, McMichael AJ, StrachanDP, Bland JM, et al. Short term associations between outdoor airpollution and mortality in London 1992–4. Occup Environ Med1999;56:237–44.
Calthrop E, Maddison D. The dose–response function approach tomodeling the health effects of air pollution. Energy Policy1996;24(7):599–607.
Carrier catalogue. Carrier air conditioning products catalogue2005. Carrier Hong Kong Limited; 2005.
Chao CYH. Comparison between indoor and outdoor aircontaminant levels in residential buildings from passivesampler study. Build Environ 2001;36:999–1007.
Chao CYH, Tung TC. An empirical model for outdoor contaminanttransmission into residential buildings and experimentalverification. Atmos Environ 2001;35:1585–96.
Chau CK, Tu EY, Chan DWT, Burnett J. Estimating the totalexposure to air pollutants for different population age groupsin Hong Kong. Environ Int 2002;27:617–30.
Chau CK, Tse MS, Lee WL. Assessing the benefit and cost for avoluntary indoor air quality certification scheme in Hong Kong.Sci Total Environ 2004;320:89–107.
Chau CK, Hui WK, Tse MS. Evaluation of health benefits forimproving indoor air quality in workplace. Environ Int2007;33:186–98.
Choice magazine. Issue No. 342, April, Consumer Council, HKSAR;2005.
Eftekhari MM, Marjanovic LD. Application of fuzzy control innaturally ventilated buildings for summer conditions. EnergyBuild 2003;35:645–55.
Fusco D, Forastiere F, Michelozzi P, Spadea B, Ostro B, Arca M. Airpollution and hospital admissions of respiratory conditions inRome, Italy. Eur Respir J 2001;17:1143–50.
Gouveia N, Fletcher T. Respiratory diseases in children andoutdoor air pollution in São Paulo, Brazil: a time series analysis.Occup Environ Med 2000;57:477–83.
Hensen JLM. On the thermal interaction of building structure andheating and ventilation system. Thesis. University ofStrathclyde; 1991.
HK Census (Hong Kong Census and Statistics Department).Statistical data of population. Census and StatisticsDepartment; 2006a (HKSAR).
HK Census (Hong Kong Census and Statistics Department).Statistical data of household. Census and StatisticsDepartment; 2006b (HKSAR).
HKEPD (Hong Kong Environmental Protection Department).Statistical data of air quality in Hong Kong. EnvironmentalProtection Department; 2006 (HKSAR, website: www.epd.gov.hk/epd/).
HKHA (Hong Kong Hospital Authority). Statistical data forhospitalization and mortality 1999–2003. HKSAR: HospitalAuthority; 2004.
HKHA (Hong Kong Hospital Authority). Fees and charges for publichealth care services. HKSAR: Hospital Authority; 2005.
HKHA (Hong Kong Housing Authority). Graphic presentation onhousing statistics 2006, statistics Section 2. HKSAR: HousingAuthority; 2006.
HKMA ( Hong Kong Medical Association ). Doctors' fees survey2003. Hong Kong Medical Association; 2003 (HKSAR).
HKO (Hong Kong Observatory) Meteorological observations forHong Kong 2002–2006. Hong Kong Observatory, HKSAR; 2006(website): www.hko.gov.hk/.
KanH, Chen B. Particulate air pollution in urban areas of Shanghai,China: health-based economic assessment. Sci Total Environ2004;322:71–9.
Koutraks P, Briggs SLK, Leaderer BP. Sources apportionment ofindoor aerosols in Suffolk and Onondaga Counties, New York.Environ Sci Technol 1992;26(3):521–7.
Le Tertre A, Medina S, Samoli E, Forsberg B, Michelozzi P,Boumghar A, et al. Short-term effects of particulate airpollution on cardiovascular diseases in eight European cities.J Epidemiol Community Health 2002;56:773–9.
Lee SC, Chang M, Chan KY. Indoor and outdoor air qualityinvestigation at six residential buildings in Hong Kong. EnvironInt 1999;25(4):489–96.
Lee SC, Li WM, Ao CH. Investigation of indoor air quality atresidential homes in Hong Kong — case study. Atmos Environ2002;36:225–37.
Mankibi ME, Cron F, Michel P, Inard C. Prediction of hybridventilation performance using two simulation tools. Sol Energy2006;80:908–26.
Nazaroff W,Weschler C. Indoor air and the public good. Indoor Air2001;11:143–4.
Oftedal B, Nafstad P, Magnus P, Bjorkly S, Skrondal A. Trafficrelated air pollution and acute hospital admission forrespiratory disease in Drammen, Norway 1995–2000. Eur JEpidemiol 2003;18:671–5.
Ostro BD, Rothschild S. Air pollution and acute respiratorymorbidity: an observational study of multiple pollutants.Environ Res 1989;50:238–47.
Ostro BD, Chestnut L. Assessing the health benefits of reducingparticulate matter air pollution in the United States. EnvironRes 1998;76:94–106.
Pearce D. Particulate matter and human health in the UnitedKingdom. Energy Policy 1996a;24(7):609–19.
Pearce D. Economic valuation and health damage from air pollutionin the developing world. Energy Policy 1996b;24(7):627–30.
Petitti DB. Meta-analysis, decision analysis and cost-effectivenessanalysis. New York: Oxford University Press; 1994.
Prescott GJ, Cohen GR, Elton RA, Fowkes FG, Agius RM. Urban airpollution and cardiopulmonary ill health: a 14.5 year timeseries study. Occup Environ Med 1998;55:697–704.
Quah E, Boon TL. The economic cost of particulate air pollution onhealth in Singapore. J Asian Econ 2003;213:1–18.
Saksena S, Dayal V. Total exposure as a basis for the economicvaluation of air pollution in India. Paper presented at 20thAnnual International Conference on Energy and EconomicGrowth, 22–24 January 1997, New Delhi; 1997.
Tsai SS, Huang CH. Relationship between air pollution and dailymortality in a tropical city: Kaohsiung, Taiwan. J ToxicolEnviron Health, Part A 2003;66:1341–9.
US EPA (Environmental Protection Agency, United States).Descriptive statistics tables from a detailed analysis ofthe human activity pattern survey (NHAPS) data. EPA/600/R-95/148. Washington DC: Office of Air and Radiation;1996.
US EPA (Environmental Protection Agency, United States). Controlof air pollution from new motor vehicles: tier 2 motor vehicle

38 S C I E N C E O F T H E T O T A L E N V I R O N M E N T 3 9 4 ( 2 0 0 8 ) 2 5 – 3 8
emissions standards and gasoline sulfur control requirements(65 FR 6698). US: Environmental Protection Agency; 1999.
Wong CM, McGhee SM, Yueng RYT, Thach TQ. Final report for theprovision of service for study of short term health impact andcosts due to road traffic-related air pollution (EnvironmentalProtection Department, Tender Ref. AS 00-378). Department ofCommunity Medicine, The University of Hong Kong; 2002a.
Wong TW, Lau TS, Yu TS, Neller A, Wong SL, Tam W, et al. Airpollution and hospital admissions for respiratory andcardiovascular diseases in Hong Kong. Occup Environ Med1999;56:679–83.
Wong TW, TamWS, Yu TS,Wong AHS. Associations between dailymortalities from respiratory and cardiovascular diseases andair pollution in Hong Kong, China. Occup Environ Med2002b;59:30–5.
Yoshida H, Kono T. Analysis of natural ventilation effect for anoffice building considering moisture absorption by materials.Adv Bus Mark 2002;2:1199–206.
Zaim KK. Estimation of health and economic benefits of airpollution abatement for Turkey in 1990 and 1993. Energy Policy1997;25(13):1093–7.
Zanobetti A, Schwartz J, Dockery DW. Airborne particles are a riskfactor for hospital admissions for heart and lung disease.Environ Health Perspect 2000;108(11):1071–7.
Zhang Y, Lin K, Zhang Q, Di H. Ideal thermophysical properties forfree-cooling (or heating) buildings with constant thermalphysical property material. Energy Build 2006;38:1164–70.
Zhao Y, Chen B, Guo Y, Peng F, Zhao J. Indoor air environment ofresidential buildings in Dalian, China. Energy Build2004;36:1235–9.
Zuraimi MS. Estimates of associated outdoor particulate matterhealth risk and costs reductions from alternative buildings,ventilation and filtration scenarios. Sci Total Environ2007;377(1):1–11.