valuing small to medium arts venues - cityofsydney.nsw.gov.au · web viewthis report considers...
TRANSCRIPT
The Economic and Cultural Contributions of Small-to-Medium Arts-spaces in the City of Sydney, 2016
Paul Muller and Dr Dave Carter
University of Tasmania
IntroductionThis report considers the cultural and economic value of small-to-medium (S2M) arts spaces within the City of Sydney (CoS) local government area (LGA).
This report utilises a cost-benefit-analysis methodology previously employed to examine the value of live music (Live Music Office, 2015); as well as sports, tourism and the visual arts (Muller et al 2013). The application of this methodology across multiple sectors demonstrates the strength of this approach as a means of generating standardised, rigorous and comparable data to inform policy and decision-making.
Since the 1960s, the visual and performing arts has been recognised by policy-makers and researchers as contributing social, cultural and economic benefits. In the UK, for example, the visual and performing arts were heralded as drivers of both community and economic development and became a feature of urban regeneration programs in the late 1980s and early 1990s (Reeves, 2002). Subsequent research, including mapping projects and economic modelling has established the ‘creative industries’ as a significant driver of economic growth through jobs creation, exports and gross value added (GVA) to the UK economy (Department of Culture, Media and Sport, 2016). The move towards quantifying the economic value of the arts is mirrored in similar research across the European Union. A UNESCO report identifies at least 58 published studies that purport to measure the economic contribution of the creative and cultural industries at a national level between 2002 and 2012 (Micík, 2012).
The application and relevance of these studies to the S2M visual arts sector in Australia is problematic as most economic impact assessments seek to examine the creative industries and / or visual arts as a single entity – or at least a cluster of entities that function in similar ways for the purpose of analysis. This is an issue because, broadly speaking, the data sets and methods many national studies draw on do not allow for sufficient resolution or granularity to identify or address the functions and impacts of discrete sub-sectors such as S2M arts-spaces.
There are also issues with the varying scope and focus of existing mapping and economic impact studies. For example. Bakshi, Freemand and Higgs (2013) highlight fundamental problems with the UK Department of Culture Media and Sport’s classification of the creative industries by pointing to the significant number of creative workers that are employed in ‘non-creative’ sectors. This is particularly relevant to research into S2M arts-spaces, as many workers are volunteers who are employed in other industries. More fundamentally, the methods utilised by the various international studies mentioned above are difficult to divorce from their particular policy or funding context, rarely consistent and so cannot be easily compared (Micík, 2012).
Such research is characteristic of an instrumentalist understanding of the value of the arts, in which they are deployed as an instrument for the purposes of obtaining economic, social and employment benefits (Belfiore, 2002). In the United States and
2
Australia, this instrumental value of the arts is often also expressed in terms of community development particulary at a local government or regional community level (Duxbury and Campbell, 2011; Mulligan and Smith, 2010; Wodsak and Chapple, 2008).
However, the S2M arts-spaces that are the focus of this study include a number of not-for-profit entities whose motivations and impact require a more nuanced approach than those employed by instrumentalist valuations. In the USA, for example, KPMG identified that the non-profit arts sector plays a role analogous to research and development and, as such, its value cannot be measured purely through economic impact, or broader instrumental, outcomes (Marwick, 1994).
In part, this relates to identifying and assessing the intrinsic value of arts activity. Lehman (2013) suggests that this begins with “the basic question of whether the art, in whatever form, made a ‘difference’ to those that viewed it … and how that might be considered a ‘value’” (online). In Australia, several attempts have been made to develop methodologies to measure intrinsic benefit, typically through surveying audience and stakeholder attitudes and experiences (Radbourne and Johanson, 2010). This includes efforts by the Australia Council, who have promoted the concept of ‘artistic vibrancy’ as an appropriate way to assess the impact of visual and performing arts activity (Australia Council, 2010). However Bailey and Richardson (2010) note that there is no one-size-fits-all approach to examining artistic impact in this way, and that attempts to do so will typically devolve into ‘box-ticking’. As noted by Carnworth and Brown (2014), cultural value (as described by Throsby (2001) and Kramer (2004)) may be a more helpful way to think about “value that is created by cultural goods and experiences that is not economic value” (p. 10).
Existing literature makes clear that visual arts activity has both economic and cultural value. A thorough valuation of S2M arts spaces in the CoS requires consideration of both, as well as the unique context in which these spaces exist.
MethodologyThis report combines economic analysis with qualitative data on consumer and producer experiences to provide a holistic account of the various ways these spaces and their activities benefit the community as well as how their operations might be enabled and constrained.
For the purposes of this report we define S2M arts-paces as those presenting contemporary visual, media craft and design (visual arts) to the public in a permanent, semi-permanent or recurring space or under a recurring brand, with less than 20 equivalent full time staff. Within the CoS LGA this included a number of artist run initiatives (ARI’s), commercial galleries, university galleries, public galleries and contemporary art organisations (CAOS).
This definition was arrived at in consultation with industry groups and workers and corresponds with the Australian Bureau of Statistics (2001) definition of a small
3
business. Our definition is also inline with the only other known Australian study of the sector commissioned by Arts Victoria, which defined small arts organisations as those with less the 10 FTE employees and annual turnover of less than three million $AUD (Arts Victoria, 2007).
CBA is required to identify real and opportunity costs associated with expenditure, and benefits that flow, including economic impacts, preferences and avoided costs. Cost-benefit analysis (CBA) is the Australian government-preferred approach to evaluating policy choices (Office of Best Practice Regulation, 2005).
Within CBA, avoided cost theory assumes that the positive change in public welfare enabled by galleries and art spaces is a benefit that would otherwise need to be met by the community to maintain the status quo.
The cost-benefit approach demands identification of the recipients of benefits and the bearers of costs. In developing and applying a framework for a complete economic valuation of an activity, it is necessary to quantify the costs and benefits to:
government at all levels producers users, and the community, environment and society.
This study estimates the value of galleries and arts spaces in Sydney over a fixed period—in this case, one year. A conservative position is adopted by tending, where necessary, to overestimate costs and underestimate benefits.
Refinement made here to the cost-benefit approach is a more complete illustration of the value creation process. This is because the notion of value is relational, in that the meaning and activity of creating value emerges from a complex set of interconnected social relations (Ollman, 1976). Any study of value should therefore focus on the process by which value is created and ascribed (B. K. Johnson, Mondello, & Whitehead, 2007).
Cost Benefit Framework
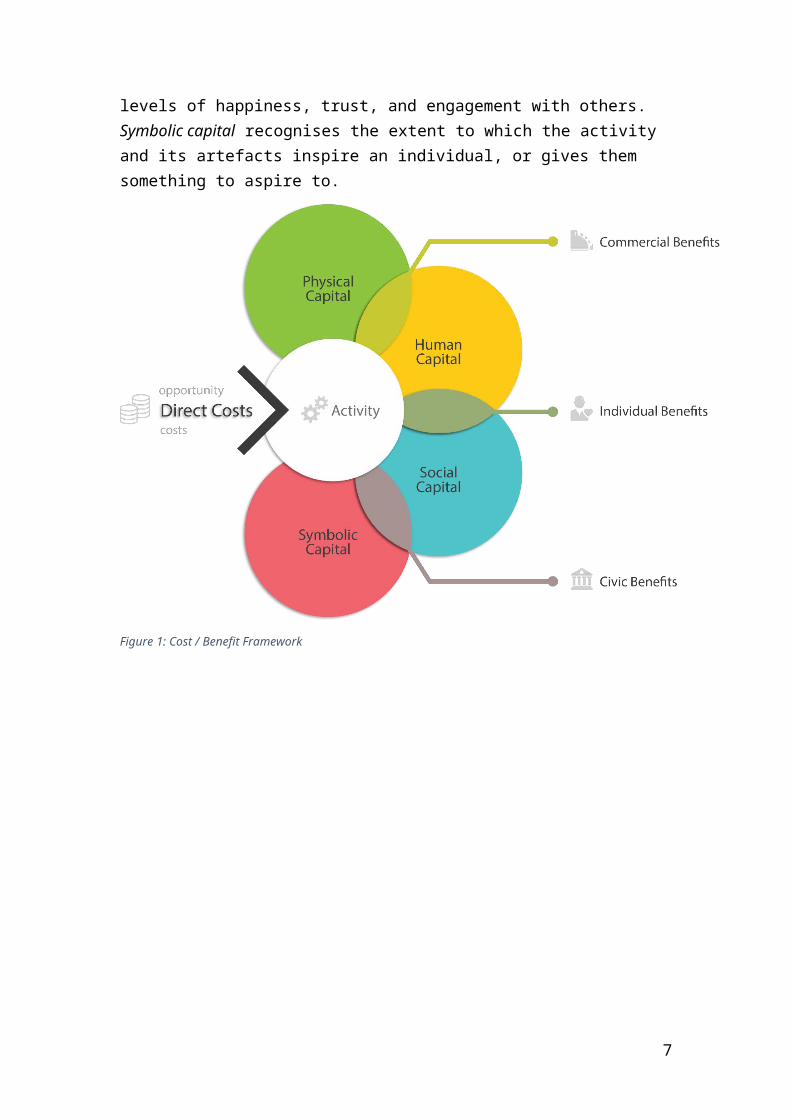
Every activity has inputs, which come at a cost. These include direct costs of goods and services, which enable it, and costs of consumption that might otherwise be spent on alternative activities (for example, the cost of the time an individual spends performing the activity, or the otherwise fallow infrastructure they demand for its performance).
Investment of these current and opportunity costs creates the activity; in this instance, the attendance of gallery and art spaces. This, in turn, may alter (for better or worse) one or all of the four states of human capital in the individuals and society participating in it.
Physical capital refers here to the saleable assets created by the activity. Human capital refers to, among other things, a person’s health, psychological well-being,
4
knowledge and skills; whereas, social capital is an individual’s extant levels of happiness, trust, and engagement with others. Symbolic capital recognises the extent to which the activity and its artefacts inspire an individual, or gives them something to aspire to.
Figure 1: Cost / Benefit Framework
5
Capital of any kind, however, is a latent attribute. As such, it does not so much defeat measurement; it is just that its measurement is highly arbitrary and, for economic purposes, somewhat pointless. It is only when the potential of capital is expressed that it has utility, or value. Tangible and measurable expressions of capital include changes to an individual’s health, productivity and well-being; and, changes to commercial and civic net worth (through enlarged (or diminished) profits and/or avoided (or added) costs).
To that end, this report uses:
financial analysis to scope the small- to medium-sized gallery and art space ecosystem in the City of Sydney
revealed preference and travel cost methodologies to arrive at estimates of direct and opportunity costs
economic impact analysis to estimate productivity and commercial outcomes, qualitative analysis to describe the ‘capital’ outcomes of art space activity and
their relationship to inputs and outputs, and contingent valuation to describe the perceived use and non-use values of the
collective enterprises.
Data collection
The analysis carried out in this study was supported and validated by:
telephone survey interviews with residents of Sydney including consumers and non-consumers of galleries and art spaces (n=404)
face-to-face survey interviews with attendees of art spaces in Sydney (n=532), and
qualitative interviews with S2M staff from Artist Run Initiatives, Public Galleries, Commercial Galleries, University galleries and Contemporary Art Organisations operating in the City of Sydney.
Qualitative data has been used to provide an account of the sector’s operation from the perspective of producers. The data was examined using qualitative content analysis to identify themes emerging from similar responses to interview and survey questions. These themes were refined and, where possible, standardised to provide a summary of the sector and its activities. Strict data collection and management protocols were employed to ensure no venue or respondent could be uniquely identified.
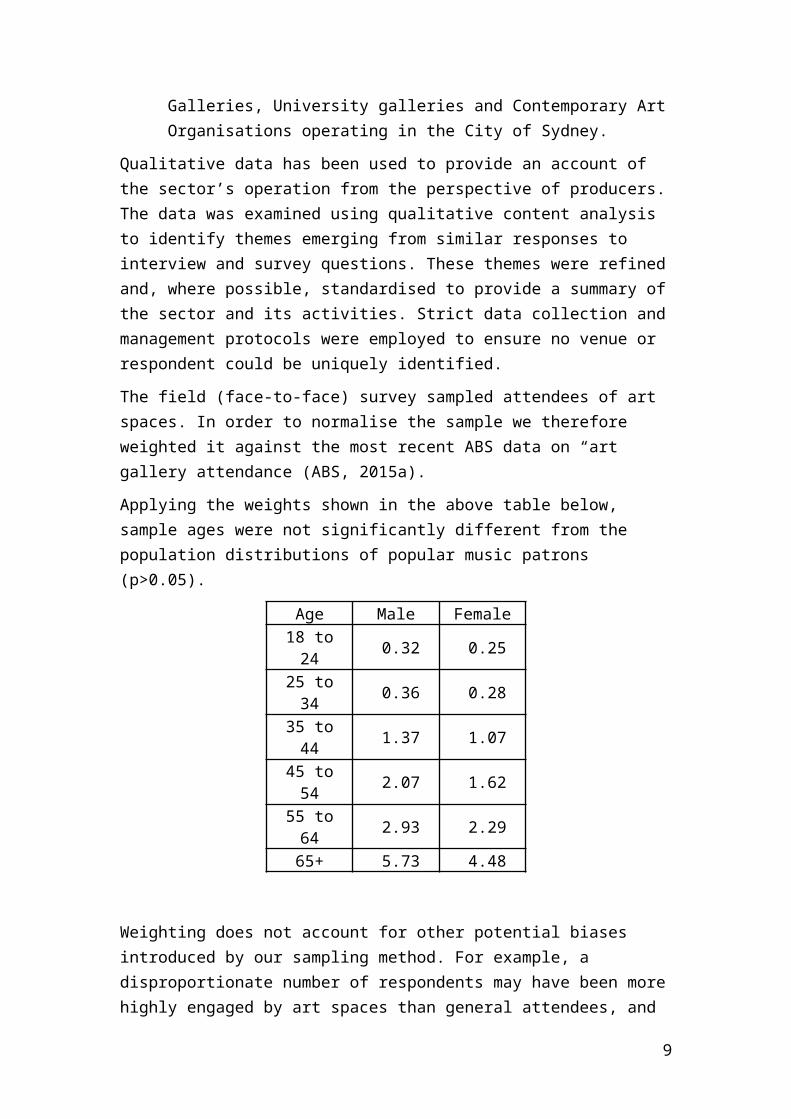
The field (face-to-face) survey sampled attendees of art spaces. In order to normalise the sample we therefore weighted it against the most recent ABS data on “art gallery attendance (ABS, 2015a).
Applying the weights shown in the above table below, sample ages were not significantly different from the population distributions of popular music patrons (p>0.05).
6
Age Male Female18 to 24 0.32 0.25 25 to 34 0.36 0.28 35 to 44 1.37 1.07 45 to 54 2.07 1.62 55 to 64 2.93 2.29
65+ 5.73 4.48
Weighting does not account for other potential biases introduced by our sampling method. For example, a disproportionate number of respondents may have been more highly engaged by art spaces than general attendees, and performing artists and industry workers were potentially over-represented. Based on our survey the audience for S2M spaces appears skewed towards people working or studying in the visual arts rather than the general public. 70% of survey respondents in this research reported some professional affiliation with the visual arts. This is unlikely to be due to sampling bias, as we conducted data collection across mutlipe locations including S2M arts spaces, larger galleries and festival sites as well as online.
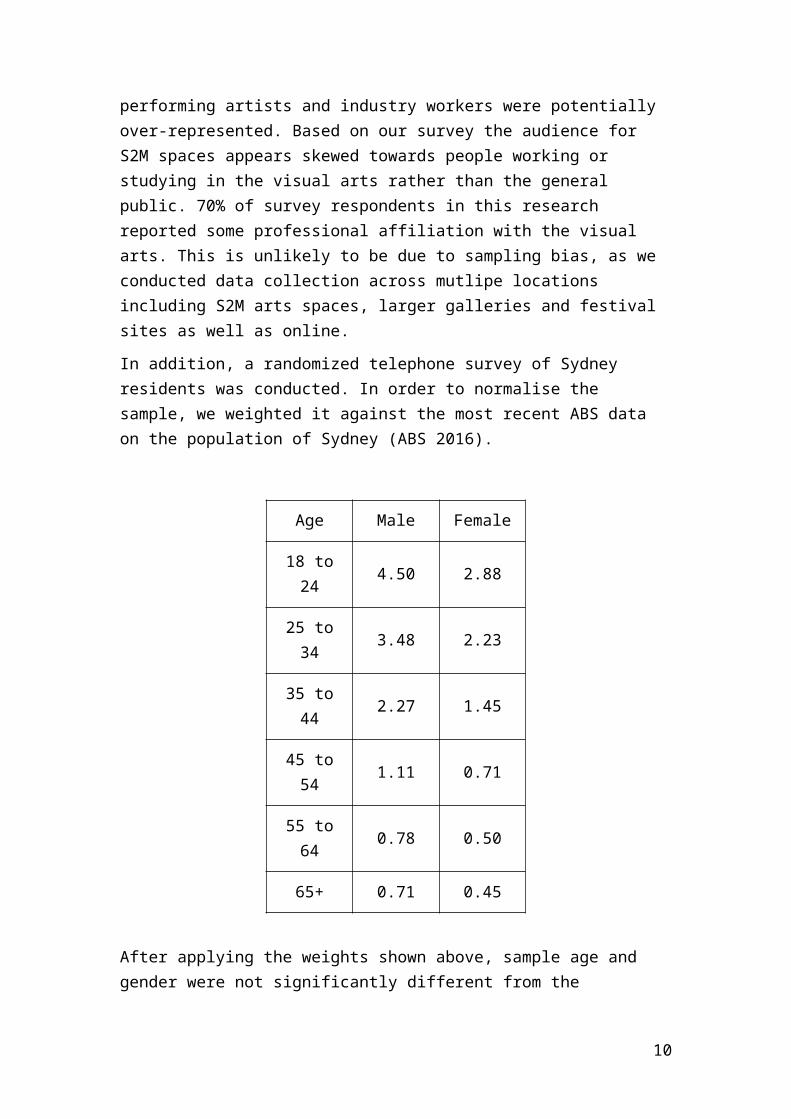
In addition, a randomized telephone survey of Sydney residents was conducted. In order to normalise the sample, we weighted it against the most recent ABS data on the population of Sydney (ABS 2016).
Age Male Female
18 to 24 4.50 2.88
25 to 34 3.48 2.23
35 to 44 2.27 1.45
45 to 54 1.11 0.71
55 to 64 0.78 0.50
65+ 0.71 0.45
After applying the weights shown above, sample age and gender were not significantly different from the population distributions of arts patrons (p>0.05 for both).
7
Gallery and art space and consumption A satellite account is a standard developed by the United Nations to measure economic sectors and industries not defined in national accounts (UNWTO, 2002). As there is no official satellite account for galleries and art spaces, this study follows methodology developed by IPM. IPM has used their model of value creation to build satellite accounts for a number of industries including, live music, volunteering and the valuation of the Salamanca Arts Centre (Muller 2012).
Attendance of art galleries involves a variety of related purchases, categorised here as:
Accommodation and related expenses Food and beverages Fuel, motor vehicle and travel expenses Memberships and subscriptions Merchandise (including programs, memorabilia) Tickets / entry fees Other expenditure
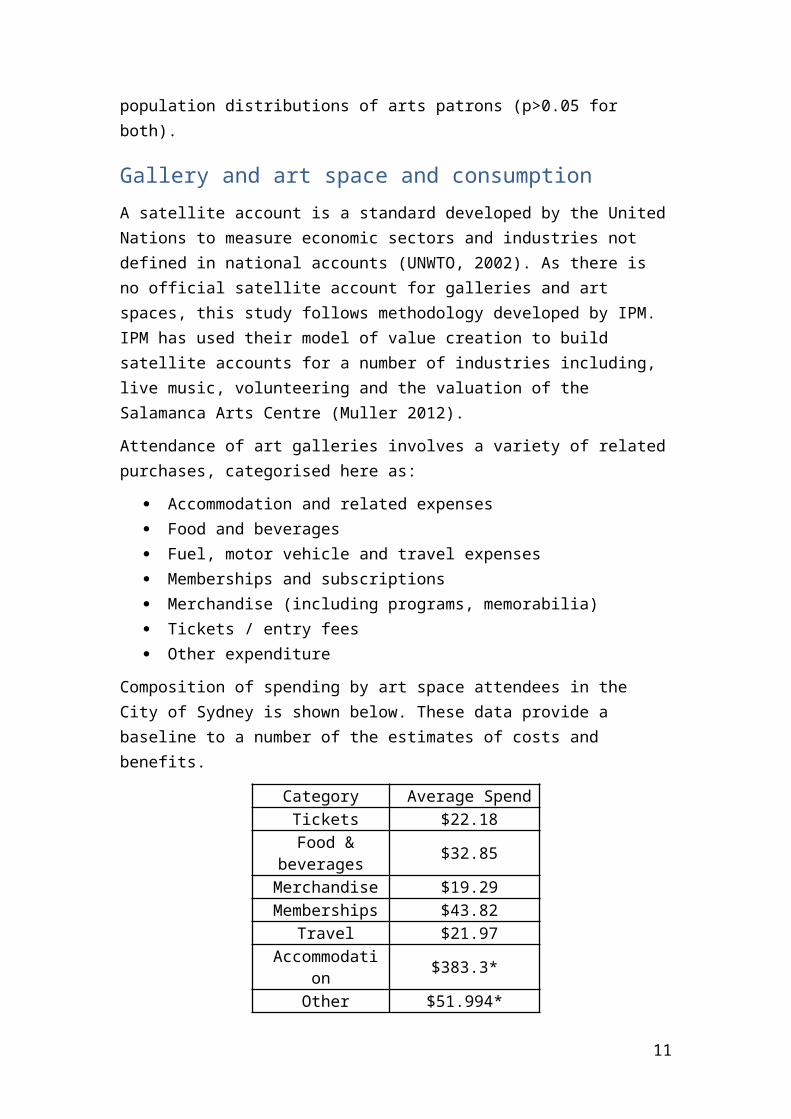
Composition of spending by art space attendees in the City of Sydney is shown below. These data provide a baseline to a number of the estimates of costs and benefits.
Category Average Spend Tickets $22.18
Food & beverages $32.85 Merchandise $19.29 Memberships $43.82
Travel $21.97 Accommodation $383.3*
Other $51.994*
‘Accommodation’ and ‘other’ spending were only reported by a small portion of attendees surveyed (<12%). As the standard error for the average spend in these two categories was in excess of 80%, these results are considered unreliable and excluded from further analysis.
The following approach was used to form a conservative estimate of the total number of visitors to galleries and art spaces in the City of Sydney in 2016. ABS data on art gallery attendance (ABS 2015a) reports that 26% of NSW residents attended an art gallery in 2013-14. This is assumed to be true for Sydney residents for 2016, giving an estimate of the number of resident that attended an art space in 2016. Sydney residents made up 31% of our art space field survey; assuming that this survey is representative of the art space attendee population we now have an estimate for the total number of unique visitors. Multiplied by the median number of visits per year, six (6), gives the total number of visits.
8
Small to Medium Arts spaces in the City of SydneyS2M arts spaces provide artists with opportunities to experiment, develop and exhibit new work without significant commercial pressure or risk. This is valuable for artists at all stages of their career and S2M arts spaces work with artists at all stages of their careers. In this regard S2M arts spaces might be considered equivalent to the independent film-making sector, which fosters new talent and provides established directors and performers freedom for creative exploration or expression. Where larger institutions are seen as taking on a collecting role, S2M arts spaces see themselves as incubators and generators of new work. Several interviewees suggested that much of the contemporary Australian work acquired by larger institutions or shown internationally is often developed for S2M shows.
Due to their size and rapid turnover of exhibitions, S2M arts spaces are capable of taking risk by showing untested work. Related to this, S2M arts spaces argue they can accommodate a greater diversity of voices than larger organisations with limited space and tighter curatorial focus. Because of this S2M arts spaces are often the first place new work or artists are shown, and they often play a role in mentoring emerging artists through career entry or re-entry. This includes helping artists to develop their profile and business skills as well as connecting them with potential representation.
In addition to providing an accessible entry point for artists, and arts workers, the S2M sector provides a platform for career development. ARIs, in particular, appear to have been hugely important in the careers of the current generation of arts space managers. This career development relies on accumulating a set of skills and relationships that S2M arts spaces, by their nature, foster in a way that larger organisations cannot.
Most artists careers are iterative, not linear and their career trajectories in relation to the S2M sector might best be described as orbital. This orbital trajectory typically sees artists cycling through S2M and larger spaces, both commercial and non commercial, across Australia and overseas. Established practitioners routinely exhibit in and develop work for S2M spaces, and there is a degree of prestige or cultural cachet associated with exhibiting in established S2M spaces. Similarly, artist mobility between cities is not horizontal, and established artists showing in Sydney for the fist time will also often approach an S2M arts space, rather than an established gallery. There is some sense that smaller spaces feed successful work and artists into larger ones, but this appears related to a perceived hierarchy based on size rather than an established progression through S2M spaces.
The provision of cheap or free studio space by some S2M arts spaces also seems of significant value to the sector, particularly in light of the relatively high cost of commercial rent within the CoS. Anecdotally, even very established artists have difficulty affording studio space within the CoS and this impacts on their ability to create new work. Some more established arts spaces extend the provision of studio space to auspicing funding for individual artists or smaller organisations. Larger S2M
9
arts spaces also produce touring shows and partner with other orgs to create new opportunities for exposure and audience development.
More generally S2M arts spaces may provide value to the wider community through audience spending on hospitality, transport and other activity as part of their visits to S2M arts spaces. Several interviewees mentioned that S2M arts spaces may play an unwilling role in urban development and gentrification that invariably prices them out of their accommodation.
Structure and Operation
The structure and operation of S2M arts spaces in the CoS varies but tends towards incorporated not-for-profits with a board structure; auspiced spaces within institutions; or privately run and funded ventures (including commercial galleries and some ARIs). The prevalence of not-for-profit organisations appears directly related to this often being a requirement of government funding. For these organisations, the constitution, governance and operation of the board appears vital as the board is often required to fundraise and be involved in programming and other operational matters. Continuity of board members can become an issue through boards that are not renewed often enough to respond to the needs of the organisation or staff having to constantly train new board members and manage change.
The sector relies on passion and goodwill to deliver value to the community with limited prospects for financial reward. Almost all activity in the sector appears to be subsidised to some degree by an external institutional or philanthropic funder; provision of unpaid labour; or out of workers’ own pockets. Problematically there may be a tendency for the sector to value curatorial skills over business acumen. Invariably this means S2M arts spaces will, at some point, need to attract philanthropic or government funding and / or the attention of private or institutional collectors.
Public activities held in S2M arts spaces are diverse and include live music, film screenings, theatre, popup restaurants and performance art; as well as openings and exhibitions. Audience engagement with S2M arts spaces is concentrated around opening events. Many of the ARIs within the CoS coincide their openings to encourage audience overlap and migration between venues. Despite this initiative, Sydney’s S2M sector is seen as not as interconnected as other cities due to the distance between spaces and their placement outside, or at the fringes, of entertainment precincts.
Across the sector there is a very high turnover of new work and most spaces host openings every 4-6 weeks. Despite this high volume of activity, there are relatively few full-time paid staff in the sector and remuneration is often poor given the responsibilities of these roles. S2M arts spaces are generally under-resourced and this requires them to work collaboratively with others in the sector. There is an expectation and general acceptance of unpaid work being part and parcel of a career in the visual arts for both arts workers and artists. This is reflected in workers’ stated
10
motivations, which were typically described in terms of individual creative expression and the value and role of art in a civil society. No one interviewed for this research identified personal gain as a significant motivation and most subjects acknowledged there was limited opportunity to profit through their work. However, this reliance on unpaid labour jeopardises sustainability and longevity of S2M arts spaces. Long hours, relatively low pay and the need for to be constantly performing at or beyond capacity typically results in significant risk of burnout among sector workers.
More generally, partnerships with other organisations within and outside of the visual arts sector are seen as vital to delivering new projects where organisations are at capacity. However, these create additional time and resource costs and often require new staff with different skills to manage them.
There is a high degree of uncertainty and change in the sector and interviewees who have had longer careers commented on a constant stream of new and closing spaces as characteristic of the sector. Having said this, there is also a general feeling that the sector has contracted post 2007 due to the negative impact of the Global Financial Crisis on art investment; changes to government funding; and increased rental costs in the CoS. Currently there appear to be fewer ARI’s within the CoS than may have previously been active and there is a perception that a number of commercial galleries have recently closed. This is likely attributable to the high cost of rent for commercial property in the CoS and a perceived greater risk to establishing arts spaces that are not compliant with government regulations.
Income and Costs
In the last decade the costs associated with operating S2M arts have escalated where income has remained the same or diminished. This has left many S2M arts spaces in a precarious position. Many organisations perceive themselves as being in crisis and at least one interviewee admitted facing bankruptcy due to their investment in an S2M arts space.
The cost of rent and uncertainty over ongoing lease terms/lengths is a major stress across the S2M sector in Sydney, ahead of all other costs. Even well established S2M arts spaces reported being in a precarious position with respect to the cost and long-term availability of accommodation. Commercial rents were described as having increased significantly in the last seven years and most organisations do not have the financial reserves to fund relocation, even if a suitable alternative location could be found. Real estate development has also brought some S2M arts spaces into conflict with residents over noise and other complaints that restrict their activity. This has reportedly forced the closure or relocation of several arts spaces in the CoS in recent years. This has encouraged some arts spaces operate within the premises of another business, in the owners’ residential property or as pop-up spaces.
Schemes such as the CoS accommodation grants have alleviated some of this financial pressure, however organisations report that consecutive 12 month leases do not provide sufficient stability. In contrast, S2M arts spaces 3 year + rental
11
agreements feel secure to invest in infrastructure and development of their space to enable expanded operations.
Staffing is the next biggest cost, followed by insurance; transportation of artworks; amenities; installation costs; advertising; and documentation. These costs are small compared to rent but are significant given often very tight operating budgets.
The basic operation and infrastructure (rent, staffing, electricity, etc) of commercial and non-commercial spaces alike is subsidised through unpaid labour, institutional support (e.g. uni galleries) or private benefactors.
The prevalence of government and philanthropic funding in the sector, income does not align closely with reported audience spending. Income for S2M arts spaces typically includes some mix of grant funding; sales commissions; venue hire; provision of workshops or other educational events; rent from studio spaces; philanthropic giving; and, for some spaces, auspicing projects and funding for artists or other organisations. The majority of earned, as opposed to grant, income tends to come from other businesses – including artists – rather than consumers.
Government Funding
There is broad recognition that the sectors reliance on government funding is unsustainable, with many interviewees making specific reference to the federal governments changes to arts funding in 2015/16. These changes are seen as having had a disproportionate impact on larger and more established S2M arts spaces as these organisations have, historically, developed with and relied on Australia Council funding.
It appears difficult for the sector to disentangle itself from government funding, in part, because their operations have become aligned with the priorities and key performance indicators (KPIs) of funding bodies. Several interviewees have described a shift over the course of their careers from arms-length funding intended to support artistic risk-taking, towards funding tied to demonstrable public benefit including new opportunities for cultural expression and audience engagement. This change has had a disproportionate impact on S2M arts spaces that have seen their role as facilitating artistic risk-taking and the creation of new work.
There appears to be a disconnect between a need from the sector for stable operational funding and current schemes that are perceived as increasingly focussed on discrete projects. In the absence of secure operational funding this has meant arts spaces who receive government funding reported a need to pursue ‘safe’ projects to help cover operational costs.
Obtaining this funding incurs time and resource costs that detract from perceived core-business and capturing and reporting on the data required for acquittals places further stress on the, already stretched, capacity of staff. There is a perception that the sector is putting inordinate energy into meeting KPIs in order to align with the goals
12
of government funding bodies and that this encourages pitching and developing work that they think the funders want.
Smaller and younger arts spaces appear less reliant on government funding through design or necessity but are forced to operate with less money. This is often expressed as a positive as it forces younger organisations to find creative solutions to resourcing problems, but may limit their growth and long-term viability.
Diversification
Diversification of income to include philanthropic donations and sponsorship was a goal for most of the organisations that participated in this research. However this process is not quick or straightforward and comes with additional time and resource costs. This diversification does not appear to result in increased capacity but is required to replace government funding or other operational income that has been lost.
Fundraising and managing stakeholder relationships requires a skill set that may not be present in small organisations, requiring them to either recruit or hire new staff, volunteers or board members. Partnerships that deliver off-site programs and exhibitions is also seen as way to diversify operations and income, but again these require time and expertise to develop and come with additional costs that may outweigh the benefits. For many S2M arts spaces this diversification appears to be a zero-sum game, necessitated by the disappearance of government funding, which has simply increased competition for donor money across sector.
Relationships with regulators
The experiences of S2M arts spaces dealing with various facts of local, state and federal government could be described as disjointed. On the one hand, several interviewees spoke very highly of the role the CoS plays in supporting the sector, particularly through schemes such as accommodation grants. However, there is also a perception of a lack of interdepartmental communication and a lack of a consistent approach to dealing with S2M arts spaces and activity at a local and state government level.
One often cited example is that the development applications (DA) process is slow and hampers activity as S2M arts spaces have difficulty aligning building code definitions with actual usage of their space. In part this is likely due to bureaucratic processes being seen as intimidating or counter intuitive. Several interviewees expressed a desire for a single point of contact in council and state government who could explain processes clearly and advocate for their interests. Irrespective of practicality, this suggests there is a genuine problem with the interface between S2M arts spaces and various regulatory functions.
There appears to be some activity happening under the radar of regulators because navigating the process to legitimise this activity is seen as too difficult given the short life of some projects. Associated with this is a perception that transitioning informal
13
arts spaces to more legitimate operations is more difficult than in the past. Primarily this is due to a lack of funds, absence of long-term rental contracts and landloards being unwilling to commit to upgrades required for regulatory compliance.
CostsThe labour, materials and infrastructure that enable galleries and art spaces in Sydney are either directly purchased or donated at a cost. Given the scarcity of resources, diversion of money to art spaces implies other opportunities are denied—a social cost that is also considered.
The total social and economic cost of attending art spaces in Sydney and related enterprises in 2016 is estimated to be $113.28 million. This includes direct costs of $111.92 million and opportunity costs of $1.37 million.
Direct costs
Direct costs estimate the change to final demand attributed to attendance of art spaces in the City of Sydney, 2016. To avoid double counts, intermediate inputs including costs of production are not counted separately.
From our survey data we know the average spend of a consumer attending an art space in the City of Sydney, and we have made an estimate on the number of visits in a year – we estimate that in 2016 consumers directly spent $111.92 million on attending art spaces in Sydney.
It should be noted that these costs appear significantly broader in their coverage and greater than previous costs attributed to art spaces in other studies. These departures are reasonably explained by the differences in methodology as described in UTAS (2015).
Galleries and art spaces are further subsidised by individuals, businesses and various levels of government through other venue revenue, volunteering, sponsorships, grants programs, free concerts et cetera. The sum of these investments is what is known in economics as the shadow price (McKean, 1968). Shadow price has the net effect of either enlarging producer profits or reducing the cost to consumers.
As such, it is a real stimulus to art spaces in the City of Sydney and relevant to the scope of our enquiry. Unfortunately it was beyond our means in this instance to gather the necessary data, and the development of a more comprehensive art space satellite account is recommended as a direction for future research.
Opportunity Costs
An opportunity cost is the value lost as a result of making a decision between mutually exclusive choices. Before assessing the economic benefits of art spaces in Sydney, the next best alternative for allocated resources is considered.
14
It is assumed that if individual purchases were withheld because the community placed no value on art spaces, that contribution could be invested in long term capital growth.
Therefore the opportunity costs is at least equal to interest forgone on the investment.
Art spaces opportunity cost = I x r
I = investment
r = rate of return on investment
The rate of return is determined from the 10-year bond rate of 2.52 per cent, as at 1 April, 2016 (RBA, 2016). 1.3 per cent is the long-run inflation rate, based on the final year projection of the percentage change in consumer price index (ABS, 2016b).
r = i–π
r = real discount rate (or cost of investment)
i = nominal long-run interest rate (3.49 per cent)
π = long-run inflation forecast (2.3 per cent)
Therefore applying the long-run cost of investment of 1.22 per cent, the gross opportunity cost of art spaces in the City of Sydney in 2016 is approximately $1.37 million.
BenefitsThe economically valuable outputs of art spaces that impact on the welfare of all City of Sydney residents is considered in this next section. It is estimated that in 2016 attendance of art spaces in Sydney enabled at least $332.60 million worth of such benefits across the community.
Using the Regional Input-Output Matrix (RIOM) model, it is estimated consumers’ expenditure on art spaces increased output in the Sydney economy by $222.61 million. Increases in wages, rents, profits and taxes associated with the increase in production are estimated to deliver $115.42 million of additional value, or profit, to all Sydney based producers (compared to an alternative case where expenditure on art spaces ceased). Together with a productivity premium of $8.76 million, the sum of benefits returned to businesses as a result of art spaces in Sydney in 2016 was estimated to be $71.18 million.
Expenditure associated with art spaces in Sydney is further estimated to enable over 1,500 full-time and part-time jobs worth $62.52 million and taxation revenue to all tiers of government of $2.48 million. Total civic benefits are estimated to be $64.99 million.
Patrons of art spaces in Sydney revealed their satisfaction with art spaces purchases to be worth $65.14 million. Non-consumers, though not engaged, identified well being
15
associated with having art spaces in Sydney; estimated to be $51.43 million. Total individual benefits from art spaces in Sydney are estimated to be $228.49 million in 2016.
Commercial benefits
Expenditure associated with art spaces in Sydney can be understood in two contexts. Firstly, spending by individuals, businesses and government on galleries and art spaces in Sydney reveals value the community perceives. Secondly, expenditure creates change in final demand producing economic impact on employment, output and gross national product. Economic impact includes the impact on intermediate goods and compensation of employees.
Analysis of total impact, including indirect effects, is based on an understanding that industries, and individual companies within these industries, do not exist in a vacuum, but use each other’s products to produce their own. Thus, an increase in demand for one industry’s products leads to increases in the demand of other ‘linked’ industries.
RIOM is a closed model that applies the ABS Australian 2012-13 transaction tables (ABS, 2015) in conjunction with demand and employment information for each Australian State and Territory to model the impact of changes in demand on these regional economies, estimating changes in their output, employment and gross state product.
The transaction tables used in the model identify 60 industries across 19 industry sectors. For expenditure allocated to each industry sector, a unique multiplier impact is calculated estimating the impact on gross supply, output, gross state product (following the value-added method), employment, wages, imports and taxation.
As previously noted, the producers and consumers of galleries and art spaces in Sydney spent $111.92 million in 2016. This figure represents final demand in three main industry categories:
Heritage, museums and the arts Retail Trade, and Road transport.
Changes in employment and gross state product (GSP) are proportional to changes in output following the constant return to scale assumption inherent in I/O models. An in-depth explanation of the RIOM modelling method can be found in the previously cited report prepared for the Live Music Office (2015).
16
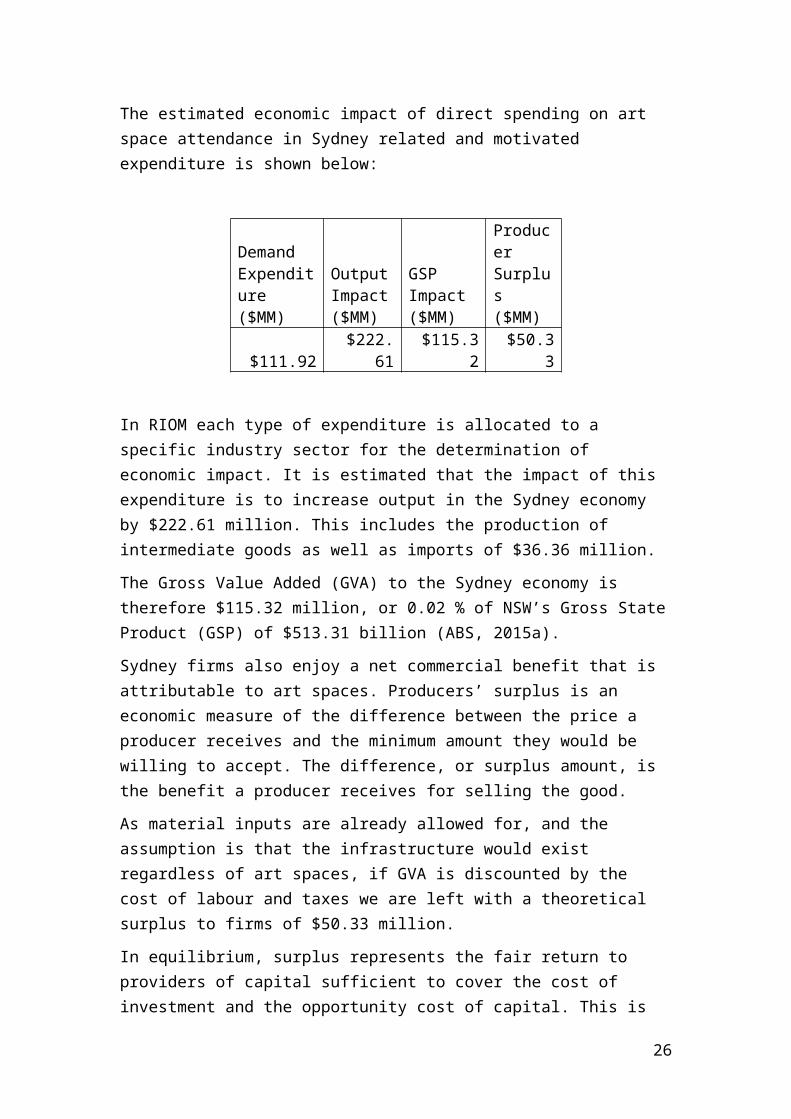
The estimated economic impact of direct spending on art space attendance in Sydney related and motivated expenditure is shown below:
Demand Expenditure ($MM)
Output Impact ($MM)
GSP Impact ($MM)
Producer Surplus ($MM)
$111.92 $222.61 $115.32 $50.33
In RIOM each type of expenditure is allocated to a specific industry sector for the determination of economic impact. It is estimated that the impact of this expenditure is to increase output in the Sydney economy by $222.61 million. This includes the production of intermediate goods as well as imports of $36.36 million.
The Gross Value Added (GVA) to the Sydney economy is therefore $115.32 million, or 0.02 % of NSW’s Gross State Product (GSP) of $513.31 billion (ABS, 2015a).
Sydney firms also enjoy a net commercial benefit that is attributable to art spaces. Producers’ surplus is an economic measure of the difference between the price a producer receives and the minimum amount they would be willing to accept. The difference, or surplus amount, is the benefit a producer receives for selling the good.
As material inputs are already allowed for, and the assumption is that the infrastructure would exist regardless of art spaces, if GVA is discounted by the cost of labour and taxes we are left with a theoretical surplus to firms of $50.33 million.
In equilibrium, surplus represents the fair return to providers of capital sufficient to cover the cost of investment and the opportunity cost of capital. This is fundamentally a short-run concept in competitive markets. In the long-run, economic profits (profits in excess of the cost of capital) would generate new entrants that reduce profitability to normal.
The nature of this modelling means the $50.33 million is distributed amongst all Sydney firms who contribute intermediate or final goods and/or services that are consumed as a result of art spaces in Sydney, and not just art spaces producers.
Following the methodology of UTAS 2015, the acknowledgement of a productivity gain associated with art space attendance, a commercial productivity premium was further estimated for Sydney 2016. Accounting for positive and negative productivity impacts, the net productivity benefit is estimated to be $8.76 million. Giving a total commercial benefit from art spaces of $59.09 million in 2016.
Distribution of Impacts
The spread of the impacts across different industry groups provides additional information. Distributions are presented in the following tables and graphs. The largest contributing increases to the Output and GSP (GVA) are seen in the Retail trade sector (G) and the Arts and recreation services sector (R).
17
Figure 2 Impacts on Output and GSP (See Table 1 Impacts on Output and GSP for data)
A B C D E F G H I J K L M N O P Q R S T0
10
20
30
40
50
60
70
Output GSP
Ip
act
($M
M)
Figure 3 Impacts on wages and employment (see Table 2 Impacts on employment and wages for data)
A B C D E F G H I J K L M N O P Q R S0
100
200
300
400
500
600
$0.0
$5.0
$10.0
$15.0
$20.0
$25.0
FT Employment PT Employment Wages
Em
plo
ymen
t (P
erso
ns)
Wag
es (
$MM
)
18
Table 1 Impacts on Output and GSP
Sector Code Output ($mm) GSP ($mm)
Agriculture, Forestry & fishing A 3.42 1.35
Mining B 0.66 0.34
Manufacturing C 13.90 4.35
Electricity, Gas, Water and Waste Services D 5.51 2.02
Construction E 1.59 0.38
Wholesale Trade F 5.65 2.76
Retail Trade G 48.01 29.05
Accommodation and Food Services H 3.44 1.04
Transport, Postal and Warehousing I 22.99 10.52
Information Media and Telecommunications J 10.08 2.71
Financial and Insurance Services K 7.05 4.64
Rental, Hiring and Real Estate Services L 4.60 1.17
Professional, Scientific and Technical Services M 13.78 3.61
Administrative and Support Services N 5.00 3.45
Public Administration and Safety O 0.94 0.60
Education and Training P 2.11 1.61
Health Care and Social Assistance Q 2.84 2.08
Arts and Recreation Services R 57.57 33.70
Other Services S 5.24 2.85
Ownership of dwellings T 8.23 7.11
Total 222.61 115.32
19
Table 2 Impacts on employment and wages
SectorCode
Employment (persons)
Wages ($mm)
Agriculture, Forestry & fishing A 16.53 0.29
Mining B 0.87 0.07
Manufacturing C 42.56 2.70
Electricity, Gas, Water and Waste Services D 9.69 0.61
Construction E 6.59 0.24
Wholesale Trade F 18.64 1.83
Retail Trade G 478.17 20.02
Accommodation and Food Services H 51.30 0.77
Transport, Postal and Warehousing I 103.29 6.05
Information Media and Telecommunications J 33.58 0.93
Financial and Insurance Services K 14.58 1.98
Rental, Hiring and Real Estate Services L 15.29 0.36
Professional, Scientific and Technical Services M 99.08 2.56
Administrative and Support Services N 10.68 2.83
Public Administration and Safety O 4.08 0.49
Education and Training P 19.25 1.39
Health Care and Social Assistance Q 31.21 1.74
Arts and Recreation Services R 505.52 15.63
Other Services S 46.85 2.04
Total Total 1508.84 62.52
20
Civic benefits
For the purposes of this study, a civic benefit is a contribution made by having art spaces in Sydney that would otherwise have to be provided (presumably by the state) if the same community-wide standard of living were to be enjoyed. In other words, it typically represents a cost avoided by government.
Two instances of civic benefit are identified. Expenditure associated with art spaces in Sydney is estimated to generate in the order of 1,508 jobs, 1,098 of which are full-time. Wages of $62.52 million are directly returned to households, with an equivalent welfare cost avoided by government.
The estimate of taxes generated by art space attendees’ expenditure is $2.48 million. Taxation receipts may not be directly proportional to the relevant investment of each tier of government. Nevertheless, it is unlikely that the industry receives an equivalent quantum of re-investment from government; it could be argued that direct tax returns from art spaces are used to finance other policy and social investments, such as hospitals and schools.
Civic benefits acknowledged but not quantified by this study include the significant levels of volunteering that occur within art spaces and galleries in Sydney, as well as the costs potentially avoided by our civil systems of health, criminal and social justice. This is recommended as a direction for future research.
Individual benefits
Consumers engaging with art spaces through the purchase of a good or service are assumed to derive some benefit. A rational economic framework assumes that decision-makers are acting to maximise utility in and do not intentionally make decisions that reduce utility. Therefore, for each act of participation or consumption, there is a gross benefit (consumer surplus) attached.
Gross benefit is at least equal to consumer’s expenditure. The revealed preference framework can be applied to identify the minimum benefits associated with expenditure. In this case, the $111.92 million households spend on tickets, food and beverages, and other purchases.
Determining the benefits to individuals associated with their engagement involves adding their revealed preferences to the contingent value of their of art spaces consumption. It is found that consumers recognise a well-being surplus of $45.17 million that was directly attributable to having art spaces in Sydney in 2016.
Use value
Transactions occurring in markets are argued to be a social good because the exchange will only occur when both buyer and seller perceive value in the deal. For the vendor, this means making a profit; known as producers’ surplus. Producers’ surplus is estimated in the Commercial Benefits section of this report.
21
Consumer’s surplus is the value above what they pay for a good or service, and assumes that welfare of both parties is improved. Markets for goods and services that do not meet this twin threshold do not occur naturally.
Consumer surplus is an important benefit in calculating the net costs or benefits of an activity, for it allows us to arrive at a use value of a product or service. The use value is the sum of the purchase price and consumer surplus.
Our surveys of gallery and art space attendees reveal that value for attending art spaces and related goods and services consumed in Sydney in 2016 was $111.92 million; therefore users perceive at least this much value in the activity.
Survey respondents were then asked if they would hypothetically be willing to pay (WTP) an additional amount for those benefits not quantified in their purchase, and the value this contribution might be worth over 12 months. WTP is thus a quantification of individual’s satisfaction with their consumption, in this case of art spaces.
There is evidence to suggest some respondents to the art spaces telephone survey misrepresented their WTP. Of the 532 telephone survey respondents, 6 reported a WTP greater than 10 per cent of their annual income. Without controlling for misrepresented preferences, analysis will therefore overestimate the true WTP for consumers of art spaces.
To control for attempts to influence analysis, WTP was capped at 10 per cent of an individual’s reported annual income. WTP should not be confused with an individual’s capacity to pay (as it is a measure of gross satisfaction), capping allowed for WTP to vary while lowering the influence of misrepresented preferences. WTP was capped for 6 responses, or 1.12% per cent of the sample.
Average user WTP is conservatively estimated to be $1089.4, or approximately $21 per week, with a standard error of $182.09. There is a 95 per cent probability that the
22
true mean WTP lies in the interval $907.31 and $1271.49.
As 26 per cent of the population aged 18 years and over are assumed to attended a gallery in 2016 (ABS, 2010a), this reveals a gross consumer surplus of $45.17 million, or 40% of their actual expenditure (not including shadow costs).
The gross value-in-use of art spaces in Sydney, being the sum of market price and consumer surplus, is therefore estimated to be $157.08 million.
Non-use value
To this point, the methods described have exclusively considered the use value for consumers of art spaces. It is recognised, that residents might value the presence of art spaces, even if they do not purchase or otherwise engage with them. This other 74 percentage of Sydney residents are distinguished here as non-users.
The concept of non-use value is commonly used in economics to estimate the benefits of environmental resources, which are difficult to value through markets (Hanemann, 1993).
In this report, non-use value is derived from individuals who do not engage with art spaces, but recognise its benefits to the whole community. Our telephone survey respondents who reported not attending art spaces had an average willingness to pay of $435.84, approximately $8 per week. Across the 18 and above population of Sydney who do not attend art spaces this equates to a non-use value of $51.43 million.
A cautionary note
Expressions of willingness to pay essentially measure satisfaction, and should not be confused with a desire on the part of consumers to pay more. In terms of value, increasing prices would result in a zero sum for current art spaces patrons, as the consumers’ surplus would be converted into producers’ surplus for no net gain.
Even though it is also known that ticket prices of live events are relatively inelastic; anecdotally, at least, non- consumers are highly price sensitive. Therefore, non-users would be alienated by price rises that were not linked to new value, and this would reflect in their adjusted WTP. As it is assumed that the greatest community benefit can be realised by converting non-consumers of art spaces into patrons, deliberating exploiting the presently high levels of the community’s WTP—by either increasing prices or withdrawing subsidies—is likely to be counter-productive.
23
The Value of Art spaces in the City of Sydney, 2016
CostsDirect $111.92 Opportunity $1.37 $113.28
BenefitsCommercialProducers' surplus $50.33 Productivity $8.76 $59.09
CivicEmployment $62.52 Taxation revenue $2.48 $64.99
IndividualPatrons $157.08 Non-users $51.43 $208.51 $332.60
Net benefit $219.32 Benefit : cost ratio 2.94 : 1
The community-wide value of small-to-medium art spaces in the City of Sydney is the sum of the benefits enabled. This study estimates these to be worth $332.60 million in 2016. This figure is significantly greater than previous estimates based on price or economic impact; however, it is likely to be an underestimation given the limitations of the available data and forensic techniques.
On its own, $332.60 million is a fairly meaningless sum. The power of numbers lies in their ability to provide a standardised basis for comparison, and—short of performing the same exercise for every other human activity—a top-line valuation of every human endeavour is impractical, if not impossible.
For that reason this study contrasts the net value of art spaces in Sydney with the cost of inputs. It can be seen that for every dollar invested by the community, just under three dollars are returned.
It is beyond the brief of this project to make recommendations as to how government investment in art spaces in Sydney can be made more efficient. That would require the application of the model to specific programs and policy contingencies. The results reported nevertheless reveal a number of outcomes that should be of particular interest to the community.
24
This analysis has shown that, because the external benefits of art spaces in Sydney exceed the social costs, the outcome is in fact efficient. We conclude that those who invest their time and money in enabling art spaces in Sydney are supporting the common good. Hopefully this report can educate readers to the economically real and significant value of art spaces in Sydney.
Although there are a number of limitations to the findings that would benefit from future research, the opportunity now exists for decision makers in both industry and government to leverage this framework for continual improvement in the marketing and delivery of their services.
25
ReferencesABS (2001). Small Businesses in Australia, 2001. Retrieved from
http://www.abs.gov.au/ausstats/[email protected]/mf/1321.0ABS. (2010b). Australian National Accounts: Input-Output Tables - Electronic
Publication, Final release 2006-07 tables 5209.0.55.001. Canberra: Australian Bureau of Statistics.
ABS. (2012). Australian National Accounts: Input-Output Tables, 2008-09 (Vol. 5209.0.55.001). Canberra: Australian Bureau of Statistics.
ABS. (2014a). Australian National Accounts: National Income, Expenditure and Product, Jun 2014 5206.0. Canberra: Australian Bureau of Statistics.
ABS. (2015a). Attendance at Selected Cultural Venues and Events, Australia, 2013-14 4114.0. Canberra: Australian Bureau of Statistics.
ABS. (2016). 3101.0 Australian Demographic Statistics: TABLE 51. Estimated Resident Population By Single Year Of Age, New South Wales.
ABS. (2016b). Consumer Price Index, Australia 6401.0. Canberra: Australian Bureau of Statistics.
Australia Council. (2010). Artistic Vibrancy. Retrieved from http://www.australiacouncil.gov.au/strategies-and-frameworks/artistic-vibrancy/
Americans for the Arts. (2007). Arts & Economic Prosperity III: The Economic Impact of Nonprofit Arts and Culture Organizations and Their Audiences. Available online.
Bailey, J., & Richardson, L. (2010). Meaningful measurement: a literature review and Australian and British case studies of arts organizations conducting “artistic self-assessment”. Cultural Trends, 19(4), 291-306.
Bakhshi, H., Freeman, A., & Higgs, P. L. (2013). A dynamic mapping of the UK's creative industries. Retreived from http://eprints.qut.edu.au/57251/1/57251.pdf
Belfiore, E. (2002). Art as a means of alleviating social exclusion: Does it really work? A critique of instrumental cultural policies and social impact studies in the UK. International journal of cultural policy, 8(1), 91-106.
Carnwath, J. D., & Brown, A. S. (2014). Understanding the value and impacts of cultural experiences. Manchester, United Kingdom: Arts Council England.
Department of Culture, Media and Sport. (2016). Creative industries economic estimates, January 2016. Retreived from https://www.gov.uk/government/uploads/system/uploads/attachment_data/file/523024/Creative_Industries_Economic_Estimates_January_2016_Updated_201605.pdf.
Duxbury, N., & Campbell, H. (2011). Developing and revitalizing rural communities through Arts and Culture. Small Cities Imprint, 3(1).
DiNoto, M.J. and Merk, L.H., 1993. Small economy estimates of the impact of the arts. Journal of Cultural Economics, 17(2), pp.41-53.
Hanemann, W. M. (1993). Three approaches to defining" existence" or" non-use" value under certainty.
26
Johnson, B. K., Mondello, M. J., & Whitehead, J. C. (2007). The Value of Public Goods Generated by a National Football League Team. Journal of Sport Management, 21(1), 123-136.
Klamer, A. (2004). ‘Social, cultural and economic values of cultural goods’. In Cultural and Public Action, edited by Vijayendra Rao and Michael Walton. Stanford University Press.
Lehman, K. F. (2013). The tricky notion of'value'in the arts. Retrieved from https://theconversation.com/the-tricky-notion-of-value-in-the-arts-20408
Live Music Office. (2015). The Economic & Cultural Value Of Live Music In Australia 2014. Avaliable online.
Marwick, K. P. (1994). The arts: A competitive advantage for California. ERIC Clearinghouse.
McKean, R. N. (1968). The use of shadow prices. Mikić, H. (2012). Measuring the Economic Contribution of Cultural Industries: A
Review and Assessment of Current Methodological Approaches. UNESCO.Muller, P., Cameron, N., Jameson, L., Robertson, K., & Grafton, R. (2013). The
Economic, Social and Cutlural Value of the Salamance Arts Centre 2011-2012: Salamanca Arts Centre.
Mulligan, M., & Smith, P. (2010). Art, governance and the turn to community. Melbourne: Globalism Research Centre, RMIT University.
Office of Best Practice Regulation. (2005). Decision rules in regulatory cost-benefit analysis Best Practice Regulation Canberra: Department of Finance and Deregulation
Ollman, B. (1976). Alienation: Marx's conception of man in a capitalist society: Cambridge University Press.
Radbourne, J., Glow, H., & Johanson, K. (2010). Measuring the intrinsic benefits of arts attendance. Cultural trends, 19(4), 307-324.
Reeves, M. (2002). Measuring the social and economic impact of the arts: a review. Arts council of England.
Snowball, J.D. and Antrobus, G.G., 2002. Valuing The Arts. South African Journal of Economics, 70(8), pp.1297-1319.
Throsby, D. (2001). Economics and culture. Cambridge university press.Wodsak, A., Suczynski, K., & Chapple, K. (2008). Building Arts, Building Community.
Informal Arts Districts and Neighbourhood Change in Oakland, California.
27