value stream mapping adapted to high- mix, low-volume
TRANSCRIPT
Value Stream Mapping adapted to High-Mix, Low-Volume Manufacturing
Environments 2012:120
JUAN MANUEL ARAYA
Master of Science Thesis Stockholm, Sweden 2011
VALUE STREAM MAPPING adapted to HIGH-MIX, LOW-VOLUME Manufacturing
Environments
Juan Manuel Araya
Master of Science Thesis INDEK 2011:x KTH Industrial Engineering and Management
Industrial Management SE-100 44 STOCKHOLM
Examensarbete INDEK 2011:x
{Rapporttitel}
{Namn1}
{Namn2} Godkänt
2011-mån-dag
Examinator
{Namn}
Handledare
{Namn} Uppdragsgivare
{Namn} Kontaktperson
{Namn}
Sammanfattning Nyckelord
Master of Science Thesis INDEK 2011:x
{Title}
{Name1}
{Name2} Approved
2011-month-day Examiner
{Name} Supervisor
{Name} Commissioner
{Name} Contact person
{Name}
Abstract This research work proposes a new methodology for implementing Value Stream Mapping, in processes that feature a High-Mix, Low-Volume product base. The opportunity for adapting the methodology singularly for these types of environments was identified because implementing Value Stream Mapping as proposed in Learning to See features several drawbacks when implemented in High-Mix, Low-Volume. Although Value Stream Mapping has been proven to enhance many types of processes, its advantages are shrunk if they are implemented in High-Mix, Low-Volume processes. High-Mix, Low-Volume processes are types of processes in which a high variety of finished goods are produced in relatively low amounts. The high variety of finished goods causes several complications for the implementation of flow. The difficulties that prevent the flow are the following:
• The variance in the products: With hundreds, or sometimes thousands of possible finished goods, the number of products causes a non-repetitive process.
• The variance in the routings: All of the products that are produced can have completely different process routings, or order of stations it has to visit. This makes the application of production lines quite difficult.
• The variance in the cycle times for each process. Each of the different products can have completely different capacity requirements at a specific machine, which limits the predictability of the process.
This purpose of the thesis is to gather the best practices for controlling and improving High-Mix, Low-Volume processes and merge them with some innovative ideas to create an inclusive Value Stream Mapping methodology which is better fitted with the types of complications in High-Mix, Low-Volume environments. In parallel, the methodology is tested with the company: Boston Scientific, in their Ureteral Stents manufacturing process. The real-life experimentation will allow for the fine-tuning of the methodology, in order to truly create impact in the process.

Dedicatory Although one person, the inspiration, knowledge, and methodology wrote this master thesis was really a team effort with many people aiding directly, or thru inspiration.
Firstly, I would like to thank the staff at the Boston Scientific manufacturing plant. I would like to thank Enrique Saborio who initially contacted me with this great opportunity, and suggested the use of Value Stream Mapping as a possible project to develop. I thank Eric Tagarro, my supervisor for providing guidance, support, friendship, and most of all for the trust and freedom to have full control of the project. I would like to thank Juan Miguel Gomez for assisting me in every initiative, and the rest of the production team: Ernesto Trigueros, Juan Jorge Solano, Karoline Arguello, Nehemias Venegas, Ana Villalobos, Melissa Fernandez, and Kathya Centeno. The Industrial Engineering department consisting of Jean Paul Cerros and Tatiana Alvarado with whom I worked side-by-side. I would like to thank the rest of the US/DC production unit: every single person helped me with a situation at one time or another. I would like to thank Rocio Quiros at HR, for patiently helping me and guiding me through the bureaucratic process with the universities. I would like to thank everybody at Boston Scientific which I consider a great company, with an amazing, talented, and fun workforce.
I would like to thank my IMIM family, including all of my classmates. They were the source of endless inspiration, competition, but most of all, endless fun in and outside the classroom. I consider all of them true lifelong friends with whom I look forward to sharing many more good times. I would also like to thank the IMIM Coordinators for all of their diligent efforts to provide the best experience possible.
I would like to thank Professor Alberto Portioli for his interesting class in Lean Manufacturing, which provided with the initial knowledge base for the project. Also the rest of the professors from IMIM, I used topics from every single class in order to develop my project. Thank you for giving us this great knowledge.
I would like to thank all of the innovative Lean Leaders who have written wonderful books, and have established an easy-to-understand methodology, proven to enhance business processes.
Lastly, I would like to thank the most influential people in my life, my parents. They have unconditionally provided me support in everything I do, including the means to join the IMIM program, the best experience of my life. Every decision I take is based on their love and guidance. I also thank the rest of my family, especially my grandparents. Much love and blessings!
Table of Contents Value Stream Mapping adapted to High-‐Mix, Low-‐Volume Manufacturing Environments .......... 1
1 Introduction ............................................................................................................................. 8
1.1 Problem Definition ........................................................................................................... 8
1.2 Purpose ........................................................................................................................... 10
1.3 Delimitations .................................................................................................................. 11
1.4 Target Group: ................................................................................................................. 12
1.5 Introduction to the Company and Research Setting ...................................................... 13
1.5.1 Company History: .................................................................................................... 13
1.6 Product Description ........................................................................................................ 15
1.7 Process Description ........................................................................................................ 16
1.8 Boston Scientific Ureteral Stents Portfolio ..................................................................... 17
1.8.1 Families .................................................................................................................... 18
1.8.2 Processes -‐ Subassembly: ........................................................................................ 19
2 Development of Project at the Boston Scientific Ureteral Stents Line .................................. 22
2.1 Familiarization and Fact Finding Phase (3F Phase): ........................................................ 23
2.2 Polaris Pilot Phase ........................................................................................................... 23
2.3 Whole Line VSM Phase ................................................................................................... 24
2.4 Control and Documentation Phase: ............................................................................... 25
2.5 Final Project Plan: ........................................................................................................... 25
3 Definitions ............................................................................................................................. 26
4 Methodology ......................................................................................................................... 28
4.1 Scientific Research Paradigm .......................................................................................... 28
4.1.1 Design:..................................................................................................................... 31
4.1.2 Prepare: ................................................................................................................... 31
4.1.3 Collect: ..................................................................................................................... 31
4.1.4 Analyze: ................................................................................................................... 32
4.1.5 Sharing: .................................................................................................................... 32
4.2 Research Approach ......................................................................................................... 32
4.3 Research Method ........................................................................................................... 33
4.4 Sources of Information ................................................................................................... 33
4.5 Analysis of Findings ......................................................................................................... 34
4.6 Quality of Research ......................................................................................................... 34
4.7 Frame of Reference ........................................................................................................ 36
4.8 Literature Review ............................................................................................................ 38
4.8.1 The Toyota Way ....................................................................................................... 38
4.8.2 The Toyota Way Fieldbook ...................................................................................... 40
4.8.3 Learning to See ........................................................................................................ 43
4.8.4 Creating Mixed Model Value Streams ..................................................................... 45
4.8.5 Made-‐to-‐Order Lean ................................................................................................ 48
4.8.6 Quick Response Manufacturing ............................................................................... 51
4.8.7 Value Network Mapping .......................................................................................... 53
4.8.8 The Application of Lean Manufacturing Principles in a High-‐Mix, Low-‐Volume Environment ........................................................................................................................ 56
5 Method .................................................................................................................................. 58
5.1 Adaptations from Different Sources ............................................................................... 58
5.1.1 Adaptions from Learning to See .............................................................................. 58
5.1.2 Adaptations proposed by Creating Mixed Model Value Streams by Jim Duggan ... 63
5.1.3 Adaptations of VSM from Made to Order Lean by Greg Lane ................................. 67
5.1.4 Adaptations from Quick Response Manufacturing .................................................. 68
5.1.5 Adaptations from The Toyota Way Fieldbook ......................................................... 70
5.1.6 Adaptations from Boston Scientific Line of Expertise .............................................. 72
5.1.7 Innovative Adaptations Arisen from Experimentation: ........................................... 72
5.1.8 Adaptations from of Value Network Mapping ........................................................ 77
6 Method and Implementation at Boston Scientific ................................................................ 79
6.1 Analyzing the Mix for Opportunities: ............................................................................. 79
6.2 1st Step: Creating Full Current State Value Stream Map: ................................................ 80
6.3 2nd Step: Obtaining the Future State Value Stream Map: .............................................. 82
6.4 4th Step: If the family distribution is stable, complete VSM on separate families .......... 90
6.5 5th Step: Form Implementation Plan .............................................................................. 91
7 Results ................................................................................................................................... 92
7.1 Value to Company: ......................................................................................................... 92
7.2 Value to Academic Knowledge ....................................................................................... 93
8 Further Research ................................................................................................................... 94
8.1 Testing the Methodology in other Manufacturing Facilities .......................................... 94
8.2 Expanding the Value Stream Map .................................................................................. 95
8.3 Testing in Less Manual Processes ................................................................................... 95
9 Bibliography ........................................................................................................................... 96
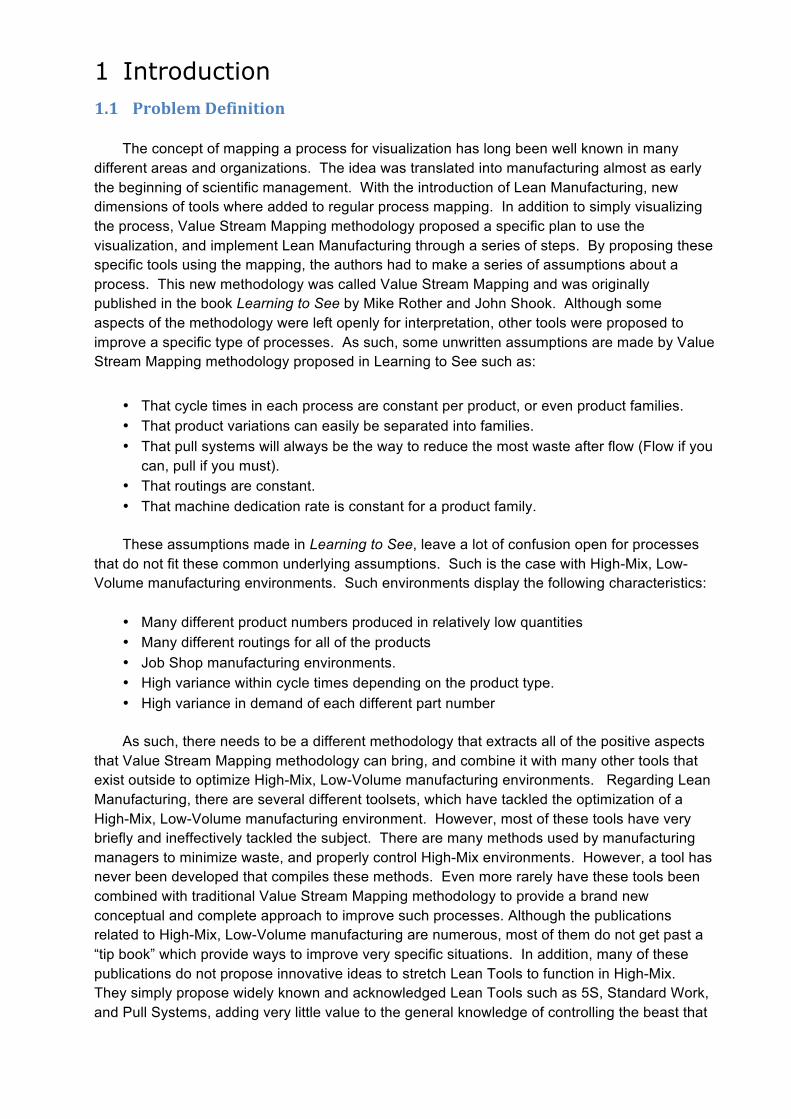
1 Introduction 1.1 Problem Definition
The concept of mapping a process for visualization has long been well known in many different areas and organizations. The idea was translated into manufacturing almost as early the beginning of scientific management. With the introduction of Lean Manufacturing, new dimensions of tools where added to regular process mapping. In addition to simply visualizing the process, Value Stream Mapping methodology proposed a specific plan to use the visualization, and implement Lean Manufacturing through a series of steps. By proposing these specific tools using the mapping, the authors had to make a series of assumptions about a process. This new methodology was called Value Stream Mapping and was originally published in the book Learning to See by Mike Rother and John Shook. Although some aspects of the methodology were left openly for interpretation, other tools were proposed to improve a specific type of processes. As such, some unwritten assumptions are made by Value Stream Mapping methodology proposed in Learning to See such as:
• That cycle times in each process are constant per product, or even product families. • That product variations can easily be separated into families. • That pull systems will always be the way to reduce the most waste after flow (Flow if you
can, pull if you must). • That routings are constant. • That machine dedication rate is constant for a product family.
These assumptions made in Learning to See, leave a lot of confusion open for processes that do not fit these common underlying assumptions. Such is the case with High-Mix, Low-Volume manufacturing environments. Such environments display the following characteristics:
• Many different product numbers produced in relatively low quantities • Many different routings for all of the products • Job Shop manufacturing environments. • High variance within cycle times depending on the product type. • High variance in demand of each different part number
As such, there needs to be a different methodology that extracts all of the positive aspects that Value Stream Mapping methodology can bring, and combine it with many other tools that exist outside to optimize High-Mix, Low-Volume manufacturing environments. Regarding Lean Manufacturing, there are several different toolsets, which have tackled the optimization of a High-Mix, Low-Volume manufacturing environment. However, most of these tools have very briefly and ineffectively tackled the subject. There are many methods used by manufacturing managers to minimize waste, and properly control High-Mix environments. However, a tool has never been developed that compiles these methods. Even more rarely have these tools been combined with traditional Value Stream Mapping methodology to provide a brand new conceptual and complete approach to improve such processes. Although the publications related to High-Mix, Low-Volume manufacturing are numerous, most of them do not get past a “tip book” which provide ways to improve very specific situations. In addition, many of these publications do not propose innovative ideas to stretch Lean Tools to function in High-Mix. They simply propose widely known and acknowledged Lean Tools such as 5S, Standard Work, and Pull Systems, adding very little value to the general knowledge of controlling the beast that
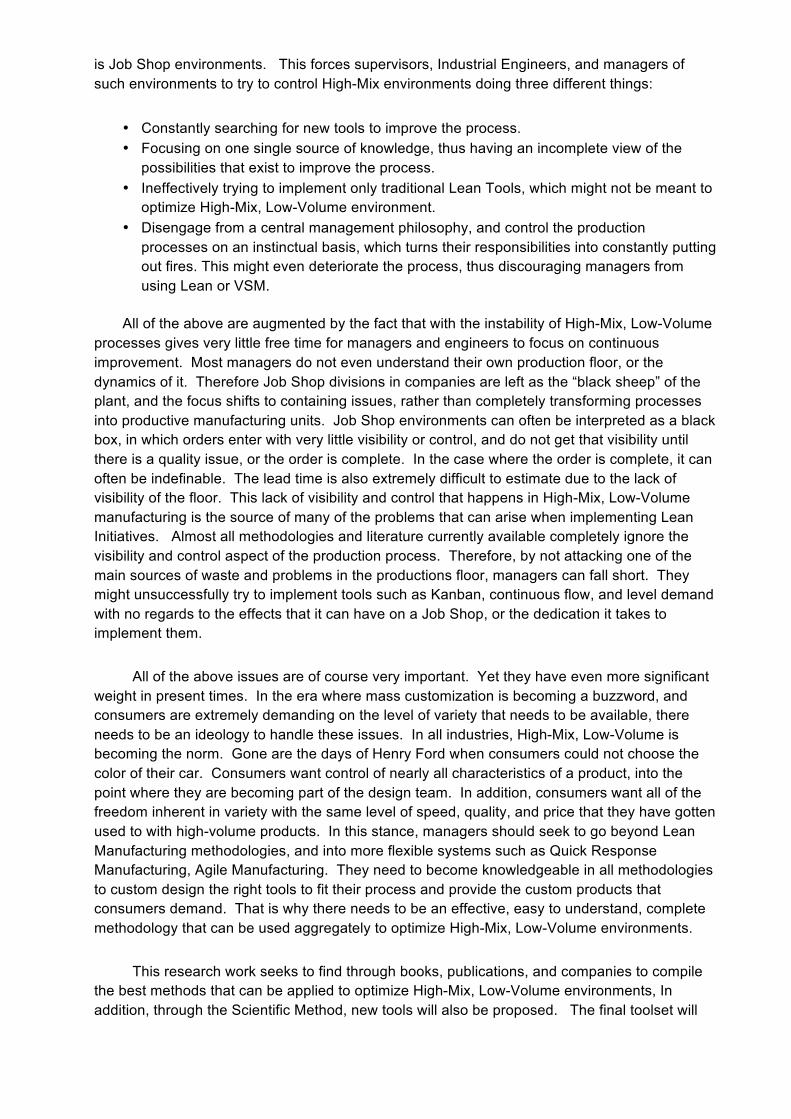
is Job Shop environments. This forces supervisors, Industrial Engineers, and managers of such environments to try to control High-Mix environments doing three different things:
• Constantly searching for new tools to improve the process. • Focusing on one single source of knowledge, thus having an incomplete view of the
possibilities that exist to improve the process. • Ineffectively trying to implement only traditional Lean Tools, which might not be meant to
optimize High-Mix, Low-Volume environment. • Disengage from a central management philosophy, and control the production
processes on an instinctual basis, which turns their responsibilities into constantly putting out fires. This might even deteriorate the process, thus discouraging managers from using Lean or VSM.
All of the above are augmented by the fact that with the instability of High-Mix, Low-Volume processes gives very little free time for managers and engineers to focus on continuous improvement. Most managers do not even understand their own production floor, or the dynamics of it. Therefore Job Shop divisions in companies are left as the “black sheep” of the plant, and the focus shifts to containing issues, rather than completely transforming processes into productive manufacturing units. Job Shop environments can often be interpreted as a black box, in which orders enter with very little visibility or control, and do not get that visibility until there is a quality issue, or the order is complete. In the case where the order is complete, it can often be indefinable. The lead time is also extremely difficult to estimate due to the lack of visibility of the floor. This lack of visibility and control that happens in High-Mix, Low-Volume manufacturing is the source of many of the problems that can arise when implementing Lean Initiatives. Almost all methodologies and literature currently available completely ignore the visibility and control aspect of the production process. Therefore, by not attacking one of the main sources of waste and problems in the productions floor, managers can fall short. They might unsuccessfully try to implement tools such as Kanban, continuous flow, and level demand with no regards to the effects that it can have on a Job Shop, or the dedication it takes to implement them.
All of the above issues are of course very important. Yet they have even more significant weight in present times. In the era where mass customization is becoming a buzzword, and consumers are extremely demanding on the level of variety that needs to be available, there needs to be an ideology to handle these issues. In all industries, High-Mix, Low-Volume is becoming the norm. Gone are the days of Henry Ford when consumers could not choose the color of their car. Consumers want control of nearly all characteristics of a product, into the point where they are becoming part of the design team. In addition, consumers want all of the freedom inherent in variety with the same level of speed, quality, and price that they have gotten used to with high-volume products. In this stance, managers should seek to go beyond Lean Manufacturing methodologies, and into more flexible systems such as Quick Response Manufacturing, Agile Manufacturing. They need to become knowledgeable in all methodologies to custom design the right tools to fit their process and provide the custom products that consumers demand. That is why there needs to be an effective, easy to understand, complete methodology that can be used aggregately to optimize High-Mix, Low-Volume environments.
This research work seeks to find through books, publications, and companies to compile the best methods that can be applied to optimize High-Mix, Low-Volume environments, In addition, through the Scientific Method, new tools will also be proposed. The final toolset will
then be compiled into an easy to use “mapping” tool similar to Value Stream Mapping to continuously improve processes. This tool can provide managers in one document with the state-of-the art toolset to tackle High-Mix, Low-Volume issues.
1.2 Purpose
The research work is focused on compiling all of the best ideas and research currently available for the control of a High-Mix, Low-Volume manufacturing environment. It obtains the best characteristics of many different sources, and creates a merger with Value Stream Mapping. As defined in the problem, Value Stream Mapping might discourage many inexperienced managers when they face situations not covered regular Value Stream Mapping approaches. Regarding High-Mix, Low-Volume production, there exist many different tools and methodologies to improve on such processes, yet there are few and far between. There is not a single piece of literature that encompasses a solution and tips for most problems in a High-Mix, Low-Volume manufacturing environment. In addition, most toolsets proposed are contradictory to each other, not thorough enough, or provide too much academic detail to be understood easily by today´s top managers. Therefore, a new methodology must be created to better the control of High-Mix, Low-Volume manufacturing. By aggregating all of the knowledge on the subject, and converting it into an implementation tool such as Value Stream Mapping, managers can have a complete and open solution to many of their problems. It will share many of the characteristics of Value Stream Mapping, yet it will eliminate many of the flaws that it creates in High-Mix atmospheres. Although it is technically impossible to create an easy-to-use tool that emphasizes on every single possible issue faced in a High-Mix, Low-Volume manufacturing environment, there can be advances into a tool which encompasses at least most of the major dilemmas. The tool will aim to optimally minimize waste, however it will also include toolsets outside of the Lean Manufacturing realm. Tools such as POLCA cards from Quick Response Management philosophies, Just-in-Time, and experimental new tools will be incorporated into the Value Stream Mapping methodology. Like Value Stream Mapping, it will focus on creating a current state of the process which best encapsulates the High-Mix, Low-Volume manufacturing floor, and having a series of implementation steps in order to best organize the minimization of waste.
Such a tool is highly important for the current, and coming years. Due to the increasing choosiness of consumers, High-mix, Low-Volume manufacturing is slowly becoming the prevalent standard in many manufacturing environments. Consumers constantly want to have a greater variety of possible products at the same quality and price as before. Therefore, there must be an easy to use methodology to aggressively reduce waste in order to meet these targets set by the costumer. Like many other Lean Manufacturing tools, it must be easy-to-use and easy to understand. It must come as a “solutions” manual package that both provides an easy way to balance and anticipate improvement initiatives, while still providing enough academic value to better processes.
The methodology proposed in this research work will seek to accomplish all of those goals. It will create value by eliminating waste that is prevalent in High-Mix, Low-Volume manufacturing. At the same time, the thesis will be conducted in parallel with an internship with medical devices manufacturer, Boston Scientific. Most proposed ideas will be thoroughly tested in a real production floor. The tools that have can still add value will be added to the Value Stream Mapping methodology, while some tools will not make the cut to better reduce waste. By doing this, the current knowledge base on the implementation of Lean Manufacturing for
High-Mix, Low-Volume manufacturing environments will be augmented. Managers can turn into a single source for the beginning of improving a High-mix, Low-Volume process, similarly in the way that they use Learning to See to implement Lean manufacturing.
1.3 Delimitations
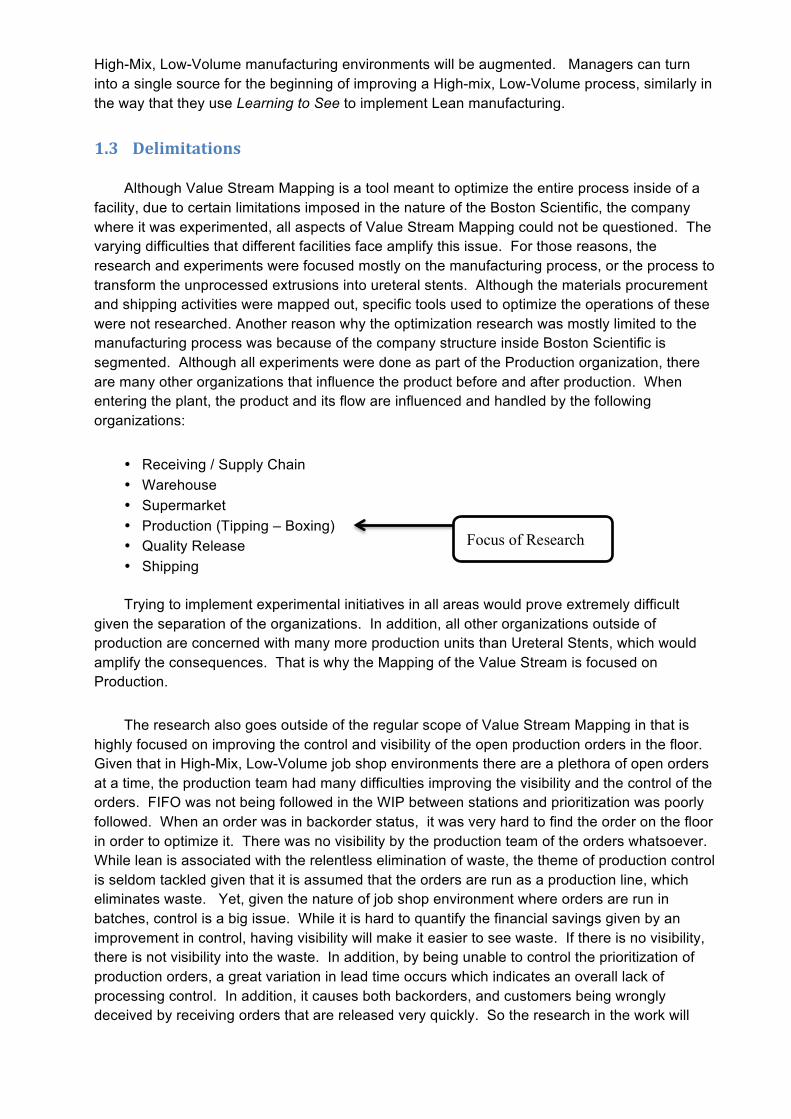
Although Value Stream Mapping is a tool meant to optimize the entire process inside of a facility, due to certain limitations imposed in the nature of the Boston Scientific, the company where it was experimented, all aspects of Value Stream Mapping could not be questioned. The varying difficulties that different facilities face amplify this issue. For those reasons, the research and experiments were focused mostly on the manufacturing process, or the process to transform the unprocessed extrusions into ureteral stents. Although the materials procurement and shipping activities were mapped out, specific tools used to optimize the operations of these were not researched. Another reason why the optimization research was mostly limited to the manufacturing process was because of the company structure inside Boston Scientific is segmented. Although all experiments were done as part of the Production organization, there are many other organizations that influence the product before and after production. When entering the plant, the product and its flow are influenced and handled by the following organizations:
• Receiving / Supply Chain • Warehouse • Supermarket • Production (Tipping – Boxing) • Quality Release • Shipping
Trying to implement experimental initiatives in all areas would prove extremely difficult given the separation of the organizations. In addition, all other organizations outside of production are concerned with many more production units than Ureteral Stents, which would amplify the consequences. That is why the Mapping of the Value Stream is focused on Production.
The research also goes outside of the regular scope of Value Stream Mapping in that is highly focused on improving the control and visibility of the open production orders in the floor. Given that in High-Mix, Low-Volume job shop environments there are a plethora of open orders at a time, the production team had many difficulties improving the visibility and the control of the orders. FIFO was not being followed in the WIP between stations and prioritization was poorly followed. When an order was in backorder status, it was very hard to find the order on the floor in order to optimize it. There was no visibility by the production team of the orders whatsoever. While lean is associated with the relentless elimination of waste, the theme of production control is seldom tackled given that it is assumed that the orders are run as a production line, which eliminates waste. Yet, given the nature of job shop environment where orders are run in batches, control is a big issue. While it is hard to quantify the financial savings given by an improvement in control, having visibility will make it easier to see waste. If there is no visibility, there is not visibility into the waste. In addition, by being unable to control the prioritization of production orders, a great variation in lead time occurs which indicates an overall lack of processing control. In addition, it causes both backorders, and customers being wrongly deceived by receiving orders that are released very quickly. So the research in the work will
Focus of Research
seek to explore production control methodologies both covered in Lean ideals, and outside of Lean. In addition, several innovative themes are explored such as the use of Electronic Work Order Boards, and Prioritization Unit Numbers.
Several Lean and Value Stream elements were left out of the research. In particular, the concept of Pitch, or releasing work into the production floor at a constant pace is ignored for several reasons. Due to the high variance in lot sizes, releasing work into the production floor at a constant pace would create disorder instead of order. In addition, due to the high variance in the routings of the products, and in variety of cycle times depending on each product number on the family, the pitch would have to vary highly to be optimal. Although using pitch to control the production floor might be possible, it requires its own specific research goals.
The focus of the research also leaves out much of the material, or component process mapping. This is simply due to the fact that the manufacturing process of Ureteral Stents is mostly a transformation process, so it does not use many components in its final product. The components used are also fairly standard and aggregate throughout all of the product types, which mean that they do not face the same challenges as the extrusions, which are transformed with a high-mix, low-volume production environment. The only major subassembly that is slightly processed before it goes into the positioner, or the tube used to facilitate the placement of the ureteral stent into the urethra. Even being the only major subassembly, it only goes through one process that is crimping. This means there is not too much to delve into in terms of content.
In terms of delimitations, the only other one is that the research is solely focused on the Boston Scientific Ureteral Stents line. This means that the experimenting has been made in a very specific system, and thusly it will probably not cover every single issue that could be encountered in a High-Mix, High-Volume manufacturing environment. The solutions proposed have been those, which optimize the Ureteral Stents process. This also means that the solutions are meant for mostly manual processes. The manufacturing process for Ureteral Stents is mostly manual, except for the oven forming process. If a process was highly more dependent on machines, a different kind of tool might be needed.
1.4 Target Group:
The research is intended to bring value to two distinct groups of people. Firstly, it is meant as a to enhance the knowledge available on how to optimize and control High-Mix, Low-Volume manufacturing environments. Thusly, any production manager or Industrial Engineer working in an industry that exhibits high-mix, low-volume can find value from the research proposed in this study. Secondly, it is meant to add value to Lean Experts and Enthusiasts worldwide. Whereas they might have been limited by the amount of research and work available for High-Mix, Low-Volume manufacturing environments, this research opens the door to many difficult questions and available tools. Using this research as a base, they can continue into more specific research concerning a specific topic, Lean Tool, or the combination of these. In addition, it is meant for Lean enthusiasts to broaden their horizons in terms of the available Lean Tools. Although this study does not question the ultimate Lean Philosophy and goal that is the relentless elimination of waste, yet it does question some of the tools that are used in Lean Manufacturing. In high-mix, low-volume manufacturing environments, such tools might not be the ultimate and perfect way in order to reduce the most waste. For example, pull
systems used in high-mix environments create an unnecessary amount of WIP. Other tools such as POLCA cards could be the tools that minimize the waste in the production process.
1.5 Introduction to the Company and Research Setting
The study and was completed in parallel with an internship at medical devices manufacturing company: Boston Scientific. The study was done at one of their manufacturing plants conducted in El Coyol in Costa Rica. The production line will be the Urethral Stents manufacturing environment.
Company Description: The Boston Scientific Corporation (NYSE: BSX) (abbreviated BSC), is a worldwide developer, manufacturer and marketer of medical devices whose products are used in a range of interventional medical specialties, including interventional cardiology, peripheral interventions, neuromodulation, neurovascular intervention, electrophysiology, cardiac surgery, vascular surgery, endoscopy, oncology, urology and gynecology. (Boston Scientific Wikipedia)
1.5.1 Company History:
The company history as described in the International Directory of Company Histories, Vol. 37 is the following:
Boston Scientific Corporation was founded in 1979 by John Abele and Peter Nicholas. In 1968 Abele met Itzak Bentov, inventor of a steerable catheter that was used in less invasive surgical procedures. With financial backing from Cooper Laboratories, Abele began marketing the device through Medi-Tech, Inc., a company in which Abele had acquired an equity interest. In 1969 Medi-Tech introduced its first products, a family of steerable catheters that were used in some of the first less invasive procedures.
By the time Abele and Nicholas met, Cooper Laboratories wanted to sell the medical device company. Abele and Nicholas founded Boston Scientific Corporation for the purpose of acquiring Medi-Tech, Inc. The two men received $500,000 in bank financing and raised another $300,000.
In its first year Boston Scientific reported revenues of about $2 million. Its first products included catheters for gall bladder surgery. The early 1980s marked a period of active marketing, new product development, and organizational growth. The company focused on catheters and other products that could be used as alternatives to traditional surgery. As medical imaging techniques improved, less invasive procedures became more feasible. The catheters allowed doctors to perform surgical procedures through little incisions. Such procedures were also much less expensive. The company soon expanded its line of catheter-based devices to include heart, vascular, respiratory, gastrointestinal, and urological applications.
Capital Needs Affect Growing Private Company: 1980s
By 1983 sales were $16 million. To meet the company's voracious working capital needs, Abele and Nicholas sold a 20-percent interest in Boston Scientific to Abbott Laboratories in return for $21 million, which Abbott would pay over the next four years.
After learning how to shorten the approval time from the FDA, Boston Scientific again became profitable, earning $23.5 million on sales of $159 million.
Going Public and Acquisitions: 1992--2000
Boston Scientific went public in May 1992 with an initial public offering (IPO) of 23.5 million shares priced at $17 a share that raised $400 million in capital. Following the IPO, co-founders Nicholas and Abele and their families owned two-thirds of the firm's stock. Abbott Laboratories sold its shares back to Boston Scientific at the time of the IPO.
The company had four operating divisions: Medi-Tech, which specialized in radiology; Mansfield, for cardiology; Microvasive Endoscopy for gastroenterology; and Microvasive Urology. Boston Scientific would typically introduce a device for use in less critical places, such as the urinary tract, then apply it to higher-risk situations, such as those in cardiology. This helped speed up development of new products. The company posted 40 percent revenue growth for the first half of 1992.
In the latter half of the 1990s, trends supporting demand for medical devices included political pressures to develop new cost-effective technology; demand for fast, effective, and safe procedures; and a broad international market. The FDA responded to pressure reduce its review time for certain types of new devices to 90 to 120 days instead of 18 months or more. Boston Scientific's main business, products for interventional cardiology, served a $3-billion global market that was expected to grow at least 15 percent annually.
Growth and Setbacks: 1997--2000
Boston Scientific continued to grow through acquisitions in 1997. By mid-1997 Boston Scientific's rapid growth rate was expected to level off at about 25 percent annually. The company announced it would spend $300 million to upgrade five manufacturing facilities.
In mid-1998 Boston Scientific announced it would spend $2.1 billion to acquire Schneider Worldwide, the vascular devices unit of Pfizer, Inc. Schneider sold surgical stents and artery-clearing devices used in balloon angioplasty. The acquisition was Boston Scientific's largest to date and gave the company a major position in the growing cardiovascular stent market.
Tobin was named CEO of Boston Scientific in March 1999 and assumed the position in June, replacing Peter Nicholas, who remained as chairman. Tobin's assignment essentially was to turn the company around. Over the next 14 months he would eliminate 1,900 jobs and close manufacturing operations in three states. To help finance its acquisition of Schneider Worldwide, Boston Scientific raised $500 million through a secondary stock offering in mid-1999.
Following its five-year string of acquisitions, Boston Scientific was organized into six divisions. EP Technologies specialized in cardiac electrophysiology. Medi-Tech was a leading developer and supplier of minimally invasive and surgical devices for peripheral vascular disease management, including balloon catheters and metallic stents. Microvasive Urology manufactured diagnostic and therapeutic products for endourology
for stone management, incontinence, and prostate disease. Microvasive Endoscopy focused on providing devices and services for gastrointestinal endoscopic procedures. Boston Scientific Scimed Inc. was the company's primary cardiology unit. Target Therapeutics was a leader in neuro endovascular intervention, manufacturing medical devices to treat the brain and other hard-to-reach parts of the body in a minimally invasive manner.
In 2000, Tobin created a new business unit focused solely on heart stents and stent-delivery systems. These had been manufactured by the company's Minneapolis-based Scimed division, which would continue to provide cardiologists with products such as balloon catheters, guide wires, and guide catheters. In addition, Tobin announced he would be naming a chief technology officer to the newly created position.
In March 2000 Boston Scientific received FDA approval to resume marketing its NIR on Ranger with Sox coronary stents, after solving the leakage problems.
In July 2000 Boston Scientific continued its reorganization, cutting 1,000 positions in Minnesota, Washington, and Massachusetts, while adding 100 employees to its Miami operation and 800 jobs to company plants in Ireland. In Miami, some 300 jobs involving the production of biopsy forceps would be transferred to a lower-cost foreign contract manufacturer, while 400 positions for workers making guidewires were added. About 850 workers were dismissed from the company's Watertown, Massachusetts, plant. Facilities in Plymouth, Minnesota, which employed about 750 workers, and Redmond, Washington, with about 350 employees, were to be closed. One of the Watertown sites became the headquarters to the company's Medi-Tech division, which developed vascular surgery and radiology products. The reorganization was expected to save about $70 million in 2001 and $145 million in 2002.
The year 2000 and those leading up to it were difficult for Boston Scientific. Product recalls and new competitors led to the loss of the company's market-leading position in its key product line, coronary stents and stent systems. Difficulties with its primary supplier of stents added to the company's woes. Its stock fell out of favor with Wall Street, resulting in a significant reduction in the firm's market capitalization. As investors wait for Boston Scientific to return to its leadership position, the company faces multiple challenges.
The products manufactured in the “Coyol” plant of Boston Scientific mostly consist of several different categories:Cardiology Products, Urology Products, Endoscopy Products, and Forceps. Most of the manufacturing processes were transferred into the plant from another Boston Scientific plant located in Spencer, Indiana. The manufacturing process which will provide the setting for the research and experimenting is the Urethral Stents manufacturing process, which is part of the Urology division of products (International Directory of Company Histories).
1.6 Product Description
A ureteral stent, sometimes as well called ureteric stent, is a thin tube inserted into the ureter to prevent or treat obstruction of the urine flow from the kidney. The length of the stents used in adult patients varies between 24 to 30 cm. Additionally, stents come in differing diameters or gauges, to fit different size ureters. The stent is usually inserted
with the aid of a cystoscope. One or both ends of the stent may be coiled to prevent it from moving out of place, this is called a JJ stent, double J stent or pigtail stent (Ureteral Stent Wikipedia).
The ureteral stents is one of many products produced in the Coyol Plant. It has a relatively high value and is primarily composed of plastic composites.
1.7 Process Description
The ureteral stents manufacturing environment Job Shop manufacturing environment, in which batches of product move inconsistently through a number of processing stations. There are approximately 280 finished good product numbers that have a high variety of routings in order to get manufactured. The high variety in the ureteral stents come from four different characteristics.
1. The material used: Although all material used is made from a plastic composite material, the softness of the material varies. The softest of which is the White Percuflex material which provides minimum disruption inside the patient’s body.
2. The length of the stent: Depending on the patient’s body, the length necessary for effective use of the ureteral stent can vary. Usually the Ureteral Stents can vary from 20 to 30 centimeters, although the most common size is 26 cm by far. In addition there are some stents which are made to be “Variable Length”, which feature a retractable pigtail that can be extended or retracted to accommodate several different sizes. Although Variable Length Stents prove to be very useful from a manufacturing standpoint, most doctors avoid using them because they are not as comfortable inside the patients’ body. The real length of the finished good is determined at the Cut-to-Length stage of the manufacturing process, where an unprocessed extrusion gets cut into the exact length necessary.
3. The diameter of the stents, measured in French: The diameter of the stent varies from 5 French to 8 French, also depending on the severity of the medical problem, and the patients’ body. Most stents manufactured in the Boston Scientific Manufacturing plant are 6 French. The diameter of the extrusion is determined right at the beginning of the process, the stents already are input into the manufacturing plant in their actual size when they come into the Coyol Plant.
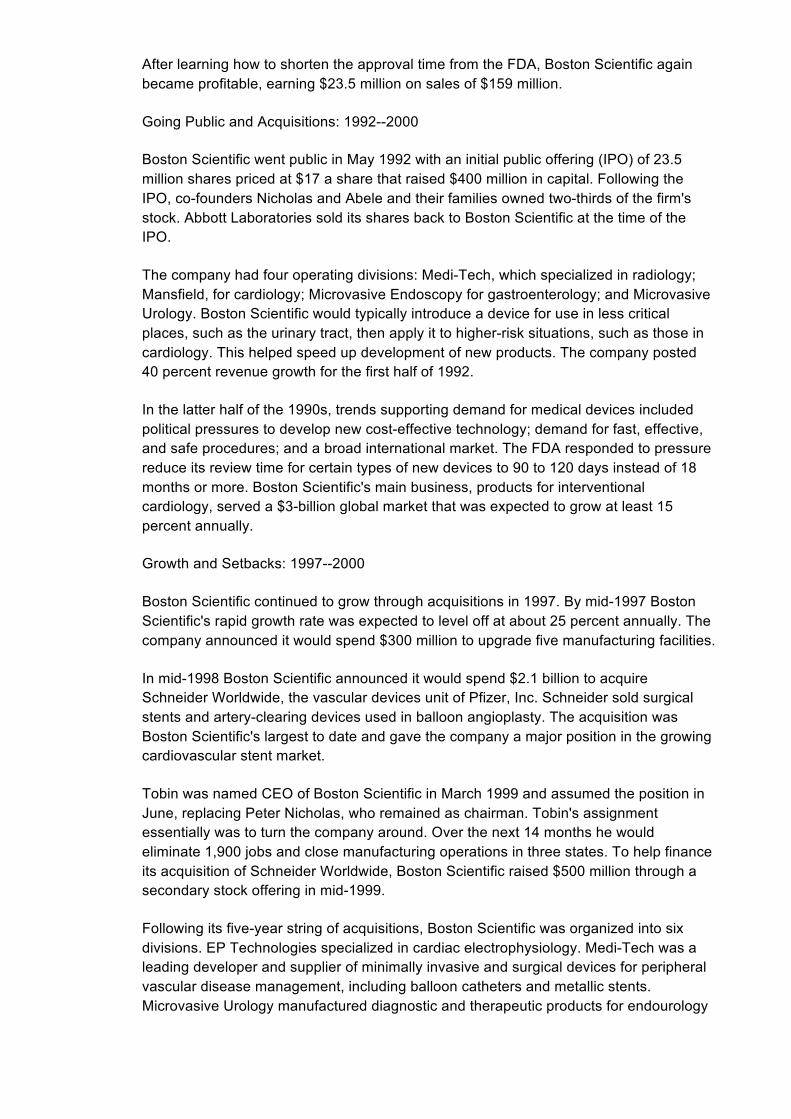
4. Processing Differences: Several other differences in the manufacturing process provide for an added mix in the process. For example, the size of the “pig tail” or the curl at the
end of the extrusions meant to keep the stent in place. Another difference which arises in one of the families of products is the replacement of the pigtail with a double set of loops made from soft percuflex material. This family of products, called Polaris Loop, is the most advanced, comfortable, and expensive type of ureteral stent available on the market.
Figure 1-‐1 Polaris Loop Stent
1.8 Boston Scientific Ureteral Stents Portfolio
Most of the Ureteral Stents are manufactured from a patented material called Percuflex. It consists of a proprietary copolymer designed specifically for the use in ureteral stents. The material is available in a variety of durometers. There exist the soft, firm and the dual durometer, which works with an innovative system that is made up of a mixture of soft and firm material, blended together gradually. The percuflex material also offers improved biocompability compared to other stents made up of modified polyurethane (Ureteral Stents Portfolio). Additionally, the percuflex material allows for several characteristics such as:
• Designed to soften at body temperature and become compliant to the contoured anatomy of the ureter.
• Reduces risk of migration due to high coil retention strength. • Proposes improved drainage with a thin wall design and larger stent diameter and multi
side drainage holes. • Offers proven biocompatibility for an indwelling time of up to 365 days. • Provides excellent material strength and smooth stent surface facilitates scope insertion
and advancement up the ureter (Ureteral Stents Portfolio).
The stent is covered by a special proprietary HydroPlus Coating. The coating surrounds the stent in order to create resistance to encrustation inside the patients’ body. The coating is applied through the “coating” station within the process and utilizes a 2-step chemical bonding application in order to provide a thick, consistent, lubricious coating (Ureteral Stents Portfolio). When the hydroplus coating seals the Percuflex Stent material, the stent becomes lubricious, creating water saturated surface for facilitating advancement up the ureter (Ureteral Stents Portfolio). The main product families that are sold are the following:
• Polaris Loop Ureteral Stent: the Polaris Loop is one of the most innovative ureteral stents in that not only it features a deal durometer made of soft percuflex material but it uses 2 unique bladder loops to keep the stent inside the patients body instead of the usual pigtail attachment. This makes it optimal because it contains 69% less material inside the patients bladder compared to a regular stent, yet the procedure to place it inside the patients body is almost the same (Ureteral Stents Portfolio).
• Polaris Ultra Ureteral Stent: It is very similar to the Polaris Loop stent yet it features a traditional double pigtail system as opposed to the soft percuflex loops. The extrusion system is what allows the dual durometer stent to be possible. It also features a relaxed renal coil designed for ease of removal. Both the Polaris Ultra, and the Polaris Loop can be inside the patients’ body for up to 365 days (Ureteral Stents Portfolio).
• Percuflex Plus Ureteral Stent: This is the most widely sold ureteral stent that is designed for long term placement inside the patient’s body. It features a firm percuflex material designed to help maintain the pigtail shape and prevent stent migration. It also features a tapered tip for ease of access through the ureteral orifice (Ureteral Stents Portfolio).
• Percuflex Ureteral Stent: Similar to the Percuflex Plus stent, yet is made of soft percuflex material and designed to be the most easily placed ureteral stent. Like the
rest of the stents, it also features a bladder marker used to confirm the placement of the stent (Ureteral Stents Portfolio).
• Contour Ureteral Stent: The contour stent is a especially made stent made of a material that becomes soft at body temperature, which promotes patient tolerance in an indwelling system. It also features a relaxed renal coil designed for ease of removal. The contour also has a special designed allowing the stent to be Variable Length, and adaptable to the patients body without different product codes (Ureteral Stents Portfolio).
• Contour Injection Ureteral Stent: It is very similar to the Contour Injection Stent, yet it is made especially as a package which features an injection positioner and release sleeve in order to facilitate the ability to inject contrast through the stent´s renal coil (Ureteral Stents Portfolio).
• Stretch Flexima Ureteral Stent: it is similar to the Contour variable length, yet it features many more graduation marks making easier to change the length of the stent. It is also makes it easier to manufacture since it will be easier to facility varying ureteral stents with fewer product codes (Ureteral Stents Portfolio).
• Retromax Plus Endopyelotomy Stent: This stent features a dual diameter stent on both ends in order to facilitate the healing post procedure of the ureteral stent. It transition slowly from 14 to 7 French taper at the bladder coil (Ureteral Stents Portfolio).
All of the stents make up the different production families involved in the manufacturing process. The great diversity in the materials, length, diameter, and style create the source of the mix in products. This mix creates the difficulties in the manufacturing process. Although it makes it quite difficult to manufacture, it also provides for ample opportunity to improve the process through Value Stream Mapping adapted to High-Mix, Low-Volume manufacturing.
The main component of the ureteral stent, which is the extrusion, is brought-in from the Boston Scientific Production Factory in Spencer, Indiana. With a lead-time of approximately 1 month, the materials are quite difficult to plan, especially given the surges in demand and the large amount of lead-time in the process going back to the United States for sterilization. All of the extrusions get shipped by sea from the Limon port in the Caribbean coast of Costa Rica. They are shipped from Miami, where they come in by land all of the way from Indiana. The material and stock replenishment is done using an MRP system to forecast the demand and plan for materials in advance. A pull system is currently being implemented in order to have better control of the material replenishment system. Depending on the product family, there are 16 different stations that the extrusions pass through, separated into subassemblies and top assembly.
1.8.1 Families
There are 13 main product families which are produced in the Boston Scientific Ureteral Stents manufacturing environment. Although the process routings inside the product families can vary, most products inside of a family generally have the same routing for their products. The main product families that exhibit about 92% of the total production capacity are shown in the following graph. In addition the process routing for each production family is mapped out, details all of the different stations that the product must go through before it is completed.
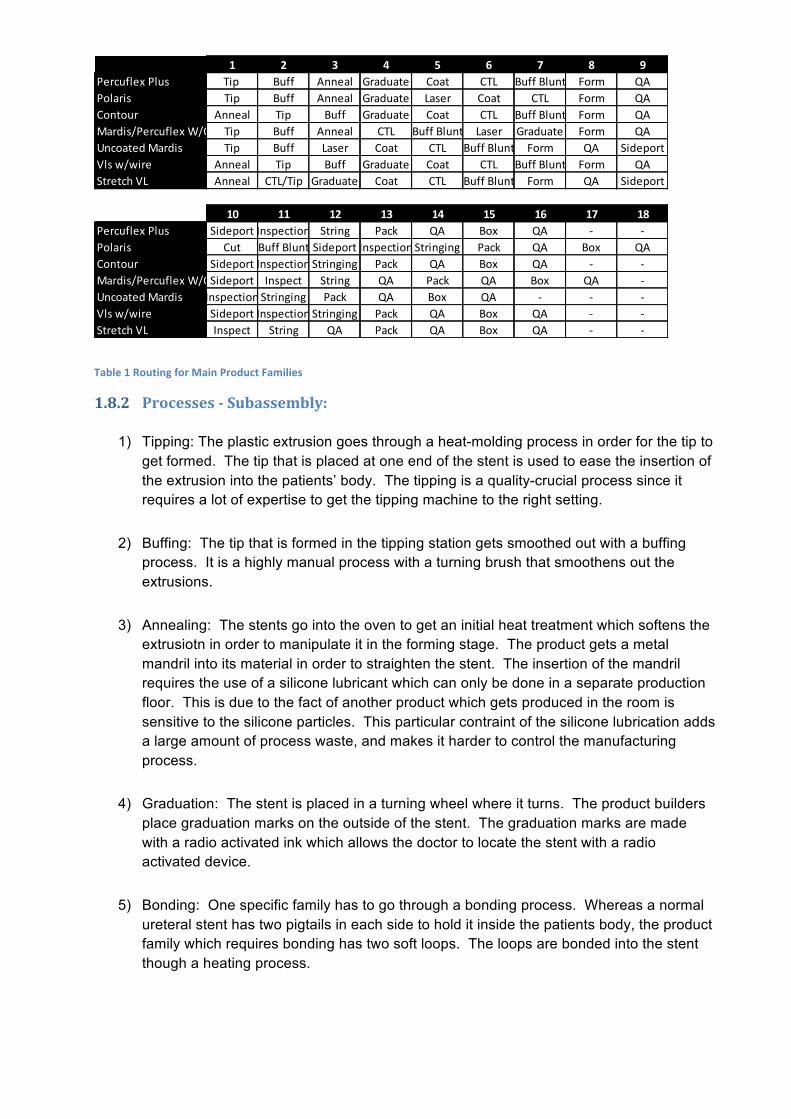
Table 1 Routing for Main Product Families
1.8.2 Processes -‐ Subassembly:
1) Tipping: The plastic extrusion goes through a heat-molding process in order for the tip to get formed. The tip that is placed at one end of the stent is used to ease the insertion of the extrusion into the patients’ body. The tipping is a quality-crucial process since it requires a lot of expertise to get the tipping machine to the right setting.
2) Buffing: The tip that is formed in the tipping station gets smoothed out with a buffing process. It is a highly manual process with a turning brush that smoothens out the extrusions.
3) Annealing: The stents go into the oven to get an initial heat treatment which softens the extrusiotn in order to manipulate it in the forming stage. The product gets a metal mandril into its material in order to straighten the stent. The insertion of the mandril requires the use of a silicone lubricant which can only be done in a separate production floor. This is due to the fact of another product which gets produced in the room is sensitive to the silicone particles. This particular contraint of the silicone lubrication adds a large amount of process waste, and makes it harder to control the manufacturing process.
4) Graduation: The stent is placed in a turning wheel where it turns. The product builders place graduation marks on the outside of the stent. The graduation marks are made with a radio activated ink which allows the doctor to locate the stent with a radio activated device.
5) Bonding: One specific family has to go through a bonding process. Whereas a normal ureteral stent has two pigtails in each side to hold it inside the patients body, the product family which requires bonding has two soft loops. The loops are bonded into the stent though a heating process.
1 2 3 4 5 6 7 8 9Percuflex Plus Tip Buff Anneal Graduate Coat CTL Buff Blunt Form QAPolaris Tip Buff Anneal Graduate Laser Coat CTL Form QAContour Anneal Tip Buff Graduate Coat CTL Buff Blunt Form QAMardis/Percuflex W/O GWTip Buff Anneal CTL Buff Blunt Laser Graduate Form QAUncoated Mardis Tip Buff Laser Coat CTL Buff Blunt Form QA SideportVls w/wire Anneal Tip Buff Graduate Coat CTL Buff Blunt Form QAStretch VL Anneal CTL/Tip Graduate Coat CTL Buff Blunt Form QA Sideport
10 11 12 13 14 15 16 17 18Percuflex Plus Sideport Inspection String Pack QA Box QA -‐ -‐Polaris Cut Buff Blunt Sideport Inspection Stringing Pack QA Box QAContour Sideport Inspection Stringing Pack QA Box QA -‐ -‐Mardis/Percuflex W/O GWSideport Inspect String QA Pack QA Box QA -‐Uncoated Mardis Inspection Stringing Pack QA Box QA -‐ -‐ -‐Vls w/wire Sideport Inspection Stringing Pack QA Box QA -‐ -‐Stretch VL Inspect String QA Pack QA Box QA -‐ -‐
6) Laser Graduation: The stents go through a laser printing machine in order to form a marking in the surface of the stent. Although it is mostly a mechanical process, it can be unstable due to the problems with machinery.
7) Coating: The stents then go into a separate room to get an outer chemical coating. The coating allows the extrusion to be put into the patients body without rejection of the same.
8) Cut-to-Length: The product then gets cut to its specified size. The sizes vary from approximately 16 cm to 30 cm which depends on the body in which they will be inserted in.
9) Forming: This is the process where the extrusions are heat molded in order to form the pigtail at the ends of the stent. The process is completed by placing a curved mandril inside the extrusion, and heating the product in the oven. Forming can also be done using an infrared forming device.
10) Buffing Blunt End: Buffing blunt end normally occurs in order to smooth out the end of the stent which the tip is not included. This is done to ensure that the surface is smooth after the mandrils are placed in, and taken out for forming.
11) Sideport: The first process in the top assembly processes, in which a small hole gets drilled into the extrusion. This allows for the flow of liquid.
12) Inspection: All stents go through a two-step inspection process in which they check many aspects of the stent from the graduation marks, to the pigtail, and they place a small tubing around it. All pieces which do not pass the inspection are discarded and left as scrap.
13) Stringing: Stringing is the process where the suture, or the fabic chord which is used to retrieve the ureteral stent from the patients body, is placed in the stent. This is quite an elaborate procress that is done manually. It is one of the most delicate processes in that the operators have to insert the string into the small sideport holes for every single unit.
14) Packing: Packing is the process in which the ureteral stents and the orange positioners are packed into specially designed custom trays. The process is completed in a sequence of steps. The operator then places the ureteral stent inside of the tray along with the positioner, and places it inside a special pouch after it has been inspectioned.
15) Sealing: The pouches are then sealed using a special heat treatment machine. In this particular process, the operator was found to have a lot of waste as they waited for the sealing machine to stop processing, for this reason it was combined with labeling.
16) Labeling: In this process, the labels are printed from the labeling machine, and glued centrally to the pouches. The labels come in round tubes of 300 labels before they get printed especifically for a particular product, and glued on to the pouch. This operation is now combined with sealing. While the operator waits for the machine cycle time in
sealing, they also print and label the pouch. The operation is finished with a small inspection of the label.
17) Line Inspection: This is a final visual inspection done for all of the pouches in order to check the final product. The quality audit is mainly focused on checking to see if the label was printed properly, and to see if there are any external particles inside the pouch or label. This process produces a lot of scrap, as it reprocesses approximately 30% of all units. The units which fail the inspection go pack to packing, and the tray and pouch are discarded.
18) Boxing: The last operation which is under the influence of the production unit is the boxing stage. Within the boxing stage, the order has to leave the “clean room” and go outside for the process. The process consists of one more quality audit performed mostly to check the exterior of the pouch, before the pouches are boxed. The boxes are then placed in pallets in order to be picked up by the shipping department. For the ureteral stents, the products have to be divided into two separate pallets since they consist of two different sterilization procedures in Conventry, Indiana.
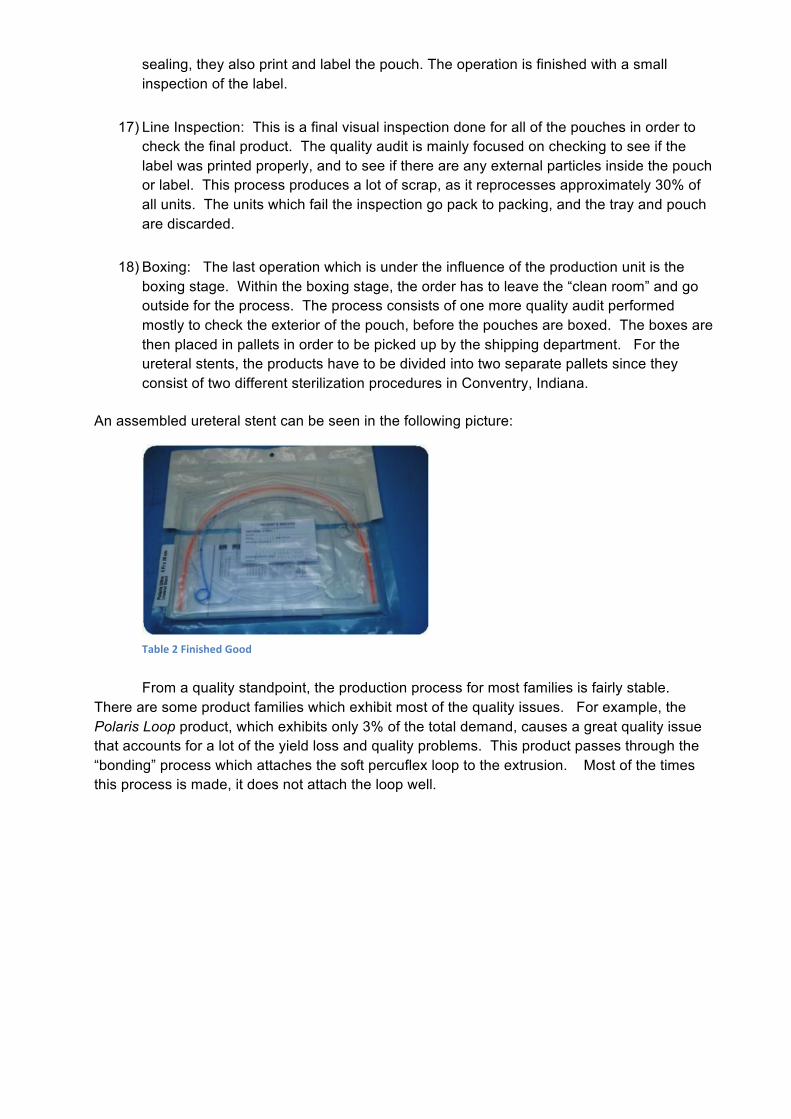
An assembled ureteral stent can be seen in the following picture:
From a quality standpoint, the production process for most families is fairly stable. There are some product families which exhibit most of the quality issues. For example, the Polaris Loop product, which exhibits only 3% of the total demand, causes a great quality issue that accounts for a lot of the yield loss and quality problems. This product passes through the “bonding” process which attaches the soft percuflex loop to the extrusion. Most of the times this process is made, it does not attach the loop well.
Figure 1-‐2 Ureteral Stent Finished Good Table 2 Finished Good
2 Development of Project at the Boston Scientific Ureteral Stents Line
In order to complete a throughrough study of the phenomenon of High-Mix, Low-Volume manufacturing. The research and thesis were completed in conjunction with an 6-month internship with medical devices manufacturer: Boston Scientific. The research was primarily conducted in the Ureteral Stents manufacturing line. The ureteral stents production unit is a process which exhibits the complications of mix in many forms. The product is comprised of over 180 product numbers, and 13 families. The process is a job shop manufacturing process. A job shop manufacturing process is defined as such: “Job shops are typically small manufacturing businesses that handle job production, that is, custom/bespoke or semi-custom/bespoke manufacturing processes such as small to medium-size customer orders or batch jobs. Job shops typically move on to different jobs (possibly with different customers) when each job is completed. By the nature of this type of manufacturing operation, job shops are usually specialized in skill and processes (Job Shop).”
The in order to properly test the research and methodology, the project was proposed as a major potential improvement opportunity at the Boston Scientific Ureteral Stents manufacturing environment. The objective of the project in the company was presented as such:
¨To bring value in the form of increased efficiency, lower costs, and greater control to BSC’s High-Mix, Low-Volume lines, by developing customized, state-of-the art Value Stream Mapping methodologies. Special Focus will be given on improving the production floor scheduling system to provide more visibility and control.”
The scope of the project was identified as such:
• The project will focus on the Ureteral Stents Line • Value Streams will be mapped from supermarket to boxing • Focus will be on implementing small effective changes (Quick Wins) and making larger
improvement suggestions (Long Term Improvements)
The deliverables for the project were identified as such:
1. Process and Control Improvement Opportunities 2. VSM Implementation Handbook for High-Mix, Low-Volume
In order to gradually and completely understand the manufacturing process and the improvements that lean manufacturing can bring to it, the project was separated into 4 different phases. The goal of the phases was also to divide the project into gradual milestones to complete the research. The phases of the product were separated into the Familiarization and Fact Finding Phase (3F), Polaris Pilot Phase, Whole Line VSM Phase, and Control and Documentation Phase. The time available for the project was strategically dispersed into the following timeline:
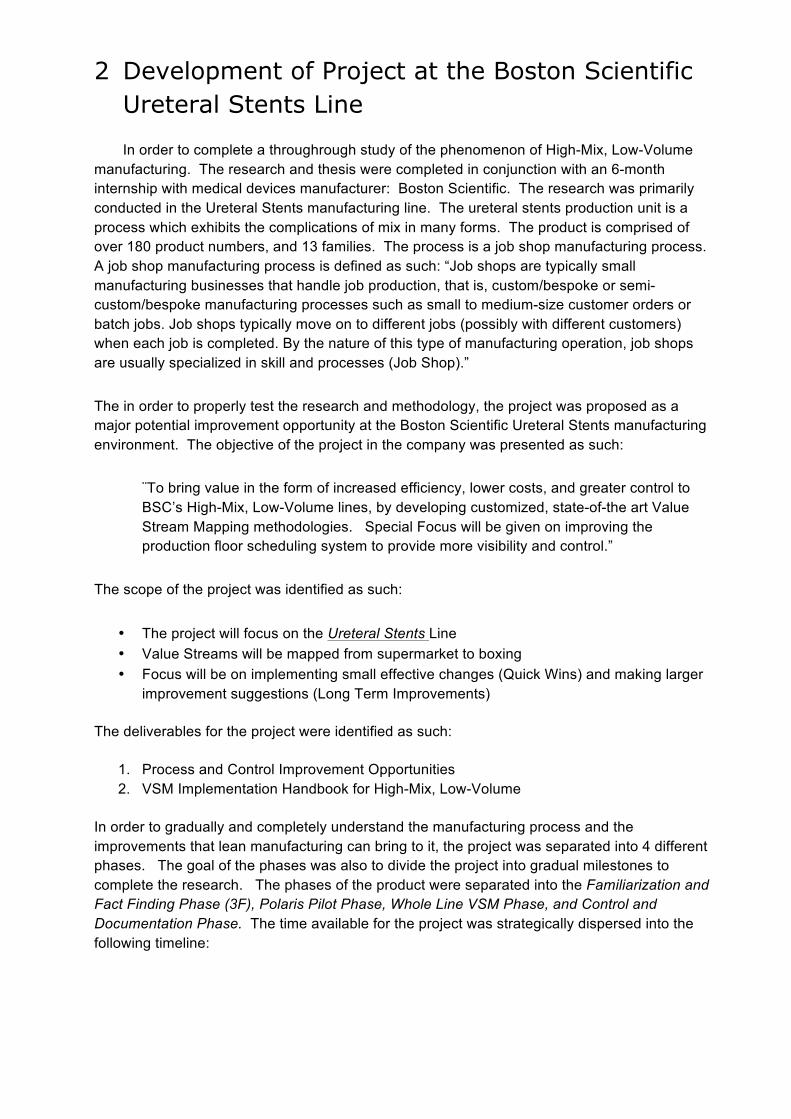
2.1 Familiarization and Fact Finding Phase (3F Phase): The first three weeks of the internship were focused on getting to know the different
dimensions that define the project. The purpose of the stage was to get to know the process and stakeholders to properly set the scope and the potential for improvement. The details of the project were focused on the following six characteristics:
The Familiarization and Fact Finding phase was highly informative and helpful for the
project. The following conclusions were derived from the phase: • The company and its workforce exhibit the right mindset for application of Lean
Initiatives. They are focused on continuous improvement, especially at the operational level. They strategically attack problems by searching for the root cause, and they develop their people for improvement and empowerment.
• The great mix in the type of products, and the variations exhibited in each of the different processes make it difficult to establish flow, especially within subassemblies. This is augmented by the rigorous Quality Control inspections, and documenting procedures within the process.
• Their cycle time is only measured and benchmarked for the high runner product, which focuses their efforts in prioritizing it. This dilutes the importance in long-term improvement of their process in order to lower lead times for all products.
• WIP and Inventory levels are prioritized below their Core 5 metrics, which means it is not attacked with the same level of importance. Total WIP for NVI Stents is $400,000, with Polaris representing approximately one-fourth of this number.
• The manufacturing process is recently coming out of a very turbulent phase when it was first transferred into the plant. This means that now is the perfect time for this initiative.
• Within Polaris, the Pareto principle is also exhibited, with 5 UPNs averaging 70% of production. UPNs with a diameter of 6 fr represent 65%. This can be used as a basis to attack improvement efforts.
• Average Lead Time (taken as the time from when the router is printed, to when it is confirmed) is approximately 15 days. Although the process is managed properly, it shows potential for improvement. Value Added time for Polaris is estimated at approximately 2 hours.
2.2 Polaris Pilot Phase After the 3F Phase, 1.5 months of the project were focused on mapping the Value Stream
for the Polaris product family. The reason why only one out of 13 families were chosen to perform the value stream map, is to gradually delve into the complications of high-mix manufacturing. With over 30 different finished good part numbers, the Polaris family in itself can be described as a High-Mix, Low-Volume process. Especially for the fact that there is a considerable amount of variability within the cycle times of the processes in the job shop. The Polaris product family was particularly been chosen because they consistently constitute approximately 25% of the total volume. Exhibiting a relatively stable demand in aggregate. In addition, the manufacturing process for Polaris is one of the few processes within the Boston Scientific Ureteral Stents manufacturing environment to have a relatively stable quality and yield process. Most of this is owed to the fact that the product has no quality issues at the Tipping
Process People Company Product Finance Data
station, which normally is the cause of many issues relating to quality, efficiency, yield, and output. Within Polaris, there are 2 UPNs which constitute 50% of the volume. In addition, Polaris products with 6 fr diameter constitute 64% of the volume. This combined with the 15 day average lead time, provides an opportunity to develop Value Stream Mapping. The main reason why the Polaris product was chosen though, was because of its relatively high cost. The Polaris family of products are the most expensive family manufactured at the Ureteral Stents line, with a market value of 25 dollars per unit. This also made the cost of the Work in Progress of approximately half of all of the WIP for the Ureteral Stents line, although it only constituted 50% of the volume.
Successively, the VSM Support team will analyze the Current State to pinpoint improvement opportunities for the Future State. After the Quick Wins are executed, the results will be analyzed in order to fine-tune the methodology. The fine tuning will allow for better results in the consequent phases. A pilot phase was completed in order to more gradually absorbe the difficulties of Value Stream Mapping in a high-mix, low-volume manufacturing environment. Although only one product family was chosen, there is still a high amount of variety within the product family. By having a pilot phase, many other complications and difficulties can be identified in order to more properly tackle them for the entire line, without having a large impact in the quality of the value stream map.
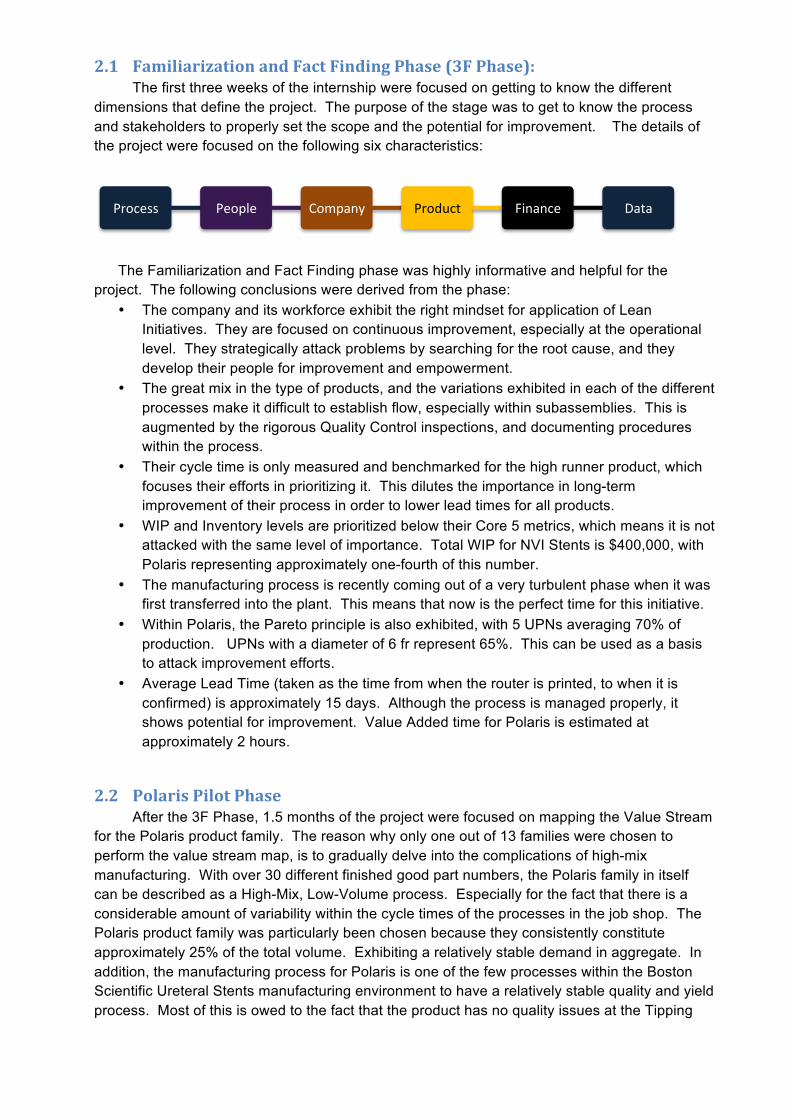
Mapping the current state of the Polaris Pilot phase identified a large amount of improvement opportunities in continous flow, pull systems, and other different tools. The phase was also completed at the perfect time, as the Quality Department had just completed a “Quality at the Source” initiative which eliminated the quality toolgates between several operations. By eliminating the quality audit between the Stringing, and Inspection processes in the top assembly part of the manufacturing process, it was possible to have continous flow throughout all of the processes of top assembly.
2.3 Whole Line VSM Phase After the implementation of the quick wins, or easy to implement improvement project arisen from the Polaris Pilot Phase, the entire process was mapped in order to find potential improvements for the process. The mapping of the entire line was much more complex. Although there are some important patterns in the process routings, which dictate how the majority of the products move through the production process, there can be over 60 different routings. This makes it very difficult to find how to properly map the process. This phase was completed over the last two and a half months of the project. The improvement projects that were chosen to be implemented were mostly those that have significant improvement possibiities for the “high-runner” products, or the products which exhibit the majority of the demand, such as the Percuflex Plus product family, the Contour product family, and the Polaris Product family. The demand of all of the different products has a distribution as such:
It was identified that improvements needed to be completed to prioritize where for the
Percuflex Plus family of products. The percuflex family not only has the highest demand out of all of the product families, it is also the basis for the “cycle time” metric measured for the production unit. The cycle time metric is a measure of the lead time that the product has inside the process, from the time that the router is printed, until the product gets shipped. This metric, which is part of the Core 5 metrics at Boston Scientific, is measured only for the Percuflex family of products. With a needed 25% improvement in cycle time year over year necessity, focus was targeted to improve the process for this product family.
Percuflex Plus Percentage Percuflex Plus 30% Contour 33% Polaris 33% Low Runners 10%
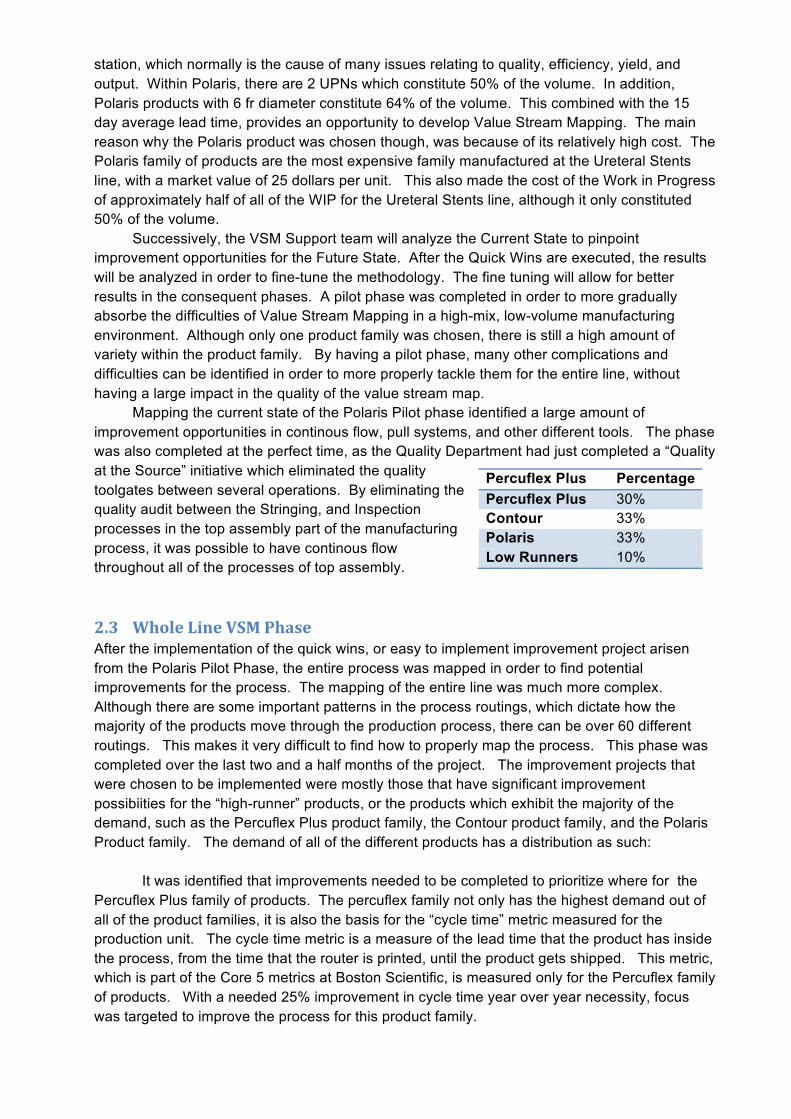
The timeline for the Whole Line VSM Phase was divided into the same subsections as the Polaris Pilot Phase. Firstly, two weeks of the phase were used to complete the current state value stream map of the process. More time was given to this process than in the Polaris Pilot phase because of the difficulties that could be encountered when mapping all of the product families in one value stream map. Afterwards, there was three weeks identified in order to identify the Future State Value Stream Map, or the mapping of how the process was going to be improved. Lastly, an entire month was defined necessary in order to implement some of the improvements in the Value Stream Map.
2.4 Control and Documentation Phase: The last phase of the project at the Boston Scientific Ureteral Stents manufacturing
environment was the Control and Documentation Phase. As a separate two weeks of the project plan, the Control and Documentation Phase was used in order to complete the “Value Stream Mapping adapted to High-Mix, Low-Volume” manufacturing environment implementation handbook. In addition it was used as a week for “controlling” or monitoring the implementation improvements from the Whole Line VSM Phase. This phase also provided a buffer should, the implementation part of the Whole Line VSM Phase was extended.
2.5 Final Project Plan:
Figure 2-‐1 Project Plan
Duration Start Finish 29 5 12 19 26 4 11 18 25 1 8 15 22 29 6 13 20 27 3 10 17 24Polaris/Pilot/Phase 32+days 01/02 15/03++++Project+Plan+Handed;in+and+Agreed 1+day 01/02 01/02++++Collect+Data+and+Form+Current+State 6+days 01/02 08/02++++Current+State+Review+Meeting 1+day 08/02 08/02++++Define+Future+State 11+days 08/02 22/02++++Future+State+Review+Meeting 1+day 23/02 23/02++++Execute+Quick+Wins+(might+extend) 17+days 22/02 15/03++++Begin+Analysis+Entire+US+Line 17+days 22/02 15/03++++Pilot+Program+Report+Meeting 1+day 15/03 15/03Full/Line/VSM/Phase 57+days 15/03 01/06++++Build+Current+VSM+for+High+Runners 11+days 16/03 16/04++++Current+State+Review+Meeting 1+day 16/04 16/04++++Build+Future+State+VSMs 12+days 06/04 24/04++++Future+State+Meeting 1+day 25/04 25/04++++Implement+Action+Plan+(cancelled) 26+days 26/04 31/05++++Final+Results+Report 1+day 01/06 01/06Control/and/Documentation/Phase 11+days 01/06 15/06++++Build+Handbook,+control+project,+finish+thesis 11+days 01/06 15/06///////Milestone
Feb912/ Mar912/ Apr912/ May912/ Jun912/
VSM+VIP+
3 Definitions
Lean Manufacturing: A manufacturing philosophy now a central and key part of most manufacturing plants centered on the relentless elimination of waste as its main objective. Waste is defined in Lean Manufacturing as any expenditure of resources used for any other reason than the creation of value for the end customer. It is based originally on the Toyota Production System, focusing on the main seven wastes.
Seven Wastes of Lean Manufacturing: Transportation, inventory, motion, waiting, overprocessing, overproduction, defects.
High-Mix, Low-Volume Manufacturing: A manufacturing process which is used to produce a relatively high amount of different parts, each with separate production processes and routings. It differs from a High-Volume, Low-Mix manufacturing process since the latter has a very predictable process for a relative few number of finished goods. The process can then be run a lot more stabilized.
Value Stream Mapping: A lean implementation methodology based on mapping a process in order to see waste, and establish improvements to reduce waste. It focuses on improving the flow in a particular manufacturing chain, as opposed to improving a singular transformation process.
Pull System: A production control, and stock replenishment system in which all movement of goods is dictated from an initial pull or signal triggered by an upstream process. As opposed to a Push System, in which demand gets forecasted into the future, a pull system relies on a small amount of inventory between two processes. When the process needs an object, it automatically gets replenished using cards, thusly the production is triggered by the pull, which ensures the exact quantity and types of products are produced, as opposed to a forecasted amount.
Job Shop Manufacturing Environment: A production environment which is based on separate production stations ran discontinuously. Every type of product has a different “routing” or order of operations. It makes for a highly flexible system able to cope with some of the eccentricities of High-Mix, Low-Volume manufacturing.
Production Batch: A group of identical products which is produced. They are aggregated to streamline the fixed costs of activities for the same type of products.
Line Changeover: The time that elapses between the processing of two production orders in a system. Line Changeover time usually includes equipment set-up time, documentation, quality audits, cleaning, gathering materials, and getting approvals.
SMED: Stands for Single-Minute Exchange of Dies, a Lean Manufacturing tool used to dramatically reduce line changeover times.
Takt Time: A manufacturing concept which means how much time passes before a single unit is bought from the customer. It is the customer’s voice and dictates the pace that a
manufacturing process should finish manufacturing every unit. The Takt Time is calculated as such:
Takt Time = (Total Customer Demand)/(Total Available Time)
Cell: A group of workstations or machines operating in a true continuous flow fashion. Workflow is linked so if work stops on one station, all work will stop in the cell. Usually in a cell, machines and workstations are placed close together in the order of processing, sometimes in a U shape. Cell operators may handle multiple processes, and the number of operators is changed when customer demand rate changes. The U-Shaped equipment layout is used to allow more alternatives for distributing work elements among operators and to permit the leadoff and final operations to be performed by the same operator.
Continuous Flow Production: Items are produced and moved from one processing step to the next, one piece at a time. Each process makes only the one piece that the next process needs, and the transfer batch size is one. Also called “single-piece flow”.
Dedicated Resources: Machines or equipment that can be isolated and used solely for the purpose of building specific products or product families. They are usually low-cost equipment such as assembly stations and small presses.
Kaizen: Continuously improving in incremental steps.
Kanban: A signaling device that gives instruction for production or conveyance of items in a pull system. Can also be used to perform kaizen by reducing the number of kanban in circulation, which highlights line problems.
Material Requirements Planning: A computerized system typically used to determine the quantity and timing requirements for delivery and production of items. Using MRP specifically to schedule production at processes in a value stream results in push production, because any predetermined schedule is only an estimate of what the next process will actually need.
Mixed Model: Producing a variety or mix of products or product variations through the same value stream at the pull of the customer. Building and delivering the right quantity of a specific product when the customer wants it.
Process Kaizen: Improvements made at an individual process or in a specific area. Sometimes called “point kaizen.”
Supermarket: A controlled inventory of items that is used to schedule production at an upstream process.
System Kaizen: Improvement aimed at an entire image.
Value Stream: All activities, both value-added and non-value-added, required to bring a product from raw material into the hands of the customer, a customer requirement from order to delivery, and a design from concept to launch. Value stream improvement usually begins at
door-to-door level within a facility and then expands outward to eventually encompass the entire value stream.
Value Stream Loops: Segments of a value stream whose boundaries are typically marked by supermarkets. Breaking a value stream into loops is a way to divide future-state implementation into manageable pieces.
WIP: Stands for “work-in-progress”, any inventory between raw material and finished goods.
4 Methodology
This chapter focuses on the main approach that was used in order to better answer the research question. The chapter also delves into the reason why a particular methodology was chosen that best adapts to the research question.
4.1 Scientific Research Paradigm
A research paradigm is defined as the underlying assumptions and intellectual structure upon which research and development in the field of inquiry is based. Thusly, there had to be a
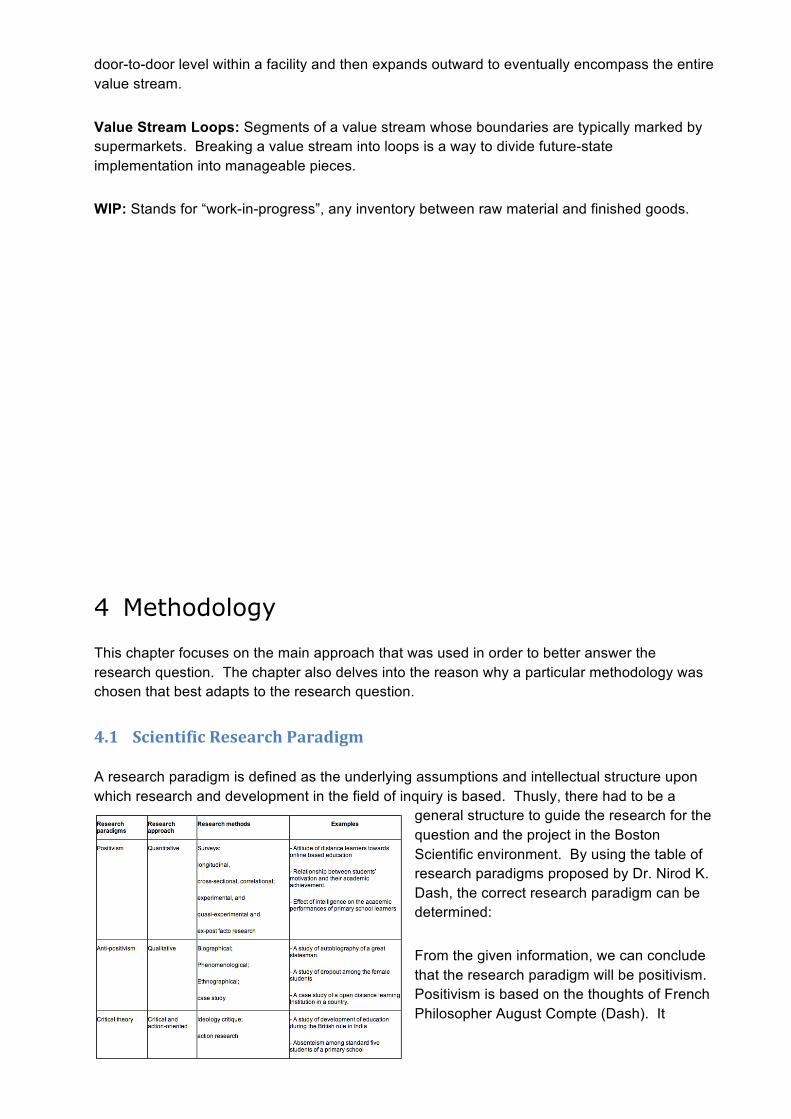
general structure to guide the research for the question and the project in the Boston Scientific environment. By using the table of research paradigms proposed by Dr. Nirod K. Dash, the correct research paradigm can be determined:
From the given information, we can conclude that the research paradigm will be positivism. Positivism is based on the thoughts of French Philosopher August Compte (Dash). It
Figure 4-‐1 Research Paradigms
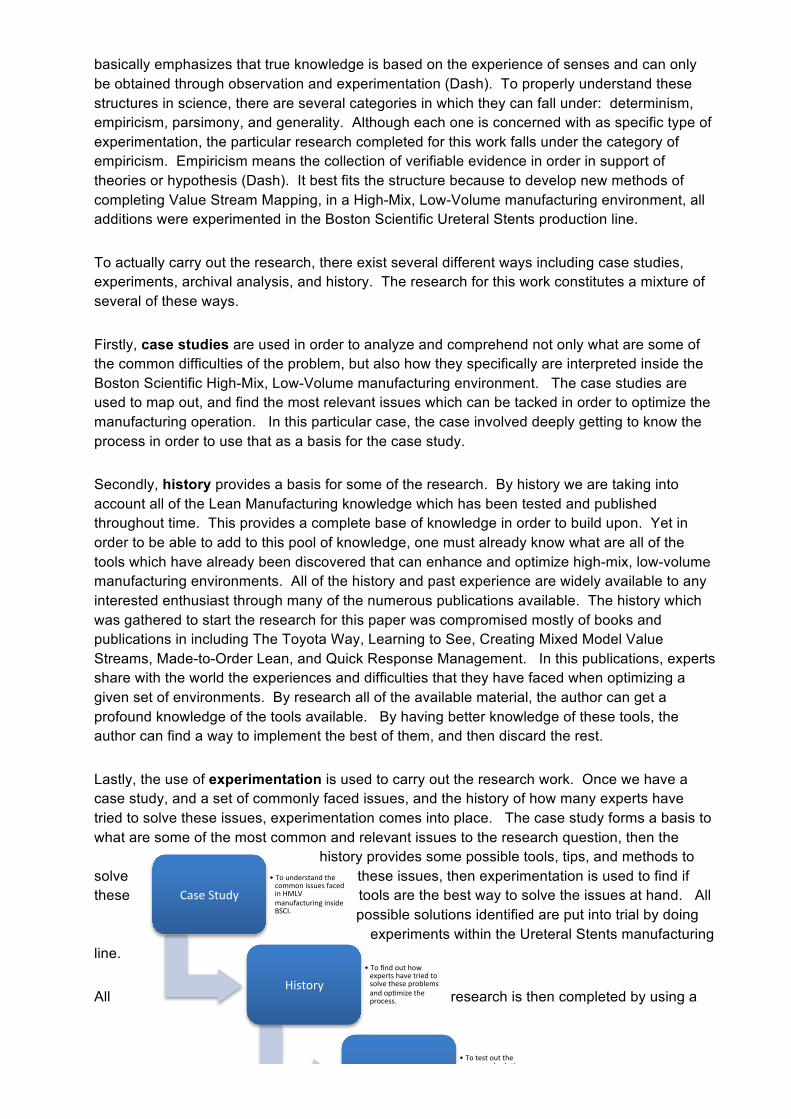
basically emphasizes that true knowledge is based on the experience of senses and can only be obtained through observation and experimentation (Dash). To properly understand these structures in science, there are several categories in which they can fall under: determinism, empiricism, parsimony, and generality. Although each one is concerned with as specific type of experimentation, the particular research completed for this work falls under the category of empiricism. Empiricism means the collection of verifiable evidence in order in support of theories or hypothesis (Dash). It best fits the structure because to develop new methods of completing Value Stream Mapping, in a High-Mix, Low-Volume manufacturing environment, all additions were experimented in the Boston Scientific Ureteral Stents production line.
To actually carry out the research, there exist several different ways including case studies, experiments, archival analysis, and history. The research for this work constitutes a mixture of several of these ways.
Firstly, case studies are used in order to analyze and comprehend not only what are some of the common difficulties of the problem, but also how they specifically are interpreted inside the Boston Scientific High-Mix, Low-Volume manufacturing environment. The case studies are used to map out, and find the most relevant issues which can be tacked in order to optimize the manufacturing operation. In this particular case, the case involved deeply getting to know the process in order to use that as a basis for the case study.
Secondly, history provides a basis for some of the research. By history we are taking into account all of the Lean Manufacturing knowledge which has been tested and published throughout time. This provides a complete base of knowledge in order to build upon. Yet in order to be able to add to this pool of knowledge, one must already know what are all of the tools which have already been discovered that can enhance and optimize high-mix, low-volume manufacturing environments. All of the history and past experience are widely available to any interested enthusiast through many of the numerous publications available. The history which was gathered to start the research for this paper was compromised mostly of books and publications in including The Toyota Way, Learning to See, Creating Mixed Model Value Streams, Made-to-Order Lean, and Quick Response Management. In this publications, experts share with the world the experiences and difficulties that they have faced when optimizing a given set of environments. By research all of the available material, the author can get a profound knowledge of the tools available. By having better knowledge of these tools, the author can find a way to implement the best of them, and then discard the rest.
Lastly, the use of experimentation is used to carry out the research work. Once we have a case study, and a set of commonly faced issues, and the history of how many experts have tried to solve these issues, experimentation comes into place. The case study forms a basis to what are some of the most common and relevant issues to the research question, then the
history provides some possible tools, tips, and methods to solve these issues, then experimentation is used to find if these tools are the best way to solve the issues at hand. All
possible solutions identified are put into trial by doing experiments within the Ureteral Stents manufacturing
line.
All research is then completed by using a
Case Study • To understand the common issues faced in HMLV manufacturing inside BSCI.
History • To find out how experts have tried to solve these problems and opdmize the process.
Experimentadon • To test out the proposed soludons inside the Ureteral Stents manufacturing environment.
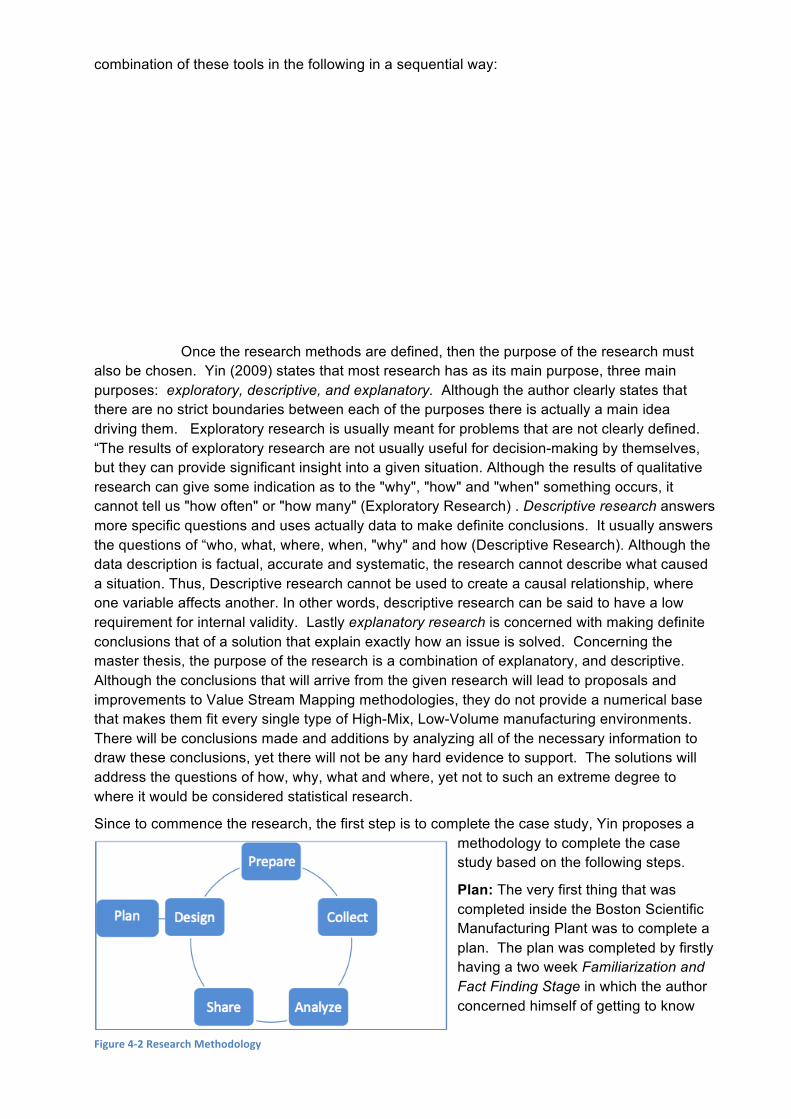
combination of these tools in the following in a sequential way:
Once the research methods are defined, then the purpose of the research must also be chosen. Yin (2009) states that most research has as its main purpose, three main purposes: exploratory, descriptive, and explanatory. Although the author clearly states that there are no strict boundaries between each of the purposes there is actually a main idea driving them. Exploratory research is usually meant for problems that are not clearly defined. “The results of exploratory research are not usually useful for decision-making by themselves, but they can provide significant insight into a given situation. Although the results of qualitative research can give some indication as to the "why", "how" and "when" something occurs, it cannot tell us "how often" or "how many" (Exploratory Research) . Descriptive research answers more specific questions and uses actually data to make definite conclusions. It usually answers the questions of “who, what, where, when, "why" and how (Descriptive Research). Although the data description is factual, accurate and systematic, the research cannot describe what caused a situation. Thus, Descriptive research cannot be used to create a causal relationship, where one variable affects another. In other words, descriptive research can be said to have a low requirement for internal validity. Lastly explanatory research is concerned with making definite conclusions that of a solution that explain exactly how an issue is solved. Concerning the master thesis, the purpose of the research is a combination of explanatory, and descriptive. Although the conclusions that will arrive from the given research will lead to proposals and improvements to Value Stream Mapping methodologies, they do not provide a numerical base that makes them fit every single type of High-Mix, Low-Volume manufacturing environments. There will be conclusions made and additions by analyzing all of the necessary information to draw these conclusions, yet there will not be any hard evidence to support. The solutions will address the questions of how, why, what and where, yet not to such an extreme degree to where it would be considered statistical research.
Since to commence the research, the first step is to complete the case study, Yin proposes a methodology to complete the case study based on the following steps.
Plan: The very first thing that was completed inside the Boston Scientific Manufacturing Plant was to complete a plan. The plan was completed by firstly having a two week Familiarization and Fact Finding Stage in which the author concerned himself of getting to know
Figure 4-‐2 Research Methodology
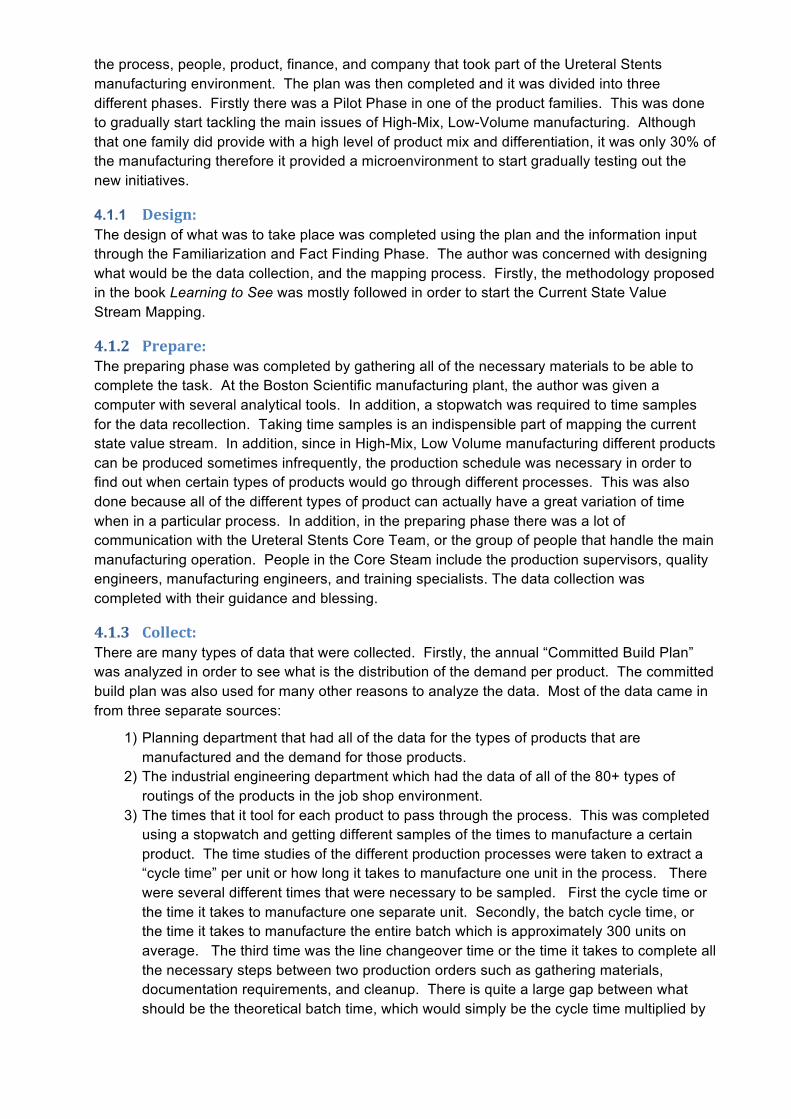
the process, people, product, finance, and company that took part of the Ureteral Stents manufacturing environment. The plan was then completed and it was divided into three different phases. Firstly there was a Pilot Phase in one of the product families. This was done to gradually start tackling the main issues of High-Mix, Low-Volume manufacturing. Although that one family did provide with a high level of product mix and differentiation, it was only 30% of the manufacturing therefore it provided a microenvironment to start gradually testing out the new initiatives.
4.1.1 Design: The design of what was to take place was completed using the plan and the information input through the Familiarization and Fact Finding Phase. The author was concerned with designing what would be the data collection, and the mapping process. Firstly, the methodology proposed in the book Learning to See was mostly followed in order to start the Current State Value Stream Mapping.
4.1.2 Prepare: The preparing phase was completed by gathering all of the necessary materials to be able to complete the task. At the Boston Scientific manufacturing plant, the author was given a computer with several analytical tools. In addition, a stopwatch was required to time samples for the data recollection. Taking time samples is an indispensible part of mapping the current state value stream. In addition, since in High-Mix, Low Volume manufacturing different products can be produced sometimes infrequently, the production schedule was necessary in order to find out when certain types of products would go through different processes. This was also done because all of the different types of product can actually have a great variation of time when in a particular process. In addition, in the preparing phase there was a lot of communication with the Ureteral Stents Core Team, or the group of people that handle the main manufacturing operation. People in the Core Steam include the production supervisors, quality engineers, manufacturing engineers, and training specialists. The data collection was completed with their guidance and blessing.
4.1.3 Collect: There are many types of data that were collected. Firstly, the annual “Committed Build Plan” was analyzed in order to see what is the distribution of the demand per product. The committed build plan was also used for many other reasons to analyze the data. Most of the data came in from three separate sources:
1) Planning department that had all of the data for the types of products that are manufactured and the demand for those products.
2) The industrial engineering department which had the data of all of the 80+ types of routings of the products in the job shop environment.
3) The times that it tool for each product to pass through the process. This was completed using a stopwatch and getting different samples of the times to manufacture a certain product. The time studies of the different production processes were taken to extract a “cycle time” per unit or how long it takes to manufacture one unit in the process. There were several different times that were necessary to be sampled. First the cycle time or the time it takes to manufacture one separate unit. Secondly, the batch cycle time, or the time it takes to manufacture the entire batch which is approximately 300 units on average. The third time was the line changeover time or the time it takes to complete all the necessary steps between two production orders such as gathering materials, documentation requirements, and cleanup. There is quite a large gap between what should be the theoretical batch time, which would simply be the cycle time multiplied by
the number of units in a batch, yet due to several different distractions such as issues with machines, bathroom breaks, and general waste of time, the batch time was approximately 20% greater than the theoretical batch time.
4.1.4 Analyze: After all the data was collected, it was analyzed to better understand the mix and start seeing improvement opportunities. This was mainly done using several different Lean Tools and methodologies such as Value Stream Mapping, SMED, Standard Work, and Mixed Model Value Streams. All of the available data was the basis for creating what is called the “Current State Value Stream Map” which graphically shows what is the process. It is here where most of the difficulties arise since the High-Mix makes it difficult to be able to see improvements that are possible and are optimal for the entire production line. Using all of the different analysis and tools, one can reach what is called the “Future State Value Stream Map” which outlines how the process should look like in order to minimize waste. This was done very successfully in both the Pilot Phase for one product family, and for the entire production line. The main concern is to maximize what is called the Value Added Time, or the time that the units spend in the manufacturing line in which they are getting value. Through all of the initiatives identified in Value Stream Mapping, the Value Added Time as a percentage of the actual lead-time was doubled.
4.1.5 Sharing: After the “future state” is mapped, an implementation plan to target and complete all of the necessary steps in order to reach the future state is completed. This was done by communicating all of the benefits of Value Stream Mapping with the core team, and coordinating what is the best way to start implementing the necessary initiatives in order to reach the future state. It is also important to properly communicate the advantages and the impact that can be made by completing the initiative.
The entire process for the Case Study was done in an iterative basis. Mostly the author was engaged in two different iterations. The first was for the Polaris Pilot Phase, and the second was for the entire Ureteral Stents production line. The process, as well as Value Stream Mapping and any continuous improvement initiative can also be repeated iteratively.
4.2 Research Approach In order to be able to solve the research question, there could be three different approaches to complete it. These three are induction, deduction and abduction. The difference between these three approaches comes from how they attack the interplay between theory and reality (Trochim). In general, deduction’s approach is to try to use the available theory and project it onto reality. Opposite to induction is deduction, which forms a theory based on a real life situation. The third type of research approach would then be abduction, which is a constant cycle of interplay between theory and reality. The approach of this research work is on the abduction approach for several reasons. Firstly, because it takes into consideration many theoretical practices in order to build a base to optimize a production line in a high-mix, low-volume manufacturing environment. After this base is created, there are new theories also being formed which are both a combination of different theories, and addition to the theories by experimental, real-life scenarios tested at the Ureteral Stents manufacturing facility. However, it is not a cycle like a regular abduction approach but more like a linear approach. This approach can be summarized in the following graph:
Exisdng Theories
Real Life Experiment
New Theories
4.3 Research Method According to Cullis and Hussley, there are two main kinds of research methods simply separated by the kind of information that is being researched: quantitative or qualitative. The research involved in this particular case will deep be involved in both research methods. From a quantitative standpoint, it is necessary to analyze all of the demand data, and the different process times to measure, benchmark, and form a base for the impact that can be made from the improvements made by Value Stream Mapping. From a quantitative standpoint, much of the research is not numerical. It delves into learning about the different kinds of improvements and how to implement them. A lot of the success of the implementation of an improvement depends highly on how the people and the team are managed. From that standpoint, there needs to be a large amount of qualitative research to accompany the quantitative.
4.4 Sources of Information There are many different sources of information that will play into the research experience. These can be subdivided into three main categories: 1) Publications such as books, articles, academic research papers, and websites. 2) The real-life experience of the managers, production supervisors, and industrial engineers at the Boston Scientific manufacturing facility. 3) The results from real life experiments from improvements at the Boston Scientific Ureteral Stents line.
1) Publications: The main theoretical framework and source of information for this research work is common publications written by Lean Experts and enthusiasts based on their own expertise and experience. For these publications, the authors are generally ex-Toyota manufacturing leaders, which decided to write a book on all of their experiences. Besides books, the information also includes articles, research papers, and web sites made by general lean enthusiasts looking into adding greater value to Lean Manufacturing Theory. The list of these publications is as follows: a. The Toyota Way by Jeffrey Liker b. The Toyota Way Fieldbook by Jeffrey Liker and David Meier c. Learning to See by Mike Rother and John Shook d. Creating Mixed Model Value Stream by Kevin J. Duggan e. Made to Order Lean by Greg Lane f. Quick Response Manufacturing by Rajan Suri g. The SMED System by Shigeo Shingo h. Value Network Mapping by ZahirAbbas N. Khaswala
Such publications provided and excellent theoretical base and an extensive amount of knowledge transferred from years of Lean Implementation expertise.
2) Real Life Experience of Coworkers: A lot of the information on how to optimally control High-Mix, Low-Volume manufacturing environments was input from the actual experience of the supervisors, industrial engineers, and managers of the Boston Scientific Ureteral Stents production line. Many of them are very knowledgeable on real life experience of control a high-mix, low-volume production environment. In addition, many of them have a lot of first-hand experience and tips on what works and what does not work. This knowledge was very useful when thinking of possible improvements for the manufacturing environment. Although most of the production styles within the
Boston Scientific Coyol plant can be characterized as High-Volume, Low-Mix manufacturing, there are two other lines besides Ureteral Stents that are considered High Mix. The first of these is the Drainage Catheters production line, which is in the same production unit as ureteral stents. Together, they form the Ureteral Stents/Drainage Catheters production unit, or commonly referred to as US/DC at the Boston Scientific Coyol Plant. The Drainage Catheters production line exhibits an even greater production mix than ureteral stents, and its production process includes a lot more subassemblies, making it even more complex. The experience from the Core Team of the Drainage Catheters production environment was also highly relevant, as they manage their business very well. Although they are in a separate production unit, the Jagwire production team, especially the industrial engineers also provide some useful information and tips.
3) Results of real-life experiments at the ureteral stents line: After the main improvements were researched through the theories, and validated with the general knowledge of the Boston Scientific staff, they were tested inside the manufacturing facility. When implementing the initiatives, the feedback and opinions of the Product Builders, or operators were taken into account to validate the improvements. In addition, most of the improvements proposed have measurable results such as the reduction in cycle time, the decrease in lead-time variation by products, or the increase in productivity and output by a production station.
4.5 Analysis of Findings The results from the experimentation should be analyzed in order to test the validity of the propositions. Several factors should be taken into account when validating the findings. A lot of these relate to the fact that many improvements were already being implemented at the Boston Scientific ureteral stents line. So they must be analyzed to see if the increase in efficiency, production control, or reduction cycle time is actually due to the fact of the new improvements, or because they had already implemented several other initiatives. In addition, the findings should be analyzed to see if the improvements can only be beneficial on an isolated basis for the Boston Scientific Ureteral stents environment, or if they can be translated into many other production environments within and outside the medical devices industry.
The research method was used to obtain different perceptions of the phenomenon and the analysis was made seeking to understand what is happening in a situation and looking for repeatable patterns as mentioned by Collis & Hussey (2009, p. 60). So the findings were made and the context was analyzed to see to which degree can the model be generalized.
4.6 Quality of Research Conventional methods seek to test the quality of research amongst different levels. Yin in his book Case Study Research: Design and Methods proposes testing the research amongst four different categories. These are construct validity, internal validity, external validity, and reliability.
• Construct Validity: In a manufacturing environment, where there is are plethora of variables that affect the outcome of the production line, it is very difficult to measure and take into account every single construct within the model. For example, there exist behavioral constructs for the operators, external constructs due to the market demand, and the company outcome outside the Coyol Plant, etc. In addition, there exist the constructs of the projects that the Boston Scientific Ureteral Stents production line that
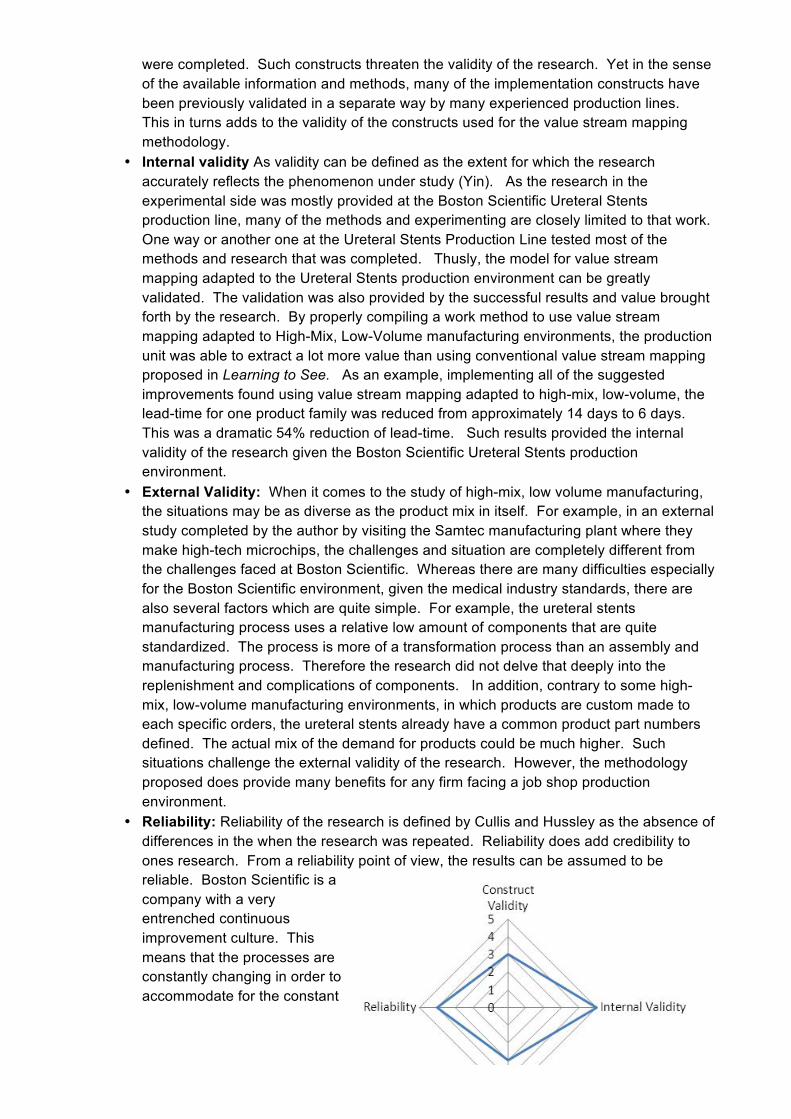
were completed. Such constructs threaten the validity of the research. Yet in the sense of the available information and methods, many of the implementation constructs have been previously validated in a separate way by many experienced production lines. This in turns adds to the validity of the constructs used for the value stream mapping methodology.
• Internal validity As validity can be defined as the extent for which the research accurately reflects the phenomenon under study (Yin). As the research in the experimental side was mostly provided at the Boston Scientific Ureteral Stents production line, many of the methods and experimenting are closely limited to that work. One way or another one at the Ureteral Stents Production Line tested most of the methods and research that was completed. Thusly, the model for value stream mapping adapted to the Ureteral Stents production environment can be greatly validated. The validation was also provided by the successful results and value brought forth by the research. By properly compiling a work method to use value stream mapping adapted to High-Mix, Low-Volume manufacturing environments, the production unit was able to extract a lot more value than using conventional value stream mapping proposed in Learning to See. As an example, implementing all of the suggested improvements found using value stream mapping adapted to high-mix, low-volume, the lead-time for one product family was reduced from approximately 14 days to 6 days. This was a dramatic 54% reduction of lead-time. Such results provided the internal validity of the research given the Boston Scientific Ureteral Stents production environment.
• External Validity: When it comes to the study of high-mix, low volume manufacturing, the situations may be as diverse as the product mix in itself. For example, in an external study completed by the author by visiting the Samtec manufacturing plant where they make high-tech microchips, the challenges and situation are completely different from the challenges faced at Boston Scientific. Whereas there are many difficulties especially for the Boston Scientific environment, given the medical industry standards, there are also several factors which are quite simple. For example, the ureteral stents manufacturing process uses a relative low amount of components that are quite standardized. The process is more of a transformation process than an assembly and manufacturing process. Therefore the research did not delve that deeply into the replenishment and complications of components. In addition, contrary to some high-mix, low-volume manufacturing environments, in which products are custom made to each specific orders, the ureteral stents already have a common product part numbers defined. The actual mix of the demand for products could be much higher. Such situations challenge the external validity of the research. However, the methodology proposed does provide many benefits for any firm facing a job shop production environment.
• Reliability: Reliability of the research is defined by Cullis and Hussley as the absence of differences in the when the research was repeated. Reliability does add credibility to ones research. From a reliability point of view, the results can be assumed to be reliable. Boston Scientific is a company with a very entrenched continuous improvement culture. This means that the processes are constantly changing in order to accommodate for the constant
Figure 6 -‐ Validity of Research
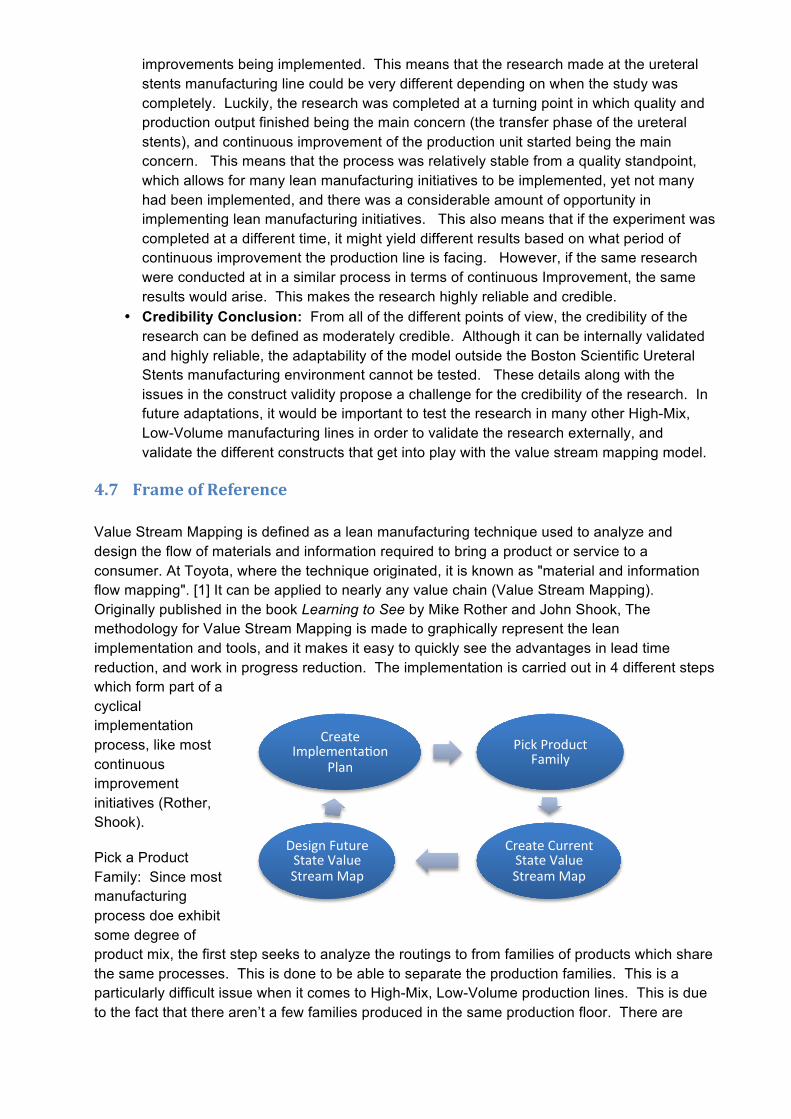
improvements being implemented. This means that the research made at the ureteral stents manufacturing line could be very different depending on when the study was completely. Luckily, the research was completed at a turning point in which quality and production output finished being the main concern (the transfer phase of the ureteral stents), and continuous improvement of the production unit started being the main concern. This means that the process was relatively stable from a quality standpoint, which allows for many lean manufacturing initiatives to be implemented, yet not many had been implemented, and there was a considerable amount of opportunity in implementing lean manufacturing initiatives. This also means that if the experiment was completed at a different time, it might yield different results based on what period of continuous improvement the production line is facing. However, if the same research were conducted at in a similar process in terms of continuous Improvement, the same results would arise. This makes the research highly reliable and credible.
• Credibility Conclusion: From all of the different points of view, the credibility of the research can be defined as moderately credible. Although it can be internally validated and highly reliable, the adaptability of the model outside the Boston Scientific Ureteral Stents manufacturing environment cannot be tested. These details along with the issues in the construct validity propose a challenge for the credibility of the research. In future adaptations, it would be important to test the research in many other High-Mix, Low-Volume manufacturing lines in order to validate the research externally, and validate the different constructs that get into play with the value stream mapping model.
4.7 Frame of Reference Value Stream Mapping is defined as a lean manufacturing technique used to analyze and design the flow of materials and information required to bring a product or service to a consumer. At Toyota, where the technique originated, it is known as "material and information flow mapping". [1] It can be applied to nearly any value chain (Value Stream Mapping). Originally published in the book Learning to See by Mike Rother and John Shook, The methodology for Value Stream Mapping is made to graphically represent the lean implementation and tools, and it makes it easy to quickly see the advantages in lead time reduction, and work in progress reduction. The implementation is carried out in 4 different steps which form part of a cyclical implementation process, like most continuous improvement initiatives (Rother, Shook).
Pick a Product Family: Since most manufacturing process doe exhibit some degree of product mix, the first step seeks to analyze the routings to from families of products which share the same processes. This is done to be able to separate the production families. This is a particularly difficult issue when it comes to High-Mix, Low-Volume production lines. This is due to the fact that there aren’t a few families produced in the same production floor. There are
Pick Product Family
Create Current State Value Stream Map
Design Future State Value Stream Map
Create Implementadon
Plan
numerous. In the case of the Ureteral Stents production line, there are over 13 families, all of which exhibit dramatically different routings. Not only do they vary in routings, but they also vary in the times that they spend in each station. Which complicates the value stream mapping methodology greater. Several sources suggest to seek to map the value stream map for the “high runner” product, or the product that carries the greatest percentage of the demand. Such an approach might be beneficial to lines exhibiting the “pareto principle” or the 80/20 rule. In the case of the Boston Scientific Ureteral Stents production environment, this is very difficult due to two reasons:
o There is not one product family which carries the majority of the demand. In addition, there is a high amount of variability within the production families. For example, the 8 French diameter for a particular type of product, exhibits all sorts of complications outside the regular complications of that same product family.
o Optimizing the process, or making improvements for one particular product family might not create benefit for the entire production line as a whole. In addition, greater considerations should be taken to make sure that the initiatives implemented for the families are cost effective.
Second step: Create Current State Value Stream Map. The methodology for value stream mapping then centers around the action of mapping the current state of the production process for the chosen product family. This is simply done by collecting several pieces of information relating to the timing of the process. The current state, maps each discontinuous process as a separate “process box” which contains several pieces of information. This information includes cycle time, number of operators at each station, yield, uptime, and changeover time. It can also include any other particular fact which might prove useful to the process. In addition to the different processing stations, the inventory between the stations is also mapped out. This is done using a different type of icon. Mapping the inventory between the stations gives visibility to the waste that exist in batch processing, as opposed to continuous flow. The information flow is also mapped out from the customer, to the planning department, and into the floor. The entire supply chain is completely mapped out to show the delivery cycle for suppliers and customers, and the delivery style. Lastly, a timeline at the bottom of the value stream map shows a very important type of information. It separates the “value added time” or the time that the material is in the production floor, in which real value is being added to it, and non-value added time which is wasted time due to several different factors such as inventory waiting, transportation, and changeover time. By being able to see the “value added time”, managers, supervisors and industrial engineers usually get shocked at how low it can be. The first time current state value stream maps are completed, they generally display a value added time of 1-5%. That means that the most of the time the product is in the production floor, it is wasting time. This is one of the advantages of Value Stream Mapping. Typical Value Stream Mapping methodology proposed in Learning to See suggests to always draw the value stream with pencil and paper (Rother, Shook). This allows the user to quickly gather the information, and map it as quickly as possible. It also makes it easier to both make changes to it, and propose improvements. However, ZahirAbbas N. Khaswala in his publication, Value Network Mapping, suggests such an approach might not be the best fir for High-Mix, Low-Volume job shop environments. In his “Value Network Mapping” tool, he suggests using the aid of a computer. This is due to the fact that the large variety of routings in a high-mix, low-volume production environment could create a clustered, messy value stream map which would make it really hard to work with and extract value from it. Throughout this thesis, ZahirAbbas N. Khaswala approach was followed and the entire map was completed using computerized graphical tools.
Third Step: Creating the Future State Value Stream Map
The third step is the most important step because it is where the improvement kaizen opportunities are identified using the Value Stream Mapping approach. On the contrary to popular beliefs about Value Stream Mapping, in which experts are simply expected to look at the current state value stream map, and then derive value from it, the methodology proposed in Learning to See has a very specific and articulable set of instructions to make a value stream leaner. This is done in a series of 8 steps centered on implementing a lot of the principles of the Toyota Production System. This includes tools such as continuous flow, pull systems, load leveling, small lot sizes, etc. Some of the steps pose a particular difficulty in the implementation in a High-Mix, Low-Volume manufacturing environment. Especially the ones relating to producing at a standardized time. These include the principles of takt time, releasing work at a consistent pitch, and aiming to produce every part every interval. Although producing to takt time creates a very useful tool for high-volume, low-mix production in which all operations need to coordinate themselves to the takt time, high-mix, low volume has a different difficulty. The capacity, cycle times, and demand for each different workstation can vary significantly. This means that each separate workstation would have to produce at separate takt times. This would provide a useful tool if it wasn’t for the difficulty of the high amount of variability in cycle times for different products. This would make it almost impossible to produce to a standardized time, given the different requirements of the product. Especially of the product mix also varies significantly on a day-to-day, and sometimes hour-to-hour basis. The same difficulties pose a threat to the principle of releasing work at a consistent pitch. At the Boston Scientific Ureteral Stents production line, the lot sizes vary from 50 to 600 units. This is because of the great variation in demand depending on the products. Having an equal number of pieces for all of the batches might create greater waste in terms of overproduction for low runners, underproduction for high-runners, and lost time due to excessive time wasted in changeovers. It would not be optimal to release work at a constant pitch, it the amount of work varies significantly. Each releasing of work could come with greater challenges depending on the stations used, thusly it does not provide with a level and balanced workload for all of the stations, but for a system that would eventually give and unstable demand to each separate production line.
Fourth Step: Forming a Work Plan. After the Future State improvements have been identified, then comes the most difficult part of the value stream mapping process, implementing the projects. In this step it is important to go beyond the methodology proposed in Learning to See and into deeper topics such as the cultural implementation of a lean culture proposed in The Toyota Way. All levels of the company must have an understanding of Lean Philosophy, and overall continuous improvement. The implementation must come from a manager or high level in order to set the importance of the tools. The implementation plan is completed by gathering all of the stakeholders and completing the implementation plan. It is critical that this step is completed with the sponsorship of a senior level director of the plant, in order to get optimal visibility, which leads to optimal results. The completion of the current and future state of value stream mapping is actually completed as a cyclical continuous improvement process.
4.8 Literature Review
4.8.1 The Toyota Way
The Toyota Way, written by longtime Toyota collaborator Jeffrey Liker is an all-inclusive book about the principles that led to Toyota’s success as a business. Since Lean Manufacturing stems out of the Toyota Production System, the book serves as an incredibly useful introduction
into the history, benefits, and ways to view lean manufacturing. Lean Manufacturing as such was firstly developed at Toyota in order to cope with the high-mix, low-volume environment that they faced after WWII. The book lays down a groundbreaking analysis of how Toyota developed its state-of-the art Toyota Production System, and its consistent ideals of constantly eliminating waste. The topics center around building on Toyota 4P model of the Toyota Way by providing examples throughout Toyota’s history of its unique achievements through their philosophy. The 4P model, a graphical representation of Toyotas 14 main principles separated into four different sections encapsulates the main principles of the Toyota Way. The base of the 4P model is Toyota’s Long Term Philosophy of basing all management decisions on the long-term outcome, at the expense of short-term financial goals. The second section is the Process principles that drive Lean Manufacturing. Principles such as pull systems, continuous flow, workload leveling, and standardization. Tools to manage People and Partners form the third section, focusing on the development and growth of individuals that live the culture of the company. The last section focuses on Toyota’s method of solving problems by attacking and searching the root cause. The book has many advantages. It gives a total overview into many different ways and tools that Lean can be applied by describing each pillar of Lean and successful examples at Toyota. This provides an 360-degree introduction of the most important lean philosophies. The advantage of this book is also that it relentlessly establishes the need for the Toyota Way to be perceived as a total solution that must be consistently applied, instead of just a set of tools that can be implemented temporarily. The book then rightfully follows each different tool with an example from Toyota’s own business. The concepts are then clearly explained through the numerous examples of Lean Leaders implementing them in Toyota. Moreover, the book gives plenty of examples of Lean implemented wrongly, which serves prevents the user to get caught by usual traps of implementing Lean as a set of tools.
The first and most important principle of The Toyota Way is to “Base Your Management Decisions on a Long-Term Philosophy, Even at the Expense of Short-Term Financial Goals. (Liker, 71)” This takes on two meanings. Firstly, they believe that companies should base their decisions on what is the most beneficial for the society as a whole. This means that at the expense of their earnings, they will do what is right for the society, or the environment. This will yield higher benefits for the company. Secondly, the book states that all business decisions should be made for the long-term benefit. An example is the creation of the Prius car model, which had an incredibly high investment, yet it paved the way for a new generation of environmentally friendly cars.
The next six principles are concerned with the Toyota Production system of eliminating waste. The first is to “create continuous process flow to bring problems to the surface (Liker, 87)” The book emphasized on lowering inventory levels in order to uncover problems within the production line. It states that an optimal state is to reduce batch sizes as much as possible in order to move the product through the factory as fast as possible. It mentions the final ideal state of a Lean Manufacturing Plant: One Piece Flow. One Piece flow is categorized as producing with a batch size of one.
The third principle to “Use Pull Systems to Avoid Overproduction (Liker, 104)” According to Taiichi Ohno, “the more inventory a company has…the less likely the will have what they need.” This outlines the philosophy of producing only to the real customer demand instead of the traditional forecast approach (push systems). The idea of a pull system is to eliminate overproduction, one of the seven deadly wastes. The idea of a pull systems stems
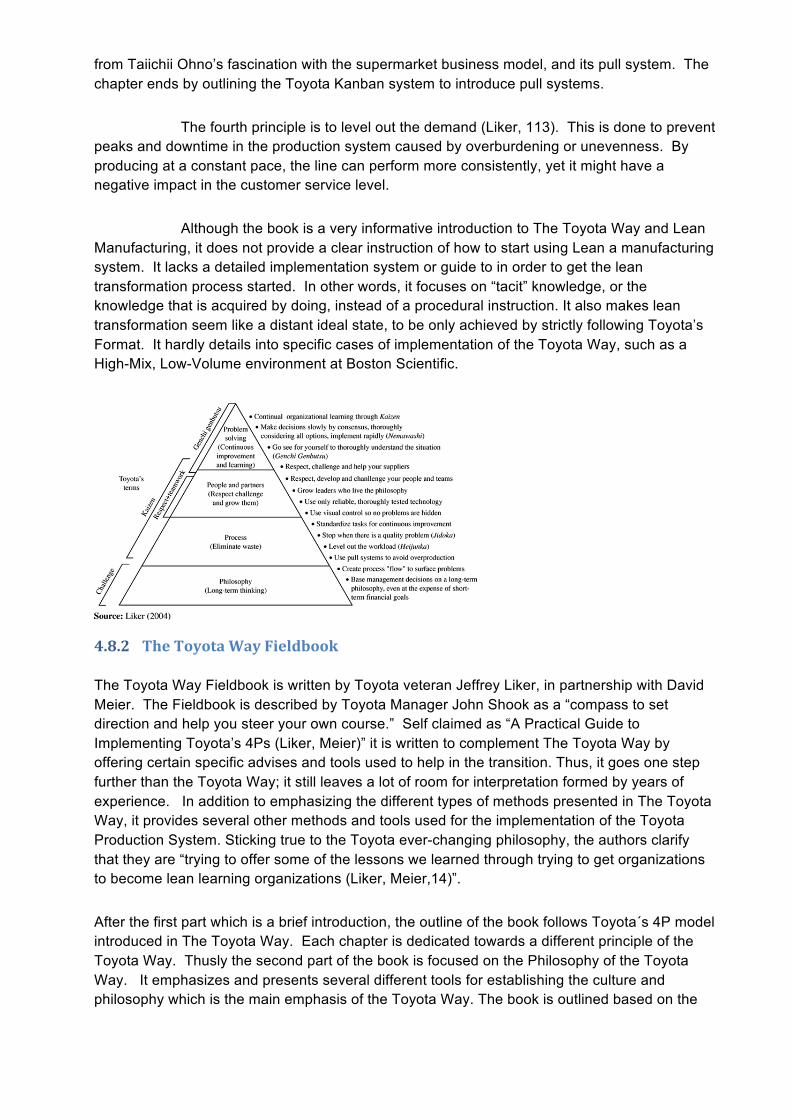
from Taiichii Ohno’s fascination with the supermarket business model, and its pull system. The chapter ends by outlining the Toyota Kanban system to introduce pull systems.
The fourth principle is to level out the demand (Liker, 113). This is done to prevent peaks and downtime in the production system caused by overburdening or unevenness. By producing at a constant pace, the line can perform more consistently, yet it might have a negative impact in the customer service level.
Although the book is a very informative introduction to The Toyota Way and Lean Manufacturing, it does not provide a clear instruction of how to start using Lean a manufacturing system. It lacks a detailed implementation system or guide to in order to get the lean transformation process started. In other words, it focuses on “tacit” knowledge, or the knowledge that is acquired by doing, instead of a procedural instruction. It also makes lean transformation seem like a distant ideal state, to be only achieved by strictly following Toyota’s Format. It hardly details into specific cases of implementation of the Toyota Way, such as a High-Mix, Low-Volume environment at Boston Scientific.
4.8.2 The Toyota Way Fieldbook
The Toyota Way Fieldbook is written by Toyota veteran Jeffrey Liker, in partnership with David Meier. The Fieldbook is described by Toyota Manager John Shook as a “compass to set direction and help you steer your own course.” Self claimed as “A Practical Guide to Implementing Toyota’s 4Ps (Liker, Meier)” it is written to complement The Toyota Way by offering certain specific advises and tools used to help in the transition. Thus, it goes one step further than the Toyota Way; it still leaves a lot of room for interpretation formed by years of experience. In addition to emphasizing the different types of methods presented in The Toyota Way, it provides several other methods and tools used for the implementation of the Toyota Production System. Sticking true to the Toyota ever-changing philosophy, the authors clarify that they are “trying to offer some of the lessons we learned through trying to get organizations to become lean learning organizations (Liker, Meier,14)”.
After the first part which is a brief introduction, the outline of the book follows Toyota´s 4P model introduced in The Toyota Way. Each chapter is dedicated towards a different principle of the Toyota Way. Thusly the second part of the book is focused on the Philosophy of the Toyota Way. It emphasizes and presents several different tools for establishing the culture and philosophy which is the main emphasis of the Toyota Way. The book is outlined based on the
Toyota 4P system: Philosophy, Process, People and Partners, and Problem Solving. As arequirement to properly adapt lean initiatives in the company, it is clear that the right culture has to be in place. Thusly, this chapter serves a great purpose in benchmarking BSC’s culture to see if it has the right mindset or culture to start tackling process improvement tools. Rightly enough, BSC can be categorized as having the right culture to implement value stream mapping. Most employees take the example set by top management and adapt it to form their own culture. This fact makes the company highly flexible and a learning organization. In addition it is a culture highly focused on continuous improvement. The company has a very rigorous structure to support this culture of continuous improvement.
The second part of the book starts to build on the second P of Toyota´s 4P system: Process. This second part describes Value Stream Mapping somewhat yet it fails to capitalize on the full effects of Value Stream Mapping described in other literature. The description of Value Stream Mapping is thusly made in a very general sense. As such, a first time novice in the realm of Value Stream Mapping might not completely understand the concept by reading into the chapter. Yet it provides several important guidelines to implementing Value Stream Mapping that might have been over looked by other literature such as:
• Having management lead the Value Stream Mapping Initiative. This proves to be quite useful because they can generally obtain all the necessary information quite easily. In addition, working on the Value Stream Map will give them a good view of the process so that all the management understands. During the execution of Value Stream Mapping at Boston Scientific, this step could not be implemented. Management did not have time to engage in Value Stream Mapping. This made it difficult for them to identify possible improvements by simply looking the Value Stream Map.
• Avoid using the Current State Map just for Point Kaizen. The real power of Value Stream Mapping is to increase the flow throughout the entire line. Therefore one must avoid simply seeing particular processes that need to be improved.
• Having someone with deep Lean Expertise facilitate the Future State Map. In the Boston Scientific Internship, it was identified that many people could look at the Value Stream Map and propose different initiatives to improve the process, yet many times they were not Lean and did not provide long-term benefits. This helps ensure that VSM is used as a lean tool.
• The purpose of mapping is action. This clarifies that all improvements suggested for the Future State should be accompanied with a detailed action plan to ensure that it gets implemented.
Several topics in the book also help clarify about Value Stream Mapping and its function such as to “see linked chains of processes and to envision future state value streams.” The book also provides an interesting point in that it critiques Value Stream Mapping into making people feel like they are doing Lean simply by drawing a bunch of pictures.
The book continuous with its usefulness of Value Stream Mapping by guiding the implementation of several Value Stream Mapping improvements, such as the implementation of continuous flow in stages as detailed in the picture below:
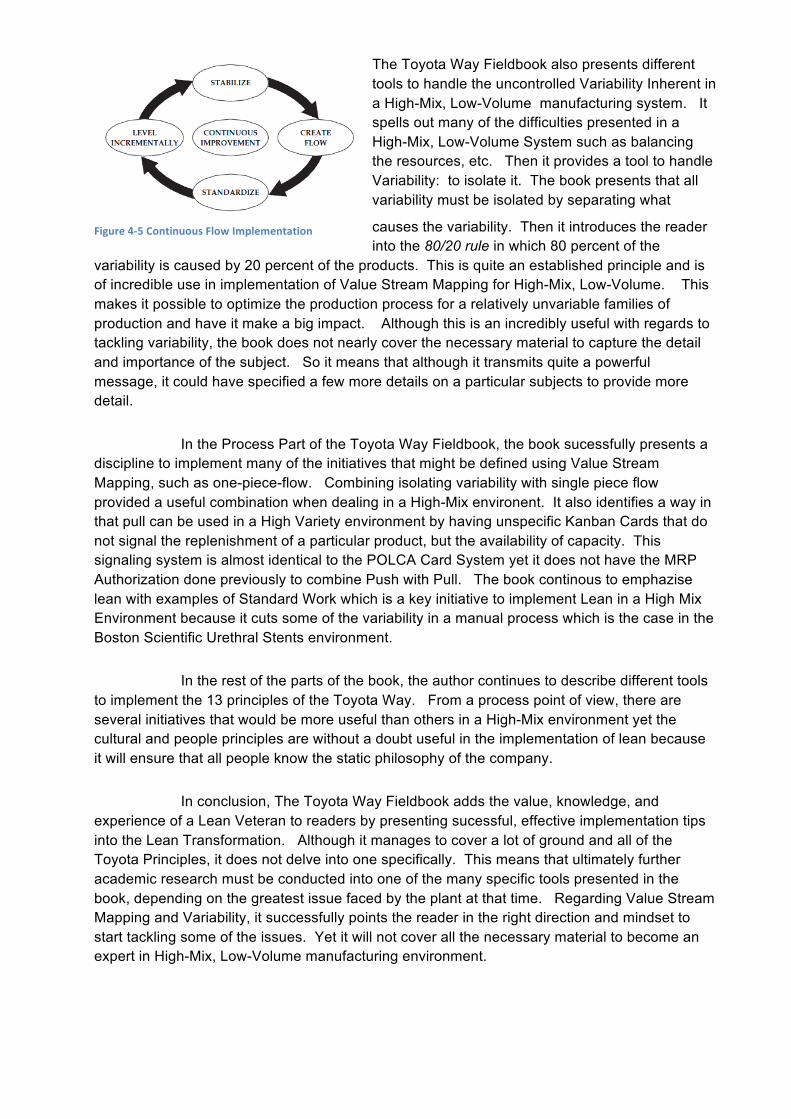
The Toyota Way Fieldbook also presents different tools to handle the uncontrolled Variability Inherent in a High-Mix, Low-Volume manufacturing system. It spells out many of the difficulties presented in a High-Mix, Low-Volume System such as balancing the resources, etc. Then it provides a tool to handle Variability: to isolate it. The book presents that all variability must be isolated by separating what
causes the variability. Then it introduces the reader into the 80/20 rule in which 80 percent of the
variability is caused by 20 percent of the products. This is quite an established principle and is of incredible use in implementation of Value Stream Mapping for High-Mix, Low-Volume. This makes it possible to optimize the production process for a relatively unvariable families of production and have it make a big impact. Although this is an incredibly useful with regards to tackling variability, the book does not nearly cover the necessary material to capture the detail and importance of the subject. So it means that although it transmits quite a powerful message, it could have specified a few more details on a particular subjects to provide more detail.
In the Process Part of the Toyota Way Fieldbook, the book sucessfully presents a discipline to implement many of the initiatives that might be defined using Value Stream Mapping, such as one-piece-flow. Combining isolating variability with single piece flow provided a useful combination when dealing in a High-Mix environent. It also identifies a way in that pull can be used in a High Variety environment by having unspecific Kanban Cards that do not signal the replenishment of a particular product, but the availability of capacity. This signaling system is almost identical to the POLCA Card System yet it does not have the MRP Authorization done previously to combine Push with Pull. The book continous to emphazise lean with examples of Standard Work which is a key initiative to implement Lean in a High Mix Environment because it cuts some of the variability in a manual process which is the case in the Boston Scientific Urethral Stents environment.
In the rest of the parts of the book, the author continues to describe different tools to implement the 13 principles of the Toyota Way. From a process point of view, there are several initiatives that would be more useful than others in a High-Mix environment yet the cultural and people principles are without a doubt useful in the implementation of lean because it will ensure that all people know the static philosophy of the company.
In conclusion, The Toyota Way Fieldbook adds the value, knowledge, and experience of a Lean Veteran to readers by presenting sucessful, effective implementation tips into the Lean Transformation. Although it manages to cover a lot of ground and all of the Toyota Principles, it does not delve into one specifically. This means that ultimately further academic research must be conducted into one of the many specific tools presented in the book, depending on the greatest issue faced by the plant at that time. Regarding Value Stream Mapping and Variability, it successfully points the reader in the right direction and mindset to start tackling some of the issues. Yet it will not cover all the necessary material to become an expert in High-Mix, Low-Volume manufacturing environment.
Figure 7 -‐ Continuous Flow Improvements Figure 4-‐5 Continuous Flow Implementation
4.8.3 Learning to See
The book, Learning to See, written by Dan Rother, John Shook, Jim Womack and Dan Jones, serves as an introduction to a groundbreaking tool to understand Lean Manufacturing visually, and prioritize improvements. This tool is called Value Stream Mapping. The book served as a revolutionary step in the Lean Implementation Methodology. It takes most of the Toyota Production Principles and breaks them down into 8 easily understandable steps to be drawn out and implemented. The purpose of Value Stream Mapping is to make Lean Manufacturing accessible, and to allow the Lean Leaders to focus away from Process Kaizen, and into Flow Kaizen.
The methodology of the book proposes to map out the entire door-to-door production process using a very specific set of icons to represent different situations in the process as a first step (Rother, Shook, Womack, Jones). The tool proves to have multiple uses, as it also maps out the information flow used to control the production floor. Previous knowledge of Lean Manufacturing combined with this inclusive view of the process that is the Value Stream Map gives an enormous advantage to conventional implementation of Lean. Having a holistic view of the process allows the Lean Leaders to see where the most waste is being created at a flow level. It also provides the user with a very useful tool to visualize the process, present ideas, and propose many other kinds of improvements outside of Lean Manufacturing. Once the first map of the process is completed, or the Current State Value Stream Map, the book then provides 8 steps based on Lean Philosophy and the Toyota Production System to use the map to visualize, prioritize, and implement Lean Manufacturing Initiatives. Using the map and once the 8 steps have been completed on the Current State Value Stream Map, the resulting diagram represents the Future State Value Stream Map. The Future State usually includes several Lean Manufacturing Ideals such as Takt Time, continuous flow, pull systems, small batch size, etc. The Future State represents how the process should operate to be Lean. An outstanding advantage of this tool is that it separates the concept of “Value Added Time”, to “Non-Value Added Time.” As value-added time is the time that the product is going through a process adds value to the product in the form of something that a customer would be willing to pay for. Most of the time, users are stunned when they find out the Value Added Time is, usually around 1% of the total product life cycle. This tool focuses the user on increasing the Value Added Time by focusing on the optimization of flow, as opposed to minor improvements to processes. It diverges focus from a specific singular process, but improving the flow of the entire chain in order to increase the Value-Added Percentage. This represents the most important goal of Value Stream Mapping.
Although Learning to See might be the most informative and useful book ever written about the implementation of Lean Manufacturing, it serves only as a base to truly developing it in a High-Mix, Low-Volume Job Shop environment, and it has several drawbacks. Firstly, the makes would confuse many of its readers into thinking that the implementation of Lean Manufacturing is a simple and easy process, when the reality could not be further from the truth. Although the book does provide a set of tools to effectively map and recognize improvement possibilities, it says very little about the implementation of these initiatives. The actual implementation of many of the initiatives used in Value Stream Mapping represents an enormous investment in time, money, and customer service level. It is a tool that seeks to re-design the entire process, which is an extremely complex task. It also affects many organizations within the company. In addition, it does not emphasize on the background of why each of the Lean Initiatives are implemented in the first place. To truly be able to get the most
use out of the tool, the user should already be an expert in Lean Manufacturing. Therefore, additional literature on Lean Manufacturing such as The Toyota Way is an added advantage to using the tool. Regarding the handling of High Mix, Low-Volume, Learning to See leaves several gaps. Firstly, is the separation of the products into families to Map the Value Streams. It uses a simple 0s and 1 system which is not sufficient to capture the complexity of a High-Mix process. The methodology it does not take into account the variation in the cycle time of the each of the different products that go through the process, making many things such as continuous flow not as possible. In addition, it proves very reasonable for production lines with 1 or 2 product families, but not for the case in the Boston Scientific Urethral Stents line which has approximately 13 production lines, each with more than 10 products.
Secondly, Learning to See fails to be applicable when the process is a Job Shop, in which processes have to be shared with many different product families. It assumes that stations or processes have a constant dedication to a particular product family which is completely untrue for the Urethral Stents line. The distribution of the product families within the process is completely variable month to month. Thirdly, the book emphasizes establishing Pull Systems and Kanban wherever continuous flow is not possible. In a High-Mix production environment, establishing supermarket pull systems is highly unlikely. This is because the supermarket would have to contain inventory of the all of the different products which are 280. This would mean the Work-in-Progress would have to be extremely high to maintain stock of all the products.
Fourth, Learning to See´s “pitch” system proves to be unreasonable in a High-Mix Environment. This is because within families, lot and order size can vary significantly for all of the products. This makes moving to a singular pitch very difficult. The argument could be made that one could use Leveling the Demand to handle such situations, yet it proves to be another reason why defect of Learning to See. Leveling the demand is a relatively simple task when only a few products are produced, however, the task becomes exponentially more complex as the variety of products increases. It is impossible to try to level out all 280 different products so they are run within a certain time frame.
In summary, there are many faults that exist with implementing the Value Stream Mapping methodologies proposed by Learning to See in a High-Mix, Low-Volume Environment. Almost all of these are caused because the methods proposed are rather closed ended. The simple methodology that they propose, although highly valuable in a low-mix environment, takes a closed stance on the implementation of Lean Manufacturing. Being that the most important goal of lean is the relentless pursuit and elimination of waste, the book assumes that the methods proposed will be the ones that yield the minimum waste, an exaggerated assumption. Therefore, to get the best benefits out of Learning to See for High-Mix, Low-Volume, the reader should carefully reflect on each particular point in the book, and decide whether it is the best course of action to truly minimalize waste. This includes items such as supermarket pull systems, pitch, static takt time, and level demand. Furthermore, the benefits of Learning to See can be complemented with many other methods discussed in other literatures in order to truly have the most lean, and most economically feasible process. What is useful for the purpose of this Master Thesis is the actual use of mapping the flow of the process from door to door to be able to visualize the entire process and recognize potential improvement opportunities. In addition, many of the methods proposed can be slightly adapted, such as Takt Time. Whereas the book proposes that there is an ultimate Takt Time that should rule the production rhythm of all processes, they fail to acknowledge the workings of a Job Shop environment, in which
routings and capacity of different stations can vary significantly. For this reason, more advanced techniques can be used such as Variable Takt Time in which every single process is assigned its own Takt Time depending on the demand for that process. In addition Pull Systems in Job Shop environments can only be implemented before the product variety is unleashed. For example, at the Boston Scientific plant, product variety comes in three forms: material, length, and French. Whereas only approximately 80 subassemblies exist before the material is cut to its right length, this number can increase to well over 550. Therefore, implementing expensive supermarkets is an unlikely move.
4.8.4 Creating Mixed Model Value Streams
Written by Kevin J. Duggan, Creating Mixed Model Value Streams serves as a very useful extension to Learning to See. It also deals with the implementation of Value Stream Mapping, yet it goes into more specific detail regarding the implementation of it in more complex manufacturing environments. It uses the Value Stream Mapping foundations, and elaborates on them to make the tool adaptable when situations arise that provide difficulty. More specifically, it adds a set of specific tools to Value Stream Mapping to deal with three main issues present in most manufacturing plants:
• High Product Mix: the book focuses on the special handling of manufacturing environments with a High Product Mix, such as the Boston Scientific Urethral Stents Line. Especially the difficulty of creating flow, the discomfort of shared processes, and the lack of visibility in the line.
• Shared Resources: The book seeks to diverge the user from constantly thinking of high equipment utilization as the ultimate goal. It tries to diverge the user from process optimization, into flow optimization.
• Information Flows: the book tackles the subject of the difficulties of information flow in the production line. The large number of orders that are open at a certain time, the by the minute counts all add to the chaos in High Mix Environments.
Like Learning to See, the book focuses all of its methodology on an example within a specific situation in a manufacturing plant. They follow the implementation of its methods throughout the plant in the book. At the plant, EMC Supply, the situation starts with a familiar environment. Chaos is faced throughout the floor. The operators do not know the sequence of the production plan, and there are few controls in place. It then goes into a detailed analysis of the definition of mixed model production, in which a High Variety, High Customization environment are faced with enormous challenges as they can produce totally different sets of products. In addition, like Learning to See, the methodology in the book is broken down into a particular set of implementation questions as follows:
Question 1: Do We Have the Right Product Families.
The methodology proposed to handle product families starts off by completing a Product Matrix, much like the one proposed in Learning to See. However, the book proposes several tools to refine the product families. Firstly, it takes into account alternate processes, or process which do not form part of the usual product routing. Secondly and most importantly, it takes into
account cycle times into forming families. This is very important because although two products may have similar routings, their requirements through a particular process might vary significantly. It also proposes several tips for the actual “mapping” of the families such as mapping only the main branch first, etc. The book then suggests dedicating downstream processes to product families in order to have a better control of the process.
Question 2: What is the Takt Time at the Pacemaker?
The book rearranges the Lean Concept of scheduling production only at one point, to define Takt Time for High Mix. Given the assumption that there is a set of downstream processes totally dedicated to product families, one can implement the use of TAKT time to control the dedicated processes. It proposes a manner similar to Learning to See and The Toyota Way in which the demand is prorated at the total available production time. This an very important Lean Principle since it is the metronome that should control the rate of production at the dedicated processes.
Question 3: Can the Equipment Support the Takt Time?
This step is to align the available capacity of the dedicated downstream lines to the actual requirements given by the Takt Time. Once the production rhythm is calculated by using the actual customer demand, one must make sure to have enough production capacity to meet the actual demand. This is done by taking a simple cycle time of the different processes, and comparing them to the product family takt time. The book takes into consideration the downtime caused by problems with the equipment and the addition of more equipment, should the current situation not have enough capacity.
Question 4: What is the interval?
The interval is defined as shortest length of time in which a given production process can produce every single one of the possible products, and meet the total demand. Large Intervals are usually caused by long changeover times. The methodology aims to shorten the interval in order to more accurately replicate the customer demand mix. The book then proposes several alternatives in order to be able to reduce the interval such as reducing the changeover time, reducing the cycle time, improving the uptime, and using overtime.
Question 5: What are the Operator Balance Charts for the Products?
The book then uses the concept of an operator balance chart, to map out all of the operations that are going to be run continuously through a dedicated process. This consists of breaking down all the specific work elements for a particular process, and leveling them throughout the operators to be able to product closely to the Takt Time. This tool also serves to identify potential bottlenecks in the dedicated line. This particular tool is used within Boston Scientific by the name of a Work Content Graph. It has several other additions. This tool can be modified by the concept of variable takt time to adapt it not only to the dedicated process, but also to the job shop environment.
Question 6: How will we balance the flow for mix?
The book proposes several different ways of adapting the demand leveling tools of Lean Manufacturing in order for use in a High-Mix environment. The more common of these is using a finished goods supermarket, leveling the schedule and build ahead, combining supermarket and FIFO, and balancing each product to the mix takt time with a small supermarket for each product family.
Question 7: How will we Create Standard Work for the Mix?
The book then presents the important concept of Standard Work for High-Mix. Given that there is an initial large amount of variation inherent in a High-Mix, Low-Volume manufacturing environment, all possible controlled variation must be done. This includes elimination of variation in cycle times due to operators performing at different speeds. The book seeks to eliminate this variation by establishing Standard Work, a common Lean Initiative aiming to control all repetitive processes so they are performed exactly the same, all the time. This eliminates the inherent variation.
Question 8: How will we create the Pitch at the Pacemaker?
The concept of Pitch is introduced. Pitch refers to the management time frame which controls the release of the workflows at the Pacemaker. It refers to how often the production output will be measured at the pacemaker to make sure it is producing to Takt. They create the pitch by using a scheduling box, and the material handler to control the input and output of the production line. Pitch is also used to level the volume of work to be produced. Pitch is initially set at the minimum time it takes to create a pack, or lot, or groupings of units.
Question 9: How will we Schedule the Mix at the Pacemaker?
Scheduling the mix means how to deal with the fluctuations in cycle times within the products to schedule them in the system. The book suggests using a set of Mix Logic Flow Charts to guide decision making in scheduling the mix. Such charts will allow the user to easily see if the capacity will be met, or if further changes need to happen, like working over time, etc.
Question 10: How will we deal with Changes in Customer Demand?
The final question deals with the most frequent changes in customer demand. Such changes affect takt time, and thus might create overproduction and waste. Being that in a high-mix environments, requirements by family can vary significantly, a plan needs to be in place to deal with such changes. The most common is to fluctuate the amount of workers to keep the line producing. To do this, the Work Content must be constantly checked and updated to distribute it evenly within the workers.
Summary: The book provides many helpful ideas to control and improve over many common issues faced with High-Mix Production Lines. Especially at the planning phase, the reader can feel confident that they are using the best practices example to control their production system. It proposes many fine points to eliminate waste. However, the books content lacks in several points:
1) It is too overly relying on the use of dedicated lines in the downstream process. This might not even be a possibility with many high-mix production lines. In addition, most of the questions in the book deal with the optimizing of this dedicated line of downstream processes. So in reality, the most important tool they mention to control the high-mix in the production system is to separate it into different processes, and then control them exactly how you would control a regular high-volume process. They rarely mention the control of the production upstream, where the processes are shared by many products. Although at the Boston Scientific Urethral Stents line, they were in fact able to have dedicated product family lines upstream, most of the process is still run in a job shop environment, which can be quite chaotic. The book does not provide any tools to minimize waste upstream from the Pacemaker.
2) They lack specific tools to deal with the High Mix. For example, they suggested many tools which are not specific to High-Mix, but just well-established concepts. Such is the case with Standard Work, Leveling Production, and Pitch. So many of the concepts proposed could have simply been inferred using Learning to See or Toyota Way methodology.
3) Like Learning to See, it relies to heavily on an almost ideal situation presented in a book. Any deviation from the situation presented would simply cause confusion amongst the reader. It does not propose alternatives.
In conclusion, Creating Mixed Model Streams presents several great ideas that can have a big impact on the improvement of a job shop environment, yet they need to re-focus their strategy.
4.8.5 Made-‐to-‐Order Lean
Made-to-Order Lean, Excelling in a High-Mix, Low-Volume Environment written by Greg Lane is a practical toolset be help in the elimination of waste in a manufacturing environment composed of a High-Product Mix. The book starts is a continuation into Lean strategy, thusly it assumes that the reader has a basic knowledge of Lean Manufacturing which can be acquired by reading The Toyota Way, the Toyota Way Fieldbook, or Learning to See. The book is divided into different chapters that deal with potential tools to be used in improve job shop environments.
The first lesson covered in the book, which is highly relevant to the Boston Scientific Urethral Stents environment, is the emphasis on quality. As quality is defined as the most important metric in Boston Scientific, the book emphasizes on this point. They suggest that before any Lean Implementation, firstly the process has to have an operational level of quality. This is because any defects, reworking, or quality incidents can greatly affect the outcome of a carefully balanced process which is usually the case for a Lean Process. Lean Processes are meant to run Just-in-Time, with just enough capacity to produce the necessary products, and get them where they need to be at the right time. Any quality incident could greatly impact such a process and cause chaos. This particular point is not emphasized with enough importance in other Lean Manufacturing books.
The first chapter focuses on the importance of using visual aids to control the production. Firstly, visual aids should be used to tightly control the right metrics used by the plant. By
having all of the metrics constantly displayed in the manufacturing floor, all stakeholders can constantly see the impact of their work, and they more easily understand where to go. They break down the type of visuals into 4 types of boards and begin introducing the concept of a Pareto Chart. Pareto Charts are a highly useful tool to analyze the impact that a particular product mix can have. In the visual aids section, they begin to analyze the use of Value Stream Mapping by suggesting the use of Value Stream Boards to constantly monitor the development of Lean Implementation Projects. They also suggest relying heavily on color indication (especially green, yellow, and red) to communicate the success of an indicator. All of these visual aids are used heavily in Boston Scientific.
Chapter 2 provides with a very detailed and well-thought out implementation guideline for Standard Work. Standard Work, an very common Lean tool can be used to control variability in the process. According to the book, standard work should be completed by relying heavily on the use of auditing, and proposes the engagement of various management levels to get engaged in the auditing. Standard Work, like many Lean Initiatives relies heavily on the right dissemination and culture. Therefore, this engages all of the stakeholders in the process.
Chapter 3 is focused on a very important part of controlling High-Mix, Low-Volume Manufacturing Environments by Associating a Time with All Work. This is a highly crucial activity to control a Job Shop Environment because it improves:
1. The ability to schedule 2. Product Costing from greater understanding of process 3. Ability to confirm accuracy of estimates 4. Productivity Increase of 10-15% by having the workers strive for a target.
Carefully measuring the cycle and process times for all processes is a crucial step to start controlling and understanding the real capacity. It serves as a baseline to start comparing cycle times to takt times. The book also proposes several methods to cut the time needed to measure the cycle times for all of the products by grouping the measurement into families and only taking a small sample. By assigning standard times to all processes and products, deeper understanding into the accurate scheduling is obtained.
In Chapter 4, day-by-hour and FIFO boards are introduced as a way to keep track and control the orders on the production floor. It provides as a way of monitoring. Day by hour boards are meant to set specific targets to different processes each hour. Using day-by-hour boards serves as a simple way to constantly track production output. For handling process in which there are many possible routings, they suggest the use of First in, First Out Boards. They are used to know the amount of orders which are waiting for processing at a specific process. Many of these boards can be used in combinations be bring unparalleled control to the production floor.
Chapter 5 gives several tips to make when the production capacity is falling short. They propose the use of common Lean and other manufacturing techniques such as SMED, Bottleneck Analysis, or increasing machine speeds. It is basically a set of tips that any manager can do to quickly improve the process when capacity is falling short. For the Boston Scientific Urethral Stents environment, they propose a very useful tip by suggesting the use of dedicated material handlers to assemble all tools, materials and consumables. This focuses the operator´s time on producing.
Chapter 6 delves into a set of tips to improve a process when there is excess capacity, such as the use of cross-training, rearranging skill sets, and the deep study of several processes. These tips are not applicable to the Boston Scientific environment where capacity barely meets the requirement.
The next chapter focuses on giving several hints for the implementation of Value Stream Mapping in a Job Shop Environment. They propose several ways of dealing with the complications of Low-Volume manufacturing. They emphasize the mapping of product families, yet they do not provide any tips for the separating of the families. They also focus the use of Value Stream Mapping to optimize the high-running parts and isolate variability. It proposes mapping the general processes for high running parts, or using different Value Stream Maps for different parts. Besides these four general tips, it barely provides an essence of the different tools concerned with Value Stream Mapping such as Takt time, material flow, FIFO, Pull, and single point scheduling. Yet it provides some useful tips. It suggests the use of Pull Systems for some of the processes, yet using pull for some of the other processes. This is because in a High Mix manufacturing plant, having stock of all of the different products would be highly expensive. In later chapters in the book, they suggest a hybrid method of kanban and MRP to be able to properly handle materials. The system focuses on using Kanban for High Running parts, and analyzing the cost of setting up supermarket pull systems for medium and low-runners.
Made-to-Order Lean serves as a great addition for a Lean repertoire. It explores many different tips that can be implemented in a High-Mix, Low-Volume manufacturing plant. However, the scope of the book is meant to be simply a tip book, and not a detailed solution to the problems faced within a High-Mix plant. Like many other Lean books, it mentions little about the implementation drawbacks or guidelines. This fact might leave the reader somewhat confused. In addition, it covers too many topics with very little detail which makes it difficult to extract value from it. In addition, many of the tips or tools that they suggest to implement are general Lean tools, not specific to High-Mix, Low-Volume manufacturing plants. Although the importance of these tools is largely recognized, tools such as Standard Work, 5S, and SMED are very general Lean initiatives that are covered to a much greater detail in The Toyota Way, Learning to See, or other literature. A separate chapter for the implementation of these is unnecessary for the focus on the book. The book is organized by sets of tools for improvement with usually a few tips section at the end of the chapter to cover tips to handle each tool in a High-Mix, Low-Volume manufacturing plant. This means each chapter has very little dedication to the particular subject of High-Mix manufacturing, and is focused on general implementation of Lean. For example, in Chapter 7 concerning Value Stream Mapping, there are 10 pages developed. However, the most of the pages concern a very general approach for Value Stream Mapping and only half of one page is concerned with the High-Mix, Low-Volume implementation of Value Stream Mapping. In addition, the tips given are very basic and might even be considered common sense. They particularly do not any value.
Made to Order Lean also is quite a simple book. They do not explore advanced or state-of-the art topics in manufacturing which makes the book of low value from an academic point of view. All of the tips suggested in the book are written so a novice manufacturing employee can understand. The book should assume more experience or expertise from its readers in order to develop advanced concepts and add value to the overall knowledge of Lean Manufacturing
4.8.6 Quick Response Manufacturing
To expand the optimization of processes beyond the realm of Lean Manufacturing, it should be a priority to explore solutions outside of it. One manufacturing philosophy that provides very good use for Job Shop environments is the use of Quick Response Manufacturing, and its POLCA card system. Quick Response Manufacturing is defined as the management philosophy concerned with the relentless reduction of lead times (Suri, 20). It is built upon the assumption that Lead Time is currently one of the differentiating factors in competitive advantage for the new century. They mention the success of companies such as Dell, Zara, and other companies that have been successful by making all of their processes streamlined and fast. In addition to providing competitive advantage, cycle time reduction affects many different costs of capital tied into having large amounts of Work-in-Progress. They share some similarities with Lean Manufacturing. They both are concerned with lowering Lead Times, yet in Lean Manufacturing, this is ultimately seen as a step in order to reduce Waste. With QRM, eliminating waste comes as a byproduct of the ultimate goal which is to reduce lead times as much possible. One big difference with QRM, as it is concerned with ultimate Lead Time reduction, they suggest producing product with a 80% capacity (Suri , 15). Having the extra capacity can contantly release products as fast as possible. They believe that the investment given by producing to 80% can pay itself many times over in increased sales, and higher quality. They also diverge from common assumptions to have goals of “on-time delivery” and focus on being as fast as possible. Most importantly, the book proposes a tool specifically made for Job Shop environments called Paired-Cell, Overlapping Loop of Cards with Authorization (POLCA Cards). This system combines elements of push and pull to have an unspecified method with coordinates the authorization of an MRP system, with a pull to signal excess capacity and the release of a particular concept.
Although many of the tools proposed in QRM are highly contradictory to standard manufacturing beliefs, the implementation can be hard to convince directors, managers and stakeholders regarding the use of this philosophy. Which is why specifically they develop extensively on the need to implement QRM as a companywide initiative relating to all processes, both business and manufacturing, in the company.
The first three chapters of the book are focused on introducing the basics of Quick Response Management, the history, and why it is so important. Suri introduces the benefits of QRM for many different cases. The main benefits are proposed as follows:
• Quicker Response in Product Introduction • Quicker Response in Existing Production • Mimimizing of waste due to Long lead Times and Late Deliveries • Larger amount of orders won with QRM • Forward is forearmed: which is the way in which QRM should be implemented. In many
cases, QRM initiatives have been scrapped within a year of implementation because of the high overhead costs incurred in the implementation process. The author suggests to analyze and study all of the costs up front, and communicate them with finance. In other words, get prior approval from the financial department to undertake QRM. (Suri)
The third chapter focuses on The Response Time Spiral. Suri mentions how competitive advantage has been changing in manufacturing since the beginning of scientific manufacturing.
The first competitive advantage was scale, with giants such as Ford producing one type of product in enormous quantities, thus taking advantage of economies of scale. Then it transformed to cost competition, where manufacturers produced the cheapest product possible, making a sacrifice on quality in the meantime. While such stratagies as scale and cost competition laid down the foundations of most manufacturing companies today, competition evolved to two other characteristics: Quality, and most recently, Speed competition. It is the speed competition which is the focus of QRM. The response time spiral is introduced as the magnifying negative effect that long lead times can have operational difficulty. In many types of companies, having long lead times means that you have to plan very far in advance. The long planning lapse will only lead to more inaccuracies, and will increase the need for large amounts of inventory. This is why the book focuses on eliminating the response time spiral altogether, with QRM initiatives.
The fourth and fifth chapters delve deeper into the use of manufacturing cells as the correct layout for QRM. This will change the basis of tasks, processes, and equipment from a functional, to a product basis. By putting together manufacturing cells which might cause key departures from cost-based strategy, there will be unparalleled success in the form of specialization and efficiency. The author suggests that cross training, is an essential tool for the implementation of manufacturing cells. The benefits of manufacturing cells are proposed as follows:
• Simple and clear product flow, leading to high visibility of jobs and ease of control • Reduction in material handling, which not only cuts down on time and cost, but can also
reduce the defects caused by frequent handling and movement. • Job enrichment, leading to increased worker satisfaction. • Ownership combined with cross-training and frequent communication, leading to
continous improvement efforts, which reduce non-value-added activities such as setups and down times, and also improve productivity through process improvements.
• Better quality and reduction of rework. • Decentralization of detailed scheduling and control, leading to simpler central systems
that have a greater chance of success in their tasks. • Ability to run small batches, which, combined with proximity of operations and transfer
batching, result in short lead times and low WIP.
The author also proposes an implementation system for celullar manufacturing which takes into account several of the mishaps that might occur with the implementation of manufacturing cells. In chapter 6, the book also establishes the need for creative rethinking of processes to establish manufacturing cells. Many of the ways that traditional processes are made have to be challenged. They suggest tools such as time-sliced virtual cells, operating contractor cells, and the splitting of cells. In essence, all processes have to be re-thought out to design new processes.
The book also proposes a very particular and effective point which is the result of lead time, with regards to utilization. As utilization for machines and people gets closer to 100% the increase in lead time is magnified exponentially. They diverge from traditional tools such as EOQ since it has hidden errors since it does not take into account factors such as:
• Costs of poor quality
• Costs of obsolence or engineering changes • Costs of long lead times • Market value of responsiveness • Costs of a growing response time spiral
The importance of these tools is presented with extra focus since the book includes industry studies which show that most managers do not have a well thought out intuition for key decisions on lead time, or the impact of lot size in lead time.
Chapter 8 presents a most interesting tool developed for the control of production orders in a Job Shop, highly customized environment called POLCA (Paired-Cell Overlapping Loop of Cards with Authorization) cards. POLCA cards are a method of control which puts together the advantages of both push, and pull systems. The chapter stats on a reflection and critique of traiditional pull systems. They claim that they have several disadvantages such as:
• Inability to handle custom jobs. • Proliferation of WIP when product variety is high • Late shipments in a growing market • Late shipments and excess inventory when product mix is changing • Shifting bottlenecks and complexity of kanban settings when mix is volatile.
In addition, they state that the main disadvantage of push systems in high variety environments is that it promotes overproductions and relies to heavily on the forecasts and predictions which get enourmously complex with High-Mix, Low-Volume environments.
4.8.7 Value Network Mapping
Value Network Mapping is a methodology developed by Shahrukh Irani and ZahirAbbas N. Khaswala that targets the same kind of problems in this master thesis, yet proposes an uneven solution to for Value Stream Mapping for High-Mix, Low Volume. The authors take as a base, the Value Stream Mapping methodology proposed in Learning to See, and focus on many different steps to undertake before the Current State Value Stream Map. That is, after the Families Definition stage. It tackles several different issues faced by many Job Shop Environments to better understand and map many of the processes. The methodology seeks to create several different unique toolsets that expand the focus of Value Stream Mapping from process visualization, into space utilization, process dependency, and mix planning. It goes beyond traditional Value Stream Mapping approaches in that it relies heavily on computer aided tools to optimize processes. The essay proposes that Value Stream Mapping is lacking in the following areas:
• Fails to map multiple products that do not have identical manufacturing routings or assembly process flows.
• Fails to relate Transportation and Queuing delays, and changes in transfer batch sizes due to poor plant layout and/or material handling, to operating parameters (ex. Machine cycle times) and measures of performance (ex. Takt time) of the manufacturing system.
• Lacks an economic measure for “value” such as profit, throughput, operating costs, inventory expenses, etc. unlike Flow Process Charting technique used by Industrial Engineers.
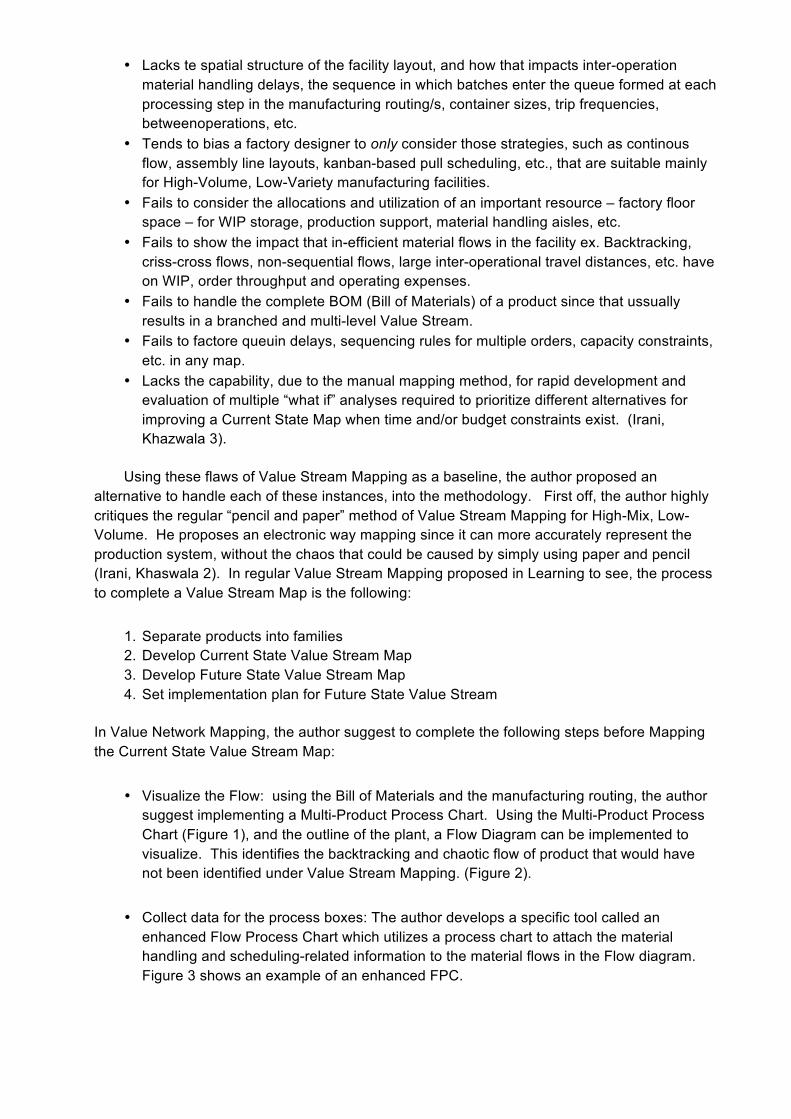
• Lacks te spatial structure of the facility layout, and how that impacts inter-operation material handling delays, the sequence in which batches enter the queue formed at each processing step in the manufacturing routing/s, container sizes, trip frequencies, betweenoperations, etc.
• Tends to bias a factory designer to only consider those strategies, such as continous flow, assembly line layouts, kanban-based pull scheduling, etc., that are suitable mainly for High-Volume, Low-Variety manufacturing facilities.
• Fails to consider the allocations and utilization of an important resource – factory floor space – for WIP storage, production support, material handling aisles, etc.
• Fails to show the impact that in-efficient material flows in the facility ex. Backtracking, criss-cross flows, non-sequential flows, large inter-operational travel distances, etc. have on WIP, order throughput and operating expenses.
• Fails to handle the complete BOM (Bill of Materials) of a product since that ussually results in a branched and multi-level Value Stream.
• Fails to factore queuin delays, sequencing rules for multiple orders, capacity constraints, etc. in any map.
• Lacks the capability, due to the manual mapping method, for rapid development and evaluation of multiple “what if” analyses required to prioritize different alternatives for improving a Current State Map when time and/or budget constraints exist. (Irani, Khazwala 3).
Using these flaws of Value Stream Mapping as a baseline, the author proposed an alternative to handle each of these instances, into the methodology. First off, the author highly critiques the regular “pencil and paper” method of Value Stream Mapping for High-Mix, Low-Volume. He proposes an electronic way mapping since it can more accurately represent the production system, without the chaos that could be caused by simply using paper and pencil (Irani, Khaswala 2). In regular Value Stream Mapping proposed in Learning to see, the process to complete a Value Stream Map is the following:
1. Separate products into families 2. Develop Current State Value Stream Map 3. Develop Future State Value Stream Map 4. Set implementation plan for Future State Value Stream
In Value Network Mapping, the author suggest to complete the following steps before Mapping the Current State Value Stream Map:
• Visualize the Flow: using the Bill of Materials and the manufacturing routing, the author suggest implementing a Multi-Product Process Chart. Using the Multi-Product Process Chart (Figure 1), and the outline of the plant, a Flow Diagram can be implemented to visualize. This identifies the backtracking and chaotic flow of product that would have not been identified under Value Stream Mapping. (Figure 2).
• Collect data for the process boxes: The author develops a specific tool called an enhanced Flow Process Chart which utilizes a process chart to attach the material handling and scheduling-related information to the material flows in the Flow diagram. Figure 3 shows an example of an enhanced FPC.
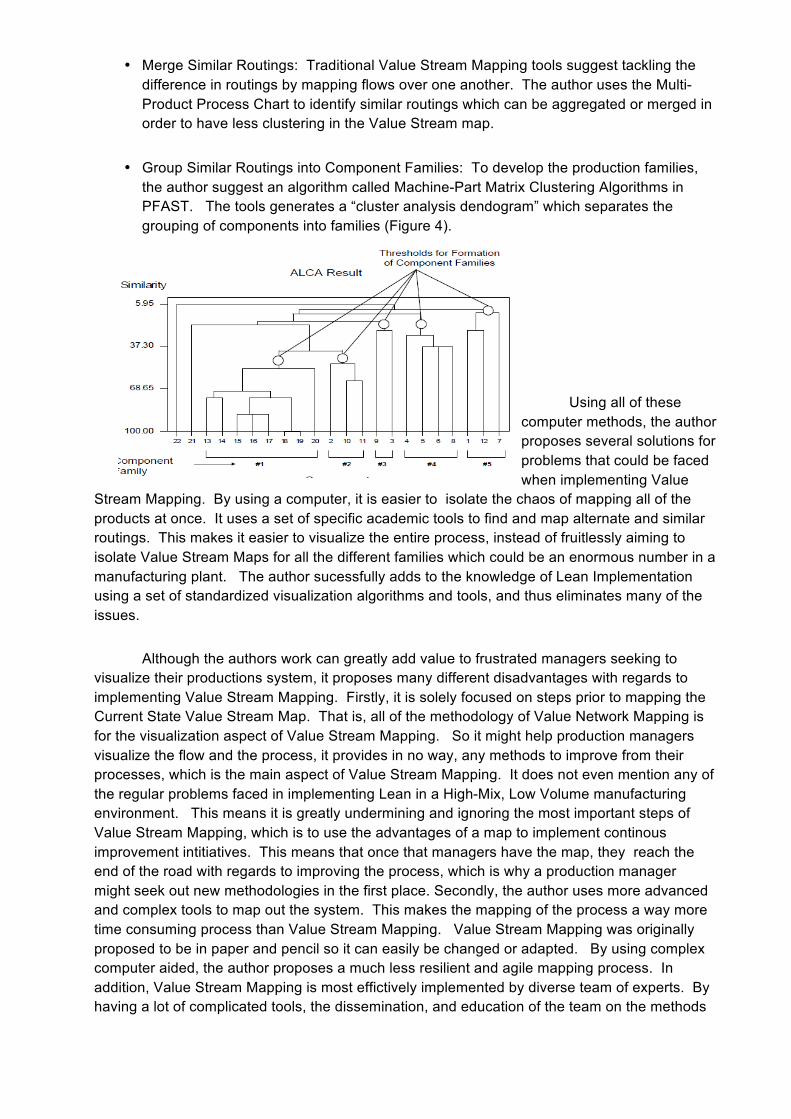
• Merge Similar Routings: Traditional Value Stream Mapping tools suggest tackling the difference in routings by mapping flows over one another. The author uses the Multi-Product Process Chart to identify similar routings which can be aggregated or merged in order to have less clustering in the Value Stream map.
• Group Similar Routings into Component Families: To develop the production families, the author suggest an algorithm called Machine-Part Matrix Clustering Algorithms in PFAST. The tools generates a “cluster analysis dendogram” which separates the grouping of components into families (Figure 4).
Using all of these computer methods, the author proposes several solutions for problems that could be faced when implementing Value
Stream Mapping. By using a computer, it is easier to isolate the chaos of mapping all of the products at once. It uses a set of specific academic tools to find and map alternate and similar routings. This makes it easier to visualize the entire process, instead of fruitlessly aiming to isolate Value Stream Maps for all the different families which could be an enormous number in a manufacturing plant. The author sucessfully adds to the knowledge of Lean Implementation using a set of standardized visualization algorithms and tools, and thus eliminates many of the issues.
Although the authors work can greatly add value to frustrated managers seeking to visualize their productions system, it proposes many different disadvantages with regards to implementing Value Stream Mapping. Firstly, it is solely focused on steps prior to mapping the Current State Value Stream Map. That is, all of the methodology of Value Network Mapping is for the visualization aspect of Value Stream Mapping. So it might help production managers visualize the flow and the process, it provides in no way, any methods to improve from their processes, which is the main aspect of Value Stream Mapping. It does not even mention any of the regular problems faced in implementing Lean in a High-Mix, Low Volume manufacturing environment. This means it is greatly undermining and ignoring the most important steps of Value Stream Mapping, which is to use the advantages of a map to implement continous improvement intitiatives. This means that once that managers have the map, they reach the end of the road with regards to improving the process, which is why a production manager might seek out new methodologies in the first place. Secondly, the author uses more advanced and complex tools to map out the system. This makes the mapping of the process a way more time consuming process than Value Stream Mapping. Value Stream Mapping was originally proposed to be in paper and pencil so it can easily be changed or adapted. By using complex computer aided, the author proposes a much less resilient and agile mapping process. In addition, Value Stream Mapping is most effictively implemented by diverse team of experts. By having a lot of complicated tools, the dissemination, and education of the team on the methods
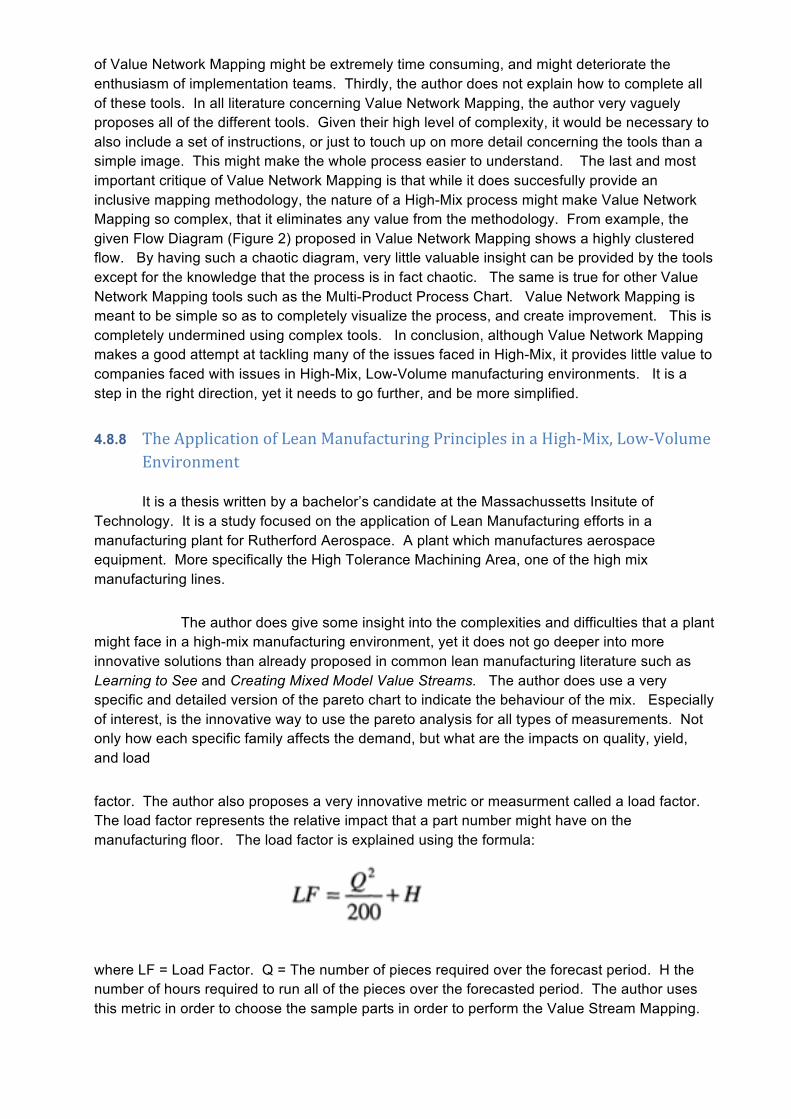
of Value Network Mapping might be extremely time consuming, and might deteriorate the enthusiasm of implementation teams. Thirdly, the author does not explain how to complete all of these tools. In all literature concerning Value Network Mapping, the author very vaguely proposes all of the different tools. Given their high level of complexity, it would be necessary to also include a set of instructions, or just to touch up on more detail concerning the tools than a simple image. This might make the whole process easier to understand. The last and most important critique of Value Network Mapping is that while it does succesfully provide an inclusive mapping methodology, the nature of a High-Mix process might make Value Network Mapping so complex, that it eliminates any value from the methodology. From example, the given Flow Diagram (Figure 2) proposed in Value Network Mapping shows a highly clustered flow. By having such a chaotic diagram, very little valuable insight can be provided by the tools except for the knowledge that the process is in fact chaotic. The same is true for other Value Network Mapping tools such as the Multi-Product Process Chart. Value Network Mapping is meant to be simple so as to completely visualize the process, and create improvement. This is completely undermined using complex tools. In conclusion, although Value Network Mapping makes a good attempt at tackling many of the issues faced in High-Mix, it provides little value to companies faced with issues in High-Mix, Low-Volume manufacturing environments. It is a step in the right direction, yet it needs to go further, and be more simplified.
4.8.8 The Application of Lean Manufacturing Principles in a High-‐Mix, Low-‐Volume Environment
It is a thesis written by a bachelor’s candidate at the Massachussetts Insitute of Technology. It is a study focused on the application of Lean Manufacturing efforts in a manufacturing plant for Rutherford Aerospace. A plant which manufactures aerospace equipment. More specifically the High Tolerance Machining Area, one of the high mix manufacturing lines.
The author does give some insight into the complexities and difficulties that a plant might face in a high-mix manufacturing environment, yet it does not go deeper into more innovative solutions than already proposed in common lean manufacturing literature such as Learning to See and Creating Mixed Model Value Streams. The author does use a very specific and detailed version of the pareto chart to indicate the behaviour of the mix. Especially of interest, is the innovative way to use the pareto analysis for all types of measurements. Not only how each specific family affects the demand, but what are the impacts on quality, yield, and load
factor. The author also proposes a very innovative metric or measurment called a load factor. The load factor represents the relative impact that a part number might have on the manufacturing floor. The load factor is explained using the formula:
where LF = Load Factor. Q = The number of pieces required over the forecast period. H the number of hours required to run all of the pieces over the forecasted period. The author uses this metric in order to choose the sample parts in order to perform the Value Stream Mapping.
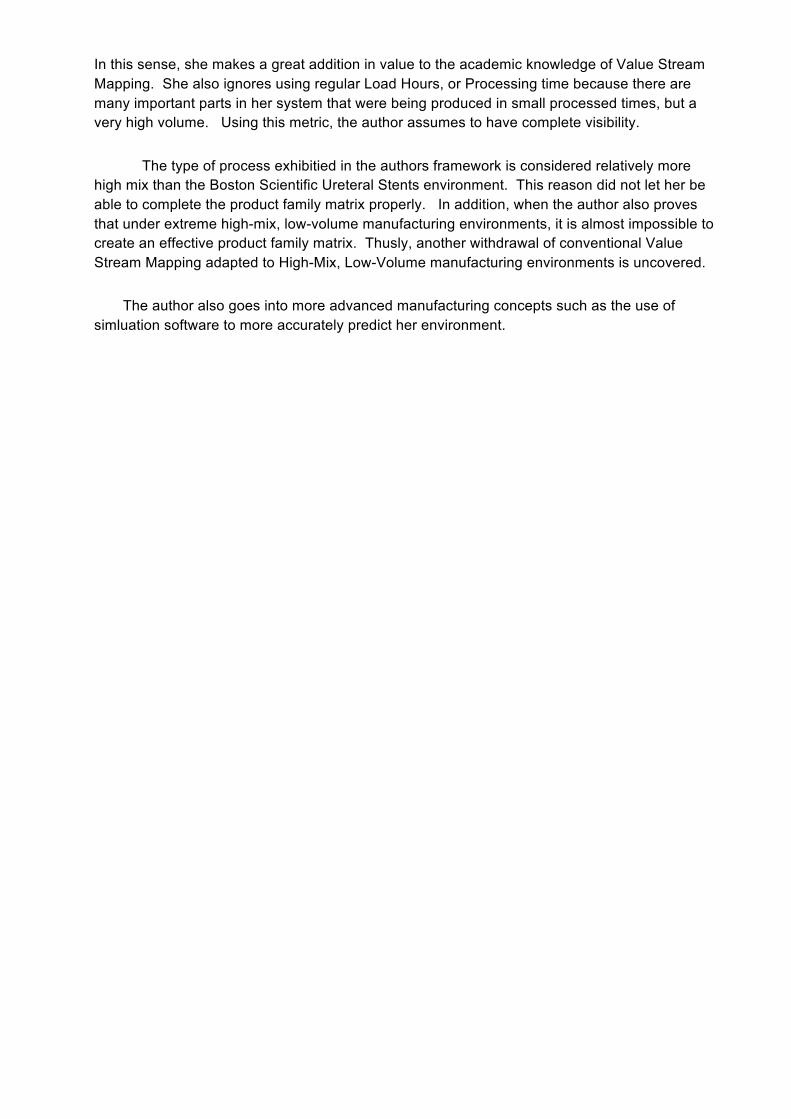
In this sense, she makes a great addition in value to the academic knowledge of Value Stream Mapping. She also ignores using regular Load Hours, or Processing time because there are many important parts in her system that were being produced in small processed times, but a very high volume. Using this metric, the author assumes to have complete visibility.
The type of process exhibitied in the authors framework is considered relatively more high mix than the Boston Scientific Ureteral Stents environment. This reason did not let her be able to complete the product family matrix properly. In addition, when the author also proves that under extreme high-mix, low-volume manufacturing environments, it is almost impossible to create an effective product family matrix. Thusly, another withdrawal of conventional Value Stream Mapping adapted to High-Mix, Low-Volume manufacturing environments is uncovered.
The author also goes into more advanced manufacturing concepts such as the use of simluation software to more accurately predict her environment.
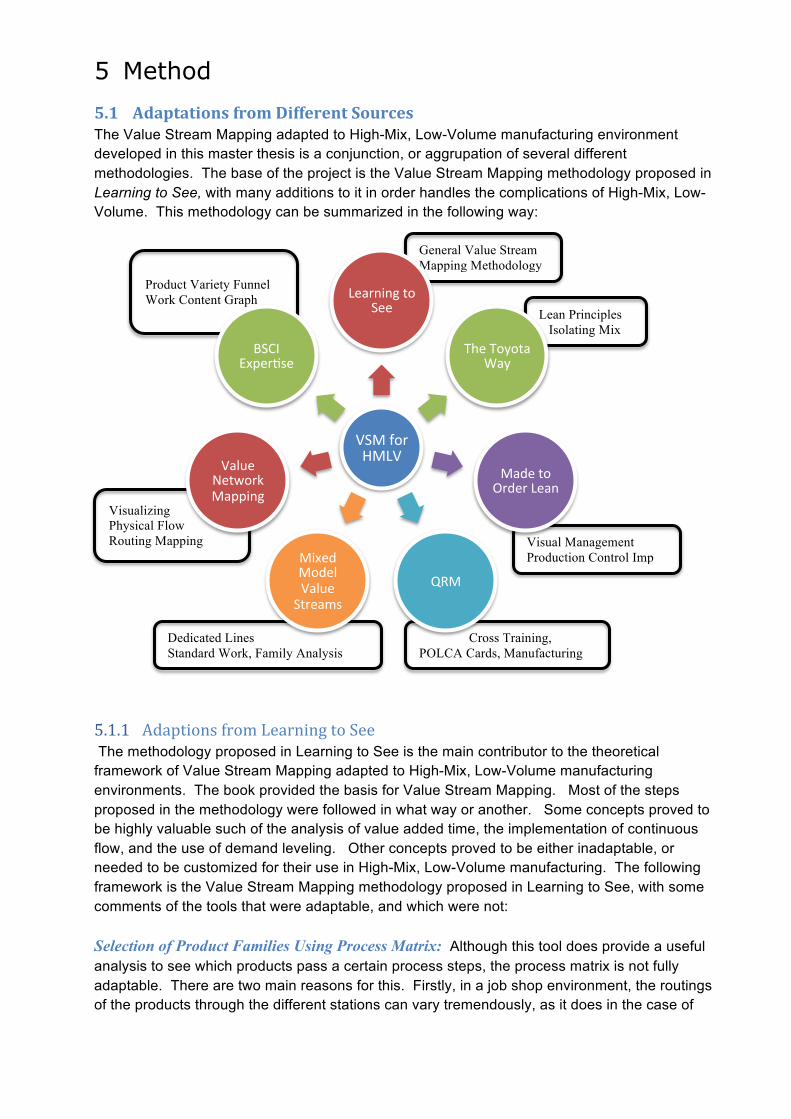
General Value Stream Mapping Methodology
Lean Principles Isolating Mix
Visualizing Physical Flow Routing Mapping
Product Variety Funnel Work Content Graph
Visual Management Production Control Imp
Cross Training, POLCA Cards, Manufacturing Cells
Dedicated Lines Standard Work, Family Analysis
5 Method 5.1 Adaptations from Different Sources The Value Stream Mapping adapted to High-Mix, Low-Volume manufacturing environment developed in this master thesis is a conjunction, or aggrupation of several different methodologies. The base of the project is the Value Stream Mapping methodology proposed in Learning to See, with many additions to it in order handles the complications of High-Mix, Low-Volume. This methodology can be summarized in the following way:
5.1.1 Adaptions from Learning to See The methodology proposed in Learning to See is the main contributor to the theoretical framework of Value Stream Mapping adapted to High-Mix, Low-Volume manufacturing environments. The book provided the basis for Value Stream Mapping. Most of the steps proposed in the methodology were followed in what way or another. Some concepts proved to be highly valuable such of the analysis of value added time, the implementation of continuous flow, and the use of demand leveling. Other concepts proved to be either inadaptable, or needed to be customized for their use in High-Mix, Low-Volume manufacturing. The following framework is the Value Stream Mapping methodology proposed in Learning to See, with some comments of the tools that were adaptable, and which were not: Selection of Product Families Using Process Matrix: Although this tool does provide a useful analysis to see which products pass a certain process steps, the process matrix is not fully adaptable. There are two main reasons for this. Firstly, in a job shop environment, the routings of the products through the different stations can vary tremendously, as it does in the case of
VSM for HMLV
Learning to See
The Toyota Way
Made to Order Lean
QRM
Mixed Model Value Streams
Value Network Mapping
BSCI Experdse
the Boston Scientific Ureteral Stents production environment. This makes it difficult to use the tool. Although the tool might show that two products are of the same family because they go through the same processes, the routing might be completely different. Therefore the mapping of the process would be completely dissimilar for the different products that might have otherwise been grouped into the same family. The second reason why this is difficult is the variance of cycle times within the processes, depending of the product. This means that the matrix might show that two products are of the same family, they might have totally different cycle times. This complication would give several disadvantages when implementing lean improvement initiatives such as continuous flow, or FIFO lanes, where the processes are sensitive to the cycle times inherent in the process. An example of this: These two different inefficiencies in using the product family matrix in a high-mix, low-volume manufacturing environment are discussed further in two other pieces of literature. Most apparently in Creating Mixed Model Value Streams by Jim Duggan, and Value Network Mapping by ZahirAbbas N. Khaswala. To solve the issue of the variance of cycle times, Duggan suggest using the cycle times for each different product in each station to complete the matrix. After the initial matrix has been completed, the xs, or 1s are replaced by the cycle times in order to validate which products do in fact exhibit similar behavior in the processing. Second Step: Mapping the Current State Value Stream Once the families are chosen, mapping the current state of the families is also quite an intricate and abstract task. There are separate views on the way that the diverging and converging value streams should be mapped in a high-mix, low-volume manufacturing environments. Learning to See imposes that the current state should be mapped in the most true and representative way to show the process. The methodology in Learning to See suggest tackling the different routings, the variance in cycle times, and the differences in inventory by mapping the value stream on top of each other. This particular view is challenged by much of the literature thereafter. To understand what the way to use the current state to most optimally extract value from the map, the benefits and value of creating a current state value stream map should be analyzed. What creates value in mapping the current state is the following:
• It makes waste visible and apparent • It diverges the view from process kaizen to flow kaizen. This means that it is used to
see waste past a single process. Whereas there are many manufacturing employees that constantly search on how to improve one particular process, they might be focused on creating flow, and getting the product out of the factory as fast as possible.
• It not only maps out material flow, but also information flow. • It allows users to see the “big picture” of the process in order to better visualize it. • It creates a blueprint for Lean Implementation.
When one analyzes what are the characteristics of the Current State Map which create value, then one can more easily understand the complications in high-mix, or which features of mapping high-mix, low-volume value streams minimize some of the value in mapping the current state. Some of these complications include:
1) With the great number of different routings in a job shop environment, it is very difficult to map out the flow of the operations that is mostly representative of the entire process.
2) The high variance of cycle times depending on the product make it difficult to find what is the best data to put in the data boxes. The data boxes are boxes of information placed next to the station box that contain some of the most important characteristics of that station including the cycle time, the changeover time, the number of operators, and the pitch.
3) Since there is a relatively long lead time, and may open orders at a time, it is very difficult to properly map out the information flow in order to have a fully representative view of the process.
4) There are a great number of processes and operations, which are all run separately as a batch-and-queue operation. For a singular process, there might be over 20 different steps or stations in its routing. By mapping all of these processes, the current state value stream map becomes quite large and clumsy. This makes it more difficult to see waste in an easy or obvious way.
The literature on Value Network Mapping by ZahirAbbas N. Khaswala suggests some useful alternatives to simplify some of these complications. In addition, these complications are elaborated by many authors in most of the literature such as Made to Order Lean, The Toyota Way Fieldbook, and Creating Mixed Model Value Streams. Third Step: Identifying the Future State Value Stream Map The Future State of a Value Stream Map represents the mapping of how a process should run when different lean improvement implementations take place. The methodology proposed in Learning to See elaborates on the steps to create the Future State Value Stream Map, from the Current State. It takes into account the different Lean tools used to minimize waste such as Takt Time, supermarket pull systems, and releasing work at a constant pitch. The following section will outline the 8 different steps to create the Future State and the complications that arise at each of the steps.
1) Producing to your Takt Time. The takt time is defined as the time the maximum time that must elapse between two finished goods in order to meet the customer demand. The formula for takt time is as follows:
𝑇𝑎𝑘𝑡 𝑇𝑖𝑚𝑒 =𝑇𝑜𝑡𝑎𝑙 𝐴𝑣𝑎𝑖𝑙𝑎𝑏𝑙𝑒 𝑃𝑟𝑜𝑑𝑢𝑐𝑡𝑖𝑜𝑛 𝑇𝑖𝑚𝑒
𝐶𝑢𝑠𝑡𝑜𝑚𝑒𝑟 𝐷𝑒𝑚𝑎𝑛𝑑
The concept of having one specific Takt Time that dominates all of the manufacturing processes is almost irrelevant in an environment such as the Ureteral Stents manufacturing line at Boston Scientific. The reason for this is that since each product has different routings, the demand in units of all of the stations is highly variable. Thusly, the concept of a single takt time is most optimally used in a setting where all of the products utilize the same routing. In addition, the needed capacity of a station might vary depending on the product mix that is input into the production line at a given time. At the Boston Scientific Coyol Plan, they define a concept called Variable Takt Time. Variable Takt time is defined as a separate Takt Time for every single process, which represents the number of units that pass through that particular process given the routings. This concept more accurately represents the pace that a given operation should produce too. The problem gets more complex when there is a highly variable mix of products from time to time that creates different capacity needs for the process station.
2) Building to a finished goods supermarket, or straight to the shipping. High-mix, low-volume manufacturing means that there are many product part numbers being manufactured. This makes the question of building to a finished goods supermarket, or straight to shipping, almost obsolete for three main reasons:
a. Creating the WIP to sustain a supermarket pull system that includes all of the part numbers would be very expensive. By having an order of each of the part numbers available at the end of the process would require over 100 orders of
Work in Progress Inventory. This would cost as much as all of the other Work in Progress combined.
b. The great variance in lead-time would make the pull system very difficult to properly replenish. This is due to the fact that there are many different routings available for the process. Whereas a particular part number might go though 10 different stations, another part number might go though over 20 stations! This variance in lead-time would make it very difficult to properly control the finished goods pull system.
c. The fact that the manufacturing operations are settled overseas makes the operation less crucial in terms of cycle time. In the total cycle time of the whole supply chain, the time the materials spend inside the factory is less than 10% of the total lead-time. This shifts the priorities from responding from planning as fast as possible, to reducing Work in Progress by avoiding a supermarket pull system.
Some literature seeks to establish a finished goods supermarket pull system for the high runners, and use a regular push approach to control the low runners. In a very high mix environment, this is unlikely as well, as the high runners that represent over 80% of the production can be up to 60 different part numbers.
3) Where to implement continuous flow. Although this step is particularly relevant for a high-mix, low-volume operation, the problem can be augmented by the following issues.
a. The variance in cycle times depending on the products might create shifting bottlenecks in the process that might make it inefficient. This means that if I one particular product is ran in continuous flow, would have completely separate capacity requirements from each of the stations.
b. The variance in the routings also creates difficulties in establishing constant continuous flow. The reason for this is because certain processes might me joined with continuous flow, there might come a product that has to go through a different series of processes, thus shifting the requirements. Most of the literature attempts several ways to solve this problem such as creating flexible manufacturing cells. Another High-Mix, Low-Volume manufacturing line called Blazer inside Boston Scientific created a special rotatable table used to align the different processes that an operator can run.
4) Where to implement supermarket pull systems: Supermarket pull systems are very difficult to implement in a high-mix low-volume manufacturing environments for the same reasons why implementing a finished good supermarket pull system is difficult. Although it is possible to implement supermarket pull system by analyzing the variety of the part numbers at each different processing step. This author suggest the use of a tool called the “product variety funnel” in order to locate where the major increases in part variety are located. This makes it easier to aggregate some of the part numbers, making a supermarket pull system easier to control, and less expensive than trying to have a separate order for all of the different product numbers.
5) Where to place the pacemaker. The concept of a pacemaker is defined can be compared to a “gas pedal on a car (Duggan, 71)”. The pacemaker in a Value Stream determines the speed at which the value stream will operate. Many times the pacemaker is defined as the most upstream process in which continuous flow a occurs. The pacemaker can also but not always be the bottleneck of the process. The pacemaker also refers to the single point in the production chain in which the scheduling will be completed. The concept of Pacemaker does in fact align with the Ureteral Stents manufacturing environment at Boston Scientific. The main reason is because the Top Assembly portion can be run in continuous flow for almost all of the products. This
creates a pacemaker which ultimately dictates the output of the entire process. However, the traditional way of using a pacemaker described in Learning to See does not translate directly into a job shop environment. Firstly, since there establishing supermarket pull systems can be quite tedious in a high-mix environment, the pacemaker cannot be easily run level with a supermarket pull system. For this reason, there are several different additions, which are proposed, in different literature. One of these is the proposed by Greg Lane in Made to Order Lean, is to flow past the pacemaker, and use push systems to control up to the Pacemaker. This alternative is quite valuable, however, it incentivizes managers and supervisors to constantly “inject” WIP into the manufacturing environment in order to keep the pacemaker busy at all times. This creates excessive waste. In Quick Response Manufacturing, a new control system called POLCA cards is proposed. Such as system minimizes WIP and can keep the Pacemaker running at a continuous pace. In Creating Mixed Model Value Streams, the author elaborates on the concept of a Pacemaker to dictate the need for dedicated product lines depending on the family past the pacemaker. In the Ureteral Stents manufacturing environment, it is almost impossible to only send the production schedule to the pacemaker. This is because the rest of the process cannot be controlled with a supermarket pull system due to the high WIP So the advantages of using a Pacemaker are more to control the level and pace of the production, instead of using it to control the actual production schedule and order of the products being manufactured.
6) How to Level Mix at Production: Leveling the mix is quite a useful tool in order to eliminate one of the most common wastes, which is overproduction. Leveling the mix means making the interval as small as possible. The interval in Lean Manufacturing is defined as the amount of time needed to be able to product every single high runner, while still meeting the demand. This is also called the EPE Interval, or the Every Part Every Interval. The basics of leveling the mix are in lowering the set-up, or changeover time as much as possible between given customer orders. Doing this gives the manufacturing lines to reduce lot sizes as much as possible. Whereas traditional Economies of Scale manufacturing dictated large lot sizes run for a long time, Lean Manufacturing seeks to reduce the lot sizes. By doing this, it is a lot easier to respond to changes in the product mix from the customer, and makes the line more resilient. There were several issues that arose when lowering the interval and leveling the mix. The first is that the High-Product Mix makes it difficult to establish what is the baseline for the EPE interval, and which products need to be taken into consideration to be included in the calculation. Another difficulty that makes it difficult is the quality and documentation requirements inherent in the medical devices industry. Every single detail of an order needs to be documented during line changeover. This makes it quite different from most factories, which have compilations lowering changeover time because of the required set-up time for the equipment. Although the changeover times at the Boston Scientific Ureteral Stents manufacturing lines were quite high, it was an almost all-manual process. 90% of the time was dispersed into several different wastes such as documentation, inputting materials into SAP and inconsistent physical flow of the plant which allowed for excessive walking. Even with all of the complications, in a High-Mix, Low Volume manufacturing environment, it is even more crucial to level the production mix in order to accommodate the manufacturing process of many part numbers. By having a lot of part numbers, the withdrawals of producing in long batch runs can be augmented, such as the increasing impact caused by problems when run in batches, increases lead time and obscures quality problems.
7) What consistent increment of Work should Acme release and take away a the pacemaker process? Or what is the Pitch? The pitch is defined as the pace at which
the pacemaker is measured to see if it is meeting takt. By creating a pitch, constant pitch at which work is released and check can bring many benefits and control to the production control. A complication that arises with the use of pitch in a High-Mix, Low-Volume manufacturing environment is the existence of Variable Lot Sizes. Since it is almost impossible at the moment to dramatically impact the reduction of changeover times, due to the documentation requirements in the medical devices industry, the lot sizes can vary from 50 pieces to 600 pieces. Having this high variety of order sizes changes the requirements in terms of time needed to be spent in changeovers. Since the changeover time in most of the stations inside the Ureteral Stents environment is approximately 30 minutes, it is very difficult to control the production with a set pitch. There could be a day where a lot of small orders with 50 units are run, which would increases the time required changeovers and dramatically affect the capacity of a station. In another day, there could only be a few large orders that greatly increase the capacity requirements of the process. This complication makes it difficult to establish the pitch. Some value can still be extracted by the usage of pitch, mostly in the real of controlling and having visibility of a process. For example, the book Made to Order Lean utilizes hour-by-hour production charts n order to control the output of the stations. This tool is heavily used at Boston Scientific. The complications also make it difficult to establish a Heijunka Box, or a box used to level the variance in volumes by having a paced withdrawal of orders. If a Heijunka Box was used, there might be an order of 50 units which is input, leaving a lot of wasted time for the particular pitch. In the other sense, having a 600-unit order would constrain the capacity of the stations.
8) What process improvements are necessary for the Value Stream to flow as the future state describes? After the future state is identified, there usually need to be some process improvements in order to be able to establish the flow. This was particularly useful in the Ureteral Stents environment for example when implementing continuous flow between the tipping and buffing stations. The tipping station had many quality, yield and output problems in order to be run continuously with buffing, a fairly stable process. For this reason, there had to be some improvements including the purchasing of a new machine. In addition, the Sideport station to be run continuously with other stations, the operation was broken down into two different elements in order to make it quicker, and be able to cope with the rest of the operations which are run continuously.
Fourth Step: Implementing the Future State: Although the main focus of Learning to See is not on the implementation, the book does propose a plan to execute the implementation in loops, or iterations. Starting with the “Pacemaker Loop” or the group of processes run continuously from the Pacemaker downstream. Then the flow is established by creating the implementation in the rest of the loops which run upstream, until the supplier loop, or the process to gather the materials, etc. In conclusion, the Value Stream Mapping methodology in Learning to See introduces the concept of value stream mapping, and many other tools that are still of use in a High-Mix, Low-Volume manufacturing environment. However, a collection of other tools should be explored to either adapt the steps in Learning to See.
5.1.2 Adaptations proposed by Creating Mixed Model Value Streams by Jim Duggan The book Creating Mixed Model Value Stream elaborates on the concept of Value Stream Mapping by making several other adaptations which would allow it handle some of the complications of high-mix, low-volume manufacturing environments. The book breaks down the tools used much like in Learning to See in a set of questions to create the Future State.
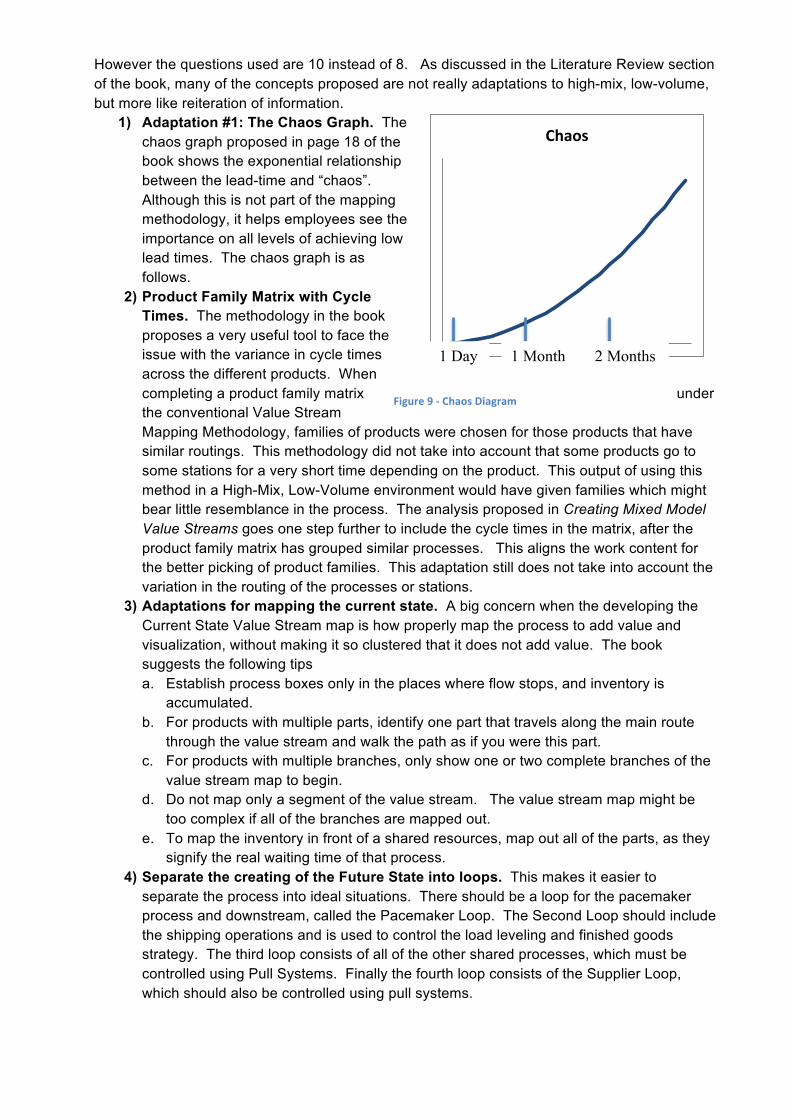
However the questions used are 10 instead of 8. As discussed in the Literature Review section of the book, many of the concepts proposed are not really adaptations to high-mix, low-volume, but more like reiteration of information.
1) Adaptation #1: The Chaos Graph. The chaos graph proposed in page 18 of the book shows the exponential relationship between the lead-time and “chaos”. Although this is not part of the mapping methodology, it helps employees see the importance on all levels of achieving low lead times. The chaos graph is as follows.
2) Product Family Matrix with Cycle Times. The methodology in the book proposes a very useful tool to face the issue with the variance in cycle times across the different products. When completing a product family matrix under the conventional Value Stream Mapping Methodology, families of products were chosen for those products that have similar routings. This methodology did not take into account that some products go to some stations for a very short time depending on the product. This output of using this method in a High-Mix, Low-Volume environment would have given families which might bear little resemblance in the process. The analysis proposed in Creating Mixed Model Value Streams goes one step further to include the cycle times in the matrix, after the product family matrix has grouped similar processes. This aligns the work content for the better picking of product families. This adaptation still does not take into account the variation in the routing of the processes or stations.
3) Adaptations for mapping the current state. A big concern when the developing the Current State Value Stream map is how properly map the process to add value and visualization, without making it so clustered that it does not add value. The book suggests the following tips a. Establish process boxes only in the places where flow stops, and inventory is
accumulated. b. For products with multiple parts, identify one part that travels along the main route
through the value stream and walk the path as if you were this part. c. For products with multiple branches, only show one or two complete branches of the
value stream map to begin. d. Do not map only a segment of the value stream. The value stream map might be
too complex if all of the branches are mapped out. e. To map the inventory in front of a shared resources, map out all of the parts, as they
signify the real waiting time of that process. 4) Separate the creating of the Future State into loops. This makes it easier to
separate the process into ideal situations. There should be a loop for the pacemaker process and downstream, called the Pacemaker Loop. The Second Loop should include the shipping operations and is used to control the load leveling and finished goods strategy. The third loop consists of all of the other shared processes, which must be controlled using Pull Systems. Finally the fourth loop consists of the Supplier Loop, which should also be controlled using pull systems.
Chaos&
1 Day 1 Month 2 Months
Figure 9 -‐ Chaos Diagram
5) Dedicate Stations to Product Families at the Pacemaker Loop, and as much as possible. By having a pacemaker loop control only one product family, it makes it easier to use several other lean tools for controlling the dedicated lines such as takt time, interval, and balance charts. Being able to have dedicated stations or production lines to the final “assembly” process is much more likely to be possible in a job shop environment. This is because the assembly process is rather consistent throughout the different products and can consist of simple processes such as packing and boxing. In the ureteral stents, the top assembly portion of the production process is exactly the same for most production units. This process consists of the flow from Sideport – Inspection – Stringing – Packing – Sealing – Labeling – Final Inspection. This particular scenario mixed with the fact that the demand mix of the families is rather stable, allowed for the successful introduction of dedicated top assembly lines for most products. In addition to being able to implement other initiatives such as takt time, pitch, and pull, this system increases the efficiency and utilization of the workers, since they acquire specialization skills by focusing on one specific product family. In the Boston Scientific Ureteral Stents manufacturing line, there are 4 top assembly lines. In addition, the Percuflex, Polaris, and Contour family of products each represent a constant contribution to the total annual demand of approximately 30% - 37%. This allowed the production team to dedicate a top assembly line to each of the major families, Percuflex, Polaris, and Contour, and leave the fourth production line for the production of low runners.
6) Include how much time is a particular shared resource available for the value stream being mapped. By placing the percentage of all the flow that the value stream represents for a particular production station, it adds visibility to the process and how much capacity can a particular station produce of a given production unit. This tool gives extra use to the mapping of current state value streams.
7) Use Takt Time to Control the Pacemaker. In Learning to See, the authors propose to use the concept of takt time to control all of the processes that take part in a value stream. As discussed in previous sections, this is very difficult, and does not add value in a High-Mix, Low-Volume manufacturing environment. For this reason, the author suggests the use of Takt Time, to control processes downstream from the Pacemaker. In the case of the Ureteral Stents production line, it means that although the concept of a single takt time is not relevant for implementation in the entire value stream, it can still be quite useful to control the pacemaker, and all of the operations downstream from the pacemaker. This includes the entire Top Assembly production lines.
8) Determining Whether the Equipment can Support the Takt Time: Although general capacity calculations are not an innovative addition past common manufacturing literature, it is quite useful to include this topic while mapping the value stream. By doing this, it is easier to recognize bottlenecks, and gives visibility to any processes which cannot meet the required demand. The Boston Scientific organization went even further with this concept and established an automatized tool called the Work Content Graph, which takes into account the capacity and other different requirements in a production line.
9) Reinforcing the Interval in Mixed Model Production: As discussed in previous sections of the master thesis, the concept of interval, or the time interval in which every regular product in the family can be run, plays a much stronger role than in high-volume, low-mix manufacturing. This is because by producing in large batches, the production team is much more likely to overproduce in some items, and have back orders in other items. The fact that there can be many product numbers enhances this even further. In addition, the authors remain open to other alternatives in a temporary way. In such cases, they suggest that building bigger batches can help recover lost time. “This allows
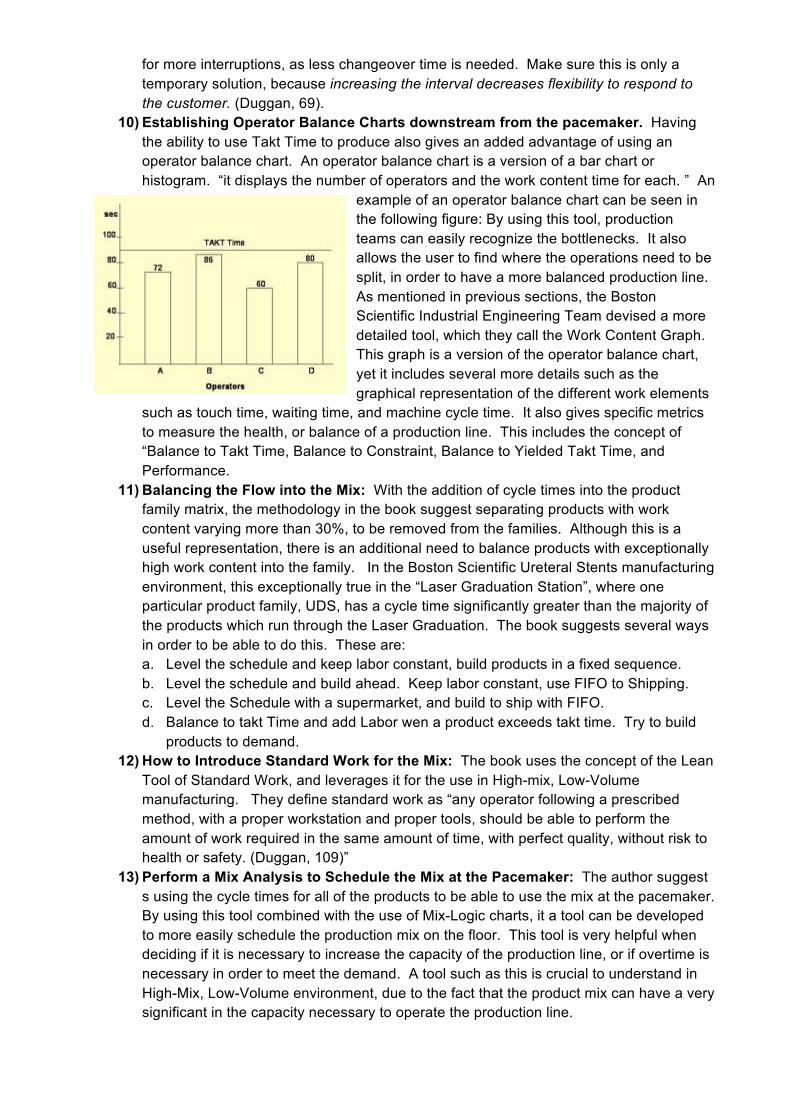
for more interruptions, as less changeover time is needed. Make sure this is only a temporary solution, because increasing the interval decreases flexibility to respond to the customer. (Duggan, 69).
10) Establishing Operator Balance Charts downstream from the pacemaker. Having the ability to use Takt Time to produce also gives an added advantage of using an operator balance chart. An operator balance chart is a version of a bar chart or histogram. “it displays the number of operators and the work content time for each. ” An
example of an operator balance chart can be seen in the following figure: By using this tool, production teams can easily recognize the bottlenecks. It also allows the user to find where the operations need to be split, in order to have a more balanced production line. As mentioned in previous sections, the Boston Scientific Industrial Engineering Team devised a more detailed tool, which they call the Work Content Graph. This graph is a version of the operator balance chart, yet it includes several more details such as the graphical representation of the different work elements
such as touch time, waiting time, and machine cycle time. It also gives specific metrics to measure the health, or balance of a production line. This includes the concept of “Balance to Takt Time, Balance to Constraint, Balance to Yielded Takt Time, and Performance.
11) Balancing the Flow into the Mix: With the addition of cycle times into the product family matrix, the methodology in the book suggest separating products with work content varying more than 30%, to be removed from the families. Although this is a useful representation, there is an additional need to balance products with exceptionally high work content into the family. In the Boston Scientific Ureteral Stents manufacturing environment, this exceptionally true in the “Laser Graduation Station”, where one particular product family, UDS, has a cycle time significantly greater than the majority of the products which run through the Laser Graduation. The book suggests several ways in order to be able to do this. These are: a. Level the schedule and keep labor constant, build products in a fixed sequence. b. Level the schedule and build ahead. Keep labor constant, use FIFO to Shipping. c. Level the Schedule with a supermarket, and build to ship with FIFO. d. Balance to takt Time and add Labor wen a product exceeds takt time. Try to build
products to demand. 12) How to Introduce Standard Work for the Mix: The book uses the concept of the Lean
Tool of Standard Work, and leverages it for the use in High-mix, Low-Volume manufacturing. They define standard work as “any operator following a prescribed method, with a proper workstation and proper tools, should be able to perform the amount of work required in the same amount of time, with perfect quality, without risk to health or safety. (Duggan, 109)”
13) Perform a Mix Analysis to Schedule the Mix at the Pacemaker: The author suggest s using the cycle times for all of the products to be able to use the mix at the pacemaker. By using this tool combined with the use of Mix-Logic charts, it a tool can be developed to more easily schedule the production mix on the floor. This tool is very helpful when deciding if it is necessary to increase the capacity of the production line, or if overtime is necessary in order to meet the demand. A tool such as this is crucial to understand in High-Mix, Low-Volume environment, due to the fact that the product mix can have a very significant in the capacity necessary to operate the production line.
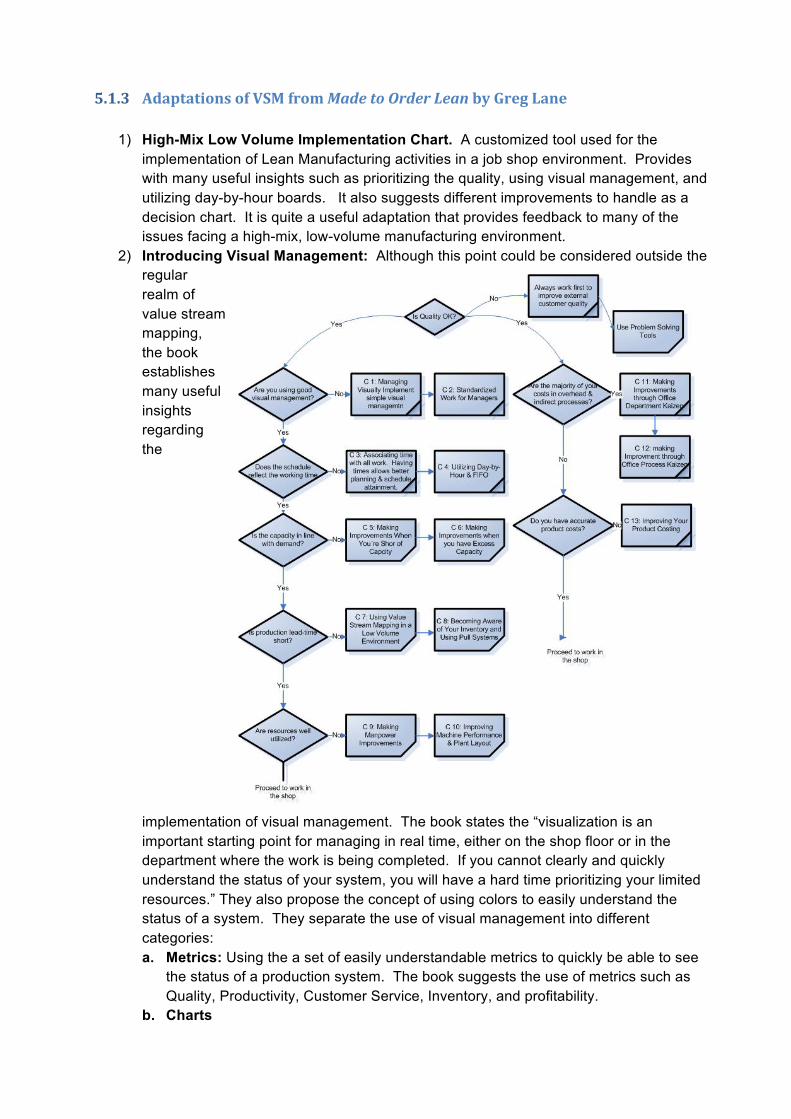
5.1.3 Adaptations of VSM from Made to Order Lean by Greg Lane
1) High-Mix Low Volume Implementation Chart. A customized tool used for the implementation of Lean Manufacturing activities in a job shop environment. Provides with many useful insights such as prioritizing the quality, using visual management, and utilizing day-by-hour boards. It also suggests different improvements to handle as a decision chart. It is quite a useful adaptation that provides feedback to many of the issues facing a high-mix, low-volume manufacturing environment.
2) Introducing Visual Management: Although this point could be considered outside the regular realm of value stream mapping, the book establishes many useful insights regarding the
implementation of visual management. The book states the “visualization is an important starting point for managing in real time, either on the shop floor or in the department where the work is being completed. If you cannot clearly and quickly understand the status of your system, you will have a hard time prioritizing your limited resources.” They also propose the concept of using colors to easily understand the status of a system. They separate the use of visual management into different categories: a. Metrics: Using the a set of easily understandable metrics to quickly be able to see
the status of a production system. The book suggests the use of metrics such as Quality, Productivity, Customer Service, Inventory, and profitability.
b. Charts
c. Value Stream Boards 3) Associating a Time with All Work: Although it can be inferred when mapping the value
stream of a high-mix, they establish that every single work should be measured, controlled and improved in a high-mix, low-volume manufacturing plant. Although it can be fairly difficult to measure the time for all of the products made in a job shop, doing so will give benefits to the efficiency. They state that by handing someone a work order to complete without associating a time, is like giving someone a blank check. (Lane, 36). Another reason why they establish that it is useful to associate a time with all work is because it makes estimates more accurate, which leads to better planning.
4) Utilizing Day-by-Hour and FIFO Boards: The book talks about a very useful tool called day-by-hour boards, which are best utlized by “shared processes where you are ussually working without a solid forecast”. Day-by-hour boards should enable the following:
a. Capacity Planning at a glance. b. An ability to prioritize. c. An ability to visualize the current status versus the plan. d. Indicates where you currently have an imbalance of work. e. A way to encourage operators to list problems that cause delays.
At the same time, day-by-hour boards provide an enourmous slew of benefits including: • Operators will become more proactive about pointing out problems that do not
allow them to complete a job in the alloted time (they can now speak with “data”) • It becomes easier to measure productivity improvements. • It becomes easier to understand accuracy of estimates or standard times. • Operators are encouraged to achieve or exceed the goal. • Managers can see how close they are to the planned or estimated times.
Another useful elaborations of the boards are the First-in, First-out boards which are especially useful when work orders route jobs through various processes, making it difficult to know when a particular job will arrive at a particular process. It is useful to see how much work is waiting at various processes so that manpower can be rebalanced accordingly. Both Day-by-Hour and FIFO Boards were implemented at the Boston Scientific Ureteral Stents manufacturing environment yet in an electronic way.
5.1.4 Adaptations from Quick Response Manufacturing Although Value Stream Mapping is a Lean Manufacturing Tool, many authors have criticized the use and implementation of Lean Manufacturing as a set of tools. Lean manufacturing is a management philosophy focused with the relentless elimination of waste throughout every opportunity. In its purest view, one should research the what are the best tools that mostly eliminate waste for a given situation, even if they are outside the realm of Lean Manufacturing. As proposed in several chapters, pull systems with kanban pose many complications in a job shop, high-mix, low-volume manufacturing environment. Mostly associated with the high cost of work-in-progress to maintain the supermarket, as well as the inability to have efficient safety stocks due to the peaks in the low volume products. For this reason, the research has delved outside the regular tools and into several other philosophies. One of these is Quick Response Manufacturing, developed by Rajan Suri. Whereas Lean focuses on the relentless elimination of waste, Quick Response Manufacturing focuses on the relentless reduction of cycle time. It views cycle time as the next frontier and differentiator for competitive advantage, not only in manufacturing, but also in every industry. Although the philosophy might have some
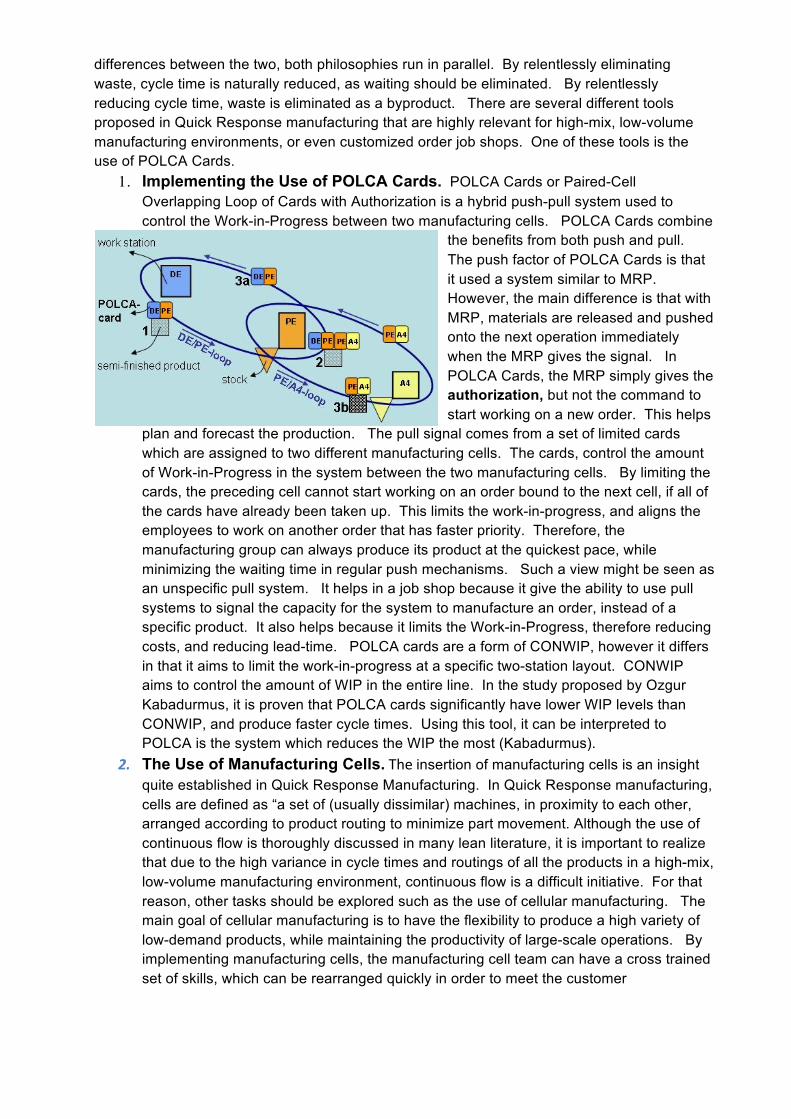
differences between the two, both philosophies run in parallel. By relentlessly eliminating waste, cycle time is naturally reduced, as waiting should be eliminated. By relentlessly reducing cycle time, waste is eliminated as a byproduct. There are several different tools proposed in Quick Response manufacturing that are highly relevant for high-mix, low-volume manufacturing environments, or even customized order job shops. One of these tools is the use of POLCA Cards.
1. Implementing the Use of POLCA Cards. POLCA Cards or Paired-Cell Overlapping Loop of Cards with Authorization is a hybrid push-pull system used to control the Work-in-Progress between two manufacturing cells. POLCA Cards combine
the benefits from both push and pull. The push factor of POLCA Cards is that it used a system similar to MRP. However, the main difference is that with MRP, materials are released and pushed onto the next operation immediately when the MRP gives the signal. In POLCA Cards, the MRP simply gives the authorization, but not the command to start working on a new order. This helps
plan and forecast the production. The pull signal comes from a set of limited cards which are assigned to two different manufacturing cells. The cards, control the amount of Work-in-Progress in the system between the two manufacturing cells. By limiting the cards, the preceding cell cannot start working on an order bound to the next cell, if all of the cards have already been taken up. This limits the work-in-progress, and aligns the employees to work on another order that has faster priority. Therefore, the manufacturing group can always produce its product at the quickest pace, while minimizing the waiting time in regular push mechanisms. Such a view might be seen as an unspecific pull system. It helps in a job shop because it give the ability to use pull systems to signal the capacity for the system to manufacture an order, instead of a specific product. It also helps because it limits the Work-in-Progress, therefore reducing costs, and reducing lead-time. POLCA cards are a form of CONWIP, however it differs in that it aims to limit the work-in-progress at a specific two-station layout. CONWIP aims to control the amount of WIP in the entire line. In the study proposed by Ozgur Kabadurmus, it is proven that POLCA cards significantly have lower WIP levels than CONWIP, and produce faster cycle times. Using this tool, it can be interpreted to POLCA is the system which reduces the WIP the most (Kabadurmus).
2. The Use of Manufacturing Cells. The insertion of manufacturing cells is an insight quite established in Quick Response Manufacturing. In Quick Response manufacturing, cells are defined as “a set of (usually dissimilar) machines, in proximity to each other, arranged according to product routing to minimize part movement. Although the use of continuous flow is thoroughly discussed in many lean literature, it is important to realize that due to the high variance in cycle times and routings of all the products in a high-mix, low-volume manufacturing environment, continuous flow is a difficult initiative. For that reason, other tasks should be explored such as the use of cellular manufacturing. The main goal of cellular manufacturing is to have the flexibility to produce a high variety of low-demand products, while maintaining the productivity of large-scale operations. By implementing manufacturing cells, the manufacturing cell team can have a cross trained set of skills, which can be rearranged quickly in order to meet the customer
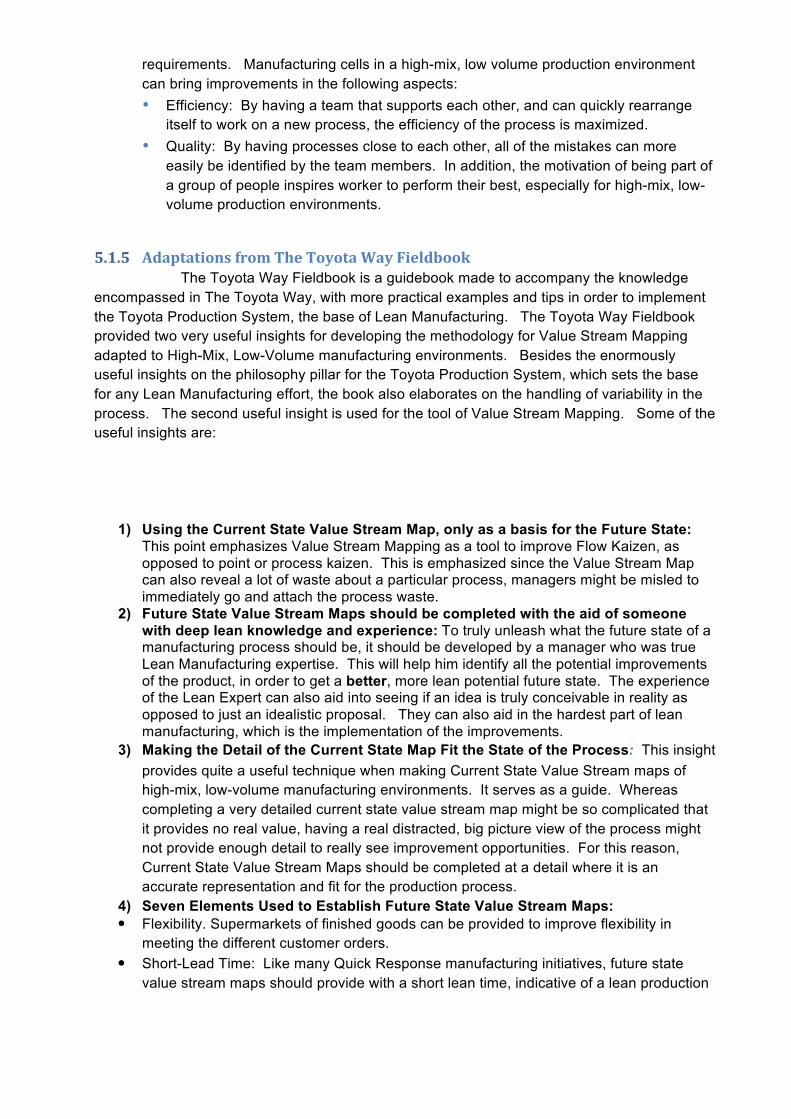
requirements. Manufacturing cells in a high-mix, low volume production environment can bring improvements in the following aspects: • Efficiency: By having a team that supports each other, and can quickly rearrange
itself to work on a new process, the efficiency of the process is maximized. • Quality: By having processes close to each other, all of the mistakes can more
easily be identified by the team members. In addition, the motivation of being part of a group of people inspires worker to perform their best, especially for high-mix, low-volume production environments.
5.1.5 Adaptations from The Toyota Way Fieldbook The Toyota Way Fieldbook is a guidebook made to accompany the knowledge encompassed in The Toyota Way, with more practical examples and tips in order to implement the Toyota Production System, the base of Lean Manufacturing. The Toyota Way Fieldbook provided two very useful insights for developing the methodology for Value Stream Mapping adapted to High-Mix, Low-Volume manufacturing environments. Besides the enormously useful insights on the philosophy pillar for the Toyota Production System, which sets the base for any Lean Manufacturing effort, the book also elaborates on the handling of variability in the process. The second useful insight is used for the tool of Value Stream Mapping. Some of the useful insights are:
1) Using the Current State Value Stream Map, only as a basis for the Future State: This point emphasizes Value Stream Mapping as a tool to improve Flow Kaizen, as opposed to point or process kaizen. This is emphasized since the Value Stream Map can also reveal a lot of waste about a particular process, managers might be misled to immediately go and attach the process waste.
2) Future State Value Stream Maps should be completed with the aid of someone with deep lean knowledge and experience: To truly unleash what the future state of a manufacturing process should be, it should be developed by a manager who was true Lean Manufacturing expertise. This will help him identify all the potential improvements of the product, in order to get a better, more lean potential future state. The experience of the Lean Expert can also aid into seeing if an idea is truly conceivable in reality as opposed to just an idealistic proposal. They can also aid in the hardest part of lean manufacturing, which is the implementation of the improvements.
3) Making the Detail of the Current State Map Fit the State of the Process: This insight provides quite a useful technique when making Current State Value Stream maps of high-mix, low-volume manufacturing environments. It serves as a guide. Whereas completing a very detailed current state value stream map might be so complicated that it provides no real value, having a real distracted, big picture view of the process might not provide enough detail to really see improvement opportunities. For this reason, Current State Value Stream Maps should be completed at a detail where it is an accurate representation and fit for the production process.
4) Seven Elements Used to Establish Future State Value Stream Maps: • Flexibility. Supermarkets of finished goods can be provided to improve flexibility in
meeting the different customer orders. • Short-Lead Time: Like many Quick Response manufacturing initiatives, future state
value stream maps should provide with a short lean time, indicative of a lean production
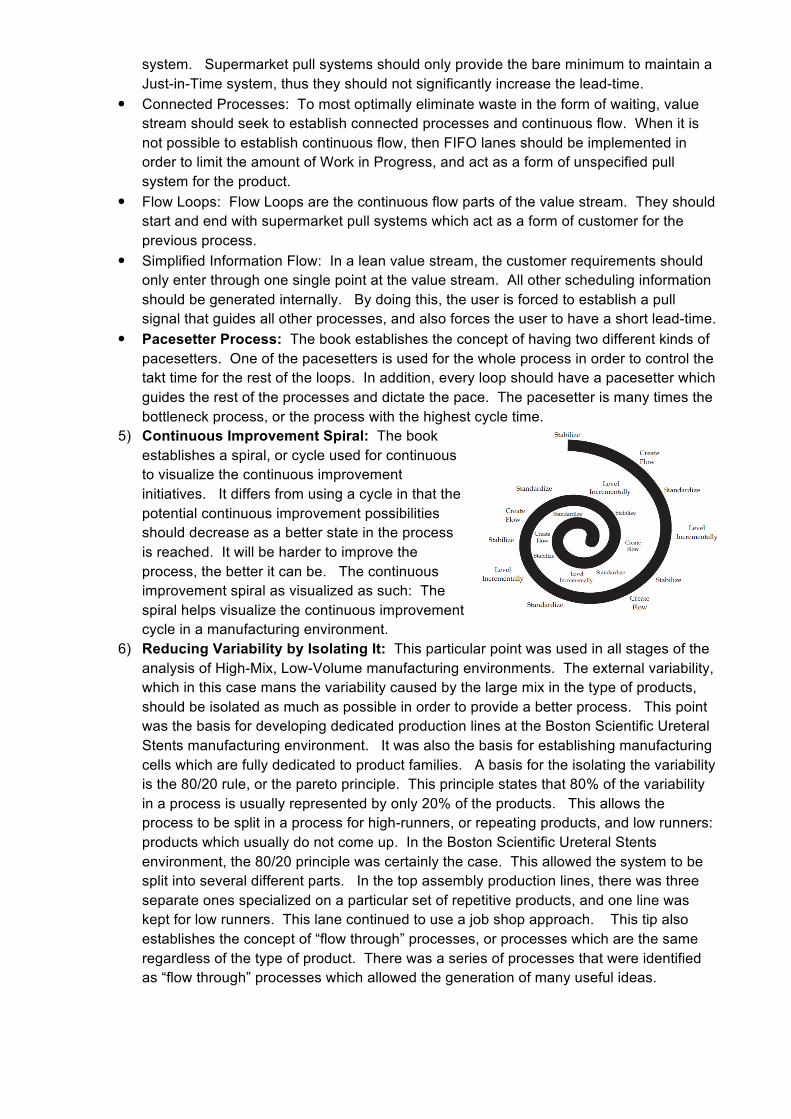
system. Supermarket pull systems should only provide the bare minimum to maintain a Just-in-Time system, thus they should not significantly increase the lead-time.
• Connected Processes: To most optimally eliminate waste in the form of waiting, value stream should seek to establish connected processes and continuous flow. When it is not possible to establish continuous flow, then FIFO lanes should be implemented in order to limit the amount of Work in Progress, and act as a form of unspecified pull system for the product.
• Flow Loops: Flow Loops are the continuous flow parts of the value stream. They should start and end with supermarket pull systems which act as a form of customer for the previous process.
• Simplified Information Flow: In a lean value stream, the customer requirements should only enter through one single point at the value stream. All other scheduling information should be generated internally. By doing this, the user is forced to establish a pull signal that guides all other processes, and also forces the user to have a short lead-time.
• Pacesetter Process: The book establishes the concept of having two different kinds of pacesetters. One of the pacesetters is used for the whole process in order to control the takt time for the rest of the loops. In addition, every loop should have a pacesetter which guides the rest of the processes and dictate the pace. The pacesetter is many times the bottleneck process, or the process with the highest cycle time.
5) Continuous Improvement Spiral: The book establishes a spiral, or cycle used for continuous to visualize the continuous improvement initiatives. It differs from using a cycle in that the potential continuous improvement possibilities should decrease as a better state in the process is reached. It will be harder to improve the process, the better it can be. The continuous improvement spiral as visualized as such: The spiral helps visualize the continuous improvement cycle in a manufacturing environment.
6) Reducing Variability by Isolating It: This particular point was used in all stages of the analysis of High-Mix, Low-Volume manufacturing environments. The external variability, which in this case mans the variability caused by the large mix in the type of products, should be isolated as much as possible in order to provide a better process. This point was the basis for developing dedicated production lines at the Boston Scientific Ureteral Stents manufacturing environment. It was also the basis for establishing manufacturing cells which are fully dedicated to product families. A basis for the isolating the variability is the 80/20 rule, or the pareto principle. This principle states that 80% of the variability in a process is usually represented by only 20% of the products. This allows the process to be split in a process for high-runners, or repeating products, and low runners: products which usually do not come up. In the Boston Scientific Ureteral Stents environment, the 80/20 principle was certainly the case. This allowed the system to be split into several different parts. In the top assembly production lines, there was three separate ones specialized on a particular set of repetitive products, and one line was kept for low runners. This lane continued to use a job shop approach. This tip also establishes the concept of “flow through” processes, or processes which are the same regardless of the type of product. There was a series of processes that were identified as “flow through” processes which allowed the generation of many useful ideas.
5.1.6 Adaptations from Boston Scientific Line of Expertise
1) Using an advanced tool to map the work content. As way to better visualize, balance, and plan the capacity in the manufacturing lines, the employees at Boston Scientific used a tool called the Work Content Graph. The work content graph is simply a graph the operator balance charts, yet it contains many other built-in tools to show more detail into the system. Firstly, it separates the work content into four main categories:
• Touch Time: The part of the cycle time in which the operator is has direct contact with the product. For some of the processes in the Boston Scientific Ureteral Stents manufacturing line, the entire process was conceived in touch time.
• Machine Cycle Time: The cycle time of the equipment used in the process. This was especially useful in the Tipping, Bonding, and Sealing stations of the manufacturing process.
• Waiting Time: The wasted time in which the operator can do nothing but wait until the machine cycle time is finished.
• Batch Time: The time in which is not included in the singular unit cycle time, yet is necessary for an entire batch of processes. This mostly includes the Line Changeover, Line Clearance, and documentation requirements.
The tool also featured two lines to compare the different cycle times. These were the Takt Time Line, or the line which showed the upper limit of the cycle time of the process, and the Yielded Takt Time Line, which is the same concept including the time necessary because of the all the scrap generated by the process. The tool also featured to easy to read metrics such as: • Balance to Takt Time: Which shows how close the cycle times are to the Takt
Time. The target for Balance to Takt Time was 80%, in order to have cushion for any deviations.
• Balance to Yielded Takt Time: Same concept as the Balance to Takt Time, yet it also it measures the balance to the Yielded Takt, or the Takt adjusted to scrap level in the process.
• Balance to Constraint: The balance to constraint showed how close are the cycle times on average compared to the bottleneck, or the process with the highest cycle time.
5.1.7 Innovative Adaptations Arisen from Experimentation:
1) The use of a “Product Variety Funnel” to find where to implement Pull Systems. As mentioned in previous parts of this Master Thesis, the use of supermarket pull systems to control the production in a High-Mix, Low-Volume manufacturing environment, is an expensive endeavor. This is because the large amount of product parts necessary, make it expensive to maintain the Work-in-Progress levels necessary to have a stock of all major parts. However, there can be an added advantage by analyzing the product variety, at each level of the production process. In the case of the Ureteral Stents at Boston Scientific, it was identified that the variety in the product mix is mostly due to three different factors: Material, Diameter, and Length. Although the material and diameter of the stent extrusions are an initial part of the manufacturing process, the length is only introduced at the Cut-to-Length production station. In this
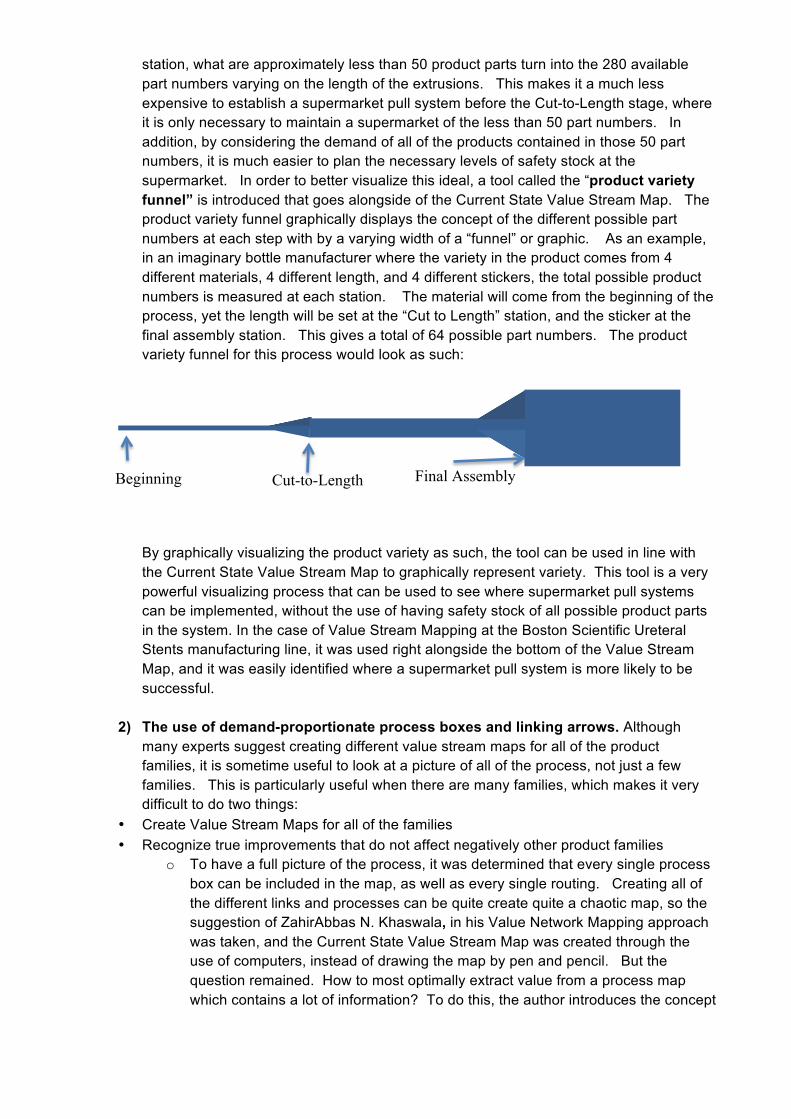
station, what are approximately less than 50 product parts turn into the 280 available part numbers varying on the length of the extrusions. This makes it a much less expensive to establish a supermarket pull system before the Cut-to-Length stage, where it is only necessary to maintain a supermarket of the less than 50 part numbers. In addition, by considering the demand of all of the products contained in those 50 part numbers, it is much easier to plan the necessary levels of safety stock at the supermarket. In order to better visualize this ideal, a tool called the “product variety funnel” is introduced that goes alongside of the Current State Value Stream Map. The product variety funnel graphically displays the concept of the different possible part numbers at each step with by a varying width of a “funnel” or graphic. As an example, in an imaginary bottle manufacturer where the variety in the product comes from 4 different materials, 4 different length, and 4 different stickers, the total possible product numbers is measured at each station. The material will come from the beginning of the process, yet the length will be set at the “Cut to Length” station, and the sticker at the final assembly station. This gives a total of 64 possible part numbers. The product variety funnel for this process would look as such:
By graphically visualizing the product variety as such, the tool can be used in line with the Current State Value Stream Map to graphically represent variety. This tool is a very powerful visualizing process that can be used to see where supermarket pull systems can be implemented, without the use of having safety stock of all possible product parts in the system. In the case of Value Stream Mapping at the Boston Scientific Ureteral Stents manufacturing line, it was used right alongside the bottom of the Value Stream Map, and it was easily identified where a supermarket pull system is more likely to be successful.
2) The use of demand-proportionate process boxes and linking arrows. Although
many experts suggest creating different value stream maps for all of the product families, it is sometime useful to look at a picture of all of the process, not just a few families. This is particularly useful when there are many families, which makes it very difficult to do two things:
• Create Value Stream Maps for all of the families • Recognize true improvements that do not affect negatively other product families
o To have a full picture of the process, it was determined that every single process box can be included in the map, as well as every single routing. Creating all of the different links and processes can be quite create quite a chaotic map, so the suggestion of ZahirAbbas N. Khaswala, in his Value Network Mapping approach was taken, and the Current State Value Stream Map was created through the use of computers, instead of drawing the map by pen and pencil. But the question remained. How to most optimally extract value from a process map which contains a lot of information? To do this, the author introduces the concept
Beginning Cut-to-Length Final Assembly
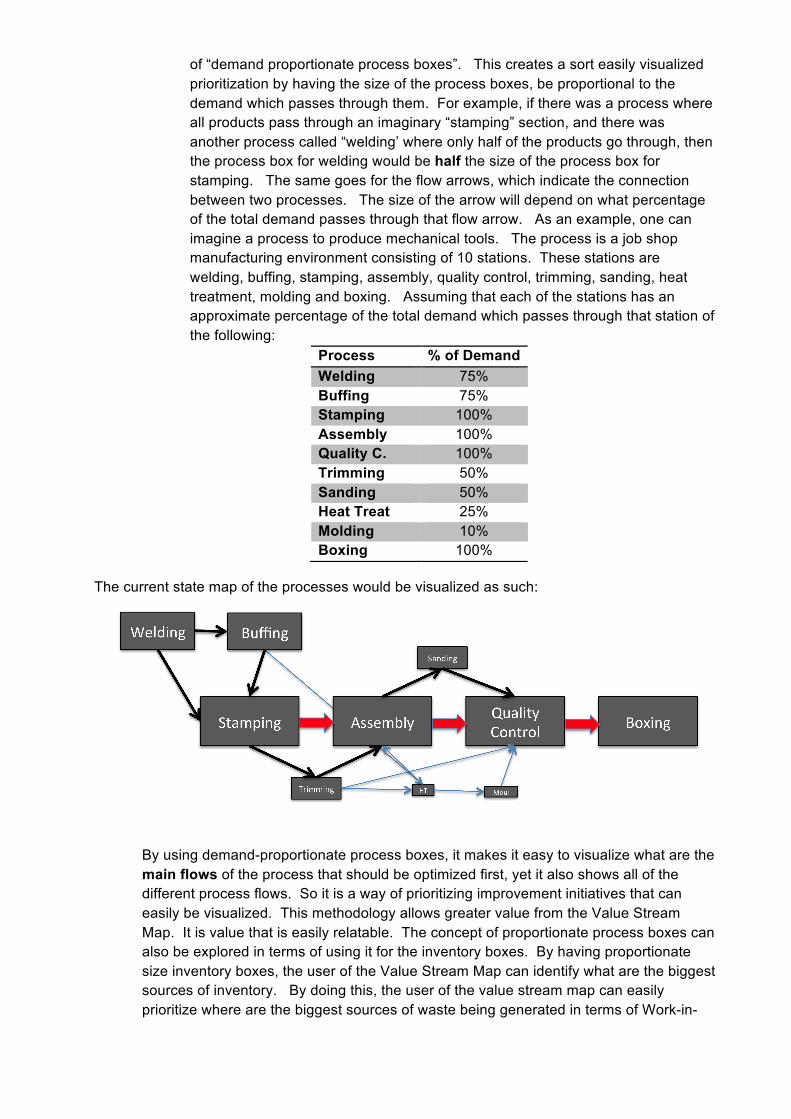
of “demand proportionate process boxes”. This creates a sort easily visualized prioritization by having the size of the process boxes, be proportional to the demand which passes through them. For example, if there was a process where all products pass through an imaginary “stamping” section, and there was another process called “welding’ where only half of the products go through, then the process box for welding would be half the size of the process box for stamping. The same goes for the flow arrows, which indicate the connection between two processes. The size of the arrow will depend on what percentage of the total demand passes through that flow arrow. As an example, one can imagine a process to produce mechanical tools. The process is a job shop manufacturing environment consisting of 10 stations. These stations are welding, buffing, stamping, assembly, quality control, trimming, sanding, heat treatment, molding and boxing. Assuming that each of the stations has an approximate percentage of the total demand which passes through that station of the following:
The current state map of the processes would be visualized as such:
By using demand-proportionate process boxes, it makes it easy to visualize what are the main flows of the process that should be optimized first, yet it also shows all of the different process flows. So it is a way of prioritizing improvement initiatives that can easily be visualized. This methodology allows greater value from the Value Stream Map. It is value that is easily relatable. The concept of proportionate process boxes can also be explored in terms of using it for the inventory boxes. By having proportionate size inventory boxes, the user of the Value Stream Map can identify what are the biggest sources of inventory. By doing this, the user of the value stream map can easily prioritize where are the biggest sources of waste being generated in terms of Work-in-
Process % of Demand Welding 75% Buffing 75% Stamping 100% Assembly 100% Quality C. 100% Trimming 50% Sanding 50% Heat Treat 25% Molding 10% Boxing 100%
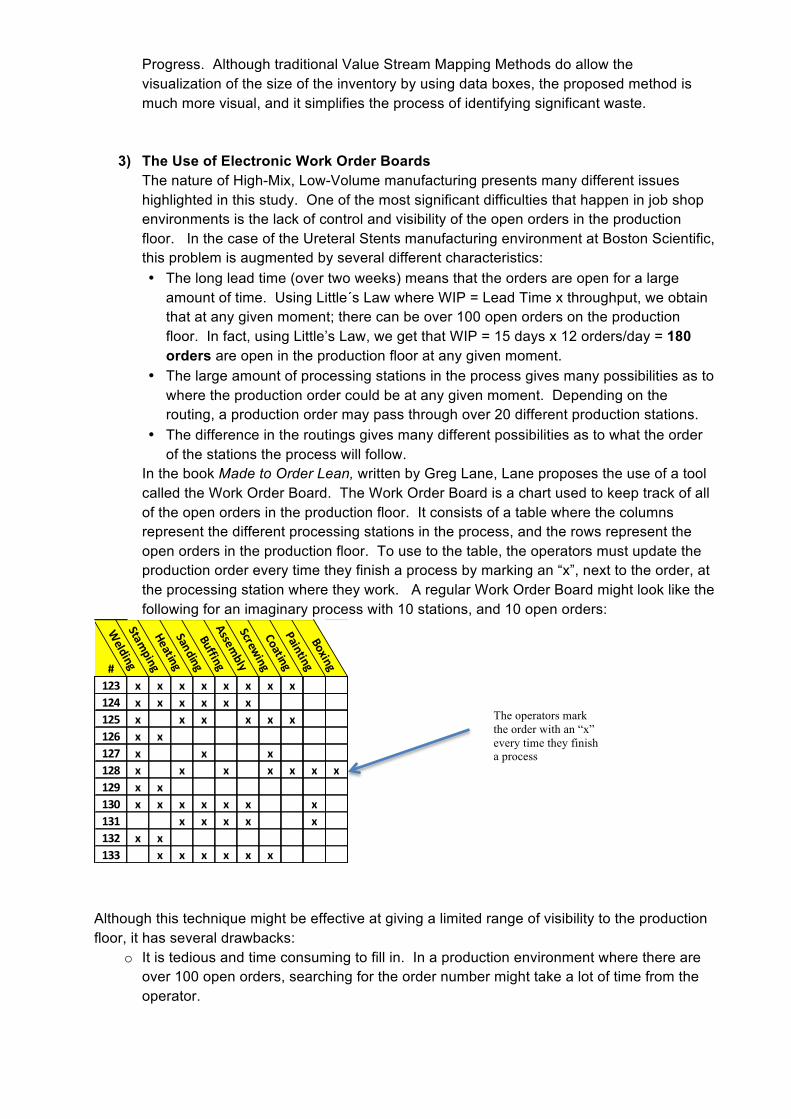
#Welding
Stamping
HeatingSandingBuffing
Assembly
Screwing
CoatingPaintingBoxing
123 x x x x x x x x124 x x x x x x125 x x x x x x126 x x127 x x x128 x x x x x x x129 x x130 x x x x x x x131 x x x x x132 x x133 x x x x x x
Progress. Although traditional Value Stream Mapping Methods do allow the visualization of the size of the inventory by using data boxes, the proposed method is much more visual, and it simplifies the process of identifying significant waste.
3) The Use of Electronic Work Order Boards The nature of High-Mix, Low-Volume manufacturing presents many different issues highlighted in this study. One of the most significant difficulties that happen in job shop environments is the lack of control and visibility of the open orders in the production floor. In the case of the Ureteral Stents manufacturing environment at Boston Scientific, this problem is augmented by several different characteristics: • The long lead time (over two weeks) means that the orders are open for a large
amount of time. Using Little´s Law where WIP = Lead Time x throughput, we obtain that at any given moment; there can be over 100 open orders on the production floor. In fact, using Little’s Law, we get that WIP = 15 days x 12 orders/day = 180 orders are open in the production floor at any given moment.
• The large amount of processing stations in the process gives many possibilities as to where the production order could be at any given moment. Depending on the routing, a production order may pass through over 20 different production stations.
• The difference in the routings gives many different possibilities as to what the order of the stations the process will follow.
In the book Made to Order Lean, written by Greg Lane, Lane proposes the use of a tool called the Work Order Board. The Work Order Board is a chart used to keep track of all of the open orders in the production floor. It consists of a table where the columns represent the different processing stations in the process, and the rows represent the open orders in the production floor. To use to the table, the operators must update the production order every time they finish a process by marking an “x”, next to the order, at the processing station where they work. A regular Work Order Board might look like the following for an imaginary process with 10 stations, and 10 open orders:
Although this technique might be effective at giving a limited range of visibility to the production floor, it has several drawbacks:
o It is tedious and time consuming to fill in. In a production environment where there are over 100 open orders, searching for the order number might take a lot of time from the operator.
The operators mark the order with an “x” every time they finish a process
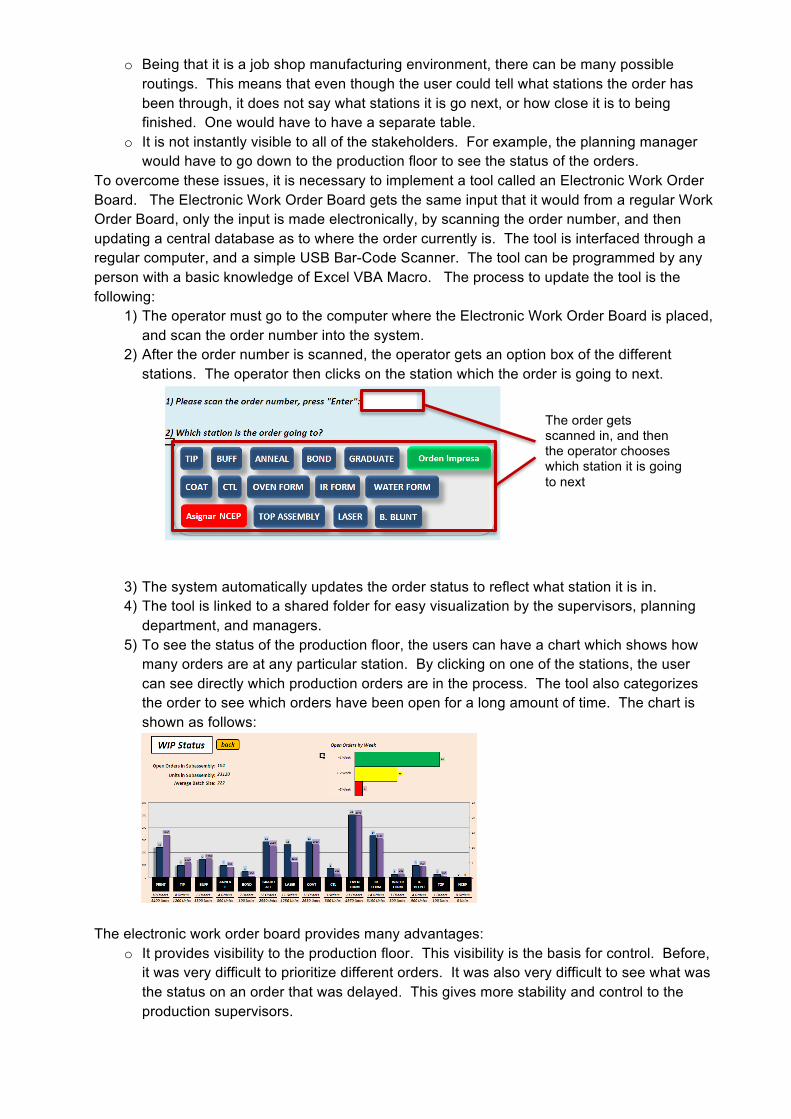
o Being that it is a job shop manufacturing environment, there can be many possible routings. This means that even though the user could tell what stations the order has been through, it does not say what stations it is go next, or how close it is to being finished. One would have to have a separate table.
o It is not instantly visible to all of the stakeholders. For example, the planning manager would have to go down to the production floor to see the status of the orders.
To overcome these issues, it is necessary to implement a tool called an Electronic Work Order Board. The Electronic Work Order Board gets the same input that it would from a regular Work Order Board, only the input is made electronically, by scanning the order number, and then updating a central database as to where the order currently is. The tool is interfaced through a regular computer, and a simple USB Bar-Code Scanner. The tool can be programmed by any person with a basic knowledge of Excel VBA Macro. The process to update the tool is the following:
1) The operator must go to the computer where the Electronic Work Order Board is placed, and scan the order number into the system.
2) After the order number is scanned, the operator gets an option box of the different stations. The operator then clicks on the station which the order is going to next.
3) The system automatically updates the order status to reflect what station it is in. 4) The tool is linked to a shared folder for easy visualization by the supervisors, planning
department, and managers. 5) To see the status of the production floor, the users can have a chart which shows how
many orders are at any particular station. By clicking on one of the stations, the user can see directly which production orders are in the process. The tool also categorizes the order to see which orders have been open for a long amount of time. The chart is shown as follows:
The electronic work order board provides many advantages:
o It provides visibility to the production floor. This visibility is the basis for control. Before, it was very difficult to prioritize different orders. It was also very difficult to see what was the status on an order that was delayed. This gives more stability and control to the production supervisors.
The order gets scanned in, and then the operator chooses which station it is going to next
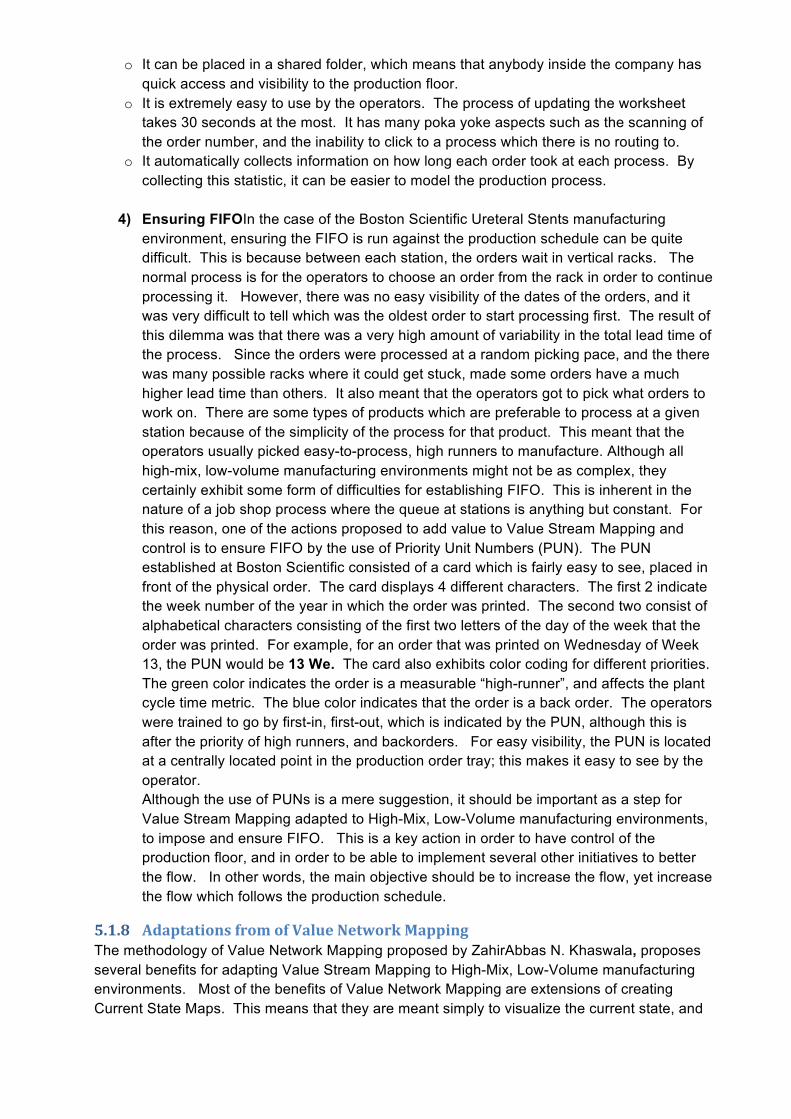
o It can be placed in a shared folder, which means that anybody inside the company has quick access and visibility to the production floor.
o It is extremely easy to use by the operators. The process of updating the worksheet takes 30 seconds at the most. It has many poka yoke aspects such as the scanning of the order number, and the inability to click to a process which there is no routing to.
o It automatically collects information on how long each order took at each process. By collecting this statistic, it can be easier to model the production process.
4) Ensuring FIFOIn the case of the Boston Scientific Ureteral Stents manufacturing
environment, ensuring the FIFO is run against the production schedule can be quite difficult. This is because between each station, the orders wait in vertical racks. The normal process is for the operators to choose an order from the rack in order to continue processing it. However, there was no easy visibility of the dates of the orders, and it was very difficult to tell which was the oldest order to start processing first. The result of this dilemma was that there was a very high amount of variability in the total lead time of the process. Since the orders were processed at a random picking pace, and the there was many possible racks where it could get stuck, made some orders have a much higher lead time than others. It also meant that the operators got to pick what orders to work on. There are some types of products which are preferable to process at a given station because of the simplicity of the process for that product. This meant that the operators usually picked easy-to-process, high runners to manufacture. Although all high-mix, low-volume manufacturing environments might not be as complex, they certainly exhibit some form of difficulties for establishing FIFO. This is inherent in the nature of a job shop process where the queue at stations is anything but constant. For this reason, one of the actions proposed to add value to Value Stream Mapping and control is to ensure FIFO by the use of Priority Unit Numbers (PUN). The PUN established at Boston Scientific consisted of a card which is fairly easy to see, placed in front of the physical order. The card displays 4 different characters. The first 2 indicate the week number of the year in which the order was printed. The second two consist of alphabetical characters consisting of the first two letters of the day of the week that the order was printed. For example, for an order that was printed on Wednesday of Week 13, the PUN would be 13 We. The card also exhibits color coding for different priorities. The green color indicates the order is a measurable “high-runner”, and affects the plant cycle time metric. The blue color indicates that the order is a back order. The operators were trained to go by first-in, first-out, which is indicated by the PUN, although this is after the priority of high runners, and backorders. For easy visibility, the PUN is located at a centrally located point in the production order tray; this makes it easy to see by the operator. Although the use of PUNs is a mere suggestion, it should be important as a step for Value Stream Mapping adapted to High-Mix, Low-Volume manufacturing environments, to impose and ensure FIFO. This is a key action in order to have control of the production floor, and in order to be able to implement several other initiatives to better the flow. In other words, the main objective should be to increase the flow, yet increase the flow which follows the production schedule.
5.1.8 Adaptations from of Value Network Mapping The methodology of Value Network Mapping proposed by ZahirAbbas N. Khaswala, proposes several benefits for adapting Value Stream Mapping to High-Mix, Low-Volume manufacturing environments. Most of the benefits of Value Network Mapping are extensions of creating Current State Maps. This means that they are meant simply to visualize the current state, and
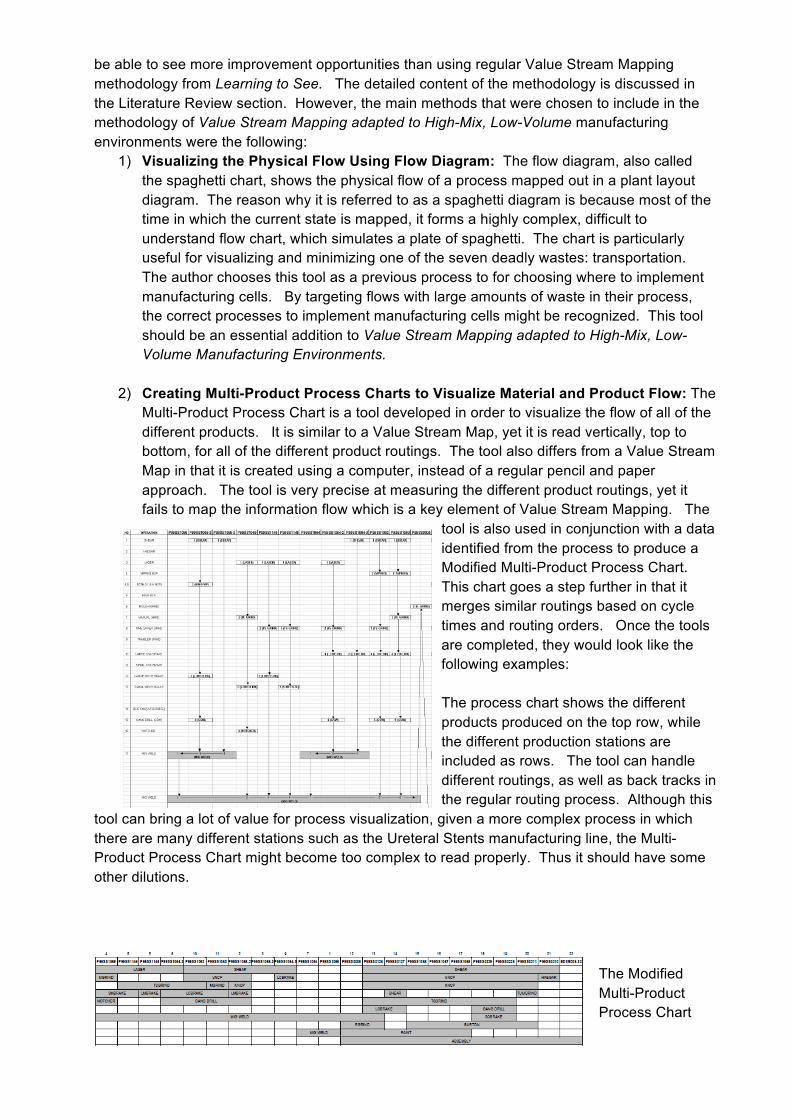
be able to see more improvement opportunities than using regular Value Stream Mapping methodology from Learning to See. The detailed content of the methodology is discussed in the Literature Review section. However, the main methods that were chosen to include in the methodology of Value Stream Mapping adapted to High-Mix, Low-Volume manufacturing environments were the following:
1) Visualizing the Physical Flow Using Flow Diagram: The flow diagram, also called the spaghetti chart, shows the physical flow of a process mapped out in a plant layout diagram. The reason why it is referred to as a spaghetti diagram is because most of the time in which the current state is mapped, it forms a highly complex, difficult to understand flow chart, which simulates a plate of spaghetti. The chart is particularly useful for visualizing and minimizing one of the seven deadly wastes: transportation. The author chooses this tool as a previous process to for choosing where to implement manufacturing cells. By targeting flows with large amounts of waste in their process, the correct processes to implement manufacturing cells might be recognized. This tool should be an essential addition to Value Stream Mapping adapted to High-Mix, Low-Volume Manufacturing Environments.
2) Creating Multi-Product Process Charts to Visualize Material and Product Flow: The
Multi-Product Process Chart is a tool developed in order to visualize the flow of all of the different products. It is similar to a Value Stream Map, yet it is read vertically, top to bottom, for all of the different product routings. The tool also differs from a Value Stream Map in that it is created using a computer, instead of a regular pencil and paper approach. The tool is very precise at measuring the different product routings, yet it fails to map the information flow which is a key element of Value Stream Mapping. The
tool is also used in conjunction with a data identified from the process to produce a Modified Multi-Product Process Chart. This chart goes a step further in that it merges similar routings based on cycle times and routing orders. Once the tools are completed, they would look like the following examples:
The process chart shows the different products produced on the top row, while the different production stations are included as rows. The tool can handle different routings, as well as back tracks in the regular routing process. Although this
tool can bring a lot of value for process visualization, given a more complex process in which there are many different stations such as the Ureteral Stents manufacturing line, the Multi-Product Process Chart might become too complex to read properly. Thus it should have some other dilutions.
The Modified Multi-Product Process Chart
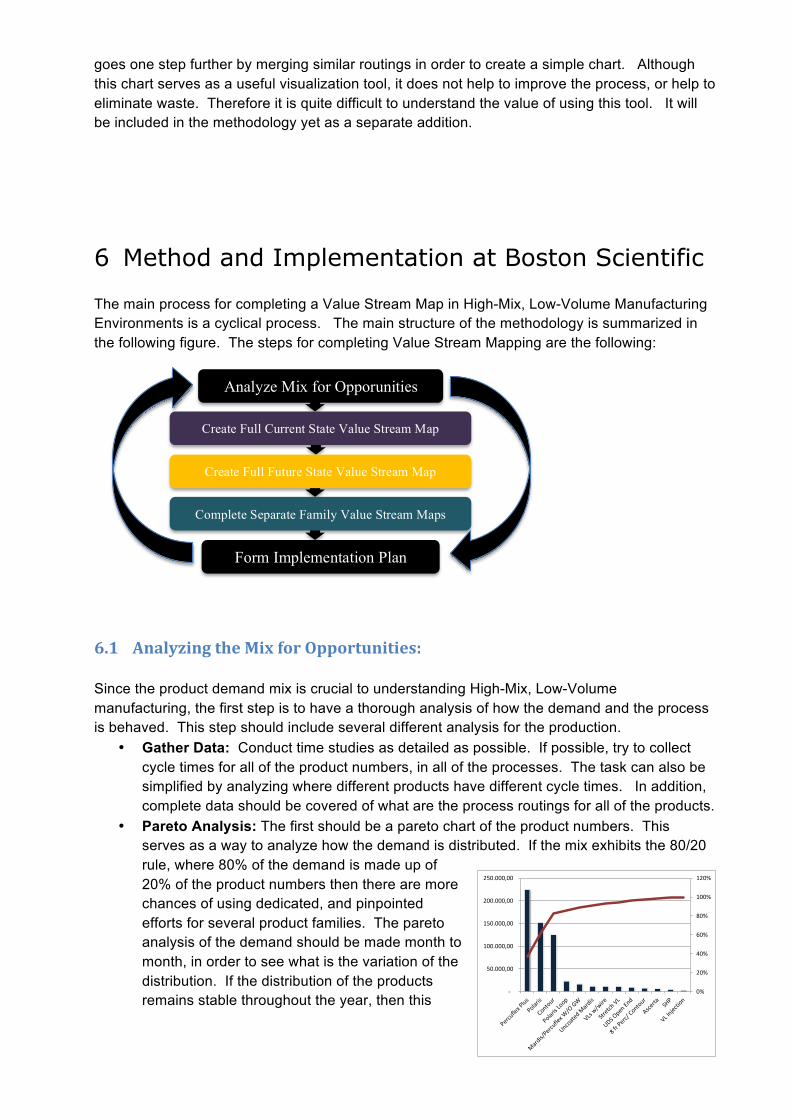
0%
20%
40%
60%
80%
100%
120%
-‐
50.000,00
100.000,00
150.000,00
200.000,00
250.000,00
goes one step further by merging similar routings in order to create a simple chart. Although this chart serves as a useful visualization tool, it does not help to improve the process, or help to eliminate waste. Therefore it is quite difficult to understand the value of using this tool. It will be included in the methodology yet as a separate addition.
6 Method and Implementation at Boston Scientific The main process for completing a Value Stream Map in High-Mix, Low-Volume Manufacturing Environments is a cyclical process. The main structure of the methodology is summarized in the following figure. The steps for completing Value Stream Mapping are the following:
6.1 Analyzing the Mix for Opportunities: Since the product demand mix is crucial to understanding High-Mix, Low-Volume manufacturing, the first step is to have a thorough analysis of how the demand and the process is behaved. This step should include several different analysis for the production.
• Gather Data: Conduct time studies as detailed as possible. If possible, try to collect cycle times for all of the product numbers, in all of the processes. The task can also be simplified by analyzing where different products have different cycle times. In addition, complete data should be covered of what are the process routings for all of the products.
• Pareto Analysis: The first should be a pareto chart of the product numbers. This serves as a way to analyze how the demand is distributed. If the mix exhibits the 80/20 rule, where 80% of the demand is made up of 20% of the product numbers then there are more chances of using dedicated, and pinpointed efforts for several product families. The pareto analysis of the demand should be made month to month, in order to see what is the variation of the distribution. If the distribution of the products remains stable throughout the year, then this
Analyze Mix for Opporunities
Create Full Current State Value Stream Map
Create Full Future State Value Stream Map
Complete Separate Family Value Stream Maps
Form Implementation Plan
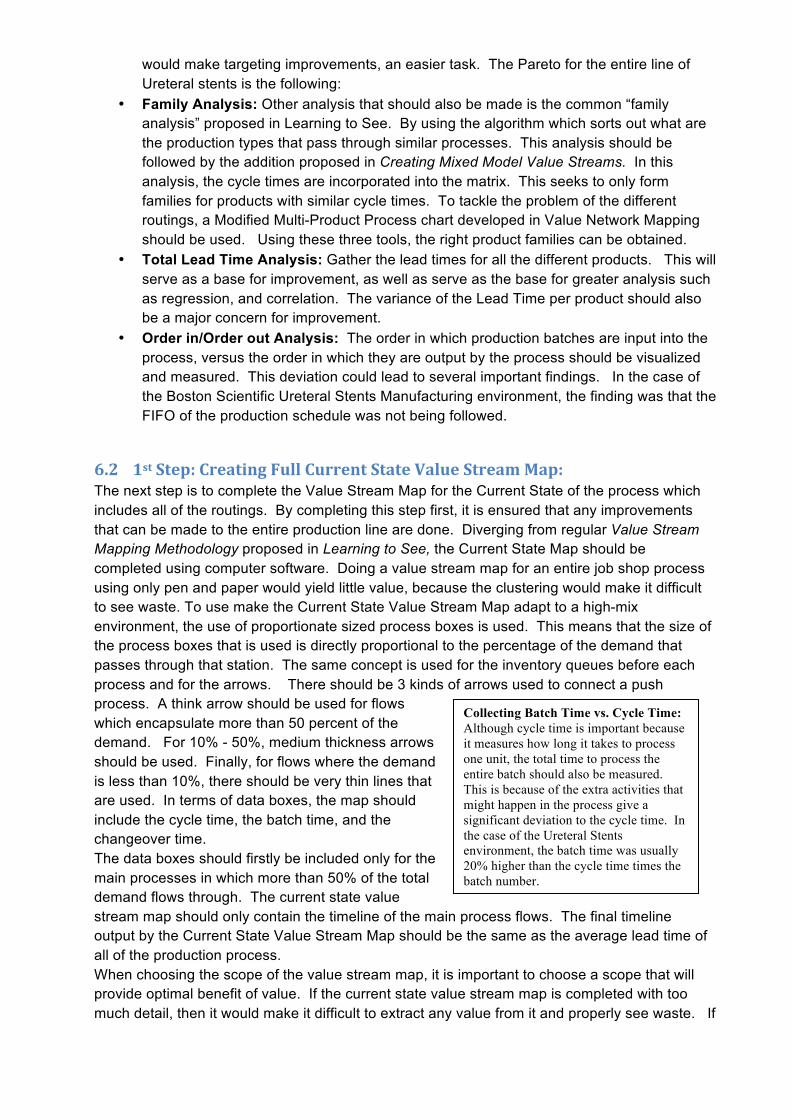
Collecting Batch Time vs. Cycle Time: Although cycle time is important because it measures how long it takes to process one unit, the total time to process the entire batch should also be measured. This is because of the extra activities that might happen in the process give a significant deviation to the cycle time. In the case of the Ureteral Stents environment, the batch time was usually 20% higher than the cycle time times the batch number.
would make targeting improvements, an easier task. The Pareto for the entire line of Ureteral stents is the following:
• Family Analysis: Other analysis that should also be made is the common “family analysis” proposed in Learning to See. By using the algorithm which sorts out what are the production types that pass through similar processes. This analysis should be followed by the addition proposed in Creating Mixed Model Value Streams. In this analysis, the cycle times are incorporated into the matrix. This seeks to only form families for products with similar cycle times. To tackle the problem of the different routings, a Modified Multi-Product Process chart developed in Value Network Mapping should be used. Using these three tools, the right product families can be obtained.
• Total Lead Time Analysis: Gather the lead times for all the different products. This will serve as a base for improvement, as well as serve as the base for greater analysis such as regression, and correlation. The variance of the Lead Time per product should also be a major concern for improvement.
• Order in/Order out Analysis: The order in which production batches are input into the process, versus the order in which they are output by the process should be visualized and measured. This deviation could lead to several important findings. In the case of the Boston Scientific Ureteral Stents Manufacturing environment, the finding was that the FIFO of the production schedule was not being followed.
6.2 1st Step: Creating Full Current State Value Stream Map: The next step is to complete the Value Stream Map for the Current State of the process which includes all of the routings. By completing this step first, it is ensured that any improvements that can be made to the entire production line are done. Diverging from regular Value Stream Mapping Methodology proposed in Learning to See, the Current State Map should be completed using computer software. Doing a value stream map for an entire job shop process using only pen and paper would yield little value, because the clustering would make it difficult to see waste. To use make the Current State Value Stream Map adapt to a high-mix environment, the use of proportionate sized process boxes is used. This means that the size of the process boxes that is used is directly proportional to the percentage of the demand that passes through that station. The same concept is used for the inventory queues before each process and for the arrows. There should be 3 kinds of arrows used to connect a push process. A think arrow should be used for flows which encapsulate more than 50 percent of the demand. For 10% - 50%, medium thickness arrows should be used. Finally, for flows where the demand is less than 10%, there should be very thin lines that are used. In terms of data boxes, the map should include the cycle time, the batch time, and the changeover time. The data boxes should firstly be included only for the main processes in which more than 50% of the total demand flows through. The current state value stream map should only contain the timeline of the main process flows. The final timeline output by the Current State Value Stream Map should be the same as the average lead time of all of the production process. When choosing the scope of the value stream map, it is important to choose a scope that will provide optimal benefit of value. If the current state value stream map is completed with too much detail, then it would make it difficult to extract any value from it and properly see waste. If
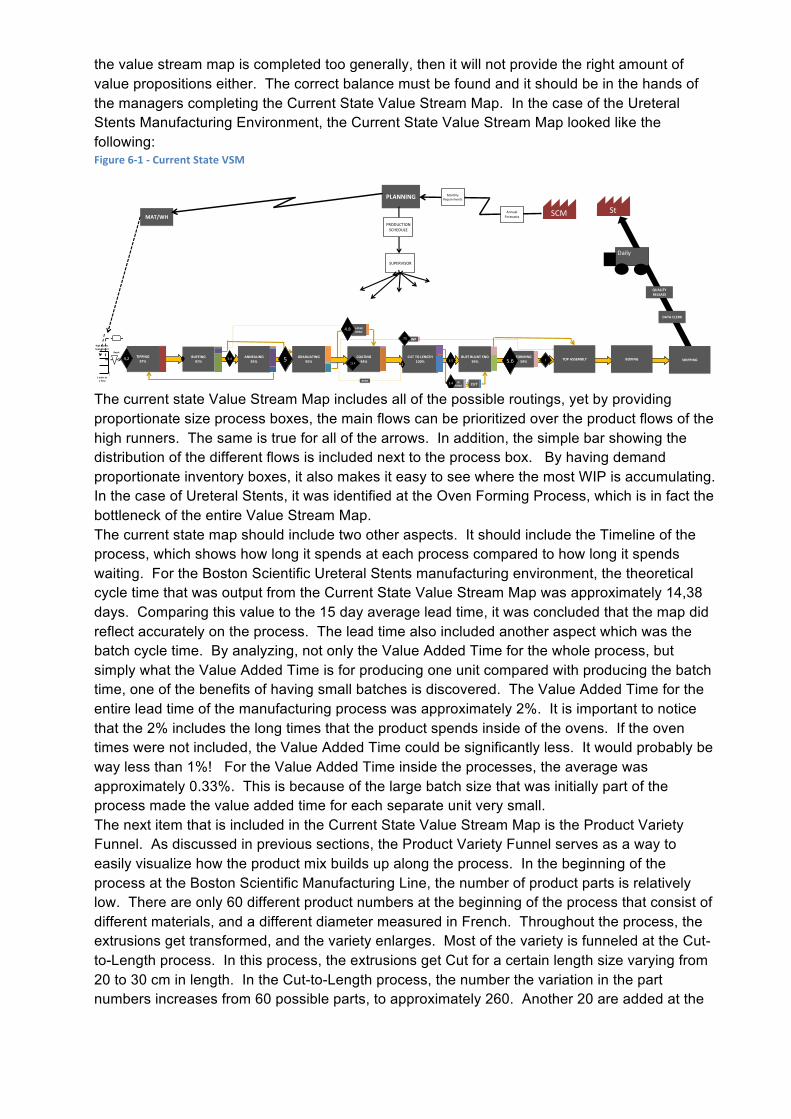
the value stream map is completed too generally, then it will not provide the right amount of value propositions either. The correct balance must be found and it should be in the hands of the managers completing the Current State Value Stream Map. In the case of the Ureteral Stents Manufacturing Environment, the Current State Value Stream Map looked like the following: Figure 6-‐1 -‐ Current State VSM
The current state Value Stream Map includes all of the possible routings, yet by providing proportionate size process boxes, the main flows can be prioritized over the product flows of the high runners. The same is true for all of the arrows. In addition, the simple bar showing the distribution of the different flows is included next to the process box. By having demand proportionate inventory boxes, it also makes it easy to see where the most WIP is accumulating. In the case of Ureteral Stents, it was identified at the Oven Forming Process, which is in fact the bottleneck of the entire Value Stream Map. The current state map should include two other aspects. It should include the Timeline of the process, which shows how long it spends at each process compared to how long it spends waiting. For the Boston Scientific Ureteral Stents manufacturing environment, the theoretical cycle time that was output from the Current State Value Stream Map was approximately 14,38 days. Comparing this value to the 15 day average lead time, it was concluded that the map did reflect accurately on the process. The lead time also included another aspect which was the batch cycle time. By analyzing, not only the Value Added Time for the whole process, but simply what the Value Added Time is for producing one unit compared with producing the batch time, one of the benefits of having small batches is discovered. The Value Added Time for the entire lead time of the manufacturing process was approximately 2%. It is important to notice that the 2% includes the long times that the product spends inside of the ovens. If the oven times were not included, the Value Added Time could be significantly less. It would probably be way less than 1%! For the Value Added Time inside the processes, the average was approximately 0.33%. This is because of the large batch size that was initially part of the process made the value added time for each separate unit very small. The next item that is included in the Current State Value Stream Map is the Product Variety Funnel. As discussed in previous sections, the Product Variety Funnel serves as a way to easily visualize how the product mix builds up along the process. In the beginning of the process at the Boston Scientific Manufacturing Line, the number of product parts is relatively low. There are only 60 different product numbers at the beginning of the process that consist of different materials, and a different diameter measured in French. Throughout the process, the extrusions get transformed, and the variety enlarges. Most of the variety is funneled at the Cut-to-Length process. In this process, the extrusions get Cut for a certain length size varying from 20 to 30 cm in length. In the Cut-to-Length process, the number the variation in the part numbers increases from 60 possible parts, to approximately 260. Another 20 are added at the
GRADUATING LASER GRADUATING CUT TO LENGTH BUFF BLUNT END BONDING FORMING IR FORMING WATER FORMING COATING CUT TOP ASSEMBLY
BUFFING ANNEALINGBUFFINGGRADUATING
TIPPING 96% 1%0% 0
TIPPING97%
BUFFING97%
ANNEALING95%
CUT TO LENGTH100%
BUFF BLUNT END 94%
FORMING59% TOP ASSEMBLY
CUT
LASER GRAD
WF
BOND
BOXING
Daily
StSCM
PLANNING
AnnualForecasts
Monthly Requirements
MAT/WH
Batch
1 order at a Time
High Runner Supermarket
PRODUCTIONSCHEDULE
IR FORM
GRADUATING95%
COATING94% SHIPPING
DATA CLERK
QUALITY RELEASE
SUPERVISOR
4,2 1.2 3.4 513.4 1
3.5 25.6
.75
4.8
3.4
coating process, in which some of the low-runners do not flow through. The product variety funnel for the Ureteral Stents Manufacturing Process looks like the following:
In addition to the mapping the product flow using Value Stream Mapping; the physical flow should also be mapped using a spaghetti diagram or flow chart. The flow chart can be analyzed to see major when major waste in the production process. The spaghetti diagram is mapped on top of the physical layout of the manufacturing facility. Later, the flow is mapped through the use of arrows along the physical layout of the facility. The spaghetti diagram was completed and it its result was this:
The following representation depicts what the flow is through the production process. It is easy to see through this diagram why the term of a spaghetti diagram is used to describe the physical flow of the product. It flows end up producing an entanglement, which is very difficult to recognize. The goal is to use this current state to form a more uniform, and ordered diagram in the future, with simpler flows.
6.3 2nd Step: Obtaining the Future State Value Stream Map: As in Learning to See the transformation of Current State into an ideal Future State is divided into 9 questions. The questions should be asked by the user in order to start seeing improvement opportunities using the Value Stream Map. The questions are divided into the following:
1. How to Gain Visibility of the Production Floor? 2. How to Ensure FIFO in the Production Floor? 3. Where to Implement continuous Flow through production lines? 4. Where to implement continuous flow through flexible manufacturing cells? 5. Where to Implement Supermarket Pull Systems using the Product Variety Funnel? 6. Where to Implement POLCA Cards to control the WIP? 7. What is the Pacemaker at each process? 8. How to Level the Mix to meet the production schedule? 9. What Improvements are necessary to reach the future state? 10. How to Standardize new work flow?
Question 1: How to gain visibility of the production floor?
Coating
Cut To Length
Figure 11 -‐ Spaghetti Diagram
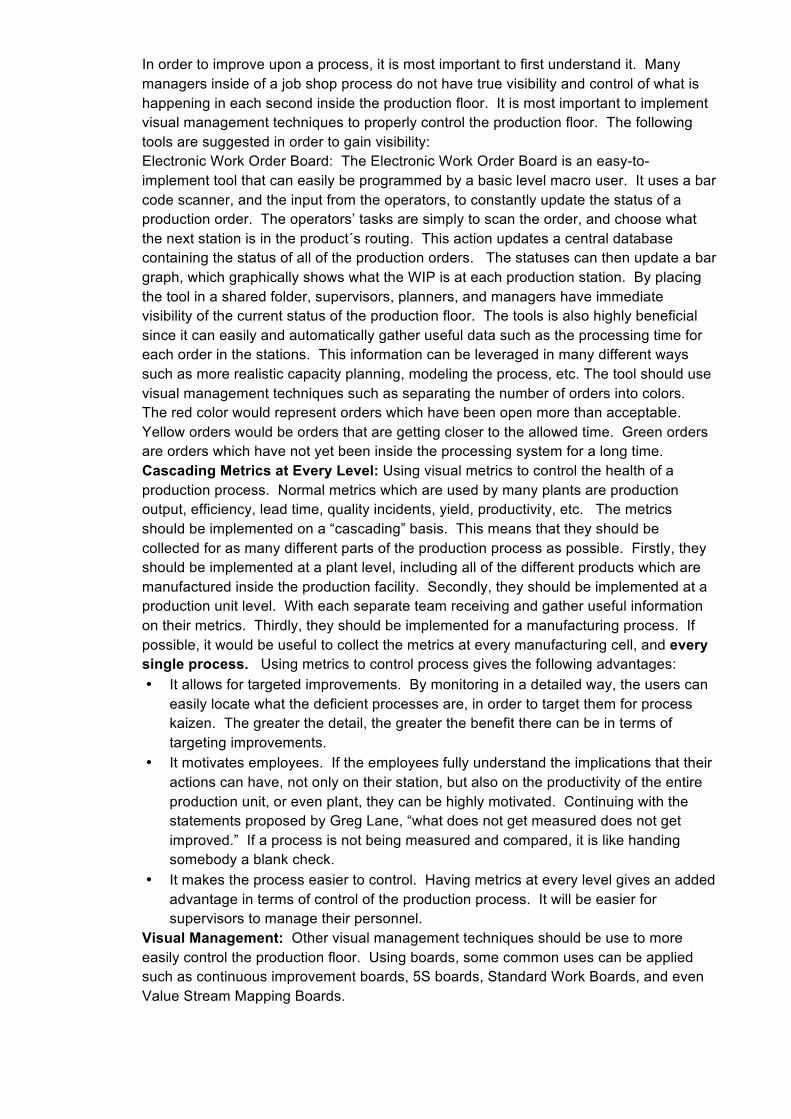
In order to improve upon a process, it is most important to first understand it. Many managers inside of a job shop process do not have true visibility and control of what is happening in each second inside the production floor. It is most important to implement visual management techniques to properly control the production floor. The following tools are suggested in order to gain visibility: Electronic Work Order Board: The Electronic Work Order Board is an easy-to-implement tool that can easily be programmed by a basic level macro user. It uses a bar code scanner, and the input from the operators, to constantly update the status of a production order. The operators’ tasks are simply to scan the order, and choose what the next station is in the product´s routing. This action updates a central database containing the status of all of the production orders. The statuses can then update a bar graph, which graphically shows what the WIP is at each production station. By placing the tool in a shared folder, supervisors, planners, and managers have immediate visibility of the current status of the production floor. The tools is also highly beneficial since it can easily and automatically gather useful data such as the processing time for each order in the stations. This information can be leveraged in many different ways such as more realistic capacity planning, modeling the process, etc. The tool should use visual management techniques such as separating the number of orders into colors. The red color would represent orders which have been open more than acceptable. Yellow orders would be orders that are getting closer to the allowed time. Green orders are orders which have not yet been inside the processing system for a long time. Cascading Metrics at Every Level: Using visual metrics to control the health of a production process. Normal metrics which are used by many plants are production output, efficiency, lead time, quality incidents, yield, productivity, etc. The metrics should be implemented on a “cascading” basis. This means that they should be collected for as many different parts of the production process as possible. Firstly, they should be implemented at a plant level, including all of the different products which are manufactured inside the production facility. Secondly, they should be implemented at a production unit level. With each separate team receiving and gather useful information on their metrics. Thirdly, they should be implemented for a manufacturing process. If possible, it would be useful to collect the metrics at every manufacturing cell, and every single process. Using metrics to control process gives the following advantages: • It allows for targeted improvements. By monitoring in a detailed way, the users can
easily locate what the deficient processes are, in order to target them for process kaizen. The greater the detail, the greater the benefit there can be in terms of targeting improvements.
• It motivates employees. If the employees fully understand the implications that their actions can have, not only on their station, but also on the productivity of the entire production unit, or even plant, they can be highly motivated. Continuing with the statements proposed by Greg Lane, “what does not get measured does not get improved.” If a process is not being measured and compared, it is like handing somebody a blank check.
• It makes the process easier to control. Having metrics at every level gives an added advantage in terms of control of the production process. It will be easier for supervisors to manage their personnel.
Visual Management: Other visual management techniques should be use to more easily control the production floor. Using boards, some common uses can be applied such as continuous improvement boards, 5S boards, Standard Work Boards, and even Value Stream Mapping Boards.
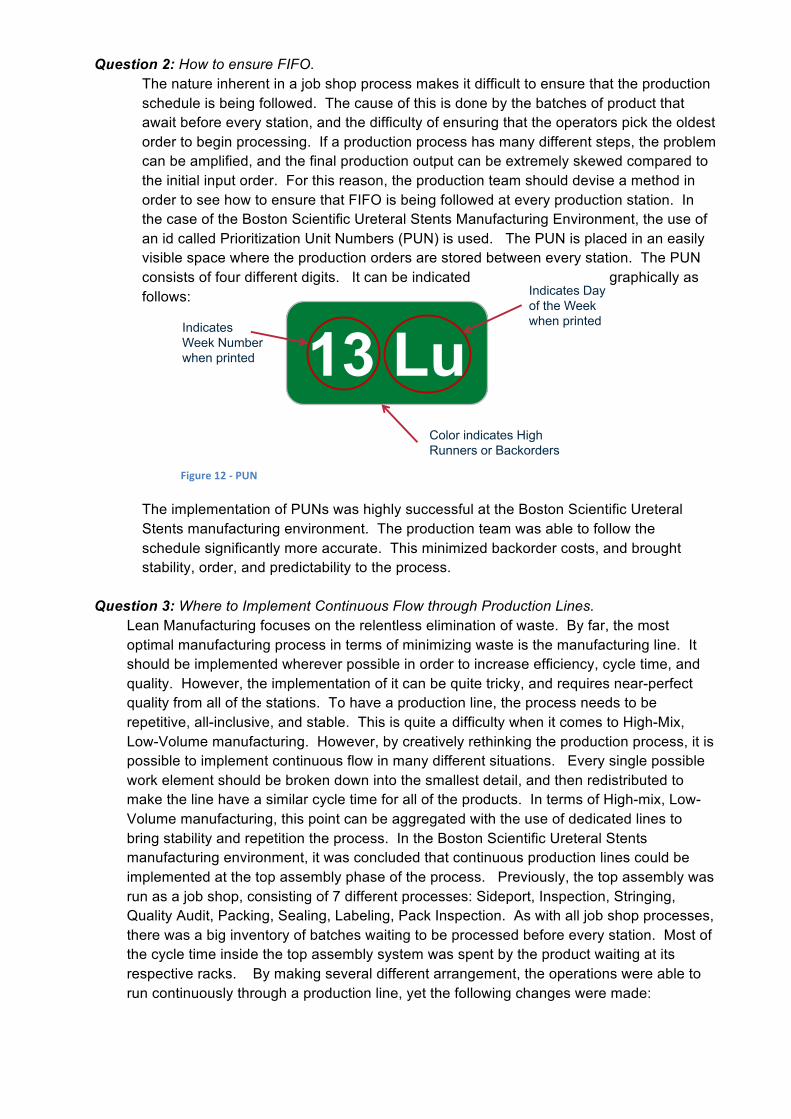
13 LuIndicatesWeek Numberwhen printed
Indicates Day of the Weekwhen printed
Color indicates High Runners or Backorders
Question 2: How to ensure FIFO. The nature inherent in a job shop process makes it difficult to ensure that the production schedule is being followed. The cause of this is done by the batches of product that await before every station, and the difficulty of ensuring that the operators pick the oldest order to begin processing. If a production process has many different steps, the problem can be amplified, and the final production output can be extremely skewed compared to the initial input order. For this reason, the production team should devise a method in order to see how to ensure that FIFO is being followed at every production station. In the case of the Boston Scientific Ureteral Stents Manufacturing Environment, the use of an id called Prioritization Unit Numbers (PUN) is used. The PUN is placed in an easily visible space where the production orders are stored between every station. The PUN consists of four different digits. It can be indicated graphically as follows:
The implementation of PUNs was highly successful at the Boston Scientific Ureteral Stents manufacturing environment. The production team was able to follow the schedule significantly more accurate. This minimized backorder costs, and brought stability, order, and predictability to the process.
Question 3: Where to Implement Continuous Flow through Production Lines.
Lean Manufacturing focuses on the relentless elimination of waste. By far, the most optimal manufacturing process in terms of minimizing waste is the manufacturing line. It should be implemented wherever possible in order to increase efficiency, cycle time, and quality. However, the implementation of it can be quite tricky, and requires near-perfect quality from all of the stations. To have a production line, the process needs to be repetitive, all-inclusive, and stable. This is quite a difficulty when it comes to High-Mix, Low-Volume manufacturing. However, by creatively rethinking the production process, it is possible to implement continuous flow in many different situations. Every single possible work element should be broken down into the smallest detail, and then redistributed to make the line have a similar cycle time for all of the products. In terms of High-mix, Low-Volume manufacturing, this point can be aggregated with the use of dedicated lines to bring stability and repetition the process. In the Boston Scientific Ureteral Stents manufacturing environment, it was concluded that continuous production lines could be implemented at the top assembly phase of the process. Previously, the top assembly was run as a job shop, consisting of 7 different processes: Sideport, Inspection, Stringing, Quality Audit, Packing, Sealing, Labeling, Pack Inspection. As with all job shop processes, there was a big inventory of batches waiting to be processed before every station. Most of the cycle time inside the top assembly system was spent by the product waiting at its respective racks. By making several different arrangement, the operations were able to run continuously through a production line, yet the following changes were made:
Figure 12 -‐ PUN
o The sideport process was divided into two different work elements. One operator loaded the stent with the “filler” which prevents the drill to go through both sides, while the other one performed the drilling. This made Sideport, which was the process with the highest cycle time, and the biggest fatigue factor, be able to run continuously.
o The Quality Audit, which previously required a completely separate physical station, was incorporated into the manufacturing line. Since the Quality Audit is made with only fifteen units out of a batch of 300, the station was renovated into a temporary station, with the use of a cart. The cart allowed for the operator to easily transport the tools between the production lines and perform the necessary quality audits.
o Dedicated Production Lines: The process was very difficult to balance and control if it were to run all of the possible products. This is because every single product has different requirements in terms of capacity. For this purpose, the to assembly process was assigned dedicated production lines. Since 75% of the total demand is split almost evenly into the Percuflex, Polaris, and Contour families, each of them were assigned a dedicated line. A separate line was assigned in order to run the low-runners, which unstably make-up the remaining 25% of the production demand. The production line which manufactured the low runners is more similar to a flexible manufacturing cell, than a production line.
The implementation of the Production Lines had enormous benefits, not only in the cycle time which was reduced by 32%, or the WIP which was reduced by $40,000, but also an increase in efficiency of over 25% for each production line. The daily goal for the output of top assembly was previously 700 units a day, was increased to 900. The enormous increase in productivity was not initially anticipated. The reason for this increase was due to the employee motivation by working in a single line. In addition, some of the elements that were constituted in the line changeover were reduced by performing them only once for the entire batch.
Question 4: Where to implement continuous flow using flexible manufacturing cells?
In reality, the product mix that causes the large variance in cycle times for the processes can sometimes make continuous flow through production lines a very difficult task. However, this does not mean that the process necessary will need to be run in a “batch and queue” mechanism. It is in this sense that flexible manufacturing cells should be implemented. A flexible manufacturing cell is a group of processes which are grouped together physically, and run in a continuous flow. However, it varies from a manufacturing line in that it is a lot less static. In a production line, where mass production is made, processes can be run repetitively and consistently, which makes it easy to balance a production line. Because of different machine cycle times, and the changing proportion of products, make a high difference in cycle times between processes. Running them in a continuous flow manner would cause one machine to be constantly waiting for the other one. The difference is that flexible manufacturing cells are adaptable to many situations. By having a cross-trained work force, the manufacturing cell can adapt and change depending on the type of product that it runs. In flexible manufacturing cells, it would be very difficult to establish no WIP between the operations. Given the variety of possible products that are run, the operators need to accumulate some WIP between two stations, and then transfer to another station to keep processing. In some cases, the operator might perform two operations with the same batch in a successive way. Although this does create some WIP, it is more optimal to do this. This is because the following situation creates a WIP that is at most, the size of a full batch. Whereas in a job shop process, such as the Ureteral Stents
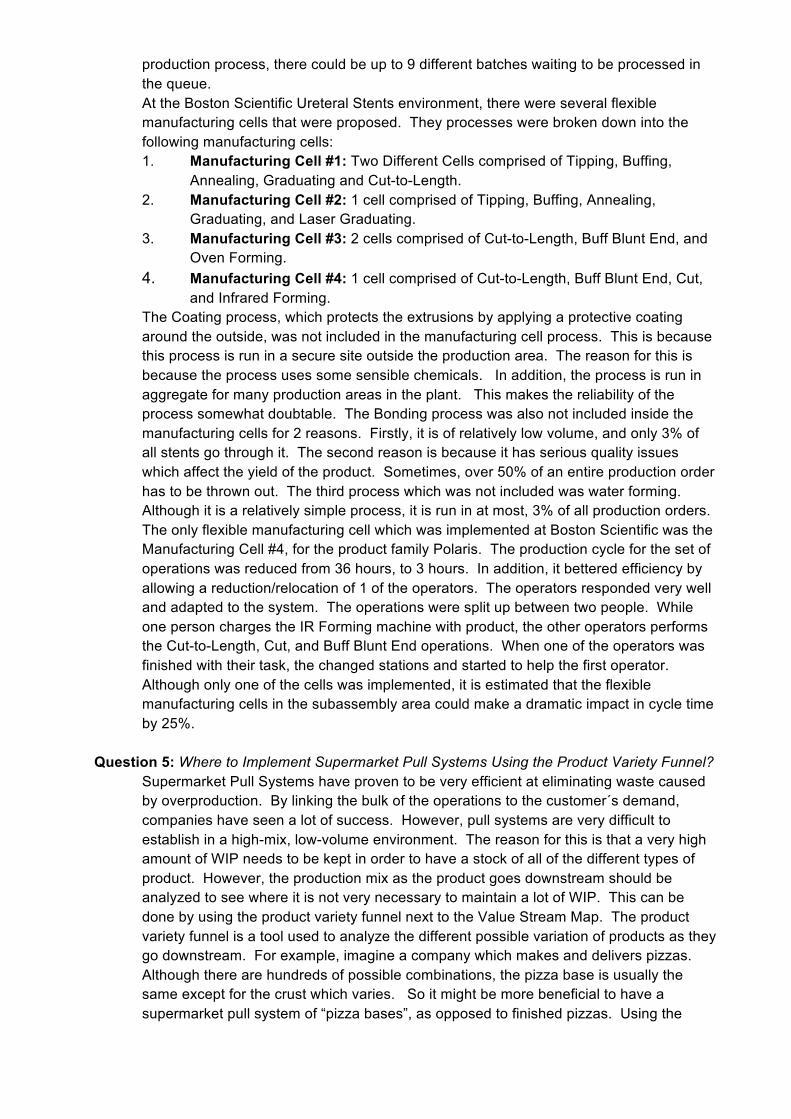
production process, there could be up to 9 different batches waiting to be processed in the queue. At the Boston Scientific Ureteral Stents environment, there were several flexible manufacturing cells that were proposed. They processes were broken down into the following manufacturing cells: 1. Manufacturing Cell #1: Two Different Cells comprised of Tipping, Buffing,
Annealing, Graduating and Cut-to-Length. 2. Manufacturing Cell #2: 1 cell comprised of Tipping, Buffing, Annealing,
Graduating, and Laser Graduating. 3. Manufacturing Cell #3: 2 cells comprised of Cut-to-Length, Buff Blunt End, and
Oven Forming. 4. Manufacturing Cell #4: 1 cell comprised of Cut-to-Length, Buff Blunt End, Cut,
and Infrared Forming. The Coating process, which protects the extrusions by applying a protective coating around the outside, was not included in the manufacturing cell process. This is because this process is run in a secure site outside the production area. The reason for this is because the process uses some sensible chemicals. In addition, the process is run in aggregate for many production areas in the plant. This makes the reliability of the process somewhat doubtable. The Bonding process was also not included inside the manufacturing cells for 2 reasons. Firstly, it is of relatively low volume, and only 3% of all stents go through it. The second reason is because it has serious quality issues which affect the yield of the product. Sometimes, over 50% of an entire production order has to be thrown out. The third process which was not included was water forming. Although it is a relatively simple process, it is run in at most, 3% of all production orders. The only flexible manufacturing cell which was implemented at Boston Scientific was the Manufacturing Cell #4, for the product family Polaris. The production cycle for the set of operations was reduced from 36 hours, to 3 hours. In addition, it bettered efficiency by allowing a reduction/relocation of 1 of the operators. The operators responded very well and adapted to the system. The operations were split up between two people. While one person charges the IR Forming machine with product, the other operators performs the Cut-to-Length, Cut, and Buff Blunt End operations. When one of the operators was finished with their task, the changed stations and started to help the first operator. Although only one of the cells was implemented, it is estimated that the flexible manufacturing cells in the subassembly area could make a dramatic impact in cycle time by 25%.
Question 5: Where to Implement Supermarket Pull Systems Using the Product Variety Funnel?
Supermarket Pull Systems have proven to be very efficient at eliminating waste caused by overproduction. By linking the bulk of the operations to the customer´s demand, companies have seen a lot of success. However, pull systems are very difficult to establish in a high-mix, low-volume environment. The reason for this is that a very high amount of WIP needs to be kept in order to have a stock of all of the different types of product. However, the production mix as the product goes downstream should be analyzed to see where it is not very necessary to maintain a lot of WIP. This can be done by using the product variety funnel next to the Value Stream Map. The product variety funnel is a tool used to analyze the different possible variation of products as they go downstream. For example, imagine a company which makes and delivers pizzas. Although there are hundreds of possible combinations, the pizza base is usually the same except for the crust which varies. So it might be more beneficial to have a supermarket pull system of “pizza bases”, as opposed to finished pizzas. Using the
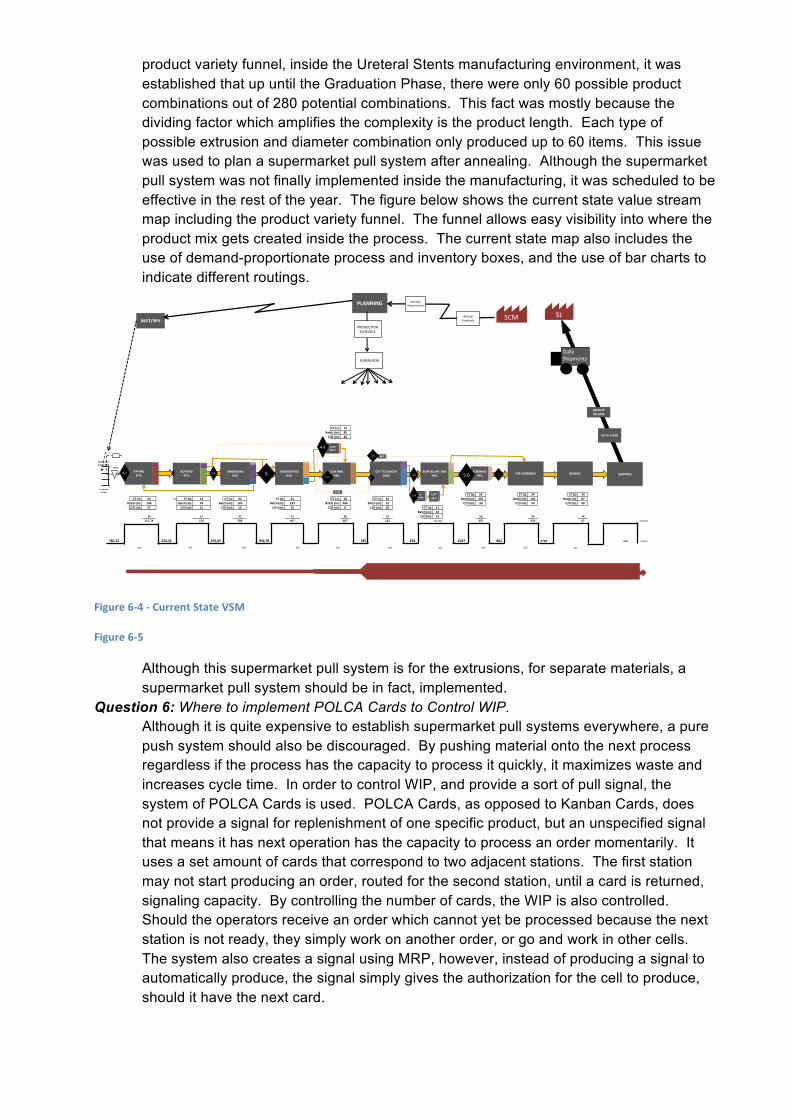
product variety funnel, inside the Ureteral Stents manufacturing environment, it was established that up until the Graduation Phase, there were only 60 possible product combinations out of 280 potential combinations. This fact was mostly because the dividing factor which amplifies the complexity is the product length. Each type of possible extrusion and diameter combination only produced up to 60 items. This issue was used to plan a supermarket pull system after annealing. Although the supermarket pull system was not finally implemented inside the manufacturing, it was scheduled to be effective in the rest of the year. The figure below shows the current state value stream map including the product variety funnel. The funnel allows easy visibility into where the product mix gets created inside the process. The current state map also includes the use of demand-proportionate process and inventory boxes, and the use of bar charts to indicate different routings.
Figure 6-‐4 -‐ Current State VSM
Figure 6-‐5
Although this supermarket pull system is for the extrusions, for separate materials, a supermarket pull system should be in fact, implemented.
Question 6: Where to implement POLCA Cards to Control WIP. Although it is quite expensive to establish supermarket pull systems everywhere, a pure push system should also be discouraged. By pushing material onto the next process regardless if the process has the capacity to process it quickly, it maximizes waste and increases cycle time. In order to control WIP, and provide a sort of pull signal, the system of POLCA Cards is used. POLCA Cards, as opposed to Kanban Cards, does not provide a signal for replenishment of one specific product, but an unspecified signal that means it has next operation has the capacity to process an order momentarily. It uses a set amount of cards that correspond to two adjacent stations. The first station may not start producing an order, routed for the second station, until a card is returned, signaling capacity. By controlling the number of cards, the WIP is also controlled. Should the operators receive an order which cannot yet be processed because the next station is not ready, they simply work on another order, or go and work in other cells. The system also creates a signal using MRP, however, instead of producing a signal to automatically produce, the signal simply gives the authorization for the cell to produce, should it have the next card.
GRADUATING LASER GRADUATING CUT TO LENGTH BUFF BLUNT END BONDING FORMING IR FORMING WATER FORMING COATING CUT TOP ASSEMBLY
BUFFING ANNEALINGBUFFINGGRADUATING
TIPPING 96% 1%0% 0
TIPPING BUFFING
CT (s): 14Batch (m): 85C/O (m): 20
CT (s): 56 CT (s): 24 CT (s): 14CT (s): 24 370 CT (s): 13 CT (s): 31 CT (s): 31 CT (s): 28 CT (s): 10 Batch (m): 337 Batch (m): 144 Batch (m): 87
Batch (m): 146 Batch (m): 78 Batch (m): 183 Batch (m): 187 Batch (m): 480 Batch (m): 61 C/O (m): 30 C/O (m): 40 C/O (m): 40C/O (m): 37 C/O (m): 15 C/O (m): 15 C/O (m): 25 C/O (m): 0 C/O (m): 30 CT (s): 11
Batch (m): 6724 13 31 31 28 10 C/O (m): 15 56 24 14
317,74 170 398 407 667 133 144,7826 337 554 87 3213,602
785,22 224,35 635,65 934,78 187 1047 662 2769 2880 9133,81
46% 46% 46% 46% 72% 46% 46% 46% 26% 26%
654
TIPPING97%
BUFFING97%
ANNEALING95%
CUT TO LENGTH100%
BUFF BLUNT END 94%
FORMING59% TOP ASSEMBLY
CUT32%
LASER GRAD
WF
BOND
BOXING
Daily Shipments
StSCM
PLANNING
AnnualForecasts
Monthly Requirements
MAT/WH
Batch
1 order at a Time
High Runner Supermarket
PRODUCTIONSCHEDULE
IR FORM
GRADUATING95%
COATING94% SHIPPING
DATA CLERK
QUALITY RELEASE
SUPERVISOR
4,2 1.2 3.4 513.4 1.
3.5 25.6
.75
4.8
3.4
A/B
POLCA Cards have not yet been implemented inside the Ureteral Stents manufacturing center, however, they have been planned to be implemented in 2013. It is estimated that the use of POLCA Cards to control the WIP between the stations could give a reduction in Lead Time of 10%, which results from the liberation of some of the queues which cause an excessive waiting time. To implement POLCA Cards into the regular Value Stream Mapping icons, they have been included as such:
Icon used to indicate the use of POLCA Cards between
two hypothetical stations A and B. Question 7:What is the Pacemaker at each Loop?
Through this question, the concept of a Loop is defined. A loop is any set of operations through which there is continuous flow. In our case, loops would indicate the manufacturing lines and the manufacturing cells comprised of all of the different processes. The Pacemaker at each loop is the process which sets the pace for the entire manufacturing cell. The term may be used interchangeably with the term of a bottleneck, however, they are not equal. The pacemaker is usually the most upstream process in a continuous flow loop. Once the loops are established through the use of production lines or flexible manufacturing cells, then the concept of Takt time should be implemented to control the process. In addition, operator balance charts should be completed for each of the different loops, which tell how well the operations are balanced against the pace maker. Most lean literature suggests the use of operator balance charts to compare the cycle times of the product against the takt image. However, the charts can be expanded to include other useful information. An addition of operator balance charts at Boston Scientific was explored into the form of a Work Content Graph. The Work Content Graph separates the total cycle time into touch time, waiting time, and machine cycle time, which exposes significant opportunities to eliminate waste. In addition, the graph includes several metrics used to judge the balance of the process, such as a comparison of the cycle times to the takt time, the comparison vs. the yielded takt time, and the comparison versus the cycle time of the pacemaker. The pacemaker is mostly useful in production lines, and manufacturing cells which show fairly consistent product families.
Question 8: How to plan and level the mix to meet the production schedule?
Although a lot of High-Mix, Low-Volume manufacturing facilities may reach their goals in terms of total output, it is very difficult and rare to meet the targets for all of the different products, or even product families. For that reason, the production schedule should be made taking into account the actual time it takes to produce each product. This concept goes one step further than leveling the load in conventional Lean Manufacturing. The load should in fact be level, yet not in terms of units, but in terms of capacity. By collecting the times that each process should take for each particular unit, the planning department can have a greater visibility of how to plan each weekly production schedule given the capacity that is necessary at each particular line. By using the Work Content Graph, and the standard times for each product, at each process, the total capacity needed for the week should be calculated. By aligning the total work hours that are needed to product each unit, and leveling using a heijunka box, the flexible system should be able to realign itself in order to be able to meet the production schedule.
It is especially important in High-Mix, Low-Volume manufacturing environment to reduce the batch size as much as possible. This is because the large variation in the process commonly requires a large amount of production orders to be open on the floor at a time. By reducing the batch size, there can be significant improvement on the lead time and flow of the process. In addition, small batch sizes are the key to having flexible operations which can meet whatever product mix is necessary in the production line. Reducing the batch size is completed by making changeover time as small as possible. SMED methodology is used to complete this task. For more information on SMED, please read A Revolution in Manufacturing: The SMED System by Shingeo Shingo.
Question 9: What Improvements are necessary to reach the future state?
Although Value Stream Mapping has long been considered as a flow kaizen tool, as opposed to a process kaizen tool, the two work together in combination. Many times, in order to reach the future state of the value stream map, there is a necessity to perform some process kaizen initiatives such as improving uptime on a machine, lowering cycle time in an operation, or improving the quality of the output. Although flow is established by eliminating the tollgates, or automatic stops between them, there is also a necessity to improve on the separate processes. This follows the Theory of Constraints methodology, in which the bottleneck or the pacemaker needs to be altered in order to better the process. In the case of the Boston Scientific Ureteral Stents manufacturing environment, there were several process kaizen initiatives that were completed in order to produce the flow in the process. These initiatives were: o Lowering the cycle time in the oven forming process. In order to have sufficient Work
in Progress to constantly feed the continuous flow lines at the top assembly part of the process, the need to better the cycle time at the Oven Forming Process was necessary. There was a separate initiative that performed the Design of Experiments, to properly document the impact of changing the oven forming time from 10 to 2 hours. By reducing this time, the bottleneck of the entire process was relieved, and the oven forming process was able to commit the necessary Work in Progress for the Top Assembly 1-Piece Flow lines to be occupied. In addition, this freed a large amount of time in a specific resource, which let to the extra capacity of the oven forming cycle. This extra capacity can be used in the future, for demand surges, and for better capitalization of the resources.
o Improving the Tipping Process: The Tipping process experienced many difficulties because of the old machines. The difficulties affected almost all of the metrics including the quality, the yield, the cycle time, and they put in danger the production output. In addition, its high cycle time, and its variable and long changeover time, prevented continuous flow from being established between the tipping, and the buffing stations. To improve on the process, Boston Scientific purchased new machines that were much more reliable, and faster.
o Splitting the Sideport Operations: Previously, the sideport operation had the highest cycle time out of any of the other operations in the top assembly manufacturing process. This prevented the entire line to be run continuously. To compensate for this, the Boston Scientific staff explored the purchase of another sideport machine. They also explored the need to run the Sideport operation in a second shift. To compensate for this, the sideport operation was divided into two components. While one operator was responsible for charging the ureteral stents with the special filler,
the other one performed the sideport operation. This is usually done momentarily, as the cycle time from both processes is significantly lower than the rest, yet they can build up some buffer stock, and then the product builder can switch back to the next operation, to keep the Work in Progress in Flow.
Question 10: How to standardize new work flow?
In order to see the full potential of benefits of the new work flows that are created using Value Stream Mapping, there is a need to standardize the operation. By using the standard work tool to eliminate variability, and to properly document the right way to perform a task, all of the uncertainties that the operators have when running High-Mix, Low-Volume manufacturing lines are exposed. Standard work is defined as any operator following a prescribed method, with a proper workstation and proper tools, should be able to perform the amount of work required in the same amount of time, with perfect quality, without risk to health or safety. New processes can leave many people confused, especially operators. To effectively establish standard work, there needs to be a thorough cultural initiative. The management of the standard work should be performed through audits. The people auditing the standard work process should be all of the levels of stakeholders within the manufacturing plant. The audit should also include a time study to make sure that the process is being completed within the control limits of the operation, and a complete check of 5S, to make sure that the work center is properly configured. At the Boston Scientific, standard work was successfully implemented using a T-Card System. The T-Cards were available for each of the stakeholders which needed to perform the Standard Work audits in the production line. The T-Cards had two separate sides; the green side was displayed when the stakeholder had performed the audit during the required time frame. The red card indicated that it was necessary for the stakeholder to complete a standard work audit. The cards were also used for all of the production process. The red card indicates that the process did not pass the standard work audit, and at that moment, there were actions implemented to better the quality of the process.
6.4 4th Step: If the family distribution is stable, complete VSM on separate families
After improvement opportunities have been discovered for the entire process, it is also useful to go back to the family analysis, and perform conventional value stream mapping (as described in Learning to See). The usefulness of performing regular value stream mapping will depend on the distribution and variability of the demand. Should the demand have a very small amount of families which encapsulate most of the demand, there could be a lot of value from dedicating a separate value stream map for the family. Most value will be extracted by performing the Value Stream Map for the high running product families. This is because there is a bigger chance that equipment can be dedicated to that single product family, which can help create flow in the production line. When implementing Value Stream Mapping as proposed in Learning to See, there might be some conflicts with the improvement initiatives that were developed while Value Stream Mapping the entire line. In order to prioritize which improvements are optimal, they must each be considered on the potential monetary impact, and how much they reduce waste for the entire system. Since most improvements which affect the entire line usually have more impact than those that only affect a single family, they are usually prioritized before.
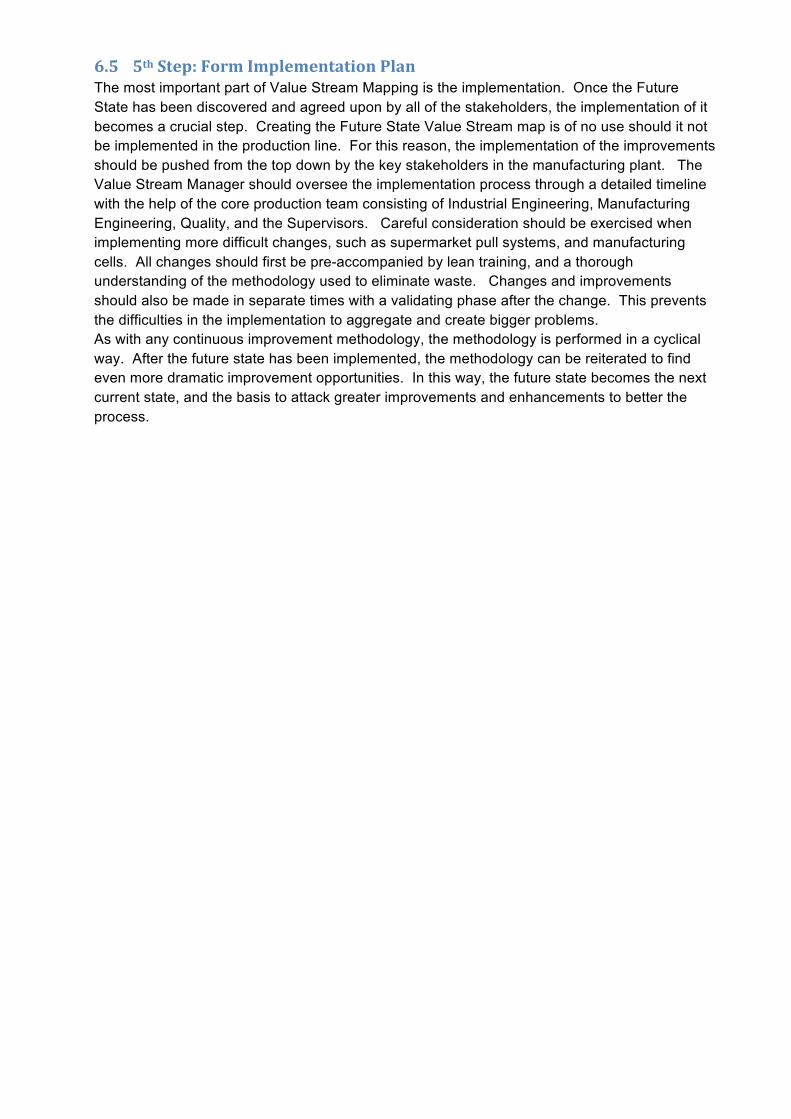
6.5 5th Step: Form Implementation Plan The most important part of Value Stream Mapping is the implementation. Once the Future State has been discovered and agreed upon by all of the stakeholders, the implementation of it becomes a crucial step. Creating the Future State Value Stream map is of no use should it not be implemented in the production line. For this reason, the implementation of the improvements should be pushed from the top down by the key stakeholders in the manufacturing plant. The Value Stream Manager should oversee the implementation process through a detailed timeline with the help of the core production team consisting of Industrial Engineering, Manufacturing Engineering, Quality, and the Supervisors. Careful consideration should be exercised when implementing more difficult changes, such as supermarket pull systems, and manufacturing cells. All changes should first be pre-accompanied by lean training, and a thorough understanding of the methodology used to eliminate waste. Changes and improvements should also be made in separate times with a validating phase after the change. This prevents the difficulties in the implementation to aggregate and create bigger problems. As with any continuous improvement methodology, the methodology is performed in a cyclical way. After the future state has been implemented, the methodology can be reiterated to find even more dramatic improvement opportunities. In this way, the future state becomes the next current state, and the basis to attack greater improvements and enhancements to better the process.
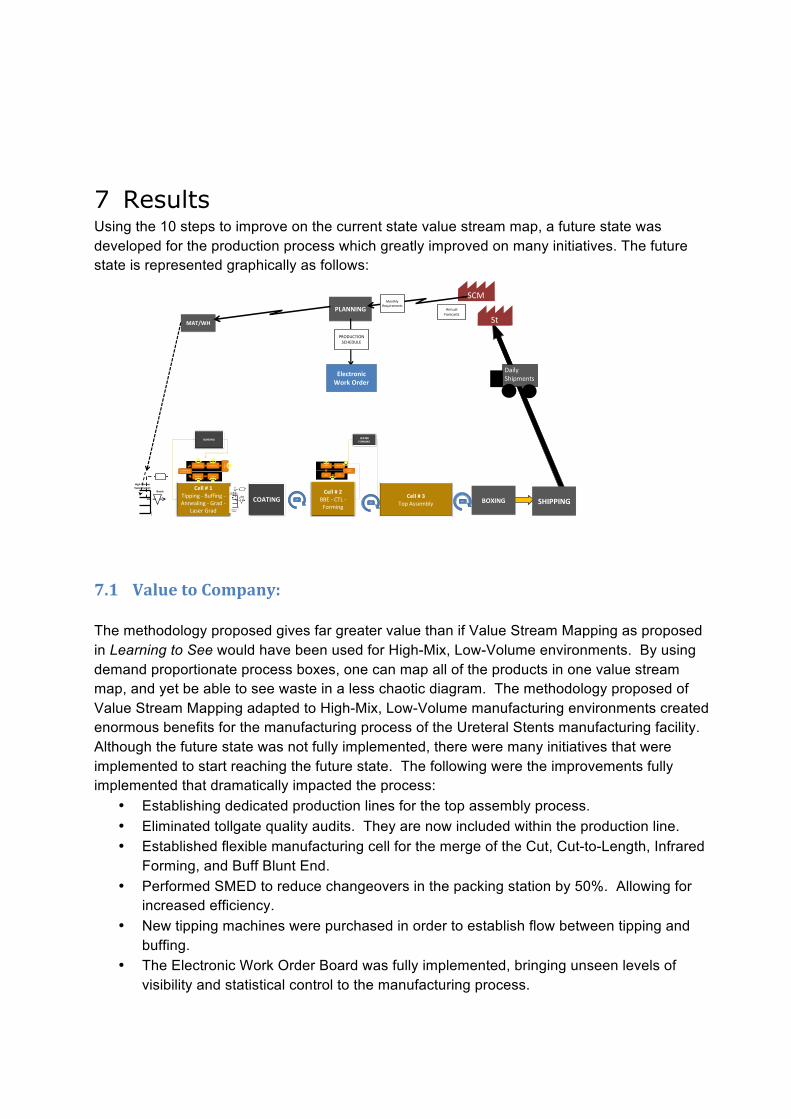
BUFF BLUNT END BONDING FORMING IR FORMING WATER FORMING COATING CUT TOP ASSEMBLY
Cell # 1Tipping -‐ Buffing -‐Annealing -‐ Grad -‐
Laser Grad
Cell # 2BBE -‐ CTL -‐Forming
Cell # 3Top Assembly
COATING
WATER FORMING
BONDING
BOXING
Daily Shipments
St
SCMPLANNING Annual
Forecasts
Monthly Requirements
MAT/WH
Batch
1 order at a Time
High Runner Supermarket
SHIPPING
PRODUCTIONSCHEDULE
TippingBuffing
Annealing w vertical rack
Graduating Graduating
Laser
CTLBBE
FORMING RACK
FORMING FORMING
A/BA/B
A/B
Electronic Work Order
Batch
1 order at a Time
High Runner Supermarket
7 Results Using the 10 steps to improve on the current state value stream map, a future state was developed for the production process which greatly improved on many initiatives. The future state is represented graphically as follows:
7.1 Value to Company: The methodology proposed gives far greater value than if Value Stream Mapping as proposed in Learning to See would have been used for High-Mix, Low-Volume environments. By using demand proportionate process boxes, one can map all of the products in one value stream map, and yet be able to see waste in a less chaotic diagram. The methodology proposed of Value Stream Mapping adapted to High-Mix, Low-Volume manufacturing environments created enormous benefits for the manufacturing process of the Ureteral Stents manufacturing facility. Although the future state was not fully implemented, there were many initiatives that were implemented to start reaching the future state. The following were the improvements fully implemented that dramatically impacted the process:
• Establishing dedicated production lines for the top assembly process. • Eliminated tollgate quality audits. They are now included within the production line. • Established flexible manufacturing cell for the merge of the Cut, Cut-to-Length, Infrared
Forming, and Buff Blunt End. • Performed SMED to reduce changeovers in the packing station by 50%. Allowing for
increased efficiency. • New tipping machines were purchased in order to establish flow between tipping and
buffing. • The Electronic Work Order Board was fully implemented, bringing unseen levels of
visibility and statistical control to the manufacturing process.
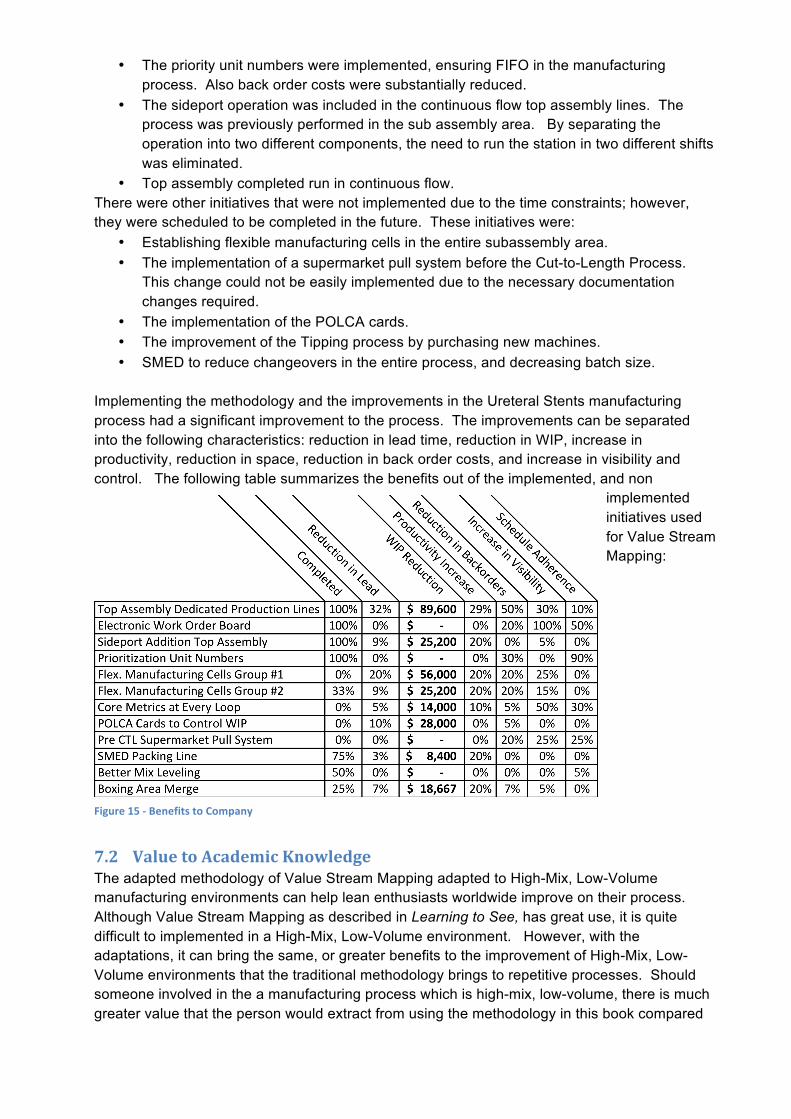
• The priority unit numbers were implemented, ensuring FIFO in the manufacturing process. Also back order costs were substantially reduced.
• The sideport operation was included in the continuous flow top assembly lines. The process was previously performed in the sub assembly area. By separating the operation into two different components, the need to run the station in two different shifts was eliminated.
• Top assembly completed run in continuous flow. There were other initiatives that were not implemented due to the time constraints; however, they were scheduled to be completed in the future. These initiatives were:
• Establishing flexible manufacturing cells in the entire subassembly area. • The implementation of a supermarket pull system before the Cut-to-Length Process.
This change could not be easily implemented due to the necessary documentation changes required.
• The implementation of the POLCA cards. • The improvement of the Tipping process by purchasing new machines. • SMED to reduce changeovers in the entire process, and decreasing batch size.
Implementing the methodology and the improvements in the Ureteral Stents manufacturing process had a significant improvement to the process. The improvements can be separated into the following characteristics: reduction in lead time, reduction in WIP, increase in productivity, reduction in space, reduction in back order costs, and increase in visibility and control. The following table summarizes the benefits out of the implemented, and non
implemented initiatives used for Value Stream Mapping:
7.2 Value to Academic Knowledge The adapted methodology of Value Stream Mapping adapted to High-Mix, Low-Volume manufacturing environments can help lean enthusiasts worldwide improve on their process. Although Value Stream Mapping as described in Learning to See, has great use, it is quite difficult to implemented in a High-Mix, Low-Volume environment. However, with the adaptations, it can bring the same, or greater benefits to the improvement of High-Mix, Low-Volume environments that the traditional methodology brings to repetitive processes. Should someone involved in the a manufacturing process which is high-mix, low-volume, there is much greater value that the person would extract from using the methodology in this book compared
Figure 15 -‐ Benefits to Company
to the value that they would extract from Learning to See. That is because the methodology considers the special situations that arise in high-mix, low-volume manufacturing, and addresses them specifically. From an academic point of view, the methodology proposed in this master thesis has greatly expanded the potential in which value stream mapping can add value to processes. In traditional Value Stream Mapping, value streams are only considered for product families. This methodology looks at a holistic view of the manufacturing process to include all of the product manufactured inside the value stream. Not only does that bring value to high-mix, low-volume processes, yet it also gives insight into improving processes considering more than one family, even if the process exhibits a medium product mix. From an academic point of view, the methodology proposed in this master thesis also provides some innovative tools to improve High-Mix, Low-Volume processes:
• Electronic Work Order Board: By taking the Work Order Board concept proposed by Greg Lane in his book Learning to See, and adapting it to an excel macro VBA sheet, there has been an easy and effective way to bring visibility to production floors. The electronic work order board is superior to a work order board because it provides an easier process to update, involved poka yoke by scanning the order, and it is also easier to visualize the data than a regular work order board. In addition, since the information is contained electronically, it allows for the automatic recollection of information about the process which provides an automated time study. All of this can also be done with expensive IT systems which rely on updating licenses, consultants, and expensive technical maintenance.
• Product Variety Funnel in the Value Stream Map: In addition, the use of the product variety funnel inside the value stream map adds another dimension of visibility and analysis into the use of Value Stream Mapping. The tool simplifies the decision of where to implement supermarket pull systems.
• Demand-Proportionate Process Boxes: By having different size process boxes, it makes it possible to map all of the possible flows in a high-mix, low-volume manufacturing process, yet it does seem to crowded. In addition, it makes it easier for the user to prioritize where waste is being created. It adds to the visual aspect of value stream mapping.
• Prioritization Unit Numbers: No other proposed literature had touched on the subject of the FIFO problem in High-Mix, Low-Volume manufacturing environments.
8 Further Research 8.1 Testing the Methodology in other Manufacturing Facilities Although the proposed methodology for Value Stream Mapping adapted to High-Mix, Low-Volume manufacturing environments brought many benefits to the Boston Scientific Ureteral Stents manufacturing environment, the methodology should be tested in other different types of process which feature a High-Mix. This is to identify if the tools proposed are equally beneficial in all High-Mix, Low-Volume processes, or if the methodology is more specialized for processes such as the manufacturing of the ureteral stents. High-Mix, Low-Volume manufacturing environments can vary largely in the product mix, in the lead-time, and the types of processes that it runs. It might be possible that the variation in the processes is so high that continuous flow might be an extremely difficult possibility. Although the stents environment has quite a large product mix with over 280 different finished goods being processed. Some High-Mix
environments might feature thousands of finished good. Other processes might be only for customized goods, which feature an ultimately infinite number of finished goods. It is said that each job shop process is a completely different animal. It would be extremely interesting to complete a comparative study of companies implementing Value Stream Mapping as described in Learning to See vs. the implementation of the adapted Value Stream Mapping methodology for High-Mix, Low-Volume manufacturing environments.
8.2 Expanding the Value Stream Map For the specific requirements of this master thesis, the methodology was focused on how to improve the manufacturing process for High-Mix, Low-Volume environments. Although there were some initiatives which expanded beyond the manufacturing process such as the merging of two boxing areas to improve the flow, and the kanban pull system for one of the processes, the main focus was how to achieve flow inside the job shop manufacturing process. This means that the focus of the methodology should broaden in order to include how to best optimize all of the processes inside the manufacturing plant. Once that is done, the possibilities should also be explored to map the entire value stream of the finished good. This means that the implementation of Lean Initiatives should be applied to the entire supply chain, and across the suppliers and vendors to truly realize a dramatic impact in the lead time of the entire production chain.
8.3 Testing in Less Manual Processes The implementation of some of the initiatives identified using Value Stream Mapping adapted to High-Mix, Low-Volume manufacturing environments was simplified by the fact that most of the manufacturing process for the Ureteral Stents is completely manual, which makes changing the process and implementing initiatives relatively easy compared with machinery-intensive processes which would need large CAPEX investments to complete effective improvement initiatives.
9 Bibliography 1. "10 Steps to Successful Value Stream Mapping." - Shop Strategies Tech Cell. N.p., n.d.
Web. 09 June 2012. <http://www.thefabricator.com/article/shopstrategies/10-steps-to-successful-value-stream-mapping>.
2. "Boston Scientific." Wikipedia. Wikimedia Foundation, 13 June 2012. Web. 14 June 2012. <http://en.wikipedia.org/wiki/Boston_Scientific>.
3. Collis, J., & Hussey, R. (2009). Business Research. A Practical Guide for Undergraduate
and Postgraduate Students (third edition). Palgrave MacMillan.
4. Dash, Nirod K. "Module: Selection of the Research Paradigm and Methodology." Research Methods Resource. N.p., n.d. Web. 09 June 2012. <http://www.celt.mmu.ac.uk/researchmethods/Modules/Selection_of_methodology/index.php>.
5. Dudley, Amber N. The Application of Lean Manufacturing Principles in a High Mix Low
Volume Environment. Diss. Massachusetts Institute of Technology, 1995. Print.
6. "Descriptive Research." Wikipedia. Wikimedia Foundation, 21 May 2012. Web. 09 June 2012. <http://en.wikipedia.org/wiki/Descriptive_research>.
7. "Exploratory Research." Wikipedia. Wikimedia Foundation, 06 July 2012. Web. 09 June
2012. <http://en.wikipedia.org/wiki/Exploratory_research>.
8. "Job Shop." Wikipedia. Wikimedia Foundation, 14 Feb. 2012. Web. 15 Apr. 2012. <http://en.wikipedia.org/wiki/Job_shop>.
9. <http://www4.hcmut.edu.vn/~ntdung_ise/Material/Lean%20Manufacturing/L6-Lean%2520Manufacturing%25206%2520-%2520Value%2520Stream%2520Mapping%2520Tools.pdf>.
10. Kabadurmus, Ozgur. A Comparative Study of POLCA and Generic CONWIP Systems in
Erratic Demand Conditions. Thesis. Auburn University, 2011. N.p.: n.p., n.d. Print.
11. Khaswala, ZahirAbbas N., and Shahrukh A. Irani. Value Network Mapping: Visualization and Analysis of Multiple Flows in Value Stream Maps. Diss. Ohio State University, 2001. St. Louis, MO: Proceedings of Lean Management Solutions Conference, 2001. Print.
12. International Directory of Company Histories, Vol. 37. St. James Press, 2001.
13. Lane, Greg. Made-to-order Lean: Excelling in a High-mix, Low-volume Environment. New York: Productivity, 2007. Print.
14. Liker, Jeffrey K. The Toyota Way: 14 Management Principles from the World’s Greatest
Manufacturer. New York: McGraw-Hill, 2004. Print.
15. Liker, Jeffrey K., and David Meier. The Toyota Way Fieldbook: A Practical Guide for Implementing Toyota's 4Ps. New York: McGraw-Hill, 2006. Print.
16. "Next Generation Manufacturing." : Cell Design for High-Mix Low-Volume Assembly.
N.p., n.d. Web. 09 June 2012. <http://mfg-research.blogspot.com/2006/01/cell-design-for-high-mix-low-volume.html>.
17. Rother, Mike, and John Shook. Learning to See: Value Stream Mapping to Create Value
and Eliminate Muda. Brookline, MA: Lean Enterprise Institute, 2003. Print.
18. Shingō, Shigeo. A Revolution in Manufacturing: The SMED System. Stamford, CT: Productivity, 1985. Print.
19. Suri, Rajan. Quick Response Manufacturing: A Companywide Approach to Reducing
Lead times. Portland, Or.: Productivity, 1998. Print.
20. Trochim, William. "Deduction & Induction." Deduction & Induction. N.p., n.d. Web. 15
Apr. 2012. <http://www.socialresearchmethods.net/kb/dedind.php>.
21. The 7 Value Stream Mapping Tools & VALSTAT. Ho Chi Minh City University of Technology, n.d. Web. 15 Mar. 2012.
22. "Ureteral Stent." Wikipedia. Wikimedia Foundation, 05 Jan. 2012. Web. 14 June 2012.
<http://en.wikipedia.org/wiki/Ureteral_stent>.
23. Ureteral Stents Portfolio. Natick: Boston Scientific Corporation, 2010. Print.
24. "Value Stream Mapping." Wikipedia. Wikimedia Foundation, 14 June 2012. Web. 14 June 2012. <http://en.wikipedia.org/wiki/Value_stream_mapping>.

25. "Value Stream Mapping for High Mix." Mixed Model Value Streams -. N.p., n.d. Web. 09 June 2012. <http://www.systems2win.com/lk/lean/vsmHighMix.htm>.
26. Yin, R. (2009), “Case study research: design and methods”, Los Angeles, SAGE Inc.