value ndex 4q 20 - bvresources.com
TRANSCRIPT
1DEALSTATS VALUE INDEX | 4Q 2020bvresources.com/dealstats
Value Index 4Q 2020
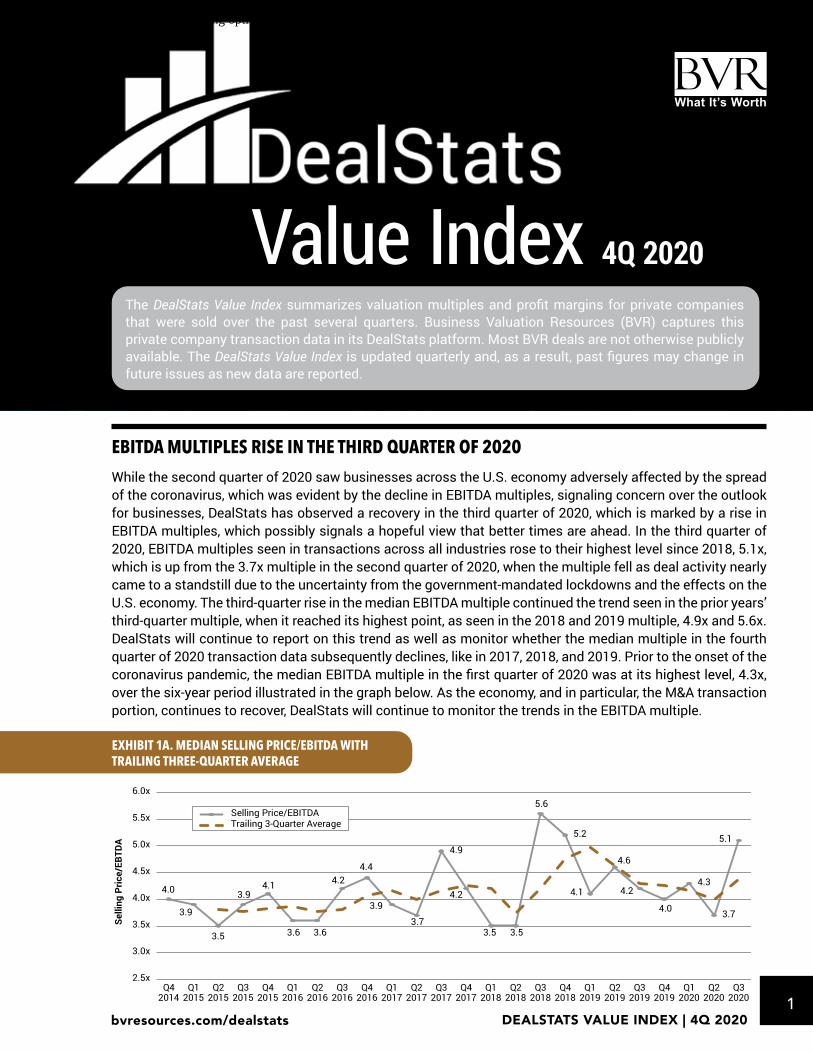
EBITDA MULTIPLES RISE IN THE THIRD QUARTER OF 2020
While the second quarter of 2020 saw businesses across the U.S. economy adversely affected by the spread of the coronavirus, which was evident by the decline in EBITDA multiples, signaling concern over the outlook for businesses, DealStats has observed a recovery in the third quarter of 2020, which is marked by a rise in EBITDA multiples, which possibly signals a hopeful view that better times are ahead. In the third quarter of 2020, EBITDA multiples seen in transactions across all industries rose to their highest level since 2018, 5.1x, which is up from the 3.7x multiple in the second quarter of 2020, when the multiple fell as deal activity nearly came to a standstill due to the uncertainty from the government-mandated lockdowns and the effects on the U.S. economy. The third-quarter rise in the median EBITDA multiple continued the trend seen in the prior years’ third-quarter multiple, when it reached its highest point, as seen in the 2018 and 2019 multiple, 4.9x and 5.6x. DealStats will continue to report on this trend as well as monitor whether the median multiple in the fourth quarter of 2020 transaction data subsequently declines, like in 2017, 2018, and 2019. Prior to the onset of the coronavirus pandemic, the median EBITDA multiple in the first quarter of 2020 was at its highest level, 4.3x, over the six-year period illustrated in the graph below. As the economy, and in particular, the M&A transaction portion, continues to recover, DealStats will continue to monitor the trends in the EBITDA multiple.
The DealStats Value Index summarizes valuation multiples and profit margins for private companies that were sold over the past several quarters. Business Valuation Resources (BVR) captures this private company transaction data in its DealStats platform. Most BVR deals are not otherwise publicly available. The DealStats Value Index is updated quarterly and, as a result, past figures may change in future issues as new data are reported.
4.0
3.9
3.5
3.94.1
3.6 3.6
4.24.4
3.9
3.7
4.9
4.2
3.5 3.5
5.6
5.2
4.1
4.6
4.2
4.0
4.3
3.7
5.1
2.5x
3.0x
3.5x
4.0x
4.5x
5.0x
5.5x
6.0x
Q42014
Q12015
Q22015
Q32015
Q42015
Q12016
Q22016
Q32016
Q42016
Q12017
Q22017
Q32017
Q42017
Q12018
Q22018
Q32018
Q42018
Q12019
Q22019
Q32019
Q42019
Q12020
Q22020
Q32020
Selli
ng P
rice/
EBTD
A
Selling Price/EBITDATrailing 3-Quarter Average
EXHIBIT 1A. MEDIAN SELLING PRICE/EBITDA WITH TRAILING THREE-QUARTER AVERAGE
This digital edition was created exclusively for the use of Stacy Jewell of Business Valuation Resources.For licensing options, please contact Business Valuation Resources at [email protected].

2DEALSTATS VALUE INDEX | 4Q 2020bvresources.com/dealstats
0.56
0.50
0.53
0.49 0.49
0.530.52 0.52
0.49
0.520.53 0.53 0.53
0.500.49
0.530.51
0.46
0.49
0.45
0.47
0.440.43
0.54
0.35x
0.40x
0.45x
0.50x
0.55x
0.60x
0.65x
Q42014
Q12015
Q22015
Q32015
Q42015
Q12016
Q22016
Q32016
Q42016
Q12017
Q22017
Q32017
Q42017
Q12018
Q22018
Q32018
Q42018
Q12019
Q22019
Q32019
Q42019
Q12020
Q22020
Q32020
Selli
ng P
rice/
Net
Sal
es
Selling Price/Net SalesTrailing 3-Quarter Average
EXHIBIT 1B. MEDIAN SELLING PRICE/NET SALES WITH TRAILING THREE-QUARTER AVERAGE
NET SALES MULTIPLE CLIMBS TO FIVE-YEAR HIGH IN 3Q 2020
In the third quarter of 2020, the net sales multiple rose to its highest level, 0.54x, since the fourth quarter of 2014. The rise in the third quarter follows the median second-quarter net sales multiple, which was at its lowest rate over the highlighted period and coincides with the onset of the U.S. recession caused by spread of the coronavirus. The median second-quarter net sales multiple, 0.43x, served as an indication of the risk and uncertainty related to the U.S. economy and with acquisitions during this period. Yet, as the economy began to recover in the third quarter and economic indicators such as retail sales, small-business optimism, manufacturing PMI, and services PMI, as captured in the Economic Outlook Update, returned to prepandemic levels, the median net sales multiple suggests a recovery is underway. In the period just prior to the pandemic, from the fourth quarter of 2018 through the first quarter of 2020, the net sales multiple had been trending lower, evident by declines in four of the subsequent quarters, as well as the line capturing each quarter’s rate trending lower than the line highlighting the trailing three-quarter average. The trailing three-quarter trend line best captures the downward trend from the third quarter of 2018 to the first quarter of 2020. In the period prior, from the first quarter of 2016 through the fourth quarter of 2017, the net sales multiple remained relatively smooth, except for a minor decline in the fourth quarter of 2016.
The selling prices referred to in the DealStats Value Index represent the market value of invested capital (MVIC) price paid for the target firm. The MVIC price is the total consideration paid to the target and includes any cash, notes, and/or securities that were used as a form of payment plus any interest-bearing liabilities of the target company that the acquirer assumed. For more information, please visit the DealStats FAQ page: bvresources.com/products/faqs/dealstats.
The multiples and transaction data presented in the DealStats Value Index include both asset sale purchases and stock sale purchases. Unless otherwise noted, the multiples and transaction data presented in the DealStats Value Index include purchases made by both private parties and public parties.
The DealStats Value Index (ISSN 1937-9021) is published quarterly and exclusively for subscribers of DealStats by Business Valuation Resources, LLC, 111 SW Columbia Street, Suite 750, Portland, OR 97201-5814. Contact [email protected] for more information or visit our website at bvresources.com.
Although the information in this publication has been obtained from sources that BVR believes to be reliable, we do not guarantee its accuracy, and such information may be condensed or incomplete. This publication is intended for information purposes only, and it is not intended as financial, investment, legal, or consulting advice.
Copyright 2020, Business Valuation Resources, LLC (BVR). All rights reserved. No part of this document may be reproduced without express written consent from BVR. Please direct requests to [email protected].
Kenneth WooEconomic and
Data Editor
Adam Manson Director
Valuation Data
David Foster CEO
Lucretia Lyons President
Sarah Foster Customer Service
This digital edition was created exclusively for the use of Stacy Jewell of Business Valuation Resources.For licensing options, please contact Business Valuation Resources at [email protected].

3DEALSTATS VALUE INDEX | 4Q 2020bvresources.com/dealstats
EBITDA MARGINS FALL TO 11%
EBITDA, as a percentage of net sales, fell to 11% in the third quarter of 2020, moving down 1.0 percentage point from its rate of 12% in the prior quarter. From the second quarter of 2019 through the third quarter of 2020, or the most recent six quarters, EBITDA margins have seen very little change, coming in at 11% or 12% in each quarter. In the years prior, EBITDA margins fluctuated by a wider range, from 9% to 15%. The selling price-to-EBITDA multiple rose in the third quarter of 2020, to 5.1x, after seeing a significant decline in the second quarter, to 3.7x. Prior to 2019, the EBITDA multiple reported higher in the second half of each year, but the multiples in 2019 broke this trend and declined instead. With the uncertainty surrounding the presidential election and the coronavirus pandemic, DealStats will continue to monitor this trend to see whether it returns in 2020. The graph below highlights the trend of the EBITDA multiple moving opposite to that of EBITDA margins.
EXHIBIT 2. MEDIAN SELLING PRICE/EBITDA WITH EBITDA MARGINS
3.0x
3.3x
3.6x
3.9x
4.2x
4.5x
4.8x
5.1x
5.4x
5.7x
6.0x
Q42014
Q12015
Q22015
Q32015
Q42015
Q12016
Q22016
Q32016
Q42016
Q12017
Q22017
Q32017
Q42017
Q12018
Q22018
Q32018
Q42018
Q12019
Q22019
Q32019
Q42019
Q12020
Q22020
Q32020
6%
7%
8%
9%
10%
11%
12%
13%
14%
15%
16%
Selli
ng P
rice/
EBIT
DA
EBIT
DA P
erce
ntag
e
EBITDA Margin
Selling Price/EBITDA
This digital edition was created exclusively for the use of Stacy Jewell of Business Valuation Resources.For licensing options, please contact Business Valuation Resources at [email protected].

4DEALSTATS VALUE INDEX | 4Q 2020bvresources.com/dealstats
EXHIBIT 3. SELLING PRICE/EBITDA BY SECTOR
7.6
8.6
7.0
3.9
6.5
5.5
3.8 3.8
11.3
7.8
3.7
6.6
3.6 3.8
6.0
3.83.1
4.4
0.0x
2.0x
4.0x
6.0x
8.0x
10.0x
12.0x
Selli
ng P
rice/
EBIT
DA
Median for All Sectors
Agriculture, Forestry,
Fishing, and Hunting
Construction
Manufacturing
Wholesale Trade
Retail Trade
Transportation and
Warehousing
Information
Finance and
Insurance
Real Estate,
Rental and Leasing
Professional, Scientific,
and Technical Services
Administrative, Support,
Waste Mgmt., and
Remediation Svcs.
Educational Services
Health Care and
Social Assistance
Arts, Entertainment,
and Recreation
Accommodation and
Food Service
Other Services
Mining, Quarrying,
and Oil and Gas Extraction
Utilities
2.6
SELLING PRICE/EBITDA MEDIAN IS 4.4X
EBITDA multiples remained mostly consistent across the 18 sectors through the third quarter of 2020. A decline in the EBITDA multiple was seen in the professional, scientific, and technical services sector and the healthcare and social assistance sector, to 6.6x and 6.0x, which is down from 6.7x and 6.1x, respectively. The median EBITDA multiple moved higher in the information sector and the arts, entertainment, and recreation sector, to 11.3x and 3.8x, which is up from 11.2x and 3.7x, respectively. EBITDA multiples are the highest for the information sector, 11.3x, and the mining, quarrying, and oil and gas extraction sector, 8.6x, and are the lowest in the accommodation and food services, 2.6x, and the other services sectors, 3.1x. The median across all industry sectors is 4.4x.
This digital edition was created exclusively for the use of Stacy Jewell of Business Valuation Resources.For licensing options, please contact Business Valuation Resources at [email protected].

5DEALSTATS VALUE INDEX | 4Q 2020bvresources.com/dealstats
EXHIBIT 4. MEDIAN SELLING PRICE/EBITDA
0.0x
5.0x
10.0x
15.0x
20.0x
25.0x
2011 2012 2013 2014 2015 2016 2017 2018 2019 2020
Mul
tiple
Private buyers/public sellers Public buyers/public sellers Private buyers/private sellers
Public buyers/private sellers All transactions
Note: Each data point in this chart is based on a minimum of 10 transactions. If there are not enough transactions for a particular year, the data are not included.
EBITDA MULTIPLES FOR PRIVATE SELLERS REACH 10-YEAR HIGHS THROUGH THE 3Q 2020
Through the third quarter of 2020, EBITDA multiples were at 10-year highs for private-seller transactions. In the category showing private-seller acquisitions by public buyers, the median EBITDA multiple rose to 14.4x, which matches the 10-year high set in 2018. The median EBITDA multiple paid by private buyers of private sellers has trended higher since 2013, rising in seven of the past eight years before climbing to its highest level in the past 10 years, 4.0x. Conversely, public-seller transactions have trended lower since 2018. Public buyers of public sellers saw the median EBITDA multiple fall slightly, to 14.8x, the lowest rate since 2013. The trend has shown that, since 2017, the median multiple paid by public buyers of public sellers has declined in each year. Through the third quarter of 2020, the “private buyer of public sellers” category has yet to meet the minimum transaction criteria to be included in the chart below at the time of publication. Interestingly, DealStats has observed that, in 2018 and 2019, the trend saw the median EBITDA multiple paid by private buyers come in at a higher multiple than their public-buyer counterparts. In 2018, private buyers paid a median EBITDA multiple of 18.2x, and, in 2019, the median reported at 18.0x, while their public-buyer counterparts paid 15.9x and 14.9x, respectively. DealStats will monitor whether this trend continues into 2020. In the “all transactions” category, EBITDA multiples remained at 4.8x from 2017 to 2019 but saw a decline in 2020, falling to 4.4x through the third quarter.
This digital edition was created exclusively for the use of Stacy Jewell of Business Valuation Resources.For licensing options, please contact Business Valuation Resources at [email protected].

6DEALSTATS VALUE INDEX | 4Q 2020bvresources.com/dealstats
EXHIBIT 5A. MEDIAN SELLING PRICE/NET SALES BY NET SALES RANGE (PRIVATE TARGETS)
PRICING MULTIPLES AND PROFIT MARGINS ARE ON THE MOVE
As shown in the legend for Exhibits 5A to 5C and Exhibits 6A to 6C, pricing multiples for private-target acquisitions are displayed across four ranges of seller net sales. For companies with net sales greater than $10 million, Exhibit 5A shows a rise in the net sales multiple from 2016 to 2018 before declines in 2019 and 2020, to 1.43x and 1.22x, respectively. The net sales multiple decreased in three of the four net sales categories in 2020.
The seller’s discretionary earnings (SDE) multiple declined across all four seller revenue ranges from 2017 to 2018, remained nearly unchanged from 2018 to 2019, and saw declines in three of the four categories from
0.0x
0.2x
0.4x
0.6x
0.8x
1.0x
1.2x
1.4x
1.6x
1.8x
2.0x
2.2x
2010 2011 2012 2013 2014 2015 2016 2017 2018 2019 2020
Mul
tiple
$0-$1M $1M-$5M $5M-$10M >$10M
EXHIBIT 5B. MEDIAN SELLING PRICE/SDE BY NET SALES RANGE (PRIVATE TARGETS)
1.0x
2.0x
3.0x
4.0x
5.0x
6.0x
7.0x
8.0x
9.0x
2010 2011 2012 2013 2014 2015 2016 2017 2018 2019 2020
Mul
tiple
$0-$1M $1M-$5M $5M-$10M >$10M
Note: Each data point in these charts is based on a minimum number of transactions of private targets. If a sales range does not meet this criterion, it is not included in the chart.
This digital edition was created exclusively for the use of Stacy Jewell of Business Valuation Resources.For licensing options, please contact Business Valuation Resources at [email protected].

7DEALSTATS VALUE INDEX | 4Q 2020bvresources.com/dealstats
1.0x
3.0x
5.0x
7.0x
9.0x
11.0x
13.0x
15.0x
2010 2011 2012 2013 2014 2015 2016 2017 2018 2019 2020
Mul
tiple
$0-$1M $1M-$5M $5M-$10M >$10M
EXHIBIT 5C. MEDIAN SELLING PRICE/EBITDA BY NET SALES RANGE (PRIVATE TARGETS)
2019 to 2020. For transactions less than $1 million and between $5 million to $10 million, the SDE multiple declined to its lowest level over the period from 2010 to 2020, to 1.9x and 2.9x, respectively. Companies with net sales greater than $10 million saw an increase in the SDE multiple, to 5.0x (see Exhibit 5B).
Companies with net sales greater than $10 million saw their EBITDA multiple rise to a 10-year high in 2018, 12.9x. However, in 2019, the multiple fell to 9.2x before seeing a rise in 2020, to 10.2x (see Exhibit 5C). In 2020, the EBITDA multiple for companies with net sales less than $1 million reached a 10-year high, at 3.8x.
EXHIBIT 6A. GROSS PROFIT MARGIN BY NET SALES RANGE (PRIVATE TARGETS)
30%
35%
40%
45%
50%
55%
60%
65%
70%
75%
80%
2010 2011 2012 2013 2014 2015 2016 2017 2018 2019 2020
Mar
gin
$0-$1M $1M-$5M $5M-$10M >$10M
Note: Each data point in these charts is based on a minimum number of transactions of private targets. If a sales range does not meet this criterion, it is not included in the chart.
This digital edition was created exclusively for the use of Stacy Jewell of Business Valuation Resources.For licensing options, please contact Business Valuation Resources at [email protected].

8DEALSTATS VALUE INDEX | 4Q 2020bvresources.com/dealstats
EXHIBIT 6B. OPERATING PROFIT MARGIN BY NET SALES RANGE (PRIVATE TARGETS)
2%
4%
6%
8%
10%
12%
14%
16%
18%
2010 2011 2012 2013 2014 2015 2016 2017 2018 2019 2020
Mar
gin
$0-$1M $1M-$5M $5M-$10M >$10M
Companies with net sales between $1 million and $5 million have seen the EBITDA multiple decline from 2018 to 2020, falling from 4.7x to 3.9x, its lowest multiple over the illustrated period.
Profit margins for sellers with net sales up to $1 million are considerably higher among all other net sales ranges for gross profit margin, operating profit margin, and net profit margin (see Exhibits 6A, 6B, and 6C). In 2020, gross profit margins in two of the four net sales categories increased. Companies with net sales between $5 million and $10 million saw their net profit margin reach a 10-year high in 2020, at 10%.
2%
4%
6%
8%
10%
12%
14%
16%
18%
2010 2011 2012 2013 2014 2015 2016 2017 2018 2019 2020
Mar
gin
$0-$1M $1M-$5M $5M-$10M >$10M
EXHIBIT 6C. NET PROFIT MARGIN BY NET SALES RANGE (PRIVATE TARGETS)
Note: Each data point in these charts is based on a minimum number of transactions of private targets. If a sales range does not meet this criterion, it is not included in the chart.
This digital edition was created exclusively for the use of Stacy Jewell of Business Valuation Resources.For licensing options, please contact Business Valuation Resources at [email protected].

9DEALSTATS VALUE INDEX | 4Q 2020bvresources.com/dealstats
INTERQUARTILE RANGES ARE FAIRLY CONSISTENT
Exhibits 7A through 7D display the interquartile range of the selling price-to-net sales and selling price-to-EBITDA multiples by major industry sector and by year for private targets. In addition to showing the median multiples by sector and year, the interquartile range provides a measure of dispersion. Interquartile range is the difference between the 25th and 75th percentiles (also called the first and third quartiles), so the interquartile range describes the middle 50% of observations. The top of the gray bar indicates the 75th percentile, the bottom of the brown bar indicates the 25th percentile, and the line where the two meet represents the median. A large interquartile range indicates that the middle 50% of observations are spaced wide apart, and, if the interquartile range is narrow, the middle 50% of observations are spaced close together.
As shown in Exhibits 7A and 7B, the information industry has the greatest selling price-to-net sales multiple and selling price-to-EBITDA multiple. When looking at the data by year (Exhibits 7C and 7D), the median selling price-to-net sales multiple is consistently around 0.5x, while the selling price-to-EBITDA multiple is generally between 3.0x and 4.0x.
0x
1x
2x
3x
4x
5x
Mul
tiple
6x
Agriculture, Forestry,
Fishing, and Hunting
Construction
Manufacturing
Wholesale Trade
Retail Trade
Transportation and
Warehousing
Information
Finance and
Insurance
Real Estate,
Rental and Leasing
Professional, Scientific,
and Technical Services
Administrative, Support,
Waste Mgmt., and
Remediation Svcs.
Educational Services
Health Care and
Social Assistance
Arts, Entertainment,
and Recreation
Accommodation and
Food Service
Other Services
EXHIBIT 7A. SELLING PRICE/NET SALES INTERQUARTILE RANGE BY INDUSTRY SECTOR (PRIVATE TARGETS)
Note: Each data point in this chart is based on a minimum of 10 transactions of private targets. If an industry sector does not meet this criterion, it is not included in the chart.
This digital edition was created exclusively for the use of Stacy Jewell of Business Valuation Resources.For licensing options, please contact Business Valuation Resources at [email protected].

10DEALSTATS VALUE INDEX | 4Q 2020bvresources.com/dealstats
EXHIBIT 7B. SELLING PRICE/EBITDA INTERQUARTILE RANGE BY INDUSTRY SECTOR (PRIVATE TARGETS)
0x
5x
10x
15x
20x
25x
Mul
tiple
Agriculture, Forestry,
Fishing, and Hunting
Construction
Manufacturing
Wholesale Trade
Retail Trade
Transportation and
Warehousing
Information
Finance and
Insurance
Real Estate,
Rental and Leasing
Professional, Scientific,
and Technical Services
Administrative, Support,
Waste Mgmt., and
Remediation Svcs.
Educational Services
Health Care and
Social Assistance
Arts, Entertainment,
and Recreation
Accommodation and
Food Service
Other Services
Note: Each data point in this chart is based on a minimum of 10 transactions of private targets. If an industry sector does not meet this criterion, it is not included in the chart.
EXHIBIT 7C. SELLING PRICE/NET SALES INTERQUARTILE RANGE BY YEAR (PRIVATE TARGETS)
0.0x
0.2x
0.4x
0.6x
0.8x
1.0x
1.2x
2007 2008 2009 2010 2011 2012 2013 2014 2015 2016 2017 2018 2019 2020
Mul
tiple
This digital edition was created exclusively for the use of Stacy Jewell of Business Valuation Resources.For licensing options, please contact Business Valuation Resources at [email protected].

11DEALSTATS VALUE INDEX | 4Q 2020bvresources.com/dealstats
EXHIBIT 7D. SELLING PRICE/EBITDA INTERQUARTILE RANGE BY YEAR (PRIVATE TARGETS)
0x
2x
4x
6x
8x
10x
12x
2007 2008 2009 2010 2011 2012 2013 2014 2015 2016 2017 2018 2019 2020
Mul
tiple
This digital edition was created exclusively for the use of Stacy Jewell of Business Valuation Resources.For licensing options, please contact Business Valuation Resources at [email protected].

12DEALSTATS VALUE INDEX | 4Q 2020bvresources.com/dealstats
10-YEAR TREND FOR PRIVATE-SELLER SECTOR MULTIPLES
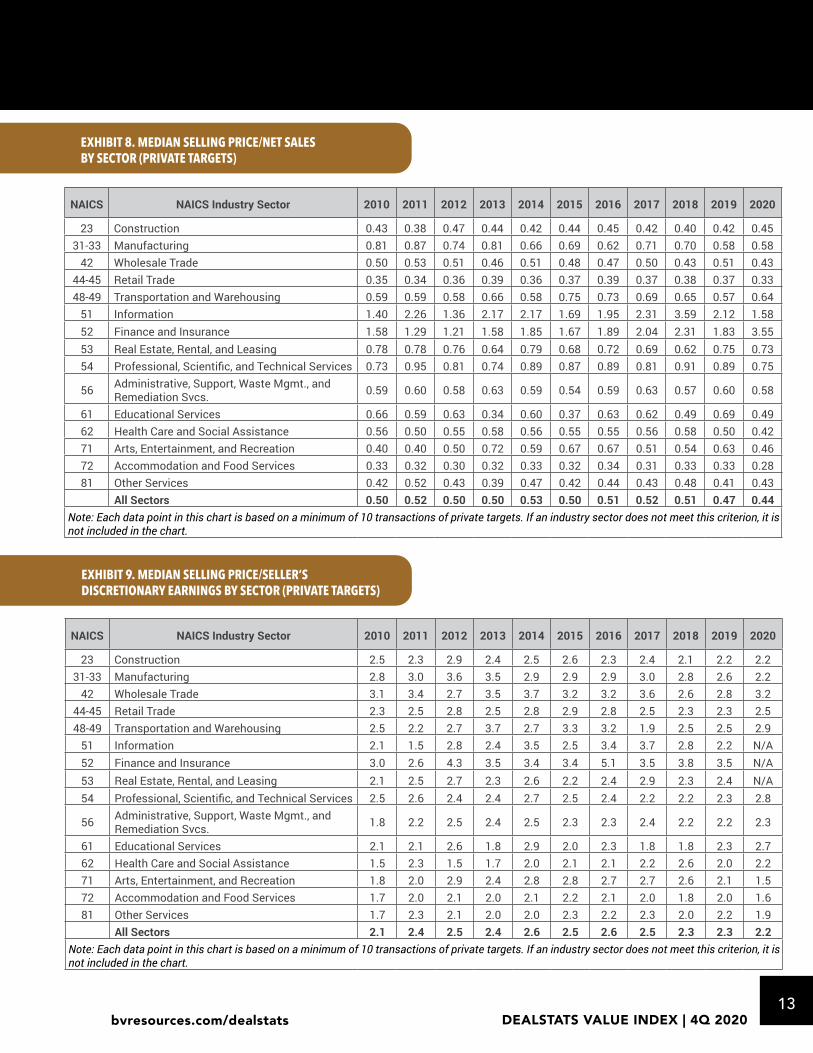
Exhibits 8 through 13 display median multiples paid for private targets as well as median profit margins and are split out by industry sector. Multiples across the 15 sectors appeared to rise and fall based on cyclical trends. Overall, four sectors saw a rise in their net sales multiple in 2020 and 10 sectors saw a decrease in their net sales multiple. Noticeably, sectors that have been most impacted by the economic lockdowns caused by the coronavirus pandemic saw their net sales multiple fall to their lowest levels. These include the wholesale trade, retail trade, healthcare and social assistance, and the accommodation and food services sector, at 0.43x, 0.33x, 0.42x, and 0.28x. The multiple across all sectors fell to a 10-year low in 2020, to 0.44x.
Notably, multiples in the information and finance and insurance sector have shown the greatest volatility over time, evident as each information sector reported at a 10-year high in 2018, at 3.59x, but saw significant declines in the ensuing two years, falling to 1.58x in 2020. Meanwhile, the net sales multiple in the finance and insurance sector has seen significant changes from year to year, ranging from 1.21x in 2012 to 3.55x in 2020. Multiples in the manufacturing sector, the transportation and warehousing sector, and the healthcare and social assistance sector fell to a 10-year low in 2019, at 0.58x, 0.57x, and 0.50x, respectively. Conversely, the net sales multiple for the educational services sector rose to a 10-year high in 2019, at 0.69x. See Exhibit 8.
Median seller’s discretionary earnings (SDE) multiples increased in seven of the 15 industry sectors in 2020 and declined in four of the 15 sectors. The median for all sectors peaked in 2016, at 2.6x, but has trended downward since, settling at 2.2x in 2019. This downward trend trickled over to some of the individual sectors as well, as the median multiple has trended downwards for the information sector (from 3.7x in 2017 to 2.2x in 2019), the accommodation and food services sector (from 2.2x in 2015 to 1.6x in 2020), the manufacturing sector (from 3.0x in 2017 to 2.2x in 2020), and the arts, entertainment, and recreation sector (from 2.8x in 2015 to 1.5x in 2020). See Exhibit 9.
Median EBITDA multiples have increased in five of the 15 sectors and decreased in four of the 15 in 2020. The median for all sectors did, however, continue to trend higher, reaching a 10-year high in 2020, at 4.3x. In 2019, EBITDA multiples in the information, finance and insurance, and real estate and rental and leasing sectors had the largest declines, falling to 9.3x, 9.2x, and 4.0x, respectively, but the number of transactions for these sectors in 2020 has not met the minimum amount to see how they have fared. Conversely, multiples in the retail trade sector and the transportation and warehousing sector reached a 10-year high in 2020, at 5.0x and 4.2x, respectively. See Exhibit 10.
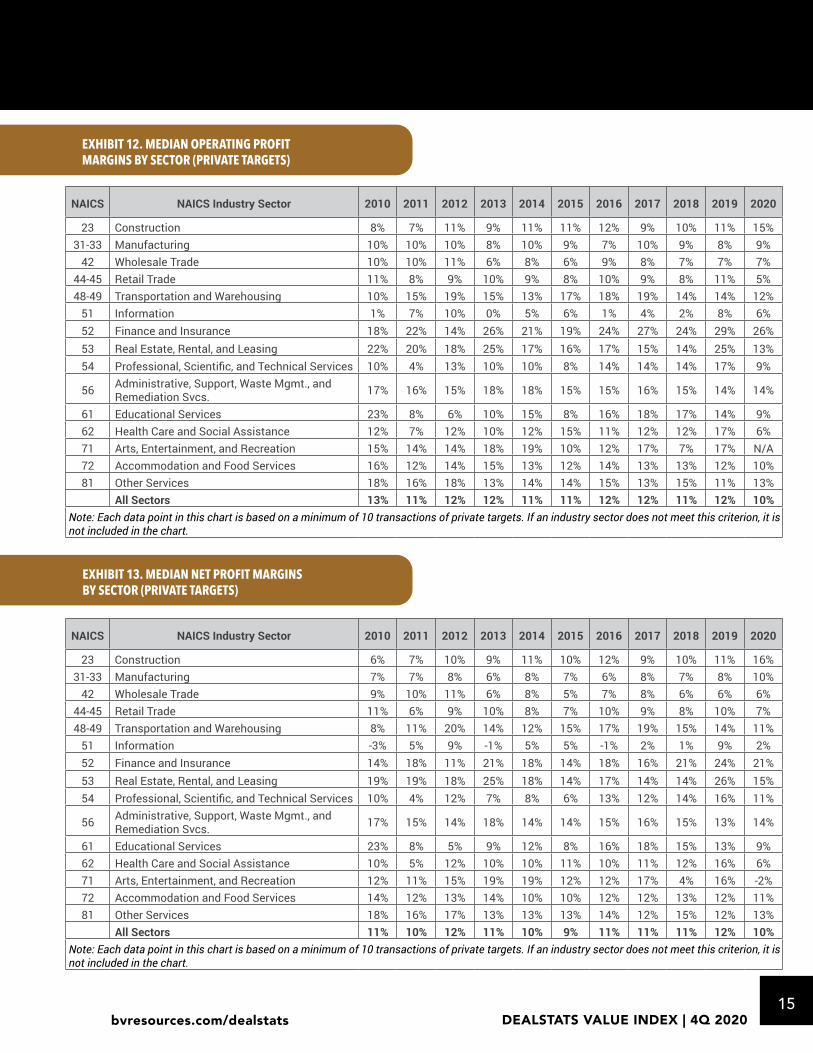
Median gross profit margins remained at a 10-year high, at 67%, in 2020. The median operating profit and net profit margin, did, however, decline in 2020, to 10% each, with the median operating profit margin falling to a 10-year low. Neither the gross profit margins nor the operating profit margins show any clear trend in the “all sectors” category over the past 10 years. Gross profit margins have ranged from 63% to 67% over this period (see Exhibit 11), operating margins have ranged from 10% to 13% (see Exhibit 12), and median net profit margins have ranged from 9% to 12% over time (see Exhibit 13).
This digital edition was created exclusively for the use of Stacy Jewell of Business Valuation Resources.For licensing options, please contact Business Valuation Resources at [email protected].
13DEALSTATS VALUE INDEX | 4Q 2020bvresources.com/dealstats
EXHIBIT 9. MEDIAN SELLING PRICE/SELLER’S DISCRETIONARY EARNINGS BY SECTOR (PRIVATE TARGETS)
NAICS NAICS Industry Sector 2010 2011 2012 2013 2014 2015 2016 2017 2018 2019 2020
23 Construction 2.5 2.3 2.9 2.4 2.5 2.6 2.3 2.4 2.1 2.2 2.231-33 Manufacturing 2.8 3.0 3.6 3.5 2.9 2.9 2.9 3.0 2.8 2.6 2.2
42 Wholesale Trade 3.1 3.4 2.7 3.5 3.7 3.2 3.2 3.6 2.6 2.8 3.244-45 Retail Trade 2.3 2.5 2.8 2.5 2.8 2.9 2.8 2.5 2.3 2.3 2.548-49 Transportation and Warehousing 2.5 2.2 2.7 3.7 2.7 3.3 3.2 1.9 2.5 2.5 2.9
51 Information 2.1 1.5 2.8 2.4 3.5 2.5 3.4 3.7 2.8 2.2 N/A52 Finance and Insurance 3.0 2.6 4.3 3.5 3.4 3.4 5.1 3.5 3.8 3.5 N/A53 Real Estate, Rental, and Leasing 2.1 2.5 2.7 2.3 2.6 2.2 2.4 2.9 2.3 2.4 N/A54 Professional, Scientific, and Technical Services 2.5 2.6 2.4 2.4 2.7 2.5 2.4 2.2 2.2 2.3 2.8
56 Administrative, Support, Waste Mgmt., and Remediation Svcs. 1.8 2.2 2.5 2.4 2.5 2.3 2.3 2.4 2.2 2.2 2.3
61 Educational Services 2.1 2.1 2.6 1.8 2.9 2.0 2.3 1.8 1.8 2.3 2.762 Health Care and Social Assistance 1.5 2.3 1.5 1.7 2.0 2.1 2.1 2.2 2.6 2.0 2.271 Arts, Entertainment, and Recreation 1.8 2.0 2.9 2.4 2.8 2.8 2.7 2.7 2.6 2.1 1.572 Accommodation and Food Services 1.7 2.0 2.1 2.0 2.1 2.2 2.1 2.0 1.8 2.0 1.681 Other Services 1.7 2.3 2.1 2.0 2.0 2.3 2.2 2.3 2.0 2.2 1.9
All Sectors 2.1 2.4 2.5 2.4 2.6 2.5 2.6 2.5 2.3 2.3 2.2Note: Each data point in this chart is based on a minimum of 10 transactions of private targets. If an industry sector does not meet this criterion, it is not included in the chart.
EXHIBIT 8. MEDIAN SELLING PRICE/NET SALES BY SECTOR (PRIVATE TARGETS)
NAICS NAICS Industry Sector 2010 2011 2012 2013 2014 2015 2016 2017 2018 2019 2020
23 Construction 0.43 0.38 0.47 0.44 0.42 0.44 0.45 0.42 0.40 0.42 0.4531-33 Manufacturing 0.81 0.87 0.74 0.81 0.66 0.69 0.62 0.71 0.70 0.58 0.58
42 Wholesale Trade 0.50 0.53 0.51 0.46 0.51 0.48 0.47 0.50 0.43 0.51 0.4344-45 Retail Trade 0.35 0.34 0.36 0.39 0.36 0.37 0.39 0.37 0.38 0.37 0.3348-49 Transportation and Warehousing 0.59 0.59 0.58 0.66 0.58 0.75 0.73 0.69 0.65 0.57 0.64
51 Information 1.40 2.26 1.36 2.17 2.17 1.69 1.95 2.31 3.59 2.12 1.5852 Finance and Insurance 1.58 1.29 1.21 1.58 1.85 1.67 1.89 2.04 2.31 1.83 3.5553 Real Estate, Rental, and Leasing 0.78 0.78 0.76 0.64 0.79 0.68 0.72 0.69 0.62 0.75 0.7354 Professional, Scientific, and Technical Services 0.73 0.95 0.81 0.74 0.89 0.87 0.89 0.81 0.91 0.89 0.75
56 Administrative, Support, Waste Mgmt., and Remediation Svcs. 0.59 0.60 0.58 0.63 0.59 0.54 0.59 0.63 0.57 0.60 0.58
61 Educational Services 0.66 0.59 0.63 0.34 0.60 0.37 0.63 0.62 0.49 0.69 0.4962 Health Care and Social Assistance 0.56 0.50 0.55 0.58 0.56 0.55 0.55 0.56 0.58 0.50 0.4271 Arts, Entertainment, and Recreation 0.40 0.40 0.50 0.72 0.59 0.67 0.67 0.51 0.54 0.63 0.4672 Accommodation and Food Services 0.33 0.32 0.30 0.32 0.33 0.32 0.34 0.31 0.33 0.33 0.2881 Other Services 0.42 0.52 0.43 0.39 0.47 0.42 0.44 0.43 0.48 0.41 0.43
All Sectors 0.50 0.52 0.50 0.50 0.53 0.50 0.51 0.52 0.51 0.47 0.44Note: Each data point in this chart is based on a minimum of 10 transactions of private targets. If an industry sector does not meet this criterion, it is not included in the chart.
This digital edition was created exclusively for the use of Stacy Jewell of Business Valuation Resources.For licensing options, please contact Business Valuation Resources at [email protected].

14DEALSTATS VALUE INDEX | 4Q 2020bvresources.com/dealstats
EXHIBIT 11. MEDIAN GROSS PROFIT MARGINS BY SECTOR (PRIVATE TARGETS)
NAICS NAICS Industry Sector 2010 2011 2012 2013 2014 2015 2016 2017 2018 2019 2020
23 Construction 46% 42% 43% 46% 52% 47% 53% 45% 48% 48% 56%31-33 Manufacturing 48% 47% 47% 45% 46% 44% 46% 47% 47% 54% 56%
42 Wholesale Trade 40% 38% 36% 45% 36% 38% 35% 40% 39% 34% 35%44-45 Retail Trade 47% 44% 44% 43% 46% 43% 45% 45% 46% 51% 43%48-49 Transportation and Warehousing 59% 86% 89% 96% 68% 84% 77% 94% 82% 76% 99%
51 Information 70% 66% 72% 67% 70% 67% 47% 68% 70% 70% 64%52 Finance and Insurance 100% 100% 100% 94% 91% 96% 91% 95% 94% 97% N/A53 Real Estate, Rental, and Leasing 91% 89% 88% 90% 87% 92% 86% 75% 73% 99% 89%
54 Professional, Scientific, and Technical Services 67% 68% 74% 84% 67% 74% 74% 89% 74% 74% 68%
56 Administrative, Support, Waste Mgmt., and Remediation Svcs. 81% 87% 80% 84% 77% 76% 71% 81% 82% 78% 74%
61 Educational Services 90% 90% 100% 99% 92% 90% 100% 91% 100% 97% 100%62 Health Care and Social Assistance 100% 100% 100% 100% 100% 100% 100% 94% 95% 100% 99%71 Arts, Entertainment, and Recreation 100% 79% 88% 92% 99% 89% 95% 98% 89% 97% 96%72 Accommodation and Food Services 67% 68% 68% 68% 66% 66% 68% 67% 67% 69% 70%81 Other Services 85% 90% 83% 83% 83% 76% 76% 75% 83% 88% 96%
All Sectors 65% 65% 65% 67% 65% 65% 64% 63% 64% 67% 67%Note: Each data point in this chart is based on a minimum of 10 transactions of private targets. If an industry sector does not meet this criterion, it is not included in the chart.
NAICS NAICS Industry Sector 2010 2011 2012 2013 2014 2015 2016 2017 2018 2019 2020
23 Construction 2.8 3.1 4.1 4.0 3.4 3.6 3.3 3.7 4.0 3.5 3.231-33 Manufacturing 5.1 6.4 6.6 7.2 5.8 6.1 6.5 5.8 6.9 5.7 4.3
42 Wholesale Trade 3.9 4.7 4.8 4.8 6.2 6.9 6.3 5.6 4.7 5.0 5.044-45 Retail Trade 2.9 3.3 2.8 3.1 3.4 3.5 3.5 3.6 3.8 4.0 5.048-49 Transportation and Warehousing 3.1 2.9 2.6 3.2 3.2 3.5 4.2 3.6 3.2 3.5 4.2
51 Information 6.4 10.1 7.0 8.6 10.0 6.9 10.7 13.6 14.7 9.3 N/A52 Finance and Insurance 6.2 3.2 4.5 3.7 6.2 7.8 9.8 13.4 12.1 9.2 N/A53 Real Estate, Rental, and Leasing 2.6 2.8 3.1 2.4 4.5 2.9 3.8 4.2 6.1 4.0 N/A54 Professional, Scientific, and Technical Services 5.0 8.5 4.2 4.6 5.5 8.1 5.5 5.7 4.7 4.7 4.8
56 Administrative, Support, Waste Mgmt., and Remediation Svcs. 2.5 2.7 3.2 2.6 2.8 3.0 3.8 3.7 3.3 5.0 4.0
61 Educational Services 2.6 2.9 4.7 2.7 3.5 3.6 4.1 3.1 4.1 3.8 4.162 Health Care and Social Assistance 4.3 5.4 2.6 4.6 4.2 3.2 4.2 3.8 4.6 3.9 4.471 Arts, Entertainment, and Recreation 2.1 2.2 2.5 3.1 3.6 3.3 4.3 3.3 3.5 4.1 N/A72 Accommodation and Food Services 1.9 1.9 1.8 1.8 2.2 2.4 2.4 2.8 2.8 3.3 3.081 Other Services 2.2 2.6 2.4 2.6 2.4 2.8 2.6 3.0 2.9 3.4 3.4
All Sectors 2.9 3.5 3.0 3.3 3.9 3.8 3.9 4.1 4.1 4.2 4.3Note: Each data point in this chart is based on a minimum of 10 transactions of private targets. If an industry sector does not meet this criterion, it is not included in the chart.
EXHIBIT 10. MEDIAN SELLING PRICE/EBITDA BY SECTOR (PRIVATE TARGETS)
This digital edition was created exclusively for the use of Stacy Jewell of Business Valuation Resources.For licensing options, please contact Business Valuation Resources at [email protected].
15DEALSTATS VALUE INDEX | 4Q 2020bvresources.com/dealstats
EXHIBIT 13. MEDIAN NET PROFIT MARGINS BY SECTOR (PRIVATE TARGETS)
NAICS NAICS Industry Sector 2010 2011 2012 2013 2014 2015 2016 2017 2018 2019 2020
23 Construction 6% 7% 10% 9% 11% 10% 12% 9% 10% 11% 16%31-33 Manufacturing 7% 7% 8% 6% 8% 7% 6% 8% 7% 8% 10%
42 Wholesale Trade 9% 10% 11% 6% 8% 5% 7% 8% 6% 6% 6%44-45 Retail Trade 11% 6% 9% 10% 8% 7% 10% 9% 8% 10% 7%48-49 Transportation and Warehousing 8% 11% 20% 14% 12% 15% 17% 19% 15% 14% 11%
51 Information -3% 5% 9% -1% 5% 5% -1% 2% 1% 9% 2%52 Finance and Insurance 14% 18% 11% 21% 18% 14% 18% 16% 21% 24% 21%53 Real Estate, Rental, and Leasing 19% 19% 18% 25% 18% 14% 17% 14% 14% 26% 15%54 Professional, Scientific, and Technical Services 10% 4% 12% 7% 8% 6% 13% 12% 14% 16% 11%
56 Administrative, Support, Waste Mgmt., and Remediation Svcs. 17% 15% 14% 18% 14% 14% 15% 16% 15% 13% 14%
61 Educational Services 23% 8% 5% 9% 12% 8% 16% 18% 15% 13% 9%62 Health Care and Social Assistance 10% 5% 12% 10% 10% 11% 10% 11% 12% 16% 6%71 Arts, Entertainment, and Recreation 12% 11% 15% 19% 19% 12% 12% 17% 4% 16% -2%72 Accommodation and Food Services 14% 12% 13% 14% 10% 10% 12% 12% 13% 12% 11%81 Other Services 18% 16% 17% 13% 13% 13% 14% 12% 15% 12% 13%
All Sectors 11% 10% 12% 11% 10% 9% 11% 11% 11% 12% 10%Note: Each data point in this chart is based on a minimum of 10 transactions of private targets. If an industry sector does not meet this criterion, it is not included in the chart.
EXHIBIT 12. MEDIAN OPERATING PROFIT MARGINS BY SECTOR (PRIVATE TARGETS)
NAICS NAICS Industry Sector 2010 2011 2012 2013 2014 2015 2016 2017 2018 2019 2020
23 Construction 8% 7% 11% 9% 11% 11% 12% 9% 10% 11% 15%31-33 Manufacturing 10% 10% 10% 8% 10% 9% 7% 10% 9% 8% 9%
42 Wholesale Trade 10% 10% 11% 6% 8% 6% 9% 8% 7% 7% 7%44-45 Retail Trade 11% 8% 9% 10% 9% 8% 10% 9% 8% 11% 5%48-49 Transportation and Warehousing 10% 15% 19% 15% 13% 17% 18% 19% 14% 14% 12%
51 Information 1% 7% 10% 0% 5% 6% 1% 4% 2% 8% 6%52 Finance and Insurance 18% 22% 14% 26% 21% 19% 24% 27% 24% 29% 26%53 Real Estate, Rental, and Leasing 22% 20% 18% 25% 17% 16% 17% 15% 14% 25% 13%54 Professional, Scientific, and Technical Services 10% 4% 13% 10% 10% 8% 14% 14% 14% 17% 9%
56 Administrative, Support, Waste Mgmt., and Remediation Svcs. 17% 16% 15% 18% 18% 15% 15% 16% 15% 14% 14%
61 Educational Services 23% 8% 6% 10% 15% 8% 16% 18% 17% 14% 9%62 Health Care and Social Assistance 12% 7% 12% 10% 12% 15% 11% 12% 12% 17% 6%71 Arts, Entertainment, and Recreation 15% 14% 14% 18% 19% 10% 12% 17% 7% 17% N/A72 Accommodation and Food Services 16% 12% 14% 15% 13% 12% 14% 13% 13% 12% 10%81 Other Services 18% 16% 18% 13% 14% 14% 15% 13% 15% 11% 13%
All Sectors 13% 11% 12% 12% 11% 11% 12% 12% 11% 12% 10%Note: Each data point in this chart is based on a minimum of 10 transactions of private targets. If an industry sector does not meet this criterion, it is not included in the chart.
This digital edition was created exclusively for the use of Stacy Jewell of Business Valuation Resources.For licensing options, please contact Business Valuation Resources at [email protected].

16DEALSTATS VALUE INDEX | 4Q 2020bvresources.com/dealstats
PUBLIC BUYERS PAY HIGHER MULTIPLES FOR PRIVATE TARGETS
Exhibits 14 and 15 compare the median valuation multiples private buyers paid (those transactions business intermediaries brokered) to what public-company buyers paid based on major industry sector groups.
Across all NAICS sectors, public buyers paid higher multiples for private targets than private buyers paid. This may partially reflect synergies between the public buyer and the private target. Also, the typical acquisition public buyers made was larger than those private buyers made, so it is possible to conclude that larger companies sell for higher multiples than smaller companies, which is further highlighted in Exhibits 5A through 5C.
The net sales multiple increased in the mining, quarrying, and oil and gas extraction sector, manufacturing sector, retail trade sector, information sector, finance and insurance sector, education services sector, and arts, entertainment, and recreation sector, to 2.24x, 1.23x, 0.50x, 2.57x, 2.03x, 1.54x, and 1.60x from 2.21x, 1.21x, 0.49x, 2.56x, 2.01x, 1.53x, and 1.58x, respectively, based on the prior median reported in the last publication. None of the net sales multiple in any of the sectors decreased. Overall, net sales multiples increased in seven of the 18 sectors.
EXHIBIT 14. SELLING PRICE/NET SALES (PRIVATE TARGETS)
0.0x
0.5x
1.0x
1.5x
2.0x
2.5x
3.0x
Public BuyerPrivate Buyer
Agriculture, Forestry,
Fishing, and Hunting
Construction
Manufacturing
Wholesale Trade
Retail Trade
Transportation and
Warehousing
Information
Finance and
Insurance
Real Estate,
Rental and Leasing
Professional, Scientific,
and Technical Services
Administrative, Support,
Waste Mgmt., and
Remediation Svcs.
Educational Services
Health Care and
Social Assistance
Arts, Entertainment,
and Recreation
Accommodation and
Food Service
Other Services
Mining, Quarrying,
and Oil and Gas Extraction
Utilities
This digital edition was created exclusively for the use of Stacy Jewell of Business Valuation Resources.For licensing options, please contact Business Valuation Resources at [email protected].

17DEALSTATS VALUE INDEX | 4Q 2020bvresources.com/dealstats
EXHIBIT 15. SELLING PRICE/EBITDA (PRIVATE TARGETS)
0.0x
2.0x
4.0x
6.0x
8.0x
10.0x
12.0x
14.0x
16.0x
Public Buyer
Private Buyer
Agriculture, Forestry,
Fishing, and Hunting
Construction
Manufacturing
Wholesale Trade
Retail Trade
Transportation and
Warehousing
Information
Finance and
Insurance
Real Estate,
Rental and Leasing
Professional, Scientific,
and Technical Services
Administrative, Support,
Waste Mgmt., and
Remediation Svcs.
Educational Services
Health Care and
Social Assistance
Arts, Entertainment,
and Recreation
Accommodation and
Food Service
Other Services
Mining, Quarrying,
and Oil and Gas Extraction
Utilities
EBITDA multiples, based on the prior median, rose in the information sector, from 14.1x to 14.2x, the professional, scientific, and technical services sector, from 11.9x to 12.0x, the administrative and support and waste management and remediation services sector, from 10.8x to 10.9x, and in the arts, entertainment, and recreation sector, from 8.8x to 8.9x. Conversely, the EBITDA multiple declined in the agriculture, forestry, fishing, and hunting sector, from 9.3x to 8.9x, the mining, quarrying, and oil and gas extraction sector, from 9.2x to 9.1x, and the finance and insurance sector, from 10.5x to 10.4x. Overall, EBITDA multiples increased in four of 18 sectors and decreased in three of the 18 sectors.
This digital edition was created exclusively for the use of Stacy Jewell of Business Valuation Resources.For licensing options, please contact Business Valuation Resources at [email protected].

18DEALSTATS VALUE INDEX | 4Q 2020bvresources.com/dealstats
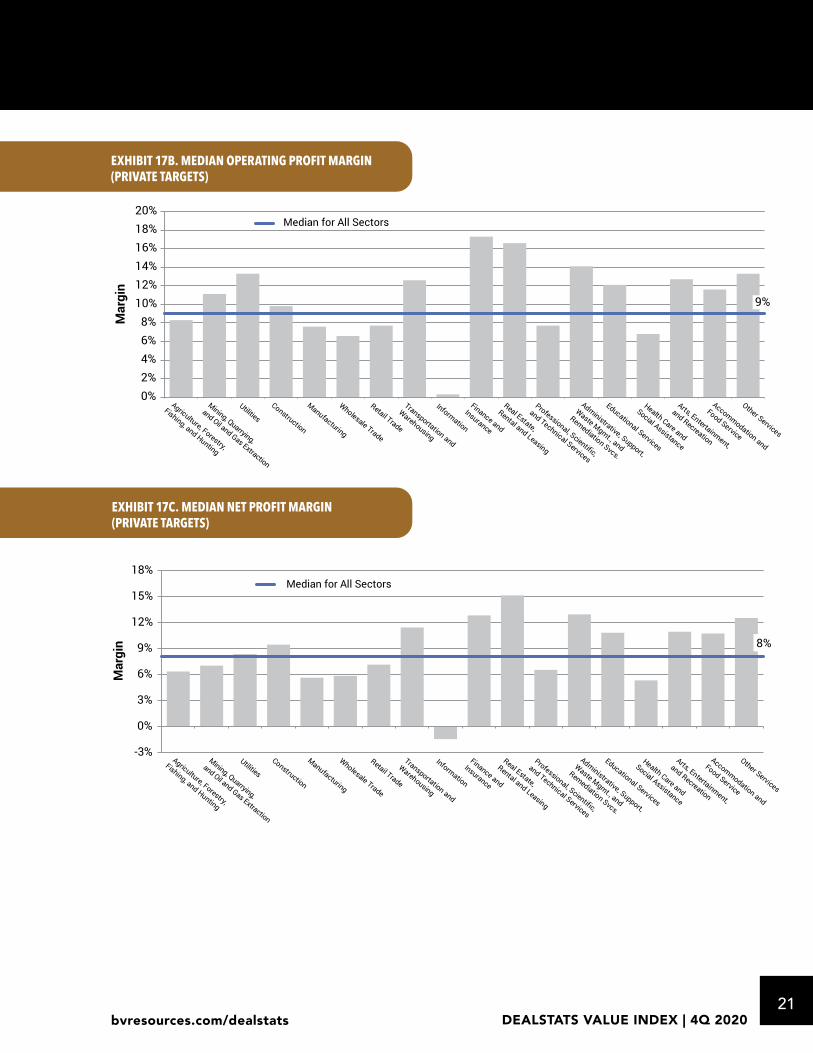
HOW DO INDUSTRY PRICING MULTIPLES AND PROFIT MARGINS COMPARE?
Exhibits 16A through 17C compare pricing multiples and profit margin ratios across 18 industry sectors. Companies within the mining, quarrying, and oil and gas extraction sector, the finance and insurance sector, utilities sector, agriculture, forestry, fishing and hunting sector, and the information sector clearly trade at higher net sales and earnings-based pricing multiples than most other companies in other industries (see Exhibits 16A to 16E). The trend for margin ratios is less evident among the 18 industry sectors, although companies in the information sector appear to operate less efficiently, with a median operating profit margin of 0.0% and a median net profit margin of -2.0% (see Exhibits 17A to 17C).
EXHIBIT 16B. MEDIAN SELLING PRICE/GROSS PROFIT (PRIVATE TARGETS)
EXHIBIT 16A. MEDIAN SELLING PRICE/NET SALES (PRIVATE TARGETS)
0.54
0.0x
0.5x
1.0x
1.5x
2.0x
2.5x
Mul
tiple
Median for All Sectors
Agriculture, Forestry,
Fishing, and Hunting
Construction
Manufacturing
Wholesale Trade
Retail Trade
Transportation and
Warehousing
Information
Finance and
Insurance
Real Estate,
Rental and Leasing
Professional, Scientific,
and Technical Services
Administrative, Support,
Waste Mgmt., and
Remediation Svcs.
Educational Services
Health Care and
Social Assistance
Arts, Entertainment,
and Recreation
Accommodation and
Food Service
Other Services
Mining, Quarrying,
and Oil and Gas Extraction
Utilities
0.95
0.0x
0.5x
1.0x
1.5x
2.0x
2.5x
3.0x
3.5x
4.0x
Mul
tiple
Median for All Sectors
Agriculture, Forestry,
Fishing, and Hunting
Construction
Manufacturing
Wholesale Trade
Retail Trade
Transportation and
Warehousing
Information
Finance and
Insurance
Real Estate,
Rental and Leasing
Professional, Scientific,
and Technical Services
Administrative, Support,
Waste Mgmt., and
Remediation Svcs.
Educational Services
Health Care and
Social Assistance
Arts, Entertainment,
and Recreation
Accommodation and
Food Service
Other Services
Mining, Quarrying,
and Oil and Gas Extraction
Utilities
This digital edition was created exclusively for the use of Stacy Jewell of Business Valuation Resources.For licensing options, please contact Business Valuation Resources at [email protected].

19DEALSTATS VALUE INDEX | 4Q 2020bvresources.com/dealstats
EXHIBIT 16D. MEDIAN SELLING PRICE/EBITDA (PRIVATE TARGETS)
EXHIBIT 16C. MEDIAN SELLING PRICE/EBIT (PRIVATE TARGETS)
4.30
0.0x
2.0x
4.0x
6.0x
8.0x
10.0x
12.0x
14.0x
Mul
tiple
Median for All Sectors
Agriculture, Forestry,
Fishing, and Hunting
Construction
Manufacturing
Wholesale Trade
Retail Trade
Transportation and
Warehousing
Information
Finance and
Insurance
Real Estate,
Rental and Leasing
Professional, Scientific,
and Technical Services
Administrative, Support,
Waste Mgmt., and
Remediation Svcs.
Educational Services
Health Care and
Social Assistance
Arts, Entertainment,
and Recreation
Accommodation and
Food Service
Other Services
Mining, Quarrying,
and Oil and Gas Extraction
Utilities
4.40
0.0x
2.0x
4.0x
6.0x
8.0x
10.0x
12.0x
Mul
tiple
Median for All Sectors
Agriculture, Forestry,
Fishing, and Hunting
Construction
Manufacturing
Wholesale Trade
Retail Trade
Transportation and
Warehousing
Information
Finance and
Insurance
Real Estate,
Rental and Leasing
Professional, Scientific,
and Technical Services
Administrative, Support,
Waste Mgmt., and
Remediation Svcs.
Educational Services
Health Care and
Social Assistance
Arts, Entertainment,
and Recreation
Accommodation and
Food Service
Other Services
Mining, Quarrying,
and Oil and Gas Extraction
Utilities
This digital edition was created exclusively for the use of Stacy Jewell of Business Valuation Resources.For licensing options, please contact Business Valuation Resources at [email protected].

20DEALSTATS VALUE INDEX | 4Q 2020bvresources.com/dealstats
EXHIBIT 17A. MEDIAN GROSS PROFIT MARGIN (PRIVATE TARGETS)
61%
0%
20%
40%
60%
80%
100%
120%
Mar
gin
Median for All Sectors
Agriculture, Forestry,
Fishing, and Hunting
Construction
Manufacturing
Wholesale Trade
Retail Trade
Transportation and
Warehousing
Information
Finance and
Insurance
Real Estate,
Rental and Leasing
Professional, Scientific,
and Technical Services
Administrative, Support,
Waste Mgmt., and
Remediation Svcs.
Educational Services
Health Care and
Social Assistance
Arts, Entertainment,
and Recreation
Accommodation and
Food Service
Other Services
Mining, Quarrying,
and Oil and Gas Extraction
Utilities
EXHIBIT 16E: MEDIAN SELLING PRICE/SDE (PRIVATE TARGETS)
2.50
0.0x
0.5x
1.0x
1.5x
2.0x
2.5x
3.0x
3.5x
4.0x
Mul
tiple
Median for All Sectors
Agriculture, Forestry,
Fishing, and Hunting
Construction
Manufacturing
Wholesale Trade
Retail Trade
Transportation and
Warehousing
Information
Finance and
Insurance
Real Estate,
Rental and Leasing
Professional, Scientific,
and Technical Services
Administrative, Support,
Waste Mgmt., and
Remediation Svcs.
Educational Services
Health Care and
Social Assistance
Arts, Entertainment,
and Recreation
Accommodation and
Food Service
Other Services
Mining, Quarrying,
and Oil and Gas Extraction
Utilities
This digital edition was created exclusively for the use of Stacy Jewell of Business Valuation Resources.For licensing options, please contact Business Valuation Resources at [email protected].
21DEALSTATS VALUE INDEX | 4Q 2020bvresources.com/dealstats
EXHIBIT 17C. MEDIAN NET PROFIT MARGIN (PRIVATE TARGETS)
EXHIBIT 17B. MEDIAN OPERATING PROFIT MARGIN (PRIVATE TARGETS)
9%
0%2%4%6%8%
10%12%14%16%18%20%
Mar
gin
Median for All Sectors
Agriculture, Forestry,
Fishing, and Hunting
Construction
Manufacturing
Wholesale Trade
Retail Trade
Transportation and
Warehousing
Information
Finance and
Insurance
Real Estate,
Rental and Leasing
Professional, Scientific,
and Technical Services
Administrative, Support,
Waste Mgmt., and
Remediation Svcs.
Educational Services
Health Care and
Social Assistance
Arts, Entertainment,
and Recreation
Accommodation and
Food Service
Other Services
Mining, Quarrying,
and Oil and Gas Extraction
Utilities
8%
-3%
0%
3%
6%
9%
12%
15%
18%
Mar
gin
Median for All Sectors
Agriculture, Forestry,
Fishing, and Hunting
Construction
Manufacturing
Wholesale Trade
Retail Trade
Transportation and
Warehousing
Information
Finance and
Insurance
Real Estate,
Rental and Leasing
Professional, Scientific,
and Technical Services
Administrative, Support,
Waste Mgmt., and
Remediation Svcs.
Educational Services
Health Care and
Social Assistance
Arts, Entertainment,
and Recreation
Accommodation and
Food Service
Other Services
Mining, Quarrying,
and Oil and Gas Extraction
Utilities
This digital edition was created exclusively for the use of Stacy Jewell of Business Valuation Resources.For licensing options, please contact Business Valuation Resources at [email protected].

22DEALSTATS VALUE INDEX | 4Q 2020bvresources.com/dealstats
MEDIAN SELLING PRICE AND MEDIAN NET SALES TRENDING LOWER
Exhibit 18A shows that the median selling price previously reached its highest level in 2017, at 320,000, but has trended lower in subsequent years, declining to $265,000 through the third quarter of 2020, based on 810 transactions. The decline in the median selling price is related to the net sales figure, which has been in decline since 2017 and was at its lowest levels in 2019 and 2020 since 2013, at $632,902 and $643,045. The prior highs for the median selling price were in 2014 and 2017, when it came in at $338,679 and $320,000, respectively. The decline in both the median selling price and net sales figure in 2018 and 2019 came as growth in the U.S. economy began to slow but the decline in 2020 coincides with the start of the U.S. and global recession brought on by the spread of the coronavirus. As the U.S. emerges from the recession, DealStats will continue to monitor and report on the trends regarding the pace of sales and related pricing multiples. As shown in Exhibit 18B, the median selling price-to-net sales multiple, which had come in at a 10-year low in 2019 of 0.47x, moved lower through the third quarter of 2020, to 0.44x.
EXHIBIT 18A. MEDIAN SELLING PRICE AND MEDIAN NET SALES (PRIVATE TARGETS)
$0
$100,000
$200,000
$300,000
$400,000
$500,000
$600,000
$700,000
$800,000
$0
$50,000
$100,000
$150,000
$200,000
$250,000
$300,000
$350,000
$400,000
2010 2011 2012 2013 2014 2015 2016 2017 2018 2019 3Q2020
Net
Sal
es
Selli
ng P
rice
Selling PriceNet Sales
EXHIBIT 18B. MEDIAN SELLING PRICE AND MEDIAN SELLING PRICE/NET SALES (PRIVATE TARGETS)
0.42x0.43x0.44x0.45x0.46x0.47x0.48x0.49x0.50x0.51x0.52x0.53x0.54x
$0
$50,000
$100,000
$150,000
$200,000
$250,000
$300,000
$350,000
$400,000
2010 2011 2012 2013 2014 2015 2016 2017 2018 2019 3Q2020
MVI
C to
Net
Sal
es
Selli
ng P
rice
Selling PricePrice to Net Sales
This digital edition was created exclusively for the use of Stacy Jewell of Business Valuation Resources.For licensing options, please contact Business Valuation Resources at [email protected].

23DEALSTATS VALUE INDEX | 4Q 2020bvresources.com/dealstats
2020 SALE PRICE IN FAVOR OF BUYERS WITH BIGGER DISCOUNTS
Exhibit 19 compares the median asking price with the median sales price for private targets since 2014. The trend from the first half of 2018 through the second half of 2019 saw the market favor sellers, as the sales price as a percentage of the asking price increased in each period. However, with the U.S. economy mired in a recession as a result of the economic lockdowns caused by the coronavirus pandemic, the market shifted in favor of buyers, who paid an average of 81.7% of the asking price. Over the five-year period from 2014 to 2019, the percentage of asking price has ranged from 79.2% (2H2014, 1H2018, and 1H2019) to 90.0% (2H2019) and has averaged 82.0% over this period.
EXHIBIT 19. MEDIAN ASK PRICE VS. MEDIAN SALE PRICE SEMIANNUALLY (PRIVATE TARGETS)
$217,500
$252,500
$222,500$249,000
$250,000$249,000
$279,000
$255,000 $250,000
$275,000
$250,000 $250,000
$232,500
$180,000$200,000 $190,000 $200,000 $210,000
$200,000
$230,000 $225,000$201,073
$225,000$209,500
$225,000$190,000
$0
$50,000
$100,000
$150,000
$200,000
$250,000
$300,000
1H 2014 2H 2014 1H 2015 2H 2015 1H 2016 2H 2016 1H 2017 2H 2017 1H 2018 2H 2018 1H 2019 2H 2019 1H 2020
Median Ask Price Median Sale Price
* Based on the sale date of transactions
This digital edition was created exclusively for the use of Stacy Jewell of Business Valuation Resources.For licensing options, please contact Business Valuation Resources at [email protected].

24DEALSTATS VALUE INDEX | 4Q 2020bvresources.com/dealstats
ECONOMIC SHUTDOWN SLOWS THE PACE OF SELL TO A FIVE-YEAR HIGH
The median number of days to sell for private targets reached its highest point in the first half of 2020, at 245 days for transactions to close. The economic turmoil caused by the COVID-19 crisis created uncertainty among small-business owners regarding the direction of the economy and questions over how and when business will resume seemingly affected the pace of sales. Since the first half of 2017, the median number of days to sell has remained above the five-year median, 211 days, as shown in Exhibit 20.
EXHIBIT 20. MEDIAN DAYS TO SELL SEMIANNUALLY* (PRIVATE TARGETS)
186 190 176 196 200 197 226 220 214 223 221 227 245
211
0
50
100
150
200
250
300
1H 2014 2H 2014 1H 2015 2H 2015 1H 2016 2H 2016 1H 2017 2H 2017 1H 2018 2H 2018 1H 2019 2H 2019 1H 2020
This digital edition was created exclusively for the use of Stacy Jewell of Business Valuation Resources.For licensing options, please contact Business Valuation Resources at [email protected].

25DEALSTATS VALUE INDEX | 4Q 2020bvresources.com/dealstats
NET SALES MULTIPLES TREND LOWER IN 2020
The net sales multiple trended lower in four of the five categories through the third quarter of 2020. The net sales multiple for private-seller transactions fell to 2.41x when a public buyer was involved and to 0.42x, a 10-year low, when a private buyer was involved. Public buyers of public sellers paid a net sales multiple of 3.26x through the third quarter of 2020. Private buyers of public sellers was the lone category to rise in 2020, to 3.15x. Within the “all transactions” category, a noticeable trend lower is evident. The downward trend started in 2018, when the multiple was at its highest level, 0.58x, in the year prior and fell in each subsequent year, reaching its lowest level in 2020, 0.46x. With the U.S. emerging from a recession and the presidential election occurring in the fourth quarter of 2020, keep an eye out for next quarter’s issue to see how the final multiples for 2020 are reported.
EXHIBIT 21. MEDIAN SELLING PRICE/NET SALES
0.0x
0.5x
1.0x
1.5x
2.0x
2.5x
3.0x
3.5x
4.0x
4.5x
2011 2012 2013 2014 2015 2016 2017 2018 2019 2020
Private buyers/public sellers Public buyers/public sellers Private buyers/private sellers
Public buyers/private sellers All transactions
Note: Each data point in this chart is based on a minimum of 10 transactions. If there are not enough transactions for a particular year, the data are not included.
This digital edition was created exclusively for the use of Stacy Jewell of Business Valuation Resources.For licensing options, please contact Business Valuation Resources at [email protected].

About Business Valuation ResourcesEvery informed stakeholder in business valuation, performance benchmarking, or risk assessment turns to Business Valuation Resources (BVR) for authoritative deal and market data, news and research, training, and expert opinion. Trust BVR for unimpeachable business valuation intelligence. BVR’s data, publications, and analysis have won in the boardroom and the courtroom for over two decades.
BVRWhat It’s Worth
Learn more about all of our offerings at: bvresources.com
Deal & Market Data
• DealStats• Cost of Capital Professional• Valuation Benchmarking Platform• Guideline Public Company Comps Tool• BIZCOMPS• Economic Outlook Update• FactSet Mergerstat/BVR Control Premium Study• Stout Restricted Stock StudyTM
• Valuation Advisors Discount for Lack ofMarketability Study
• ktMINE Royalty Rate Data & License Agreements• First Research Industry, State & Province Profiles• BizMiner Industry Financial Reports• Mergerstat Review & Mergerstat Review Monthly• Butler Pinkerton Calculator – Total Cost of Equity
and Public Company Specific Risk Calculator• Vertical IQ - U.S. and Canada Industry Profiles• RCReports
Training & CPE
• Webinars• Web Workshops & Special Series• Desktop Learning Centers• Self-study CPE• eLearning courses
News & Research
• BVResearch Pro• Business Valuation Update• BVLaw• Economic Outlook Update• Business Reference Guide Online
Guides, Books & Reports
• Digital Library• Guides & Books• Special Reports• Legal Compendiums• Yearbooks
Business intelligence at your fingertips.
bvresources.comThis digital edition was created exclusively for the use of Stacy Jewell of Business Valuation Resources.
For licensing options, please contact Business Valuation Resources at [email protected].