value for money - amazon s3 · 3 value for money self-assessment 2016/17 contents 1.0 executive...
TRANSCRIPT
VALUE FOR MONEYSELF-ASSESSMENT 2016/17

2

3
VALUE FOR MONEYSELF-ASSESSMENT 2016/17
CONTENTS1.0 EXECUTIVE SUMMARY 4
2.0 Our 2016/17 VALUE FOR MONEY HIGHLIGHTS 6
3.0 Our strategic approach to VALUE FOR MONEY 8
4.0 OUR COSTS AND PERFORMANCE 10
5.0 USING OUR ASSETS 18
6.0 OUR SERVICES AND OUR PEOPLE 22
7.0 SOCIAL AND ENVIRONMENTAL RETURNS 28
8.0 THE FUTURE 32
4

1. Growth through more housing provision
2. Providing good, reliable and efficient services to our customers
3. A sustainable business model in terms of energy, culture, use of IT and employee skills
4. Continued commitment to corporate social responsibility
Our vision is that everyone has a home. We know that there has never been a greater need to innovate to provide good quality housing across the country. And, we know that helping to end the nation’s housing crisis is the biggest impact we can have on society.
Our core activities are to provide affordable homes and associated services through our Registered Providers and other member companies. We also provide care and support services to the elderly and vulnerable, maintain our properties and develop new homes for rent and sale. Our clear vision, strategy and objectives ensure that delivering value for money is at the heart of our business and is a constant thread through our services, processes and culture. By taking a commercial approach and focusing on efficiency we are maximising our ability to deliver our vision.
Our four corporate objectives are;
We have had another successful year, building on our financial strength. In this first year of the Government-imposed rent cut, we set efficiency targets for housing, care and support and asset management and maintenance. These targets were exceeded. We will continue to focus on efficiency savings and deliver value-for-money core services as we enter the second year of these rent reductions.
This year’s value for money self-assessment sets out our resolute approach to increasing value for money and details how we have achieved efficiencies in key areas of the business during 2016/17.
5
1.0 EXECUTIVE SUMMARY
By Bjorn Howard, Group CEO

6
Our 2016/17
VALUE FOR MONEY HIGHLIGHTS
£4,300,000Operational efficiencies realised by our operational teams
10.1%
Return on assets, a 0.5% increase*
£432,000Savings achieved through our smarter approach to procurement
£1,065,000,000Generated in economic value across our operating regions over the last 10 years
88%
Of our tenants are satisfied that their rent provides value for money
£1,200,000 Our social return on investment equating to £28 for every pound we invested
57%
Reduction in our business miles as a result of investment in new technologies and flexible working
£2,690,000Capital receipts generated through our stock rationalisation project
“ 829 number of new homes built”
2.0
* The return on assets calculation measures the operating surplus of Aster (adjusted for the annualised impact of the rent discount for social tenants) against the deemed cost of Aster's housing assets.

Our 2016/17
VALUE FOR MONEY HIGHLIGHTS
£1,200,000 Our social return on investment equating to £28 for every pound we invested
7

8
9
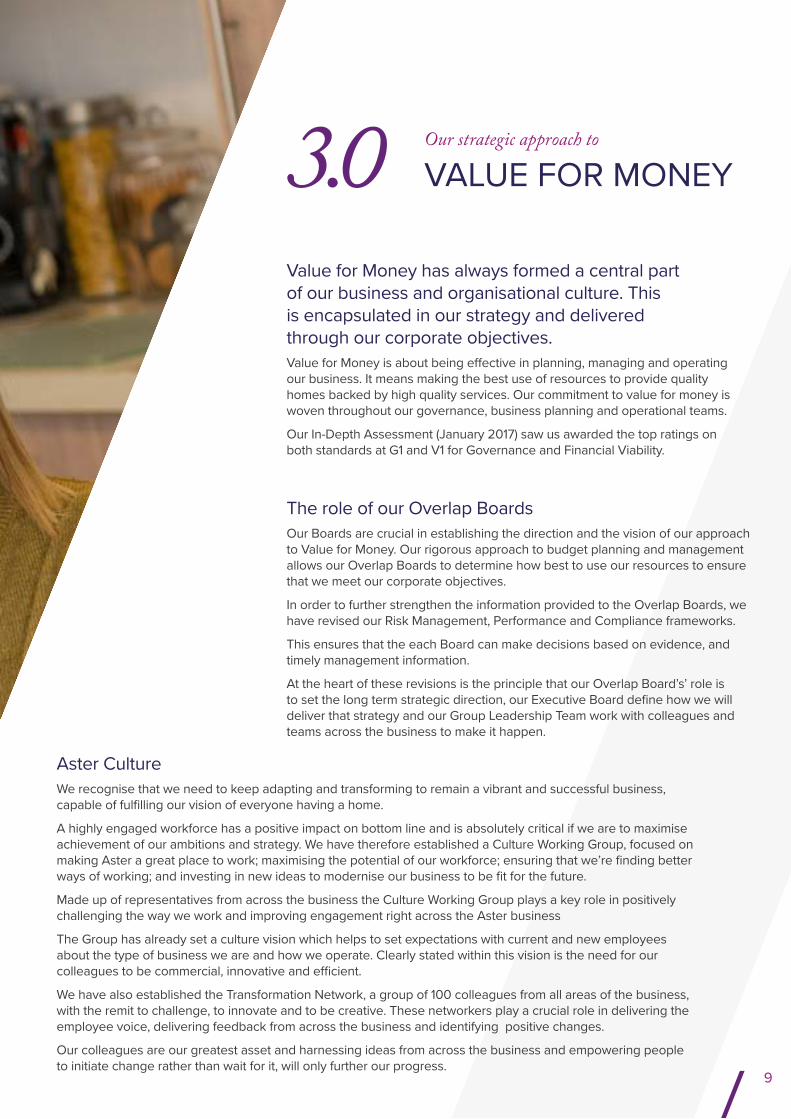
3.0Value for Money has always formed a central part of our business and organisational culture. This is encapsulated in our strategy and delivered through our corporate objectives.Value for Money is about being effective in planning, managing and operating our business. It means making the best use of resources to provide quality homes backed by high quality services. Our commitment to value for money is woven throughout our governance, business planning and operational teams.
Our In-Depth Assessment (January 2017) saw us awarded the top ratings on both standards at G1 and V1 for Governance and Financial Viability.
The role of our Overlap BoardsOur Boards are crucial in establishing the direction and the vision of our approach to Value for Money. Our rigorous approach to budget planning and management allows our Overlap Boards to determine how best to use our resources to ensure that we meet our corporate objectives.
In order to further strengthen the information provided to the Overlap Boards, we have revised our Risk Management, Performance and Compliance frameworks.
This ensures that the each Board can make decisions based on evidence, and timely management information.
At the heart of these revisions is the principle that our Overlap Board’s’ role is to set the long term strategic direction, our Executive Board define how we will deliver that strategy and our Group Leadership Team work with colleagues and teams across the business to make it happen.
Aster CultureWe recognise that we need to keep adapting and transforming to remain a vibrant and successful business, capable of fulfilling our vision of everyone having a home.
A highly engaged workforce has a positive impact on bottom line and is absolutely critical if we are to maximise achievement of our ambitions and strategy. We have therefore established a Culture Working Group, focused on making Aster a great place to work; maximising the potential of our workforce; ensuring that we’re finding better ways of working; and investing in new ideas to modernise our business to be fit for the future.
Made up of representatives from across the business the Culture Working Group plays a key role in positively challenging the way we work and improving engagement right across the Aster business
The Group has already set a culture vision which helps to set expectations with current and new employees about the type of business we are and how we operate. Clearly stated within this vision is the need for our colleagues to be commercial, innovative and efficient.
We have also established the Transformation Network, a group of 100 colleagues from all areas of the business, with the remit to challenge, to innovate and to be creative. These networkers play a crucial role in delivering the employee voice, delivering feedback from across the business and identifying positive changes.
Our colleagues are our greatest asset and harnessing ideas from across the business and empowering people to initiate change rather than wait for it, will only further our progress.
Our strategic approach to
VALUE FOR MONEY
10

4.0 OUR COSTS AND PERFORMANCE
SummaryIn 2016/17 we continued to demonstrate strong financial performance in both absolute and comparative terms through focused management of the balanced scorecard underpinning Aster’s Corporate Strategy,
11
1. We have increased our operating margin on social housing lettings from 39% to 40%
2. We have delivered 829 new homes compared to 724 in 2015/16, and expect this upward trajectory to continue into 2017/18
3. We have continued to improve our position relative to our peers across a range of financial metrics and show on-going improvement in our performance over time.
KPI
Budgetedperformance
target 2016/17
Actualperformance
2016/17Actual
performance
2015/16
Group profit (after tax)
Operating margin (all lettings)
Operating margin (social housing lettings)
Social Housing costs per unit
Number of new homes completed
12
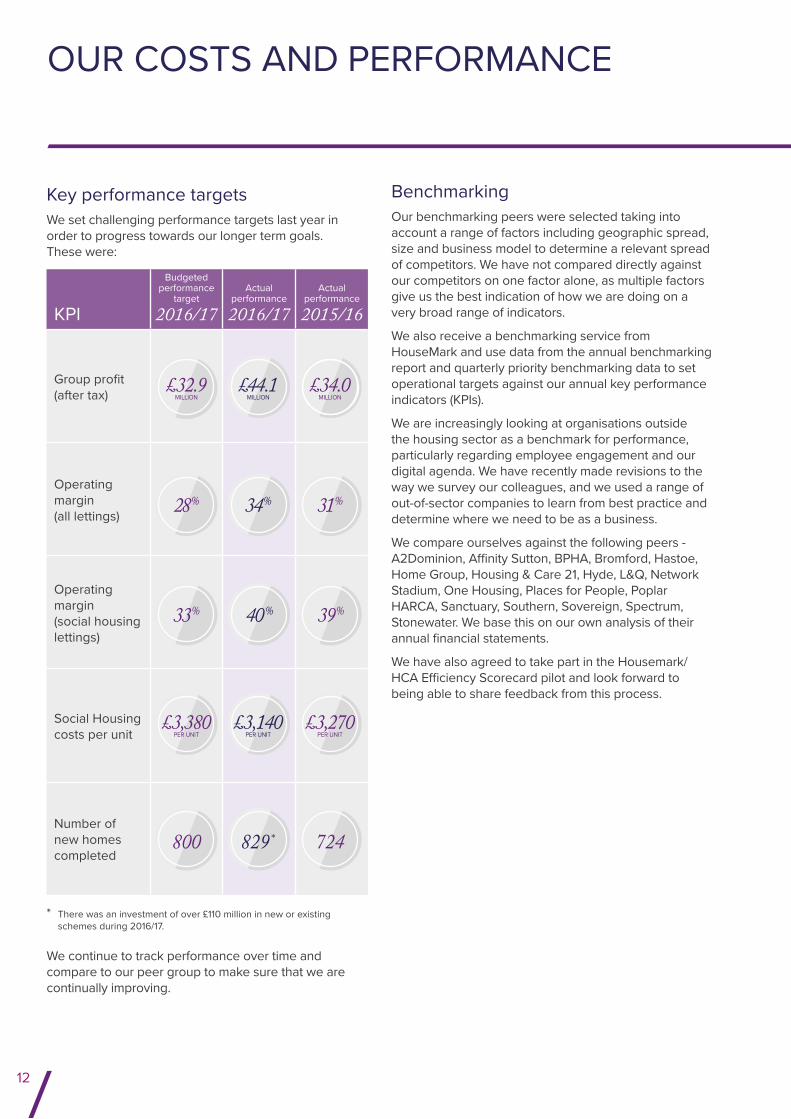
BenchmarkingOur benchmarking peers were selected taking into account a range of factors including geographic spread, size and business model to determine a relevant spread of competitors. We have not compared directly against our competitors on one factor alone, as multiple factors give us the best indication of how we are doing on a very broad range of indicators.
We also receive a benchmarking service from HouseMark and use data from the annual benchmarking report and quarterly priority benchmarking data to set operational targets against our annual key performance indicators (KPIs).
We are increasingly looking at organisations outside the housing sector as a benchmark for performance, particularly regarding employee engagement and our digital agenda. We have recently made revisions to the way we survey our colleagues, and we used a range of out-of-sector companies to learn from best practice and determine where we need to be as a business.
We compare ourselves against the following peers - A2Dominion, Affinity Sutton, BPHA, Bromford, Hastoe, Home Group, Housing & Care 21, Hyde, L&Q, Network Stadium, One Housing, Places for People, Poplar HARCA, Sanctuary, Southern, Sovereign, Spectrum, Stonewater. We base this on our own analysis of their annual financial statements.
We have also agreed to take part in the Housemark/HCA Efficiency Scorecard pilot and look forward to being able to share feedback from this process.
OUR COSTS AND PERFORMANCE
Key performance targetsWe set challenging performance targets last year in order to progress towards our longer term goals. These were:
We continue to track performance over time and compare to our peer group to make sure that we are continually improving.
800 829 * 724
34 % 31%
33 % 40 % 39 %
* There was an investment of over £110 million in new or existing schemes during 2016/17.
£32.9 MILLION £44.1
MILLION £34.0 MILLION
£3,380 PER UNIT £3,140
PER UNIT £3,270 PER UNIT
28 %

13
During 2016/17 we have seen performance improve against the range of indicators we monitor against, with the overall trend showing continuing improvement. We are performing well on all metrics against our competitor set. Our social housing costs per unit are close to the lower quartile level, reflecting our tight cost control and planned efficiency savings. This has enabled us to invest in more homes in line with our vision.
VALUE FOR MONEY ANALYSIS
ASTER
2016/17ASTER
2015/16PEER GROUP
2015/16
PEER GROUP
2015/16
Actual Actual Average Median
Social housing costs per unit £3,140 £3,270 £3,870 £3,460
Operating margin 34% 31% 30% 32% Chief executive pay per unit £7.76 £7.71 £10.41 £8.80
Current rent arrears 1.9% 2.1% 3.3% 3.4% Rent void losses per unit £31.97 £34.94 £82.59 £60.09

14
Overall this analysis shows that our costs were below the national median figure, close to the lower quartile and had reduced from 2015/16.
Our continued focus on cost and efficiency across the business has delivered a decrease in the majority of cost categories. Services have been reviewed, challenged and adapted so that we work smarter and with a better use of technology. This has been achieved even with significant IT investment during 2016/17.
The maintenance cost has reduced from £710 to £660 and whilst we have experienced a drop in the number of voids during the period, there has also been a strong approach to reducing costs and improving efficiency, for example, through more effective procurement, a revised letting standard and standardisation across our regions. The reduced cost of maintenance has not been due to reduced service levels. Our lower maintenance cost has not come at the expense of stock condition, programmed work or safety. All required maintenance has been completed, and we have seen improved void re-let times alongside the reviewed lettable standard. Maintenance costs will continue to be maintained and our improved, more robust approach to recharges will further reduce costs and increase the levels of income recovery. Our combined maintenance and major repairs cost per unit is mid-way between the lower and median quartiles, and the ratio of planned to response spend is 70% : 30%.
OUR COSTS AND PERFORMANCE
Cost per unitIn the year we have received more detailed information on the HCA’s unit cost analysis, and transitioned to using this to measure our performance.
2016/17 2015/16
Movement
National comparison figures 2015/16
COSTS Actual ConsolidatedUpper quartile Median
Lower quartile
Management £820 £970 -15% £1,320 £1,020 £740 Service charge £310 £260 19% £600 £360 £240 Maintenance £660 £710 -7% £1,180 £970 £790Major repairs £890 £900 -1% £1,080 £810 £540 Other social housing costs £460 £430 7% £450 £210 £80 Total costs £3,140 £3,270 -4% £4,350 £3,570 £3,120
Quartile key
On major repairs, while overall investment has reduced this is without adverse impact on condition or quality of the housing stock. Our assets will continue to be maintained in line with the Decent Homes Standard, the average cost has been confirmed as being within sector averages, we have confirmed sustainable levels of long term property investment and key investment programmes remain in place.
Our service charges have increased but still remain below the median level as we work to improve contract management.
In relation to ‘other social housing costs’, our costs are high due to our care and support and assistive living businesses which are a core part of our strategy. If these costs were excluded, then we would be close to the lower quartile level of £80.
In future years we plan to incorporate the HCA unit cost approach into our comparative analysis alongside the other measures being introduced through the sector scorecard.

Longer term trend analysis We also track longer term trends against our peer group. These measures are core surplus generation (excluding sales and impairments), overall operating margin (including sales), and operating margin on social housing lettings.We have used these measures for longer term comparative purposes because they are less dependent on the differing business models of our peer group and differing accounting treatments of specific items. Across all three measures our performance is improving year on year, and is good against our peer group.
Operating margin on SH lettings
Operating margin for all activities including sales
Note: The large operating surplus for the peer group in 2015/16 of £44 million was due to some very high surpluses for a small number of peers.
15
2016/17 2015/16 2014/15 2013/14 2012/13
2016/17 2015/16 2014/15 2013/14 2012/13
2016/17 2015/16 2014/15 2013/14 2012/13
ASTER
ASTER
ASTER
AVERAGE (Non ASTER)
AVERAGE (Non ASTER)
AVERAGE (Non ASTER)
Surplus exc sales and impairment
16
272123
2721
33
44
3127
3128
3538 3637
40
222224252931 303234
£m
%%
42

16
Upper Quartile
Middle Upper
Median
Middle Lower
Lower Quartile
No Data
VALUE 2016/17 2015/16Satisfaction - % very or fairly satisfied with neighbourhood (GN and HfOP) 87% 89% Satisfaction - % very or fairly satisfied rent provides value for money (GN and HfOP) 88% 88% BUSINESS AND FINANCIAL CPP- Cost Per Property 2016/17 2015/16Rent arrears of current tenant as % of rent due (excluding voids) (GN and HfOP) 2.92% 3.04% Rent loss due to empty properties (voids) as % rent due (GN and HfOP) 0.45% 0.57% Rent written off as a % of rent due (GN and HfOP) 0.44% 0.46%
HouseMark data and peer group comparison
PROCESS 2016/17 2015/16Rent collected from current and former tenants as % rent due (excl arrears b/f) 100.15% 99.81% Average re-let time (days) standard re-lets (GN and HfOP) 14.26 17.61 Repairs completed at first visit % 90% 91.8%
Organisations in peer groupA2Dominion Bromley, Ealing, London, Newham, Oxford, Slough, Staines, Winchester
Affinity SuttonBristol, Bromley
BPHATowcester
BromfordWolverhampton
HastoeDorset, Essex, Surrey
Home GroupStratton St. Margaret, Swindon
Housing & Care 21Swindon
Hyde Brighton, Havant, Kent, London, Peterborough, Southampton, Stonebridge, West Sussex
L&QLondon
Network StadiumHarrow, Hertford, London, St. Albans
One HousingLondon
Places for PeopleCirencenster, Wiltshire
Poplar HARCALondon
SanctuarySwindon
SouthernSwindon
SovereignBristol
Spectrum Housing GroupDorset, Somerset, Hampshire, IOW, Devon, Cornwall
StonewaterSwindon
Quartile key
OUR COSTS AND PERFORMANCE
STAR Survey (Survey of Tenants and Residents)
QUESTION Score2016/17
Score2015/16
Net promoter score* +14 +11* Net promoter score is calculated by adding up all the survey ‘promoters minus detractors’ scores and then adding all the ‘detractor’ scores and then deducting the promoters – detractors to give a +/- %. We collect this score so that we can measure our customer experience.

17
Quartile key
Voice of the customerA suite of contact driven customer surveys, focusing on our core services, are carried out on a regular basis. In addition, we have chosen to continue with STAR in order to ensure all customers have a chance to feedback, regardless of their level of contact. The survey process is regularly reviewed to ensure that the methodology is efficient and the data collected is useful.
In April 2016 the number of ‘tick box’ survey questions were reduced. We made a shift to asking about customer effort and giving customers the opportunity to tell us what is important to them in their own words. Customers are able to focus on the processes rather than the outcome and this in turn enables us to identify inefficiencies internally. This new approach has provided us with richer, more useful data and has also saved in the region of £20,000.
STAR satisfaction and effort is monitored quarterly. There have been no statistically significant changes in satisfaction scores since the previous financial year and the net promoter scores indicate that customers are becoming more likely to recommend Aster to friends and family. Customer effort has also improved over the year and is an indication of the continual streamlining of processes, more choice of contact channels and an increasing self-serve offer.
18

19
5.0 USING OUR ASSETS
SummaryWe continue to improve our approach in managing our assets. Our strategy continues to focus on increasing the financial returns from our assets while at the same time reducing our maintenance and operating costs.
We have improved both our financial and social value returns in order to maximise efficiencies and continue to develop and enhance our approach to dynamic asset management.
Our development and asset management strategies continue to focus on building and retaining stock in desirable areas where demand for our housing product remains strong.
Asset management strategyDuring 2016/17 we revised our asset management strategy with a view to supporting the delivery of our corporate objectives through effective stock investment and active asset management initiatives.
We have increased our stock rationalisation activity, retaining stock in high demand areas while actively disposing of our least performing ones.
The performance of our asset portfolio helps support our financial strength and we continue to monitor the financial performance of each of the asset classes we manage.
In addition to rental income, we have been monitoring both our operating profit and operating margins and, where necessary, have taken appropriate action to maximise the return or minimise liability.
USING OUR ASSETS
20
2016/17 2015/16
CATEGORIESEUV-SH (Existing Use Value) £’ million
OMV-VP (Open Market Value) £’ million
Rental income£’ million
Grossyield
Operating profit£’ million
Operating margins
Operating margins
General needs(Affordable rent / general needs / private sector leasing / temporary social housing)
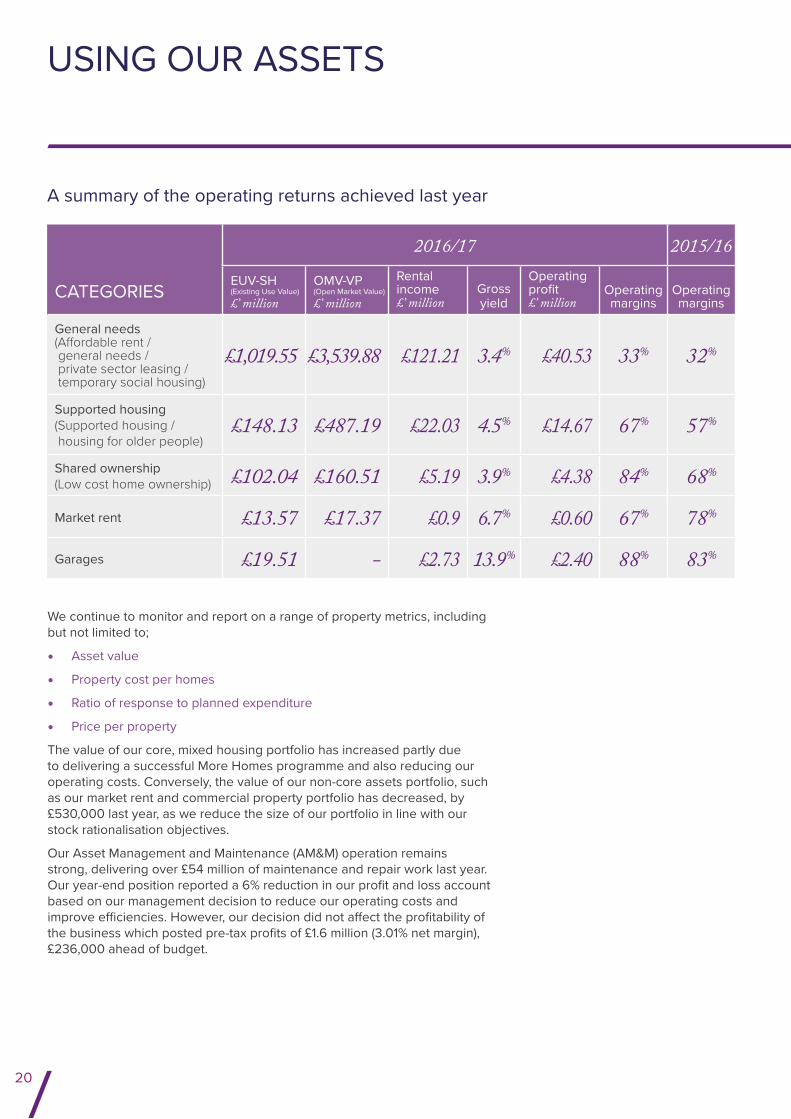
£1,019.55 £3,539.88 £121.21 3.4% £40.53 33% 32%
Supported housing (Supported housing / housing for older people)
£148.13 £487.19 £22.03 4.5% £14.67 67% 57%
Shared ownership(Low cost home ownership) £102.04 £160.51 £5.19 3.9% £4.38 84% 68%
Market rent £13.57 £17.37 £0.9 6.7% £0.60 67% 78%
Garages £19.51 - £2.73 13.9% £2.40 88% 83%
A summary of the operating returns achieved last year
We continue to monitor and report on a range of property metrics, including but not limited to;
• Asset value
• Property cost per homes
• Ratio of response to planned expenditure
• Price per property
The value of our core, mixed housing portfolio has increased partly due to delivering a successful More Homes programme and also reducing our operating costs. Conversely, the value of our non-core assets portfolio, such as our market rent and commercial property portfolio has decreased, by £530,000 last year, as we reduce the size of our portfolio in line with our stock rationalisation objectives.
Our Asset Management and Maintenance (AM&M) operation remains strong, delivering over £54 million of maintenance and repair work last year. Our year-end position reported a 6% reduction in our profit and loss account based on our management decision to reduce our operating costs and improve efficiencies. However, our decision did not affect the profitability of the business which posted pre-tax profits of £1.6 million (3.01% net margin), £236,000 ahead of budget.

21
Our Property Cost Per Home (PCPH) and Price Per Property (PPP) metrics both finished the year within target. We will continue to invest and maintain our assets in accordance with our regulatory and statutory duties. We will continue to deliver programmes of work that have a positive impact on our business, our customers and the wider communities in which we operate.
In 2016/17, we invested £3.4 million in renewable energy solutions, installing 750 solar panels with an anticipated rate of return of 5.1% and an annual income forecast at £176,000 per annum.
The adoption of our new energy efficiency strategy continues to pay dividends in respect of the energy efficiency performance of the stock. Although we just failed to meet our year-end target SAP rating of 73, recording an average rating of 72.89 at 31 March 2017, we have maintained our upper quartile benchmark position and are on course to meet our 2019 strategic target of 74.
We continue to review the performance of our assets to ensure we make the right decisions for the long term future of our business. We have completed a number of strategic reviews using our Asset grading Tests (AGT) including our garage, commercial property, extra care and sheltered housing (Dorset) portfolios.
We have completed the service improvement plan for our garage portfolio introduced in 2015/16. As a result, we have increased rental income by over £266,000 last year, standardised and aligned our license charges to reflect local markets, embarked on a £5 million investment programme and instructed JLL to carry out a valuation of the stock which is now valued at £19.6 million. We have also undertaken an indicative market valuation (vacant possession) which values our stock at £4.2 million.
Over the next three years we expect our garage income to increase by over £2 million, helping to deliver further new homes each year.
During 2016, we began to reduce the size of our commercial property portfolio by selling our occupational leases. Four properties valued at over £515,000 have been sold and a further 23 are due to be sold over the course of the next year.
Our Stock Options Appraisal team completed 79 detailed options appraisals, as part of our annual appraisal programme. Over a third of the schemes were found to be making a positive contribution and were returned to management. Our Group Investment Panel approved the sale of 40 individual properties or schemes; 22 of which have now been sold generating a capital receipt of £2.67 million. Some 18 other properties are currently being marketed and are expected to generate a £1.9 million in sales receipts.
We continue to focus on managing our land interests as well as our property assets. Our Land & Property team secured £277,000 through negotiating land transactions. Our Clerk of Works team has seen a step change in the number of latent defect claims and, by introducing improvements in management procedures, have generated savings worth £162,000.
Our Land Enhancement Team continues to seek out and secure value for money opportunities for our business. The team secured planning permission to develop seven sites, increasing the existing use value and generating sales receipts of £1.3 million. In the last three years, the team have generated over £3 million of additional income and are progressing a further 35 sites over the next year or so.

22
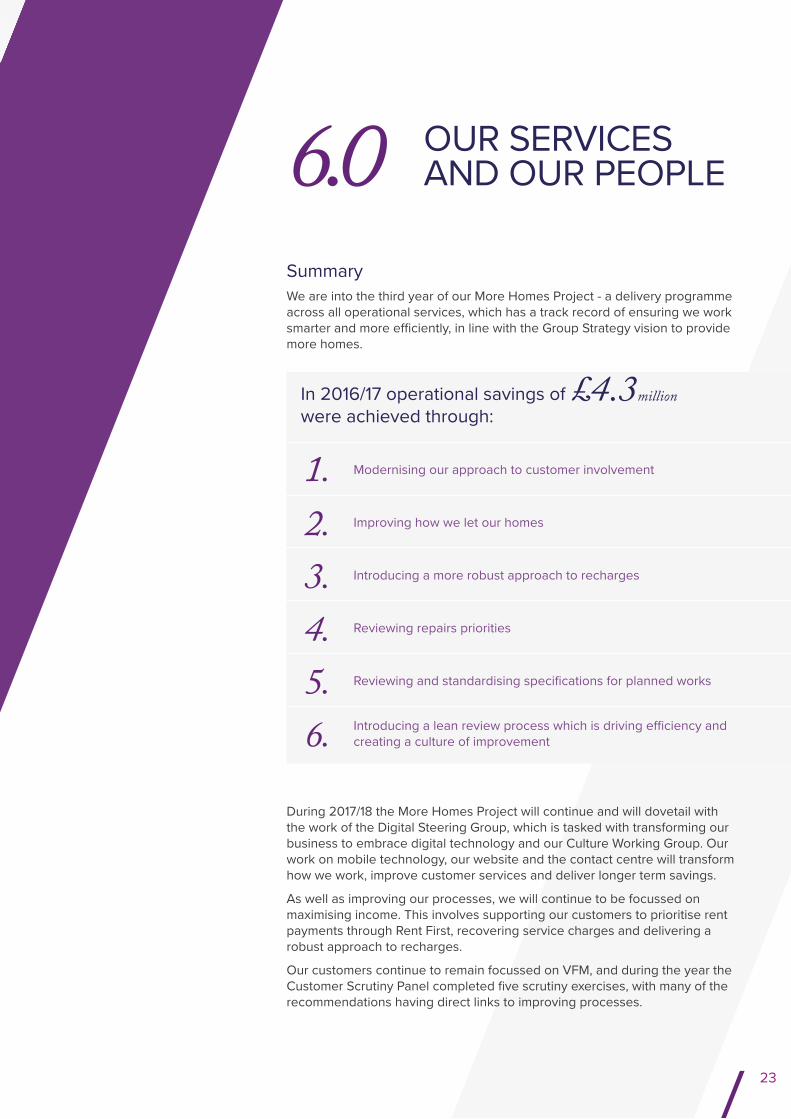
In 2016/17 operational savings of
were achieved through:
23
6.0 OUR SERVICES AND OUR PEOPLE
1. Modernising our approach to customer involvement
2. Improving how we let our homes
3. Introducing a more robust approach to recharges
4. Reviewing repairs priorities
5. Reviewing and standardising specifications for planned works
6. Introducing a lean review process which is driving efficiency and creating a culture of improvement
SummaryWe are into the third year of our More Homes Project - a delivery programme across all operational services, which has a track record of ensuring we work smarter and more efficiently, in line with the Group Strategy vision to provide more homes.
During 2017/18 the More Homes Project will continue and will dovetail with the work of the Digital Steering Group, which is tasked with transforming our business to embrace digital technology and our Culture Working Group. Our work on mobile technology, our website and the contact centre will transform how we work, improve customer services and deliver longer term savings.
As well as improving our processes, we will continue to be focussed on maximising income. This involves supporting our customers to prioritise rent payments through Rent First, recovering service charges and delivering a robust approach to recharges.
Our customers continue to remain focussed on VFM, and during the year the Customer Scrutiny Panel completed five scrutiny exercises, with many of the recommendations having direct links to improving processes.
£4.3million
OUR SERVICES AND OUR PEOPLE
24
Service delivery During 2016 a mobile working solution for the Neighbourhood Team was introduced. This has led to a more efficient process in which household information and repairs are updated in real time, more detail is included, and any follow-on actions are created immediately. As a direct result, our neighbourhood officers are spending around 30% less time on tenancy checks and neighbourhoods visits. We have calculated the salary saving to be £100,000 and this is allowing more tenancy checks and visits to be completed with the same level of resource. The services delivered through the mobile device continue to be developed and phase two will be delivered in 2017/18.
The repairs service continues to perform well, with a forecasted profit of £1.4 million against a target of £1.36 million. The efficiencies and actions taken include:
• £800,000 operational efficiencies realised by our AM&M teams against target of £650,000
• £432,000 reduction in material spends (6%) as a result of re-tender and implementation of robust contract management procedures
• Completed a process review of our planning teams to improve efficiency and align processes in advance of new call centre launch in 2017
• Completed a strategic review of administration across repairs, planned and cyclical areas as part of our efficiency drive and to simplify, automate and digitise processes
• £187,000 non-cashable saving through successfully defending insurance claims made against Aster in regards to tree related subsidence with all technical detail offered through AM&M employees with no need for external consultation or advice.
Income maximisation There are a number of threads of work that are maximising Aster’s income stream. The Rent First project encourages customers to prioritise payment of their rent. This will be achieved by:
• Embedding a culture of Rent First across the business, all colleagues understanding that rent collection is critical to the aims of the business
• Identifying customers who need help and support
• Promoting the need to pay rent when delivering any service to customers
Following a review of Aster’s leasehold services, new Section 20 Consultation policies and procedures have been implemented, ensuring that income from leaseholders and tenants is maximised. In 2016/17 Aster undertook seventeen Section 20 consultations, with an estimated value of £5.4 million.
Finally, we have transformed our approach to recovering recharges, with the emphasis on preventing recharges arising in the first place while retaining an ethos of fairness, consistency and value for money. W
£800,000 operational efficiencies realised by our AM&M teams against target of £650,000
£432,000 reduction in material spends as result of
re-tender and implementation of robust contract management procedures
25

26
OUR SERVICES AND OUR PEOPLE
27
Working smarter We’re underway with an ambitious programme to modernise and improve the way our customers access our services. We’re improving the digital and self-serve options available to our customers, providing a much greater choice of how and when they contact us, reducing their effort, as well improving our contact centre colleagues’ ability to resolve issues in one contact.
Our goal is to reduce the amount of queries and tasks handed into the operational business, to create efficiency of effort on our part, and improve our customers’ experience. At the same time, and in support of this, we’re reviewing, simplifying and standardising processes and the way our systems manage our volume transactions, to ensure that they deliver efficient management of customer contact and tasking. We’re also focussing on the automation of processes to make best use of the current and emerging technologies. Our intention is to provide efficient access to our services, which in turn will improve our own operating efficiency. We have modelled the cost to serve elements of many of our volume transactions, and can clearly see the potential efficiency savings associated with this work.
One example would be the introduction of an automated telephony payment service, which allows customers to make payments to us, self-serve, 24 hours a day. In providing this, we will avoid the colleague time involved in processing payments manually, saving the business an approximate of 5000 hours of activity in payment processing alone.
This wide ranging change programme around customer contact links firmly with many of the other activities across our business. One of these being to support the objectives of modernisation of our business; and in realising the efficiencies and improvements which can be brought about in achieving this goal.
Our people and culture At Aster we are changing how we work. Using new technology, more of our people work flexibly.
• The roll out of Microsoft Lync has reduced business miles, generating savings in cost and time
• There has also been a strategic overhaul of the HR service. Processes are being automated and managers’ skills are being enhanced
Aster has a strong history in supporting apprenticeships, with 11 apprentices in 2016/17 and during 2017/18 we will support at least a further 12 apprentices.
We have provided 45 work placement or volunteering opportunities directly or through our supply chain to give something back to our communities and help improve the skills of our customers. In addition, this corporate social responsibility priority has increased the potential recruitment pool for future vacancies and promotes Aster as an employer of choice. For 2017/18 the target has increased to 60 to build upon the successes of 2016/17.
As mentioned earlier in this report, we are also focused on building a highly engaged workforce as we know this will have a positive effect on bottom line.
Aster continues on the journey from embedding an efficient approach, to embedding an innovative approach. Our culture is increasingly focussed on harnessing the potential of our people to unlock capacity across the business.
We empower our people to generate ideas to make changes all across the business. An example of this is our innovation cafes, our colleagues were empowered to debate a number of topics, from Risk to IT to policies and procedures, all on the theme of keeping it simple. These sessions are stimulating a lot of idea generation and turning change into a truly collaborative process all across the business. We have tasked our Transformation Network to constantly challenge the status quo, and to ensure that we constantly ask ourselves why?
Aster has a strong history in supporting apprenticeships, with 11 apprentices in 2016/17 and during 2017/18 we will aim to support at least a further 12
We have provided 45 work placement or
volunteering opportunities
28
29
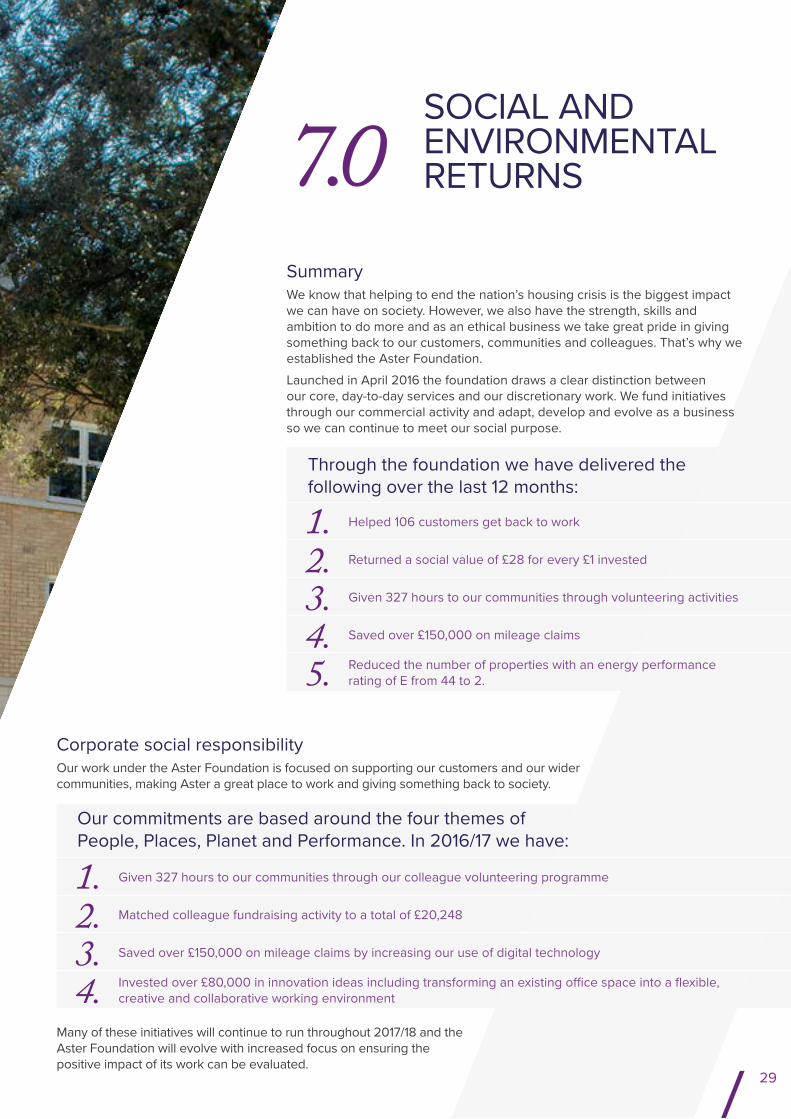
Corporate social responsibilityOur work under the Aster Foundation is focused on supporting our customers and our wider communities, making Aster a great place to work and giving something back to society.
Many of these initiatives will continue to run throughout 2017/18 and the Aster Foundation will evolve with increased focus on ensuring the positive impact of its work can be evaluated.
7.0 SOCIAL AND
ENVIRONMENTAL RETURNS
SummaryWe know that helping to end the nation’s housing crisis is the biggest impact we can have on society. However, we also have the strength, skills and ambition to do more and as an ethical business we take great pride in giving something back to our customers, communities and colleagues. That’s why we established the Aster Foundation.Launched in April 2016 the foundation draws a clear distinction between our core, day-to-day services and our discretionary work. We fund initiatives through our commercial activity and adapt, develop and evolve as a business so we can continue to meet our social purpose.
1. Helped 106 customers get back to work
2. Returned a social value of £28 for every £1 invested
3. Given 327 hours to our communities through volunteering activities
4. Saved over £150,000 on mileage claims
5. Reduced the number of properties with an energy performance rating of E from 44 to 2.
1. Given 327 hours to our communities through our colleague volunteering programme
2. Matched colleague fundraising activity to a total of £20,248
3. Saved over £150,000 on mileage claims by increasing our use of digital technology
4. Invested over £80,000 in innovation ideas including transforming an existing office space into a flexible, creative and collaborative working environment
Through the foundation we have delivered the following over the last 12 months:
Our commitments are based around the four themes of People, Places, Planet and Performance. In 2016/17 we have:

30
SOCIAL AND ENVIRONMENTAL RETURNS
Community investmentOur focus this year has been on building partnerships within our communities to help deliver training and awareness courses to our customers. As well as continuing to build on our successful partnership with the DWP (Department for Work and Pensions), we have become referral partners for many externally funded organisations who have pre-established programmes that meet our customers’ needs.
Through these partnerships and an additional £25,000 invested by Aster in more bespoke ‘back to work’ courses, 334 customers have been supported to receive training and advice on gaining employment, digital inclusion and managing money.
106 customers helped to gain full or part time employment
Invested £40,000
Social return on investment of
£1.12 million
This represents a return of approximately £28 for every £1 invested, rising from £19 in 2015/16
68 of these customers were in rent arrears
42 of them have reduced their arrears since returning to work, by a total of 41%
19 have taken up volunteering opportunities
23 entered work placement or apprenticeship schemes
We evaluate the social impact of these initiatives using the HACT social value tool.
In 2016/17 we…
In addition to our partnership working we have received £32,000 in funding from Dorset County Council to host a troubled family’s key worker, supporting the work of the Dorset Families Matter programme. The programme is part of a significant national initiative to develop new ways of working with families to deliver real, lasting, positive change. To date our key worker has supported 10 Aster families who were experiencing multiple and complex challenges, to work towards their own positive outcomes and improve their wellbeing.
31
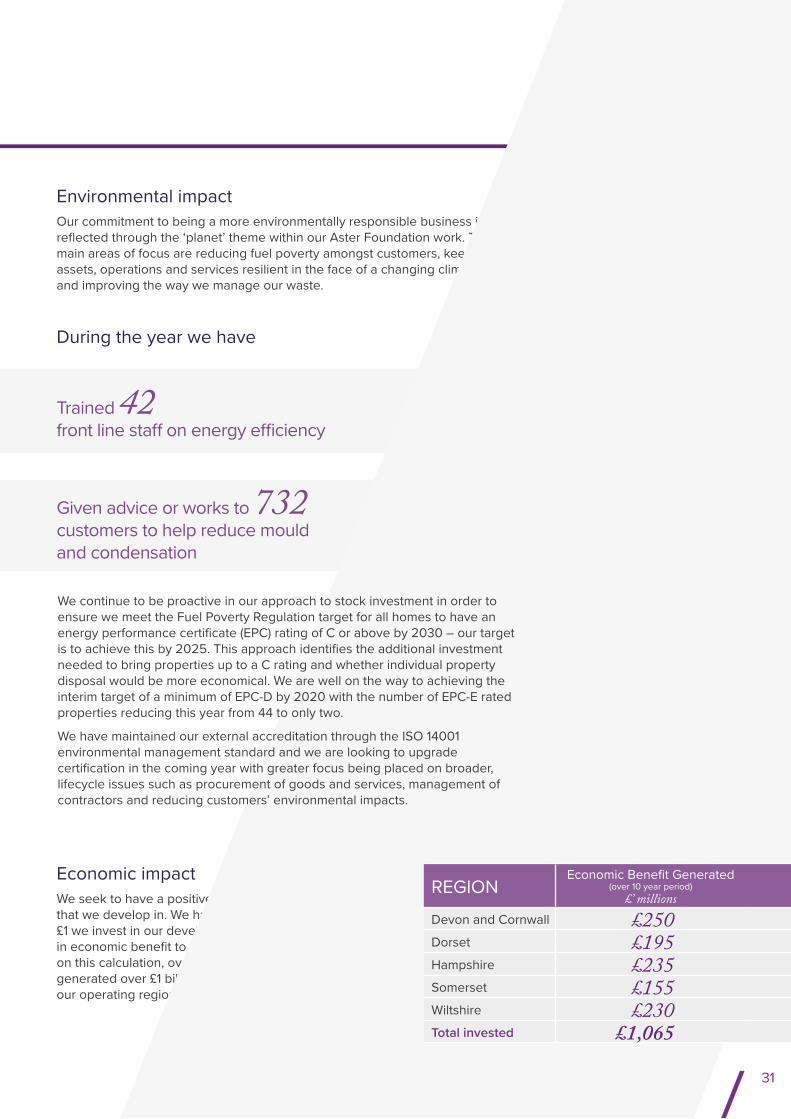
Trained 42 front line staff on energy efficiency
Given 60 customers advice on switching energy providers
68 of these customers were in rent arrears
42 of them have reduced their arrears since returning to work, by a total of 41%
19 have taken up volunteering opportunities
23 entered work placement or apprenticeship schemes
Environmental impactOur commitment to being a more environmentally responsible business is reflected through the ‘planet’ theme within our Aster Foundation work. The main areas of focus are reducing fuel poverty amongst customers, keeping assets, operations and services resilient in the face of a changing climate and improving the way we manage our waste.
During the year we have
Economic impactWe seek to have a positive impact on the communities that we develop in. We have calculated that for every £1 we invest in our developments we generate £1.40 in economic benefit to the local economy. Based on this calculation, over the last 10 years we have generated over £1 billion in economic benefit across our operating regions.
Given advice or works to 732 customers to help reduce mould and condensation
Enabled 61%of our solar panel customers to notice a difference in
their outgoing expenses
We continue to be proactive in our approach to stock investment in order to ensure we meet the Fuel Poverty Regulation target for all homes to have an energy performance certificate (EPC) rating of C or above by 2030 – our target is to achieve this by 2025. This approach identifies the additional investment needed to bring properties up to a C rating and whether individual property disposal would be more economical. We are well on the way to achieving the interim target of a minimum of EPC-D by 2020 with the number of EPC-E rated properties reducing this year from 44 to only two.
We have maintained our external accreditation through the ISO 14001 environmental management standard and we are looking to upgrade certification in the coming year with greater focus being placed on broader, lifecycle issues such as procurement of goods and services, management of contractors and reducing customers’ environmental impacts.
REGIONEconomic Benefit Generated
(over 10 year period) £’ millions
Devon and Cornwall £250 Dorset £195 Hampshire £235 Somerset £155 Wiltshire £230 Total invested £1,065
32
33
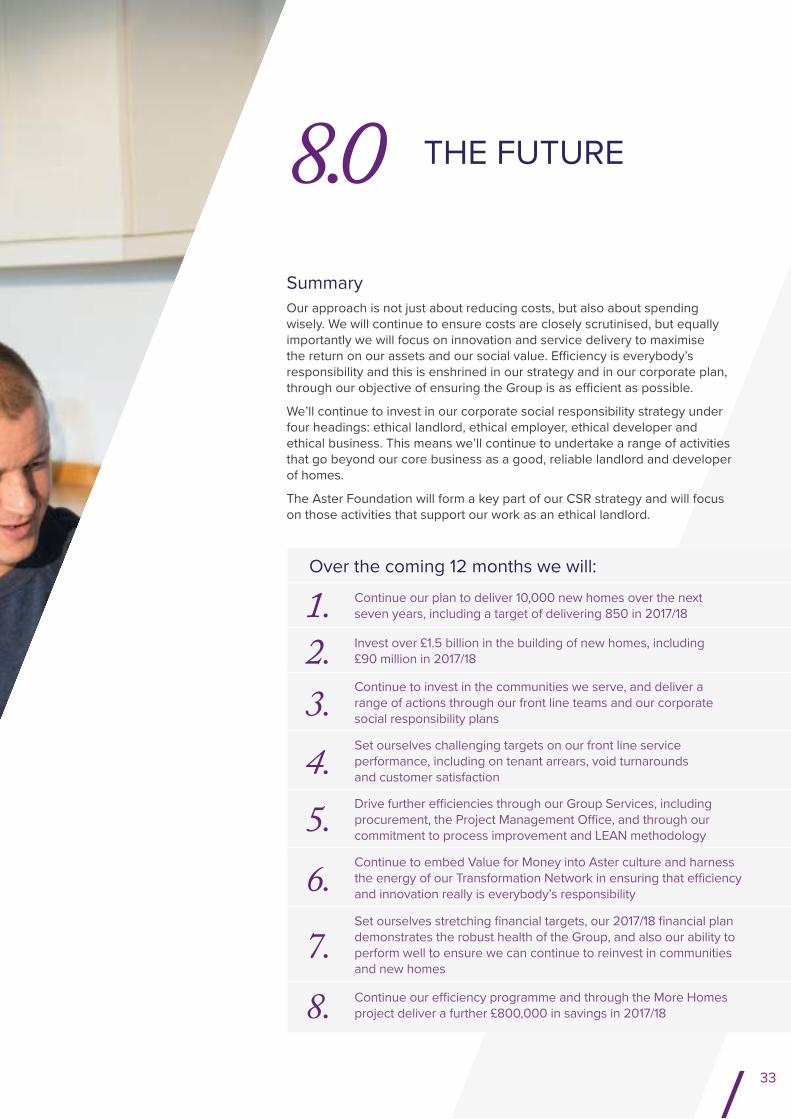
SummaryOur approach is not just about reducing costs, but also about spending wisely. We will continue to ensure costs are closely scrutinised, but equally importantly we will focus on innovation and service delivery to maximise the return on our assets and our social value. Efficiency is everybody’s responsibility and this is enshrined in our strategy and in our corporate plan, through our objective of ensuring the Group is as efficient as possible.
We’ll continue to invest in our corporate social responsibility strategy under four headings: ethical landlord, ethical employer, ethical developer and ethical business. This means we’ll continue to undertake a range of activities that go beyond our core business as a good, reliable landlord and developer of homes.
The Aster Foundation will form a key part of our CSR strategy and will focus on those activities that support our work as an ethical landlord.
8.0 THE FUTURE
1. Continue our plan to deliver 10,000 new homes over the next seven years, including a target of delivering 850 in 2017/18
2. Invest over £1.5 billion in the building of new homes, including £90 million in 2017/18
3. Continue to invest in the communities we serve, and deliver a range of actions through our front line teams and our corporate social responsibility plans
4. Set ourselves challenging targets on our front line service performance, including on tenant arrears, void turnarounds and customer satisfaction
5. Drive further efficiencies through our Group Services, including procurement, the Project Management Office, and through our commitment to process improvement and LEAN methodology
6. Continue to embed Value for Money into Aster culture and harness the energy of our Transformation Network in ensuring that efficiency and innovation really is everybody’s responsibility
7.Set ourselves stretching financial targets, our 2017/18 financial plan demonstrates the robust health of the Group, and also our ability to perform well to ensure we can continue to reinvest in communities and new homes
8. Continue our efficiency programme and through the More Homes project deliver a further £800,000 in savings in 2017/18
Over the coming 12 months we will:

34

35
“ Everyone has a home ”

1706
039
www.aster.co.uk