valuation:*art,*science,* craft*ormagic?* -...
TRANSCRIPT

VALUATION: ART, SCIENCE, CRAFT OR MAGIC? Aswath Damodaran www.damodaran.com
Aswath Damodaran!Website: http://www.damodaran.com !Blog: http://aswathdamodaran.blogspot.com!Twitter: @AswathDamodaran!
2!
Some IniCal Thoughts
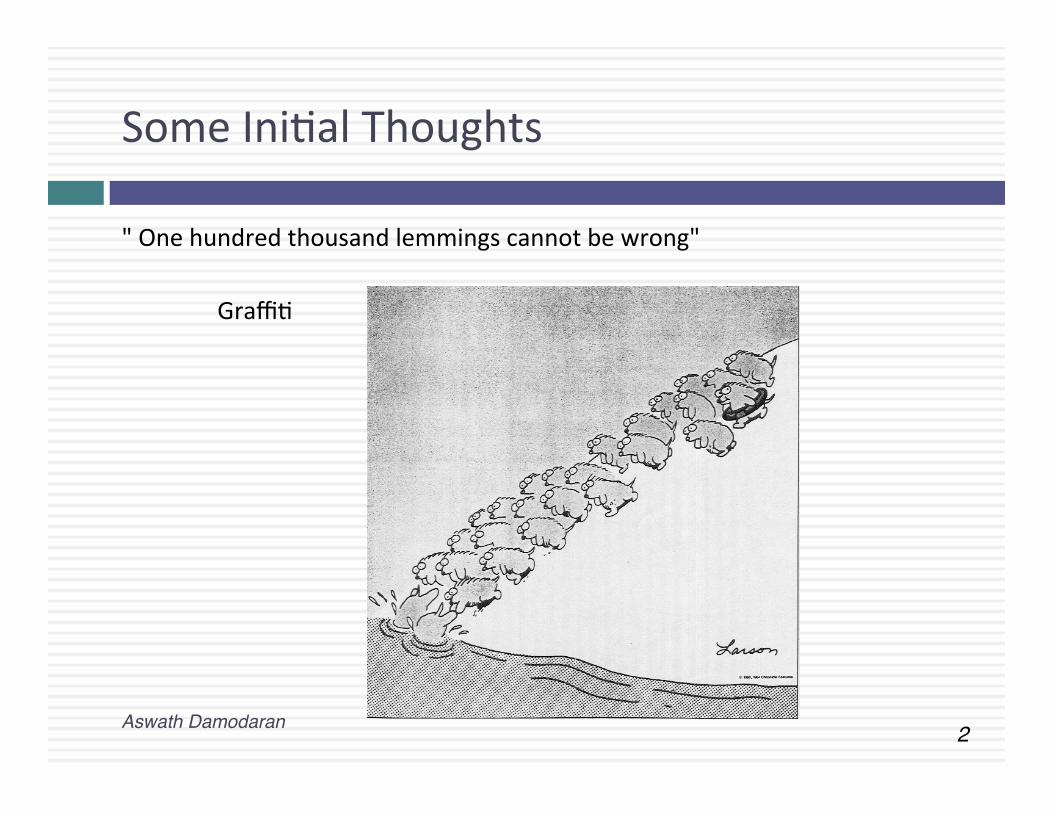
" One hundred thousand lemmings cannot be wrong" GraffiC
Aswath Damodaran!
3!
MisconcepCons about ValuaCon
¨ Myth 1: A valuaCon is an objecCve search for “true” value ¤ Truth 1.1: All valuaCons are biased. The only quesCons are how much and
in which direcCon. ¤ Truth 1.2: The direcCon and magnitude of the bias in your valuaCon is
directly proporConal to who pays you and how much you are paid. ¨ Myth 2.: A good valuaCon provides a precise esCmate of value
¤ Truth 2.1: There are no precise valuaCons ¤ Truth 2.2: The payoff to valuaCon is greatest when valuaCon is least
precise. ¨ Myth 3: . The more quanCtaCve a model, the beTer the valuaCon
¤ Truth 3.1: One’s understanding of a valuaCon model is inversely proporConal to the number of inputs required for the model.
¤ Truth 3.2: Simpler valuaCon models do much beTer than complex ones.
Aswath Damodaran!
4!
Approaches to ValuaCon
¨ Intrinsic valua-on, relates the value of an asset to the present value of expected future cashflows on that asset. In its most common form, this takes the form of a discounted cash flow valuaCon.
¨ Rela-ve valua-on, esCmates the value of an asset by looking at the pricing of 'comparable' assets relaCve to a common variable like earnings, cashflows, book value or sales.
¨ Con-ngent claim valua-on, uses opCon pricing models to measure the value of assets that share opCon characterisCcs.
Aswath Damodaran!
5!
Discounted Cash Flow ValuaCon
¨ What is it: In discounted cash flow valuaCon, the value of an asset is the present value of the expected cash flows on the asset.
¨ Philosophical Basis: Every asset has an intrinsic value that can be esCmated, based upon its characterisCcs in terms of cash flows, growth and risk.
¨ Informa3on Needed: To use discounted cash flow valuaCon, you need ¤ to esCmate the life of the asset ¤ to esCmate the cash flows during the life of the asset ¤ to esCmate the discount rate to apply to these cash flows to get present
value ¨ Market Inefficiency: Markets are assumed to make mistakes in
pricing assets across Cme, and are assumed to correct themselves over Cme, as new informaCon comes out about assets.
Aswath Damodaran!
6!
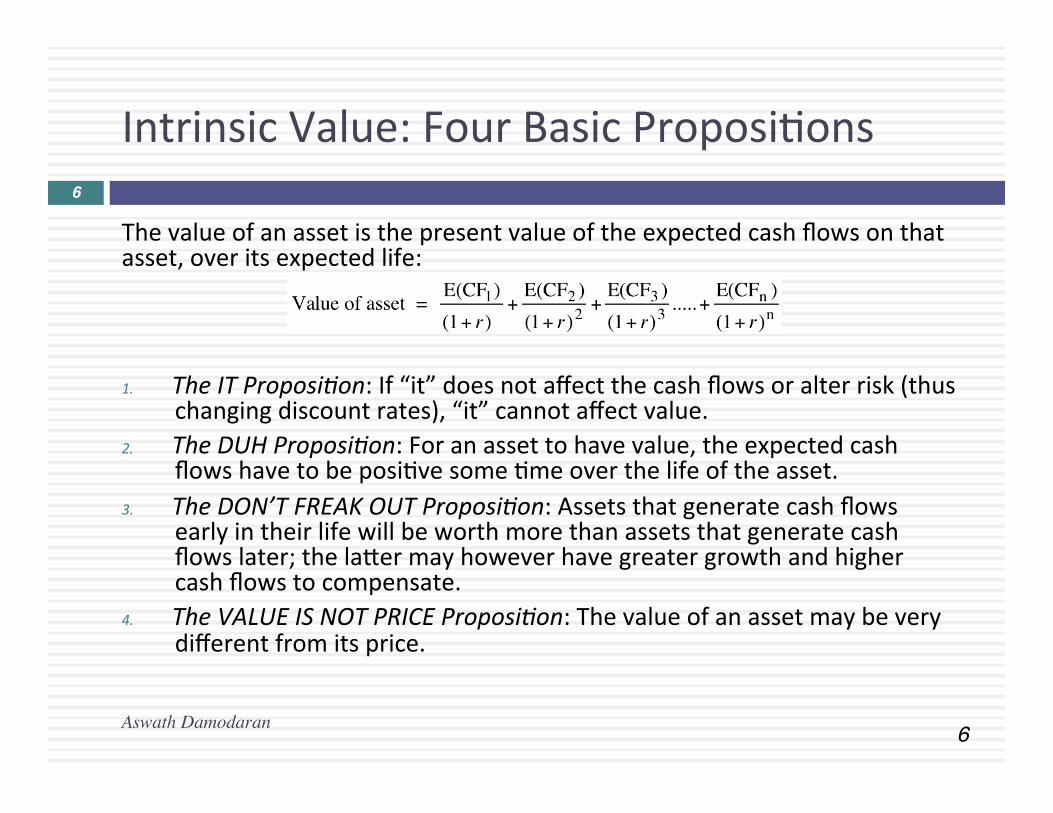
Intrinsic Value: Four Basic ProposiCons
The value of an asset is the present value of the expected cash flows on that asset, over its expected life:
1. The IT Proposi3on: If “it” does not affect the cash flows or alter risk (thus
changing discount rates), “it” cannot affect value. 2. The DUH Proposi3on: For an asset to have value, the expected cash
flows have to be posiCve some Cme over the life of the asset. 3. The DON’T FREAK OUT Proposi3on: Assets that generate cash flows
early in their life will be worth more than assets that generate cash flows later; the laTer may however have greater growth and higher cash flows to compensate.
4. The VALUE IS NOT PRICE Proposi3on: The value of an asset may be very different from its price.
Aswath Damodaran
6!
7!
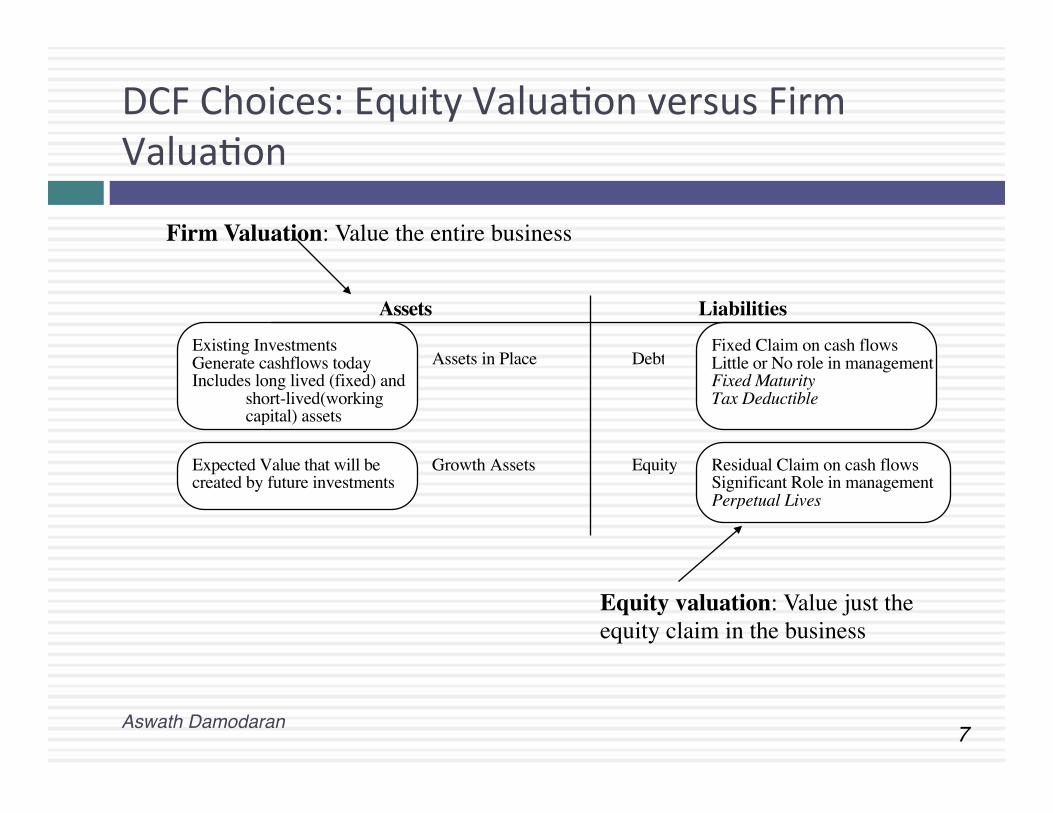
DCF Choices: Equity ValuaCon versus Firm ValuaCon
Assets Liabilities
Assets in Place Debt
Equity
Fixed Claim on cash flowsLittle or No role in managementFixed MaturityTax Deductible
Residual Claim on cash flowsSignificant Role in managementPerpetual Lives
Growth Assets
Existing InvestmentsGenerate cashflows todayIncludes long lived (fixed) and
short-lived(working capital) assets
Expected Value that will be created by future investments
Equity valuation: Value just the equity claim in the business
Firm Valuation: Value the entire business
Aswath Damodaran!
8!
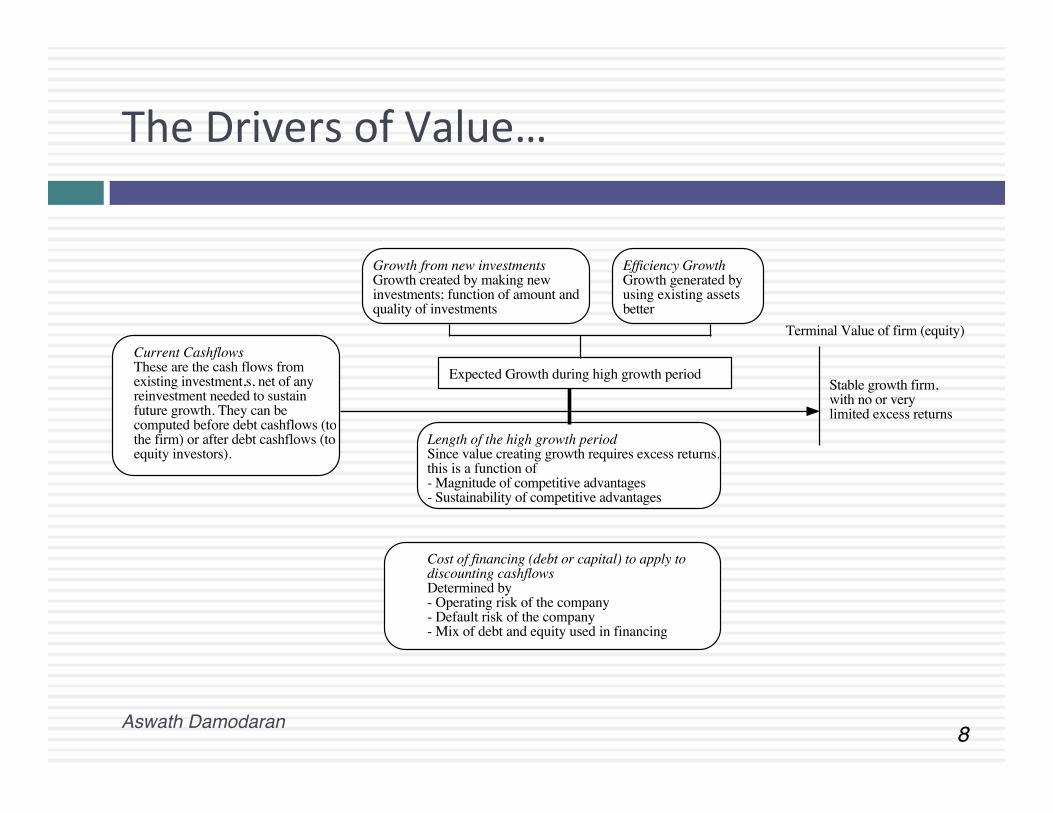
The Drivers of Value…
Current CashflowsThese are the cash flows from existing investment,s, net of any reinvestment needed to sustain future growth. They can be computed before debt cashflows (to the firm) or after debt cashflows (to equity investors).
Expected Growth during high growth period
Growth from new investmentsGrowth created by making new investments; function of amount and quality of investments
Efficiency GrowthGrowth generated by using existing assets better
Length of the high growth periodSince value creating growth requires excess returns, this is a function of- Magnitude of competitive advantages- Sustainability of competitive advantages
Stable growth firm, with no or very limited excess returns
Cost of financing (debt or capital) to apply to discounting cashflowsDetermined by- Operating risk of the company- Default risk of the company- Mix of debt and equity used in financing
Terminal Value of firm (equity)
Aswath Damodaran!
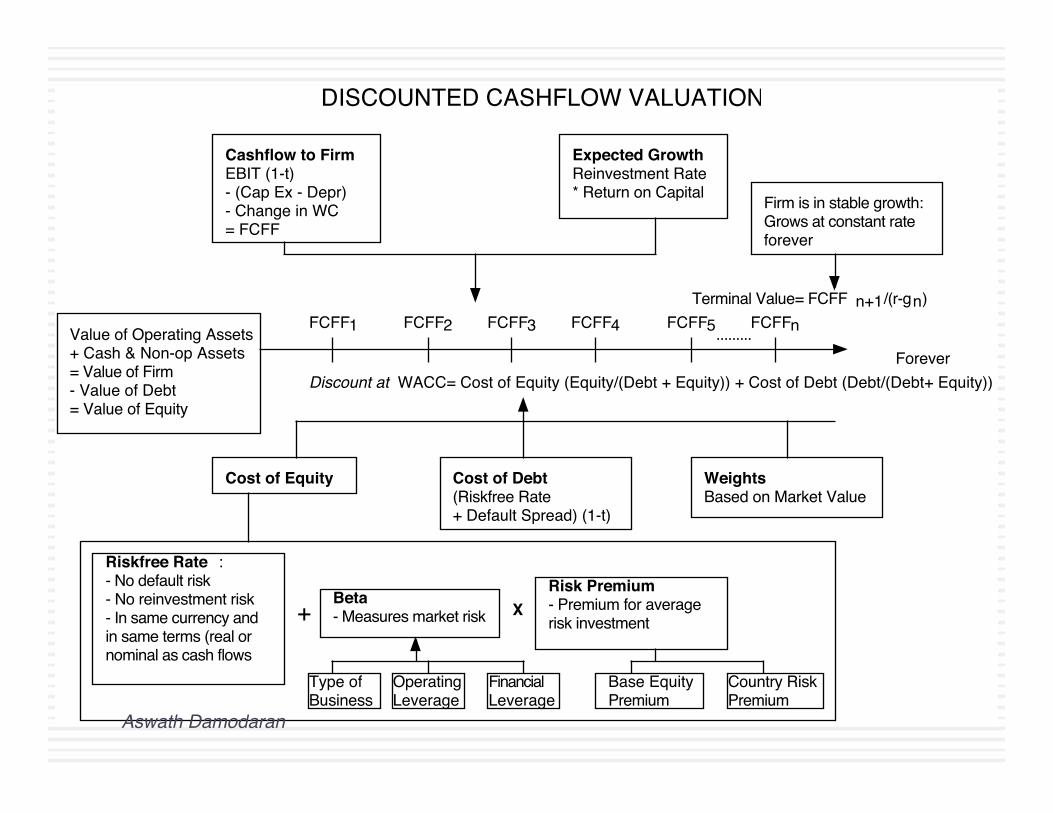
Cashflow to FirmEBIT (1-t)- (Cap Ex - Depr)- Change in WC= FCFF
Expected GrowthReinvestment Rate* Return on Capital
FCFF1 FCFF2 FCFF3 FCFF4 FCFF5
Forever
Firm is in stable growth:Grows at constant rateforever
Terminal Value= FCFF n+1/(r-gn)FCFFn.........
Cost of Equity Cost of Debt(Riskfree Rate+ Default Spread) (1-t)
WeightsBased on Market Value
Discount at WACC= Cost of Equity (Equity/(Debt + Equity)) + Cost of Debt (Debt/(Debt+ Equity))
Value of Operating Assets+ Cash & Non-op Assets= Value of Firm- Value of Debt= Value of Equity
Riskfree Rate :- No default risk- No reinvestment risk- In same currency andin same terms (real or nominal as cash flows
+ Beta- Measures market risk X
Risk Premium- Premium for averagerisk investment
Type of Business
Operating Leverage
FinancialLeverage
Base EquityPremium
Country RiskPremium
DISCOUNTED CASHFLOW VALUATION
Aswath Damodaran!
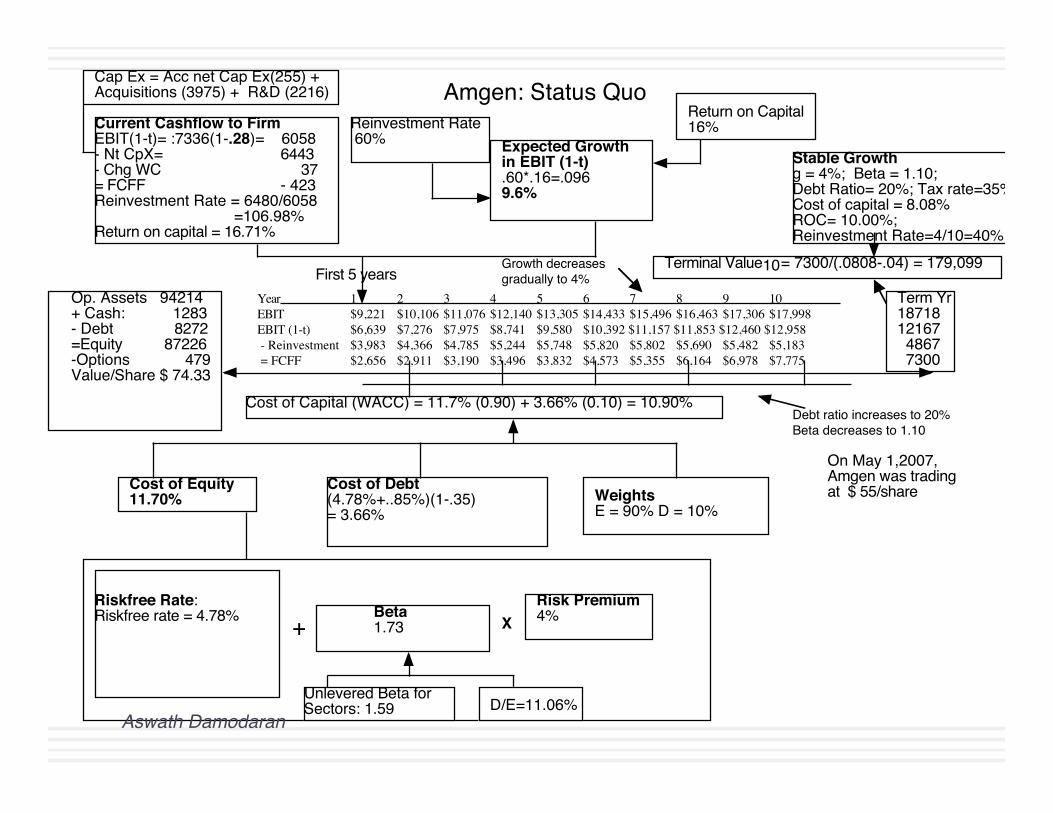
Current Cashflow to FirmEBIT(1-t)= :7336(1-.28)= 6058- Nt CpX= 6443 - Chg WC 37= FCFF - 423Reinvestment Rate = 6480/6058
=106.98%Return on capital = 16.71%
Expected Growth in EBIT (1-t).60*.16=.0969.6%
Stable Growthg = 4%; Beta = 1.10;Debt Ratio= 20%; Tax rate=35%Cost of capital = 8.08% ROC= 10.00%; Reinvestment Rate=4/10=40%
Terminal Value10= 7300/(.0808-.04) = 179,099
Cost of Equity11.70%
Cost of Debt(4.78%+..85%)(1-.35)= 3.66%
WeightsE = 90% D = 10%
Cost of Capital (WACC) = 11.7% (0.90) + 3.66% (0.10) = 10.90%
Op. Assets 94214+ Cash: 1283- Debt 8272=Equity 87226-Options 479Value/Share $ 74.33
Riskfree Rate:Riskfree rate = 4.78% +
Beta 1.73 X
Risk Premium4%
Unlevered Beta for Sectors: 1.59
Amgen: Status Quo Reinvestment Rate 60%
Return on Capital16%
Term Yr1871812167 4867 7300
On May 1,2007, Amgen was trading at $ 55/share
First 5 yearsGrowth decreases gradually to 4%
Debt ratio increases to 20%Beta decreases to 1.10
D/E=11.06%
Cap Ex = Acc net Cap Ex(255) + Acquisitions (3975) + R&D (2216)
Year 1 2 3 4 5 6 7 8 9 10EBIT $9,221 $10,106 $11,076 $12,140 $13,305 $14,433 $15,496 $16,463 $17,306 $17,998EBIT (1-t) $6,639 $7,276 $7,975 $8,741 $9,580 $10,392 $11,157 $11,853 $12,460 $12,958 - Reinvestment $3,983 $4,366 $4,785 $5,244 $5,748 $5,820 $5,802 $5,690 $5,482 $5,183 = FCFF $2,656 $2,911 $3,190 $3,496 $3,832 $4,573 $5,355 $6,164 $6,978 $7,775
Aswath Damodaran!
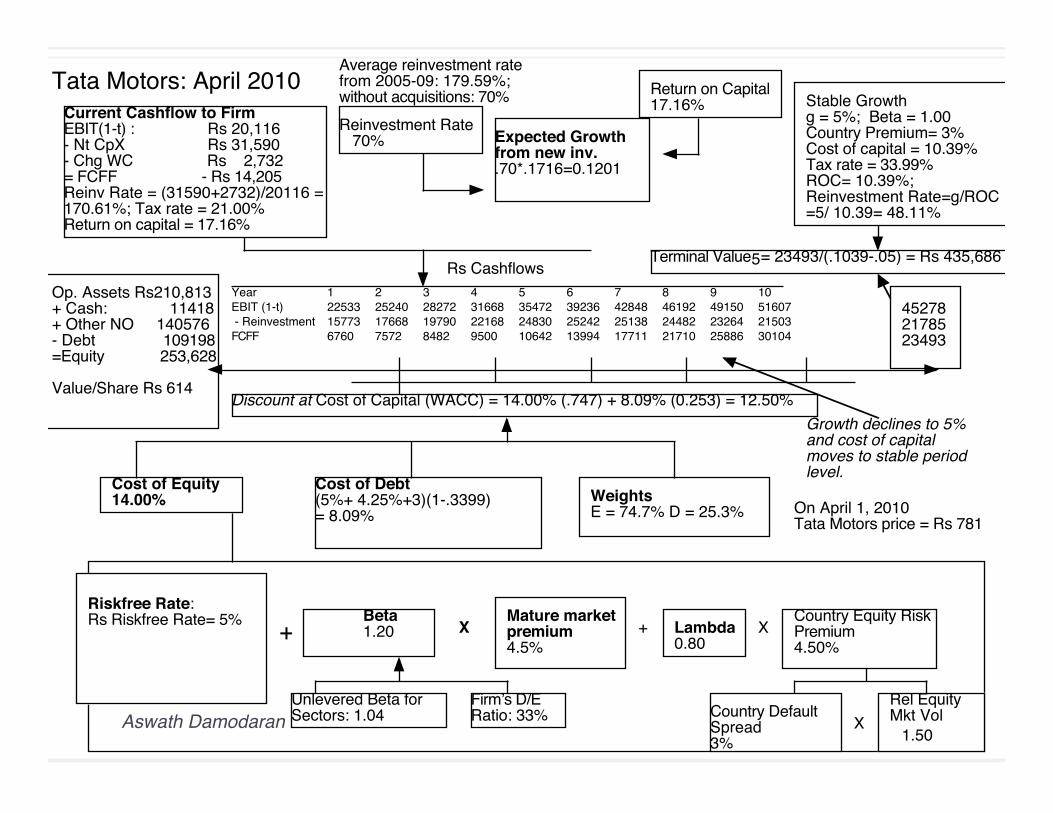
Current Cashflow to FirmEBIT(1-t) : Rs 20,116- Nt CpX Rs 31,590 - Chg WC Rs 2,732= FCFF - Rs 14,205Reinv Rate = (31590+2732)/20116 = 170.61%; Tax rate = 21.00%Return on capital = 17.16%
Expected Growth from new inv..70*.1716=0.1201
Stable Growthg = 5%; Beta = 1.00Country Premium= 3%Cost of capital = 10.39%Tax rate = 33.99% ROC= 10.39%; Reinvestment Rate=g/ROC =5/ 10.39= 48.11%
Terminal Value5= 23493/(.1039-.05) = Rs 435,686
Cost of Equity14.00%
Cost of Debt(5%+ 4.25%+3)(1-.3399)= 8.09%
WeightsE = 74.7% D = 25.3%
Discount at Cost of Capital (WACC) = 14.00% (.747) + 8.09% (0.253) = 12.50%
Op. Assets Rs210,813+ Cash: 11418+ Other NO 140576- Debt 109198=Equity 253,628
Value/Share Rs 614
Riskfree Rate:Rs Riskfree Rate= 5% +
Beta 1.20 X
Mature market premium 4.5%
Unlevered Beta for Sectors: 1.04
Firmʼs D/ERatio: 33%
Tata Motors: April 2010 Reinvestment Rate 70%
Return on Capital17.16%
452782178523493
+ Lambda0.80
XCountry Equity RiskPremium4.50%
Country Default Spread3%
XRel Equity Mkt Vol
1.50
On April 1, 2010Tata Motors price = Rs 781
Rs Cashflows
Average reinvestment rate from 2005-09: 179.59%; without acquisitions: 70%
Growth declines to 5% and cost of capital moves to stable period level.
Year 1 2 3 4 5 6 7 8 9 10EBIT (1-t) 22533 25240 28272 31668 35472 39236 42848 46192 49150 51607 - Reinvestment 15773 17668 19790 22168 24830 25242 25138 24482 23264 21503FCFF 6760 7572 8482 9500 10642 13994 17711 21710 25886 30104
Aswath Damodaran!
DCF INPUTS
“Garbage in, garbage out”
Aswath Damodaran!
13!
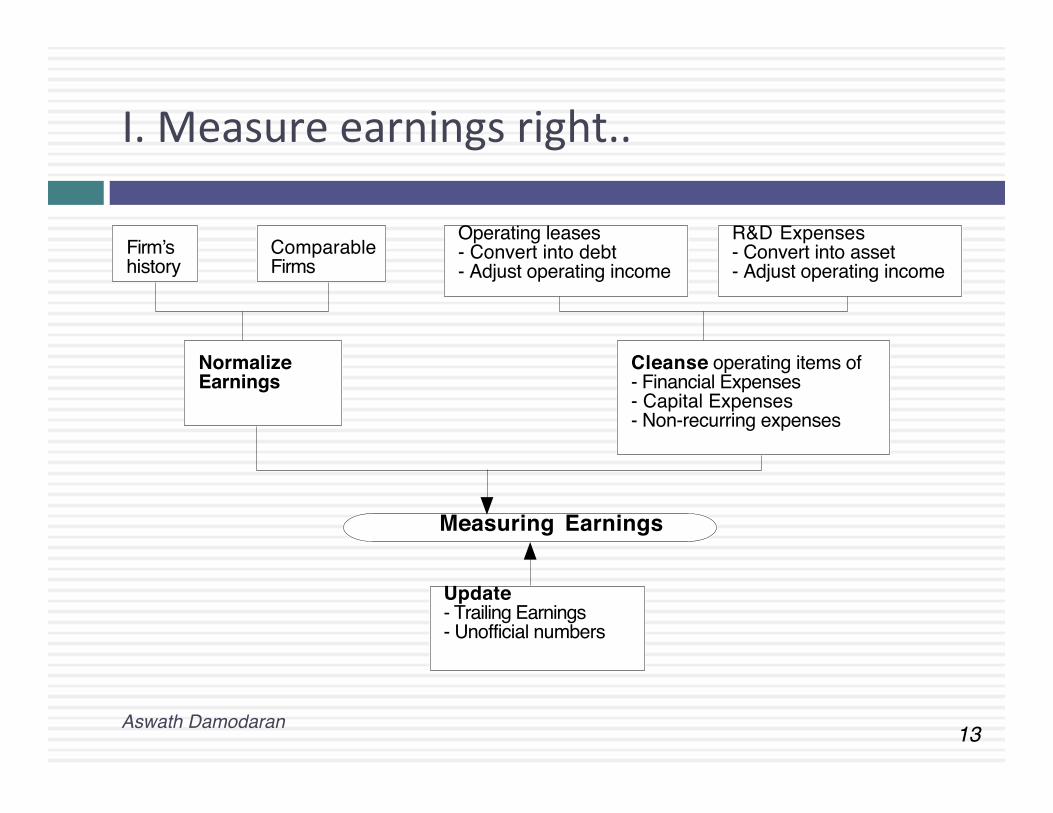
I. Measure earnings right..
Update- Trailing Earnings- Unofficial numbers
Normalize Earnings
Cleanse operating items of- Financial Expenses- Capital Expenses- Non-recurring expenses
Operating leases- Convert into debt- Adjust operating income
R&D Expenses- Convert into asset- Adjust operating income
Measuring Earnings
Firmʼs history
Comparable Firms
Aswath Damodaran!
14!
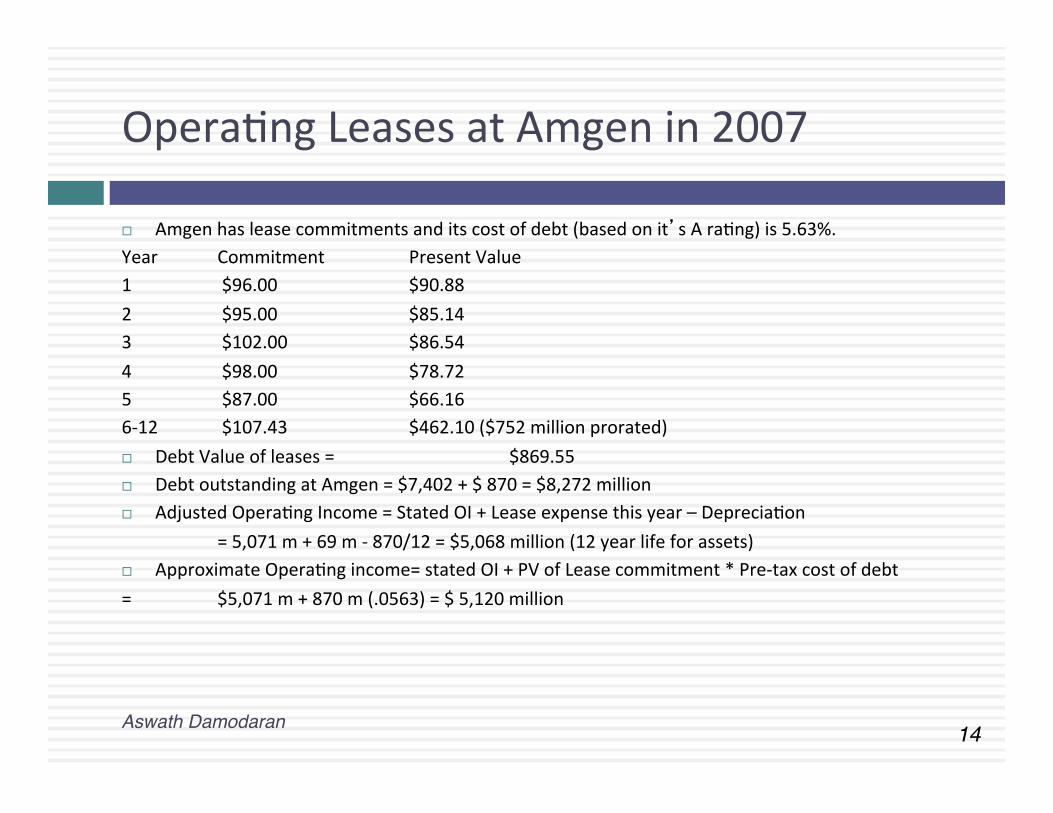
OperaCng Leases at Amgen in 2007
¨ Amgen has lease commitments and its cost of debt (based on it’s A raCng) is 5.63%. Year Commitment Present Value 1 $96.00 $90.88 2 $95.00 $85.14 3 $102.00 $86.54 4 $98.00 $78.72 5 $87.00 $66.16 6-‐12 $107.43 $462.10 ($752 million prorated) ¨ Debt Value of leases = $869.55 ¨ Debt outstanding at Amgen = $7,402 + $ 870 = $8,272 million ¨ Adjusted OperaCng Income = Stated OI + Lease expense this year – DepreciaCon
= 5,071 m + 69 m -‐ 870/12 = $5,068 million (12 year life for assets) ¨ Approximate OperaCng income= stated OI + PV of Lease commitment * Pre-‐tax cost of debt = $5,071 m + 870 m (.0563) = $ 5,120 million
Aswath Damodaran!
15!
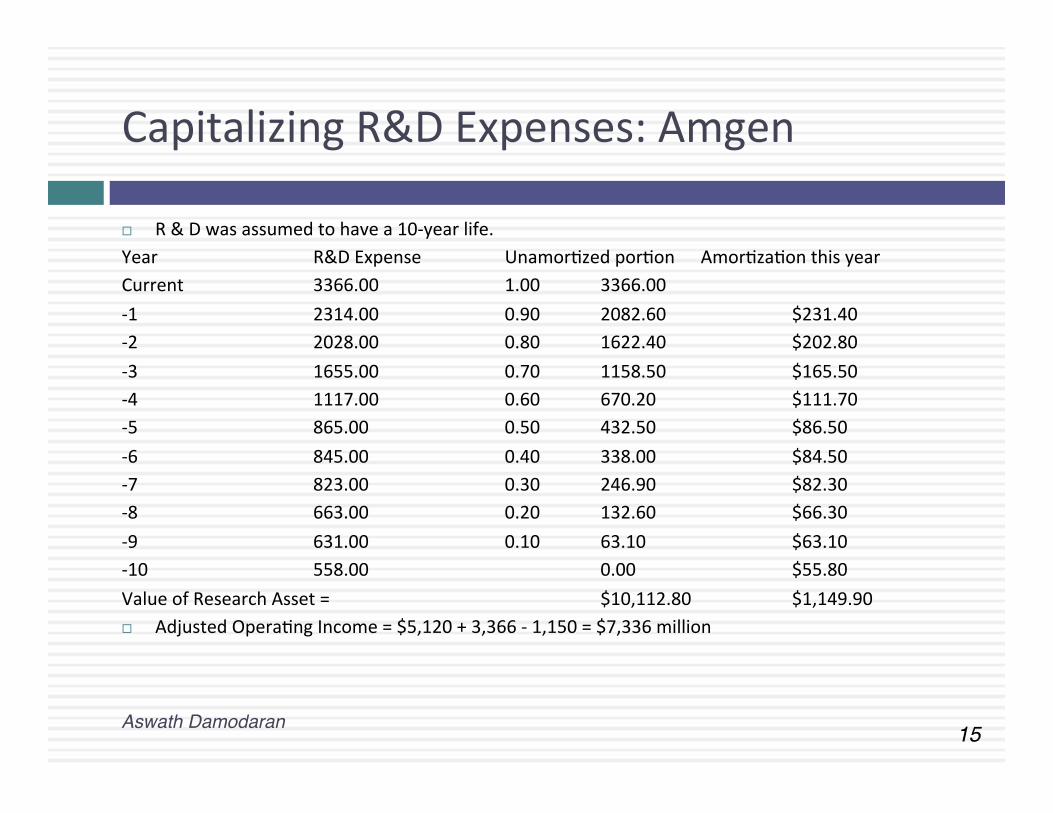
Capitalizing R&D Expenses: Amgen
¨ R & D was assumed to have a 10-‐year life. Year R&D Expense UnamorCzed porCon AmorCzaCon this year Current 3366.00 1.00 3366.00 -‐1 2314.00 0.90 2082.60 $231.40 -‐2 2028.00 0.80 1622.40 $202.80 -‐3 1655.00 0.70 1158.50 $165.50 -‐4 1117.00 0.60 670.20 $111.70 -‐5 865.00 0.50 432.50 $86.50 -‐6 845.00 0.40 338.00 $84.50 -‐7 823.00 0.30 246.90 $82.30 -‐8 663.00 0.20 132.60 $66.30 -‐9 631.00 0.10 63.10 $63.10 -‐10 558.00 0.00 $55.80 Value of Research Asset = $10,112.80 $1,149.90 ¨ Adjusted OperaCng Income = $5,120 + 3,366 -‐ 1,150 = $7,336 million
Aswath Damodaran!
16!
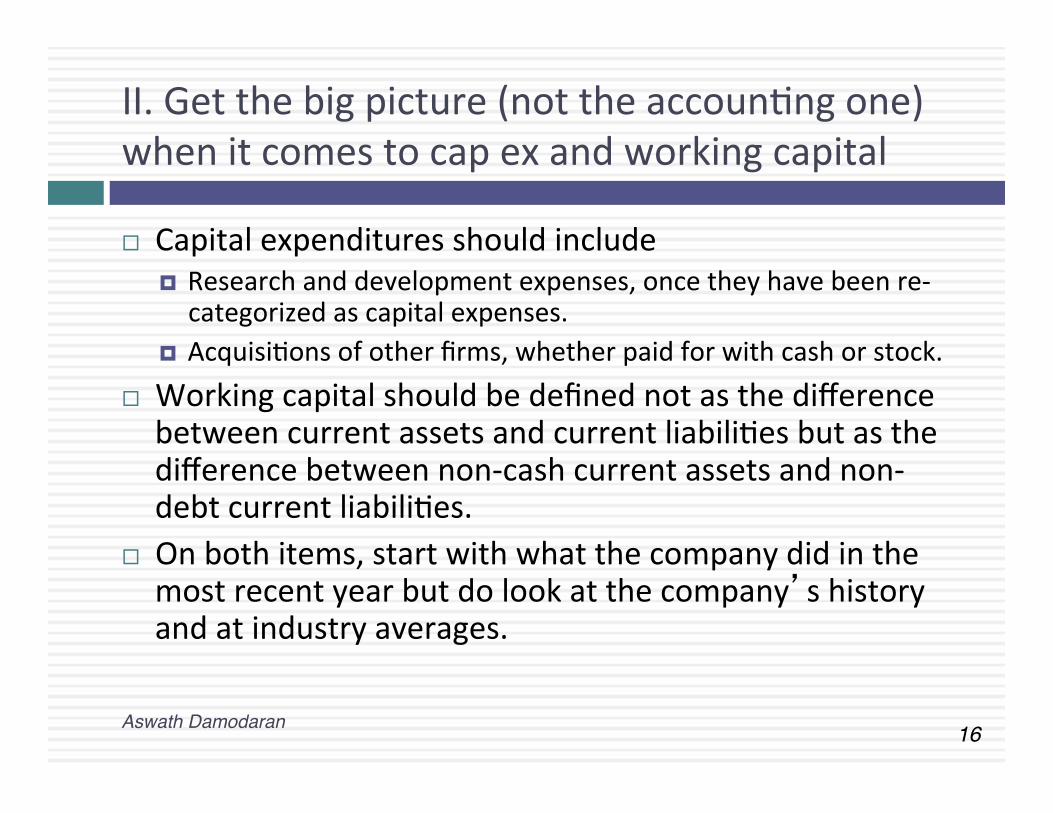
II. Get the big picture (not the accounCng one) when it comes to cap ex and working capital
¨ Capital expenditures should include ¤ Research and development expenses, once they have been re-‐categorized as capital expenses.
¤ AcquisiCons of other firms, whether paid for with cash or stock. ¨ Working capital should be defined not as the difference between current assets and current liabiliCes but as the difference between non-‐cash current assets and non-‐debt current liabiliCes.
¨ On both items, start with what the company did in the most recent year but do look at the company’s history and at industry averages.
Aswath Damodaran!
17!
Amgen’s Net Capital Expenditures
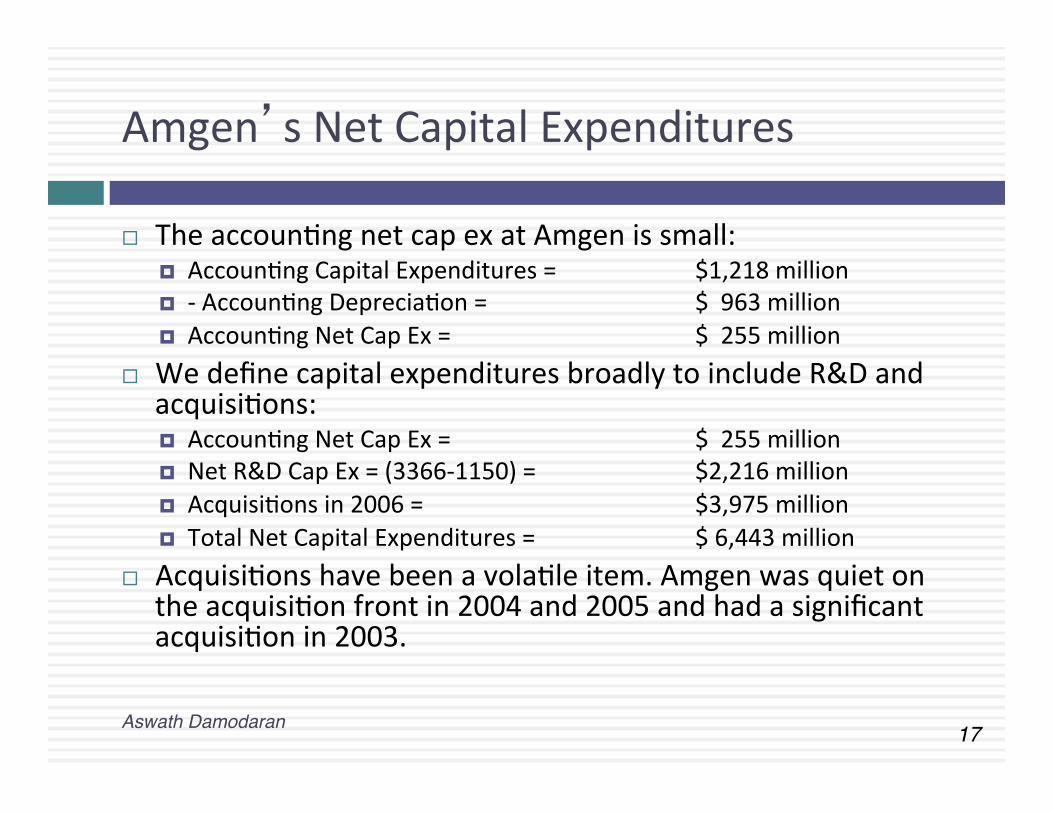
¨ The accounCng net cap ex at Amgen is small: ¤ AccounCng Capital Expenditures = $1,218 million ¤ -‐ AccounCng DepreciaCon = $ 963 million ¤ AccounCng Net Cap Ex = $ 255 million
¨ We define capital expenditures broadly to include R&D and acquisiCons: ¤ AccounCng Net Cap Ex = $ 255 million ¤ Net R&D Cap Ex = (3366-‐1150) = $2,216 million ¤ AcquisiCons in 2006 = $3,975 million ¤ Total Net Capital Expenditures = $ 6,443 million
¨ AcquisiCons have been a volaCle item. Amgen was quiet on the acquisiCon front in 2004 and 2005 and had a significant acquisiCon in 2003.
Aswath Damodaran!
18!
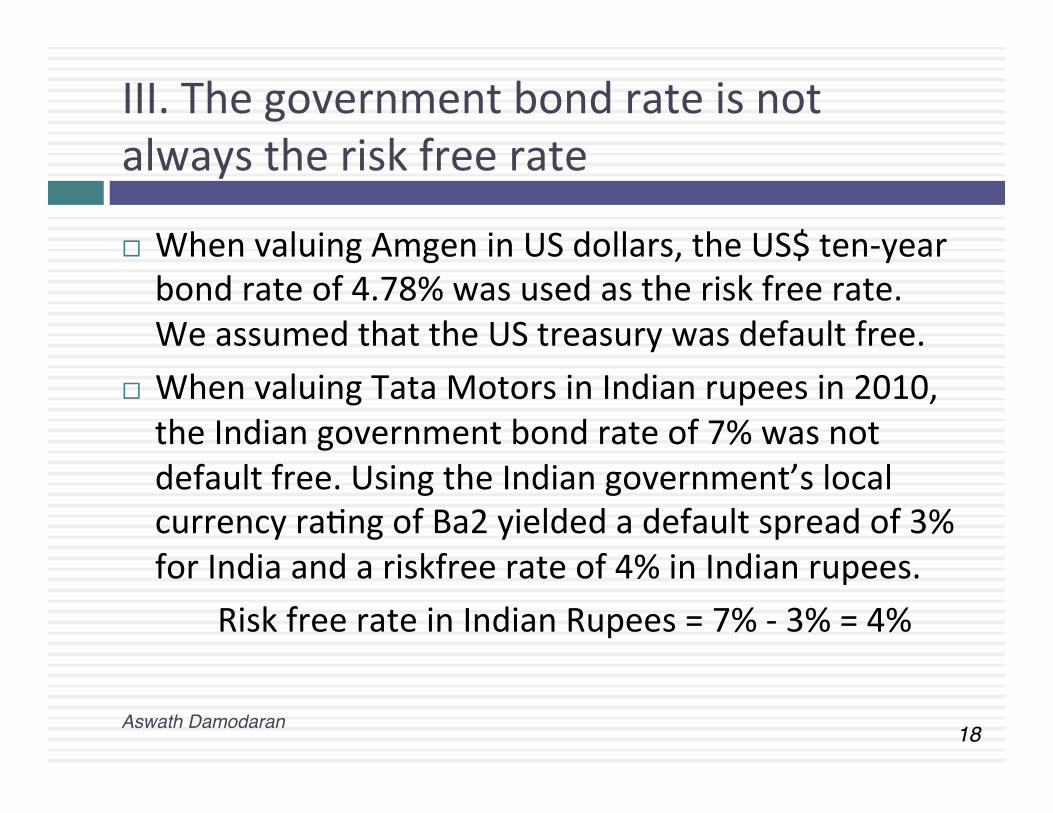
III. The government bond rate is not always the risk free rate
¨ When valuing Amgen in US dollars, the US$ ten-‐year bond rate of 4.78% was used as the risk free rate. We assumed that the US treasury was default free.
¨ When valuing Tata Motors in Indian rupees in 2010, the Indian government bond rate of 7% was not default free. Using the Indian government’s local currency raCng of Ba2 yielded a default spread of 3% for India and a riskfree rate of 4% in Indian rupees.
Risk free rate in Indian Rupees = 7% -‐ 3% = 4%
Aswath Damodaran!
19!
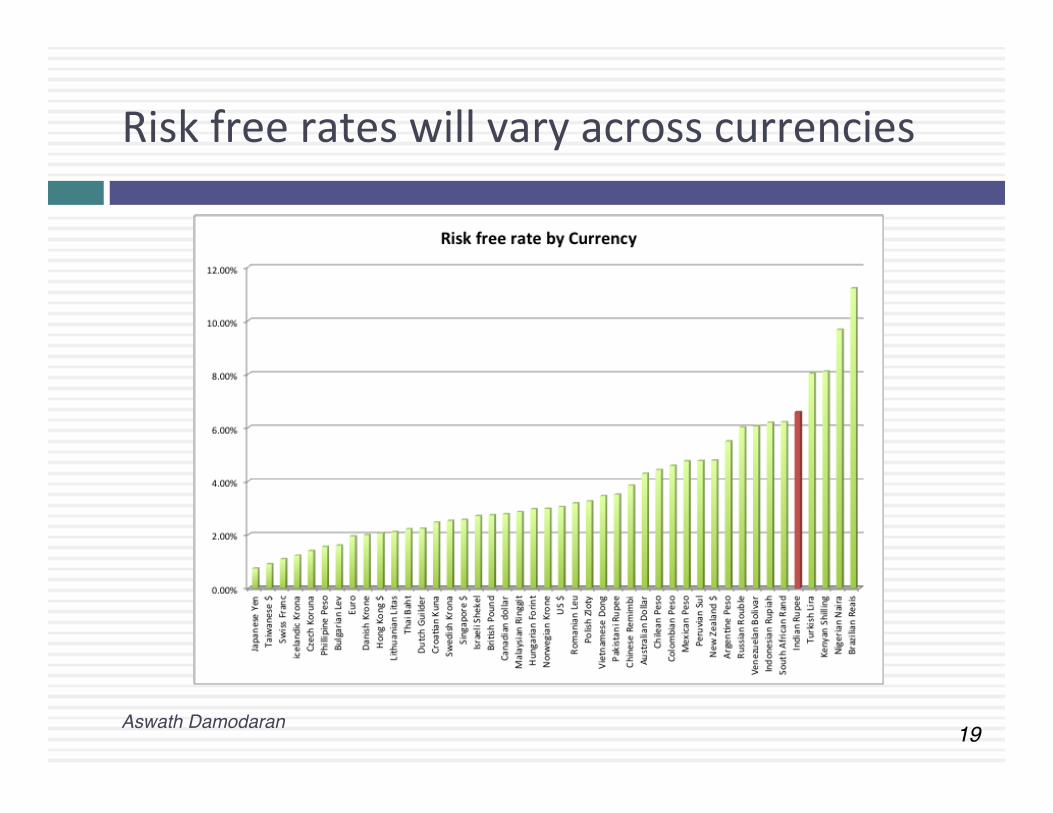
Risk free rates will vary across currencies
Aswath Damodaran!
20!
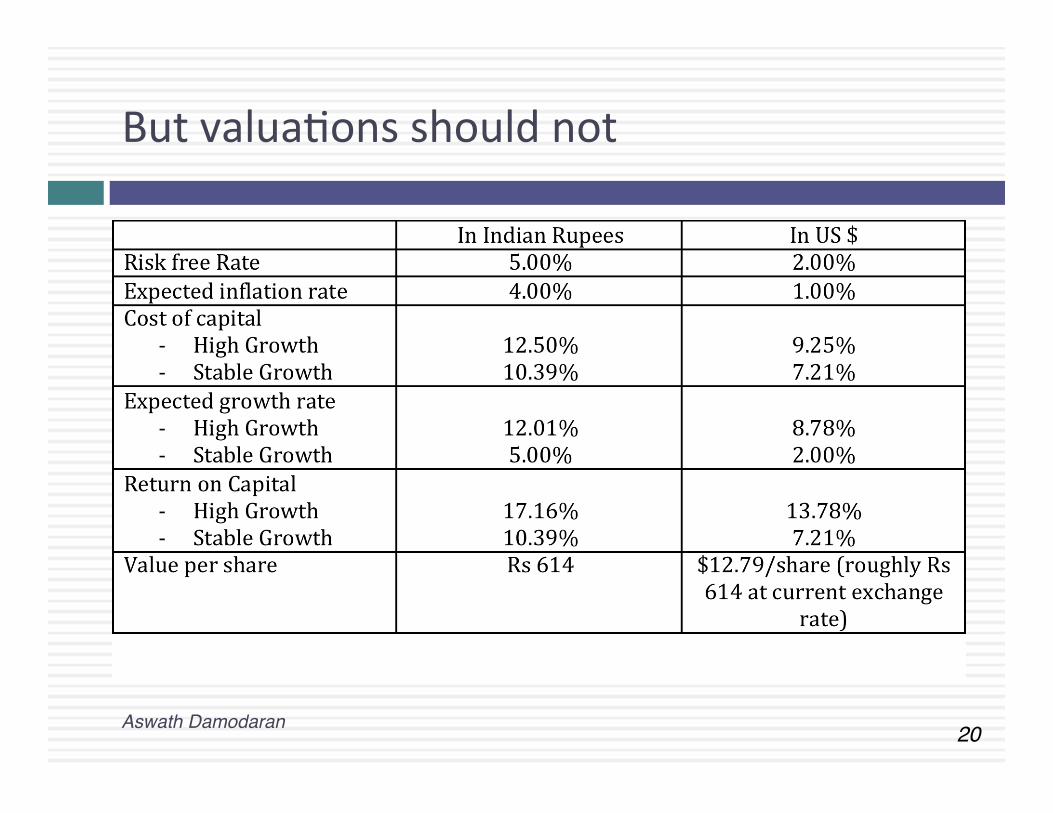
But valuaCons should not
Aswath Damodaran!
21!
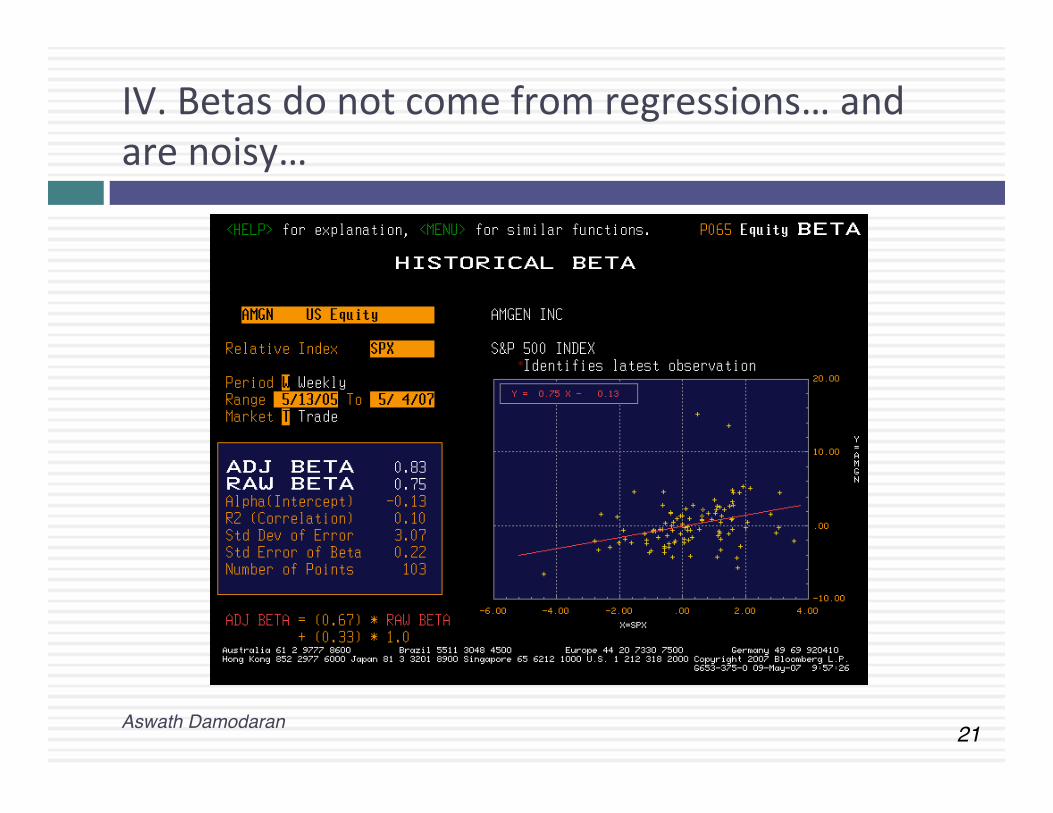
IV. Betas do not come from regressions… and are noisy…
Aswath Damodaran!
22!
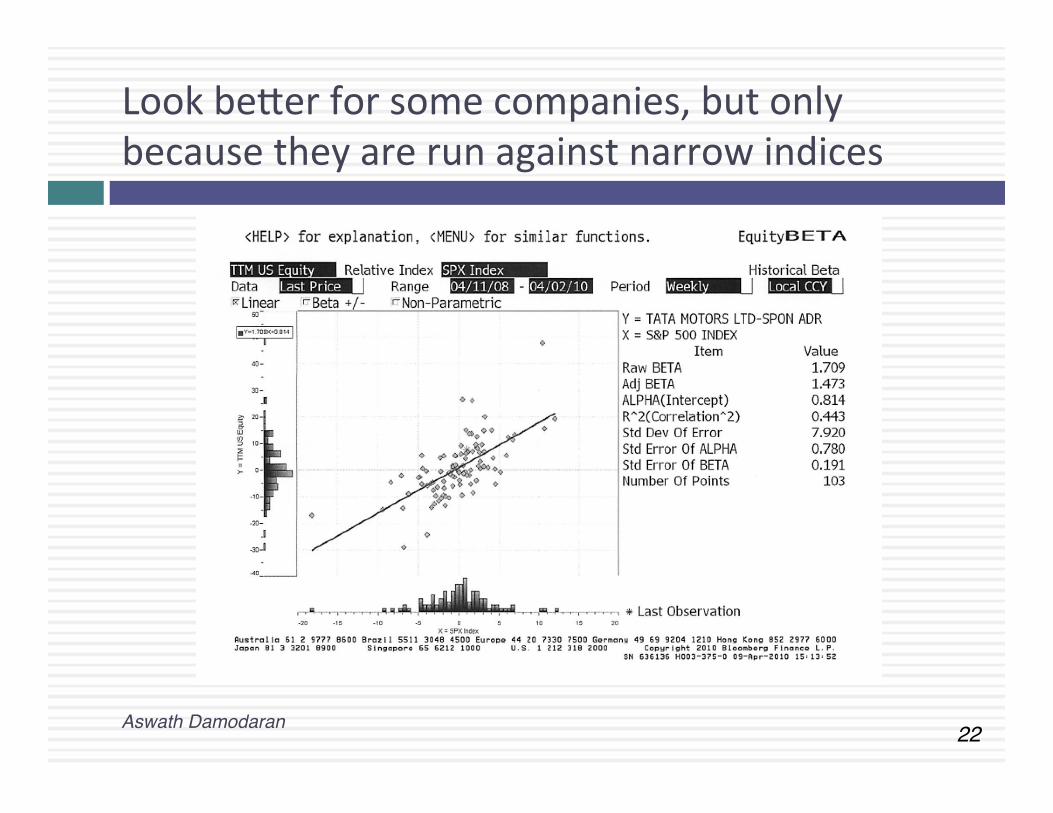
Look beTer for some companies, but only because they are run against narrow indices
Aswath Damodaran!
23!
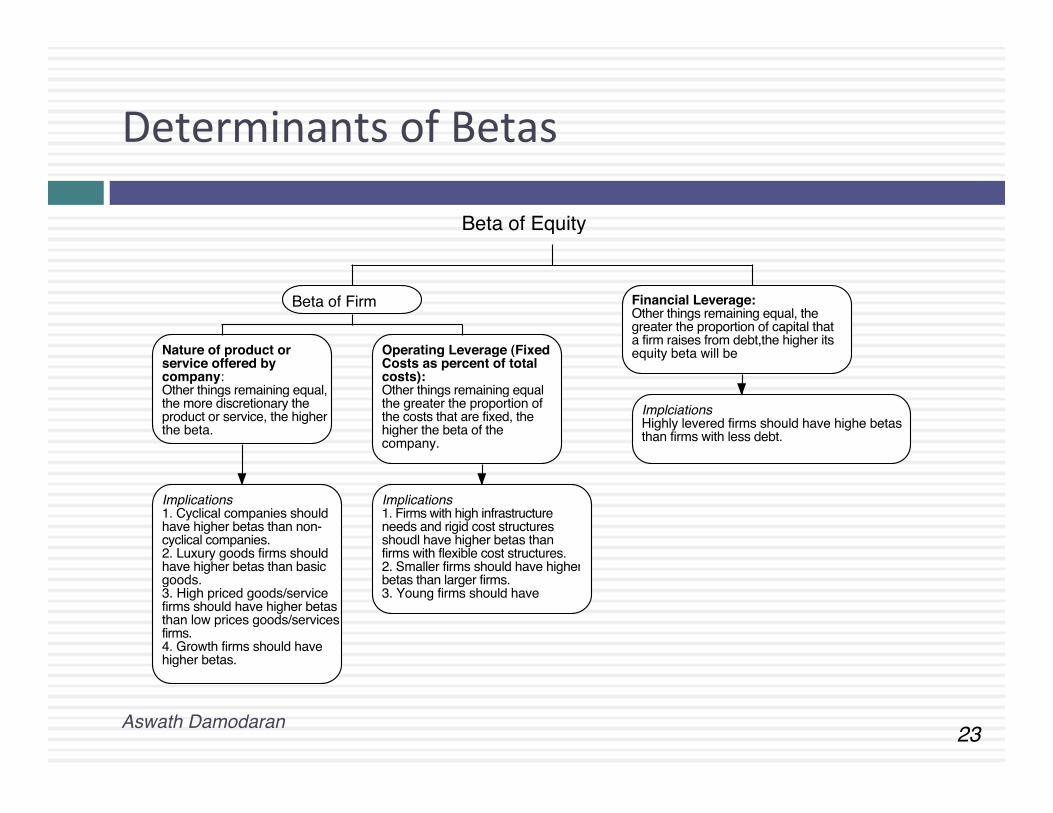
Determinants of Betas
Beta of Firm
Beta of Equity
Nature of product or service offered by company:Other things remaining equal, the more discretionary the product or service, the higher the beta.
Operating Leverage (Fixed Costs as percent of total costs):Other things remaining equal the greater the proportion of the costs that are fixed, the higher the beta of the company.
Financial Leverage:Other things remaining equal, the greater the proportion of capital that a firm raises from debt,the higher its equity beta will be
Implications1. Cyclical companies should have higher betas than non-cyclical companies.2. Luxury goods firms should have higher betas than basic goods.3. High priced goods/service firms should have higher betas than low prices goods/services firms.4. Growth firms should have higher betas.
Implications1. Firms with high infrastructure needs and rigid cost structures shoudl have higher betas than firms with flexible cost structures.2. Smaller firms should have higher betas than larger firms.3. Young firms should have
ImplciationsHighly levered firms should have highe betas than firms with less debt.
Aswath Damodaran!
24!
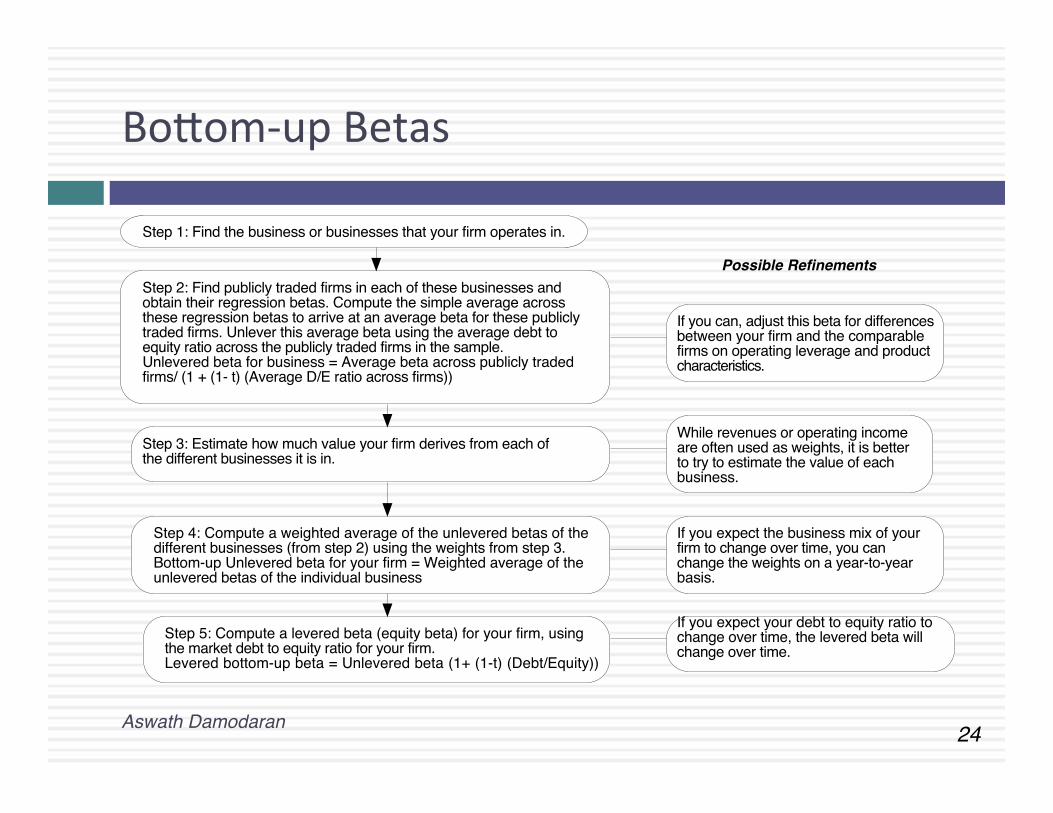
BoTom-‐up Betas
Step 1: Find the business or businesses that your firm operates in.
Step 2: Find publicly traded firms in each of these businesses and obtain their regression betas. Compute the simple average across these regression betas to arrive at an average beta for these publicly traded firms. Unlever this average beta using the average debt to equity ratio across the publicly traded firms in the sample.Unlevered beta for business = Average beta across publicly traded firms/ (1 + (1- t) (Average D/E ratio across firms))
If you can, adjust this beta for differencesbetween your firm and the comparablefirms on operating leverage and product characteristics.
Step 3: Estimate how much value your firm derives from each of the different businesses it is in.
While revenues or operating income are often used as weights, it is better to try to estimate the value of each business.
Step 4: Compute a weighted average of the unlevered betas of the different businesses (from step 2) using the weights from step 3.Bottom-up Unlevered beta for your firm = Weighted average of the unlevered betas of the individual business
Step 5: Compute a levered beta (equity beta) for your firm, using the market debt to equity ratio for your firm. Levered bottom-up beta = Unlevered beta (1+ (1-t) (Debt/Equity))
If you expect the business mix of your firm to change over time, you can change the weights on a year-to-year basis.
If you expect your debt to equity ratio to change over time, the levered beta will change over time.
Possible Refinements
Aswath Damodaran!
25!
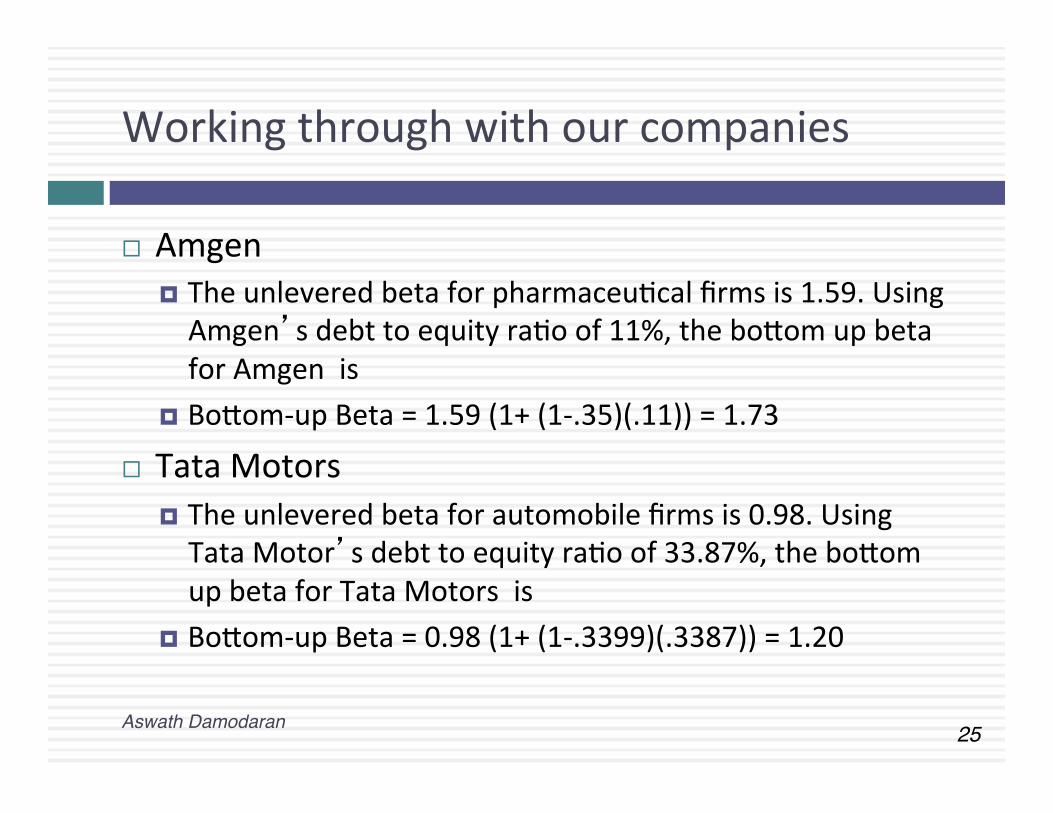
Working through with our companies
¨ Amgen ¤ The unlevered beta for pharmaceuCcal firms is 1.59. Using Amgen’s debt to equity raCo of 11%, the boTom up beta for Amgen is
¤ BoTom-‐up Beta = 1.59 (1+ (1-‐.35)(.11)) = 1.73
¨ Tata Motors ¤ The unlevered beta for automobile firms is 0.98. Using Tata Motor’s debt to equity raCo of 33.87%, the boTom up beta for Tata Motors is
¤ BoTom-‐up Beta = 0.98 (1+ (1-‐.3399)(.3387)) = 1.20
Aswath Damodaran!
26!
V. And the past is not always a good indicator of the future
Aswath Damodaran!
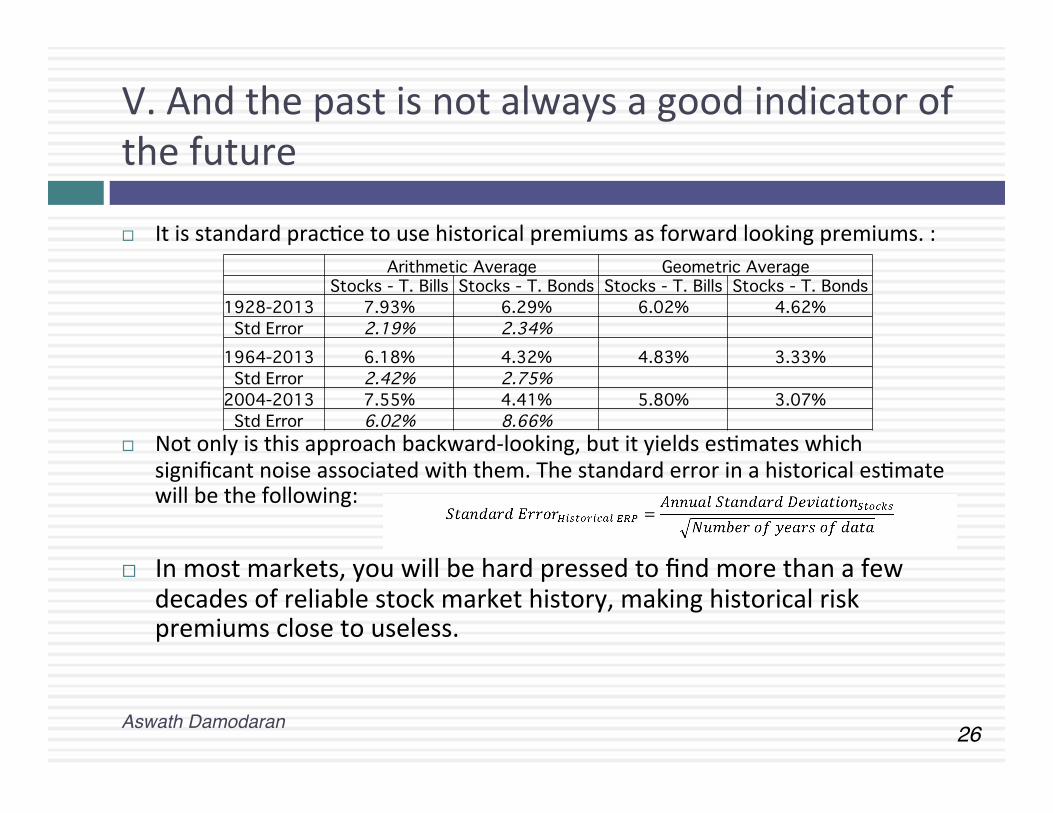
¨ It is standard pracCce to use historical premiums as forward looking premiums. :
¨ Not only is this approach backward-‐looking, but it yields esCmates which
significant noise associated with them. The standard error in a historical esCmate will be the following:
¨ In most markets, you will be hard pressed to find more than a few decades of reliable stock market history, making historical risk premiums close to useless.
" Arithmetic Average" Geometric Average" " Stocks - T. Bills" Stocks - T. Bonds" Stocks - T. Bills" Stocks - T. Bonds"1928-2013" 7.93%" 6.29%" 6.02%" 4.62%" Std Error" 2.19%! 2.34%! " "1964-2013" 6.18%" 4.32%" 4.83%" 3.33%" Std Error" 2.42%! 2.75%! " "2004-2013" 7.55%" 4.41%" 5.80%" 3.07%" Std Error" 6.02%! 8.66%! " "
27!
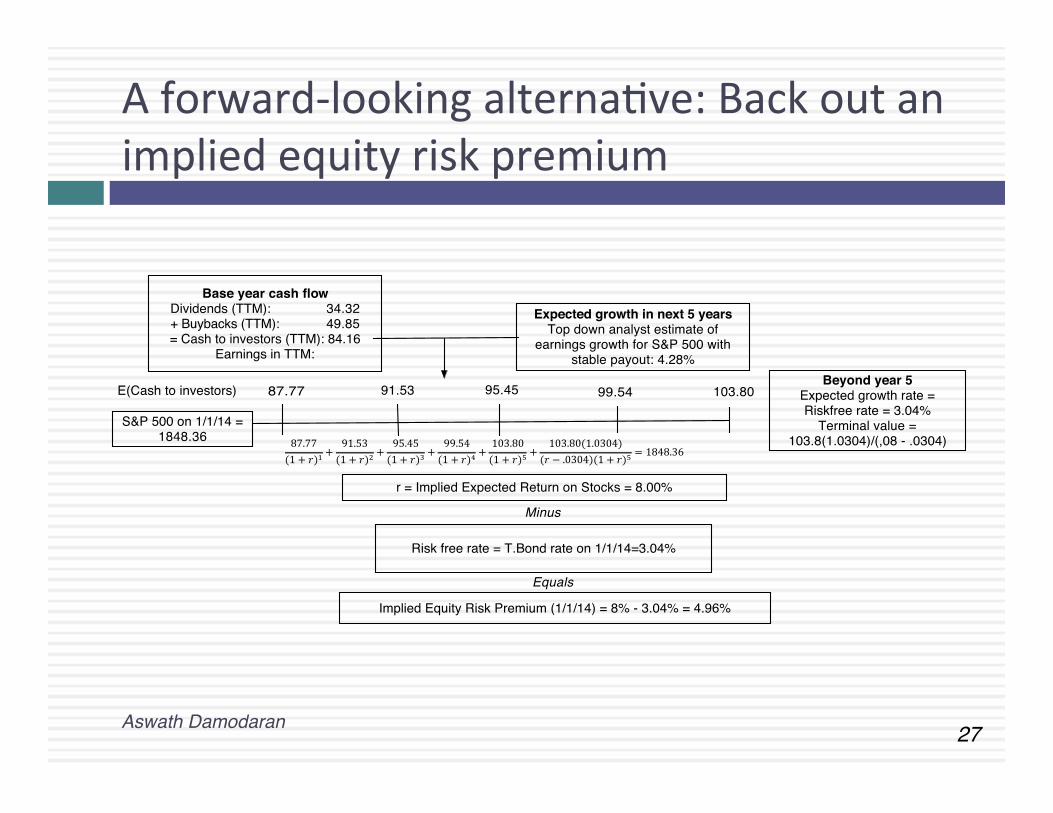
A forward-‐looking alternaCve: Back out an implied equity risk premium
Base year cash flow Dividends (TTM): 34.32+ Buybacks (TTM): 49.85= Cash to investors (TTM): 84.16
Earnings in TTM:
Expected growth in next 5 yearsTop down analyst estimate of
earnings growth for S&P 500 with stable payout: 4.28%
87.77 91.53 95.45 99.54 103.80Beyond year 5
Expected growth rate = Riskfree rate = 3.04%
Terminal value = 103.8(1.0304)/(,08 - .0304)
Risk free rate = T.Bond rate on 1/1/14=3.04%
r = Implied Expected Return on Stocks = 8.00%
S&P 500 on 1/1/14 = 1848.36
E(Cash to investors)
Minus
87.77(1+ !)! +
91.53(1+ !)! +
95.45(1+ !)! +
99.54(1+ !)! +
103.80(1+ !)! +
103.80(1.0304)(! − .0304)(1+ !)! = 1848.36!
Implied Equity Risk Premium (1/1/14) = 8% - 3.04% = 4.96%
Equals
Aswath Damodaran!
28!
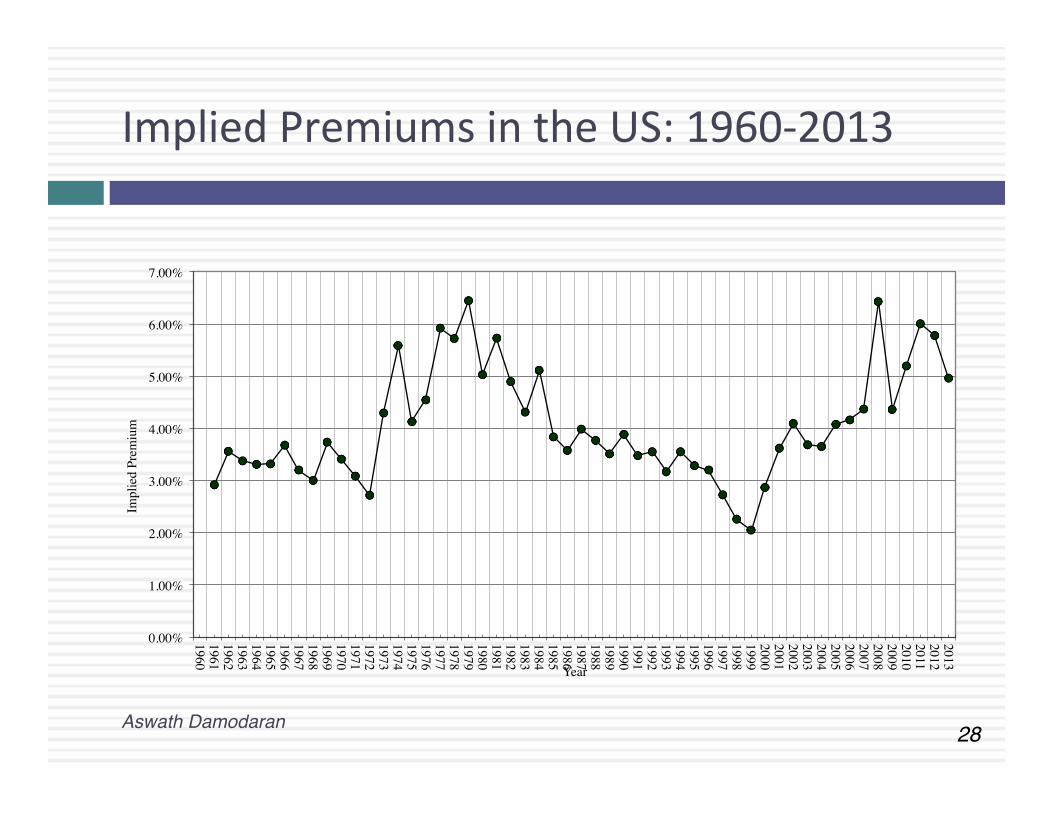
Implied Premiums in the US: 1960-‐2013
Aswath Damodaran!
0.00%
1.00%
2.00%
3.00%
4.00%
5.00%
6.00%
7.00%
1960 1961 1962 1963 1964 1965 1966 1967 1968 1969 1970 1971 1972 1973 1974 1975 1976 1977 1978 1979 1980 1981 1982 1983 1984 1985 1986 1987 1988 1989 1990 1991 1992 1993 1994 1995 1996 1997 1998 1999 2000 2001 2002 2003 2004 2005 2006 2007 2008 2009 2010 2011 2012 2013
Impl
ied
Prem
ium
Year
29!
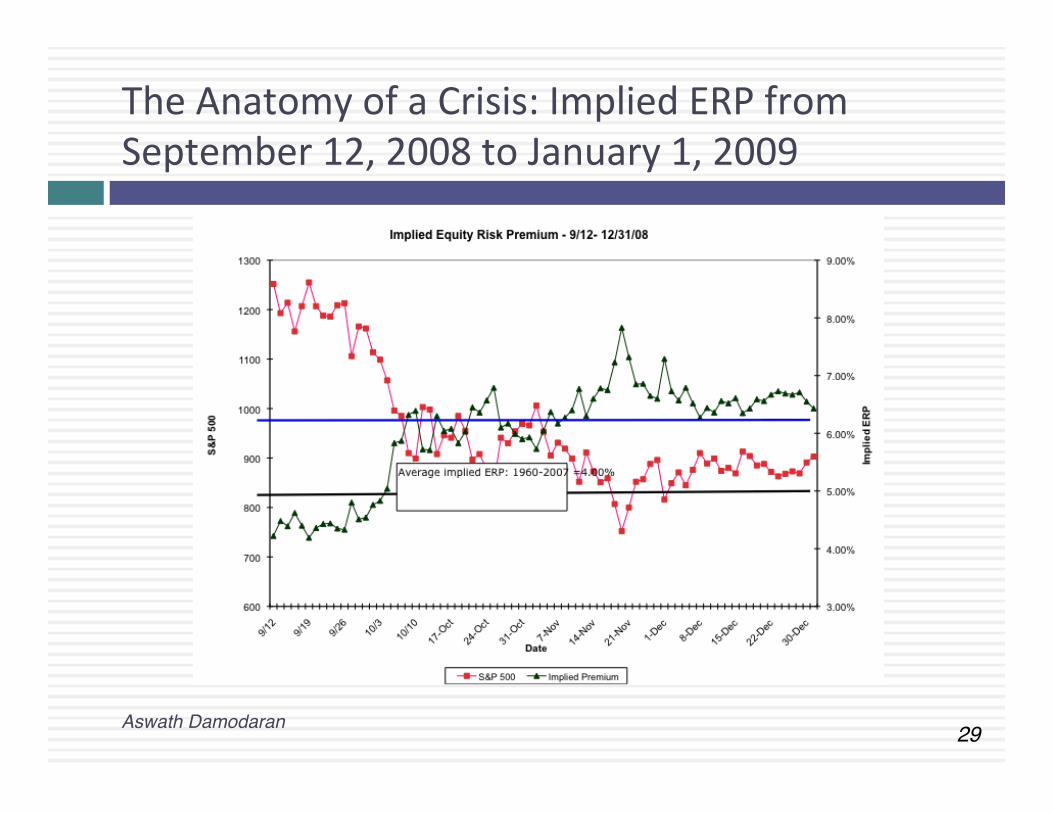
The Anatomy of a Crisis: Implied ERP from September 12, 2008 to January 1, 2009
Aswath Damodaran!
30!
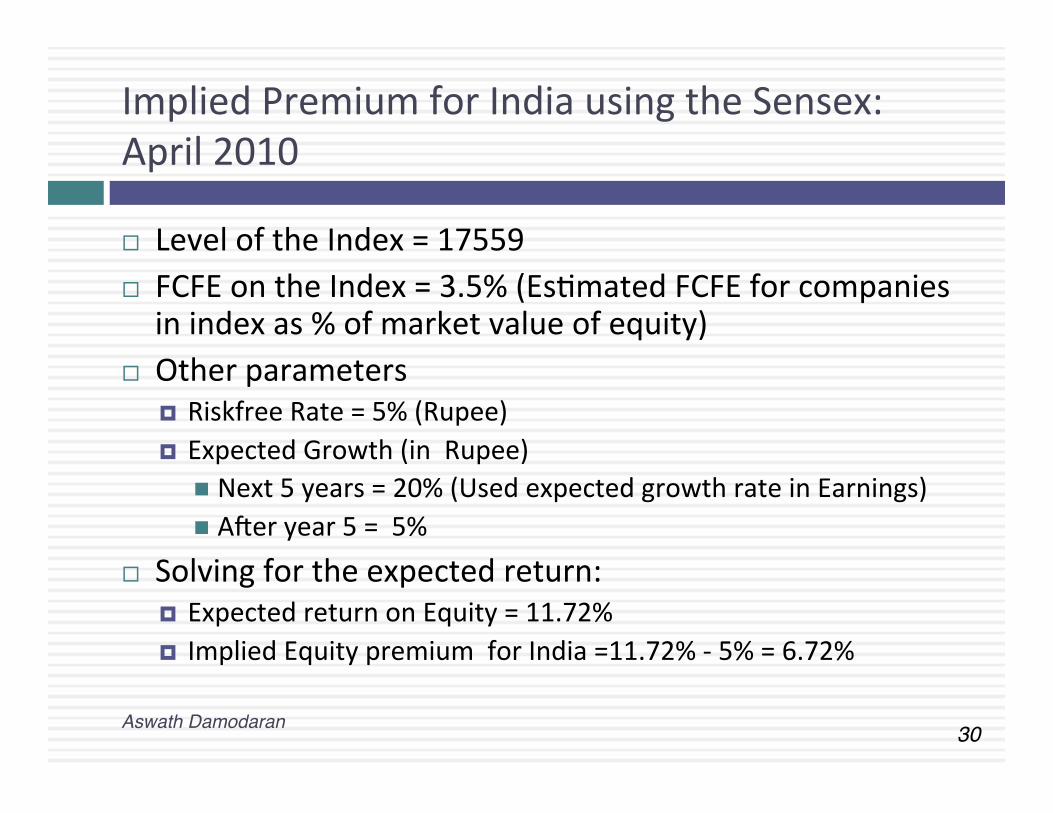
Implied Premium for India using the Sensex: April 2010
¨ Level of the Index = 17559 ¨ FCFE on the Index = 3.5% (EsCmated FCFE for companies in index as % of market value of equity)
¨ Other parameters ¤ Riskfree Rate = 5% (Rupee) ¤ Expected Growth (in Rupee)
n Next 5 years = 20% (Used expected growth rate in Earnings) n Awer year 5 = 5%
¨ Solving for the expected return: ¤ Expected return on Equity = 11.72% ¤ Implied Equity premium for India =11.72% -‐ 5% = 6.72%
Aswath Damodaran!
31!
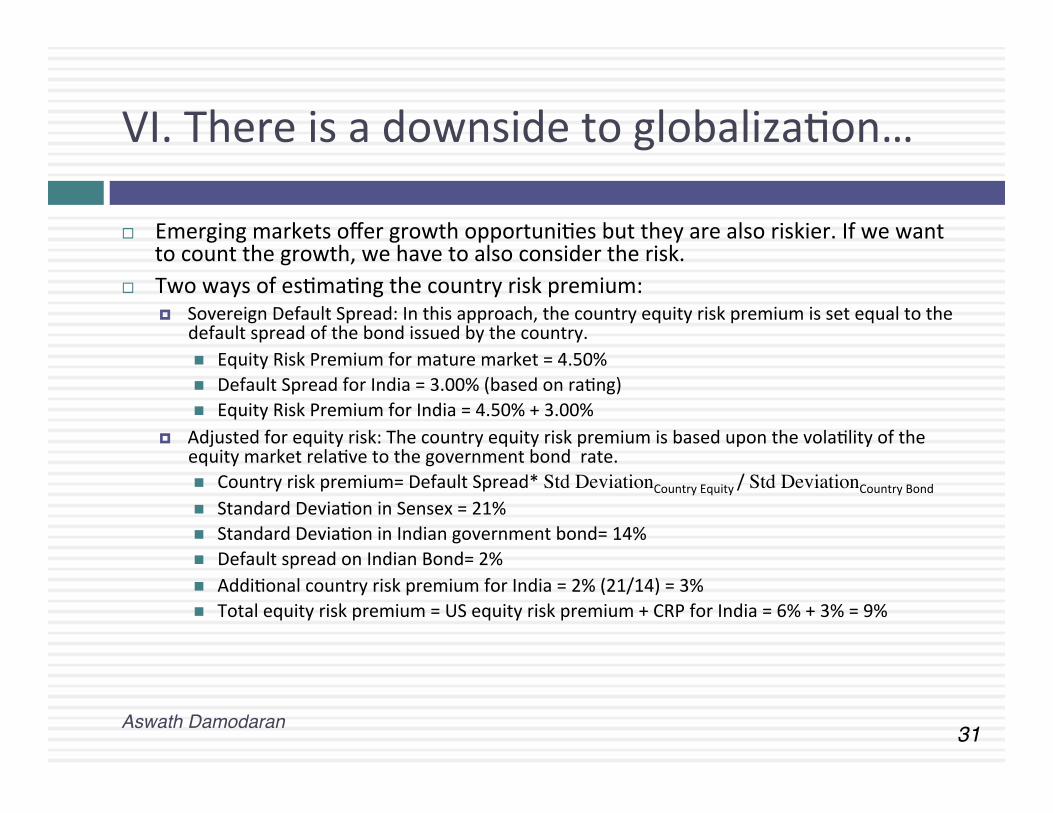
VI. There is a downside to globalizaCon…
¨ Emerging markets offer growth opportuniCes but they are also riskier. If we want to count the growth, we have to also consider the risk.
¨ Two ways of esCmaCng the country risk premium: ¤ Sovereign Default Spread: In this approach, the country equity risk premium is set equal to the
default spread of the bond issued by the country. n Equity Risk Premium for mature market = 4.50% n Default Spread for India = 3.00% (based on raCng) n Equity Risk Premium for India = 4.50% + 3.00%
¤ Adjusted for equity risk: The country equity risk premium is based upon the volaClity of the equity market relaCve to the government bond rate. n Country risk premium= Default Spread* Std DeviationCountry Equity / Std DeviationCountry Bond
n Standard DeviaCon in Sensex = 21% n Standard DeviaCon in Indian government bond= 14% n Default spread on Indian Bond= 2% n AddiConal country risk premium for India = 2% (21/14) = 3% n Total equity risk premium = US equity risk premium + CRP for India = 6% + 3% = 9%
Aswath Damodaran!
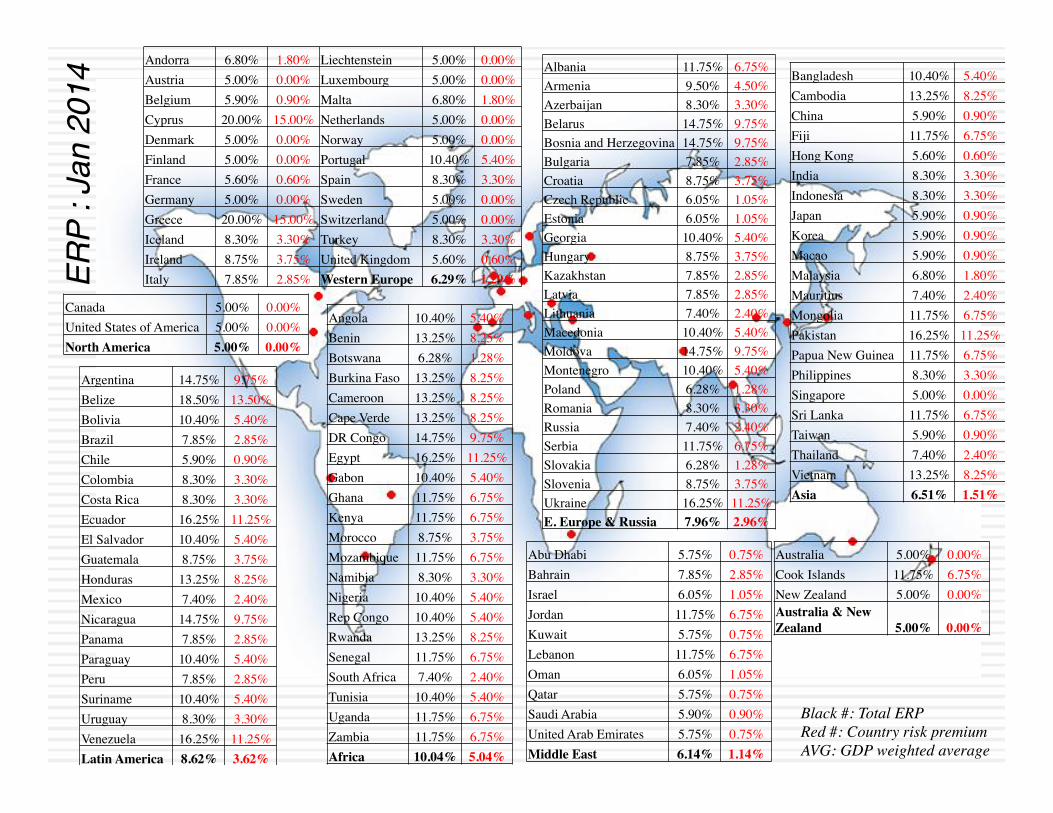
Black #: Total ERP Red #: Country risk premium AVG: GDP weighted average
ERP
: Jan
201
4!
Angola 10.40% 5.40% Benin 13.25% 8.25% Botswana 6.28% 1.28% Burkina Faso 13.25% 8.25% Cameroon 13.25% 8.25% Cape Verde 13.25% 8.25% DR Congo 14.75% 9.75% Egypt 16.25% 11.25% Gabon 10.40% 5.40% Ghana 11.75% 6.75% Kenya 11.75% 6.75% Morocco 8.75% 3.75% Mozambique 11.75% 6.75% Namibia 8.30% 3.30% Nigeria 10.40% 5.40% Rep Congo 10.40% 5.40% Rwanda 13.25% 8.25% Senegal 11.75% 6.75% South Africa 7.40% 2.40% Tunisia 10.40% 5.40% Uganda 11.75% 6.75% Zambia 11.75% 6.75% Africa 10.04% 5.04%
Bangladesh 10.40% 5.40% Cambodia 13.25% 8.25% China 5.90% 0.90% Fiji 11.75% 6.75% Hong Kong 5.60% 0.60% India 8.30% 3.30% Indonesia 8.30% 3.30% Japan 5.90% 0.90% Korea 5.90% 0.90% Macao 5.90% 0.90% Malaysia 6.80% 1.80% Mauritius 7.40% 2.40% Mongolia 11.75% 6.75% Pakistan 16.25% 11.25% Papua New Guinea 11.75% 6.75% Philippines 8.30% 3.30% Singapore 5.00% 0.00% Sri Lanka 11.75% 6.75% Taiwan 5.90% 0.90% Thailand 7.40% 2.40% Vietnam 13.25% 8.25% Asia 6.51% 1.51%
Australia 5.00% 0.00% Cook Islands 11.75% 6.75% New Zealand 5.00% 0.00% Australia & New Zealand 5.00% 0.00%
Argentina 14.75% 9.75% Belize 18.50% 13.50% Bolivia 10.40% 5.40% Brazil 7.85% 2.85% Chile 5.90% 0.90% Colombia 8.30% 3.30% Costa Rica 8.30% 3.30% Ecuador 16.25% 11.25% El Salvador 10.40% 5.40% Guatemala 8.75% 3.75% Honduras 13.25% 8.25% Mexico 7.40% 2.40% Nicaragua 14.75% 9.75% Panama 7.85% 2.85% Paraguay 10.40% 5.40% Peru 7.85% 2.85% Suriname 10.40% 5.40% Uruguay 8.30% 3.30% Venezuela 16.25% 11.25% Latin America 8.62% 3.62%
Albania 11.75% 6.75% Armenia 9.50% 4.50% Azerbaijan 8.30% 3.30% Belarus 14.75% 9.75% Bosnia and Herzegovina 14.75% 9.75% Bulgaria 7.85% 2.85% Croatia 8.75% 3.75% Czech Republic 6.05% 1.05% Estonia 6.05% 1.05% Georgia 10.40% 5.40% Hungary 8.75% 3.75% Kazakhstan 7.85% 2.85% Latvia 7.85% 2.85% Lithuania 7.40% 2.40% Macedonia 10.40% 5.40% Moldova 14.75% 9.75% Montenegro 10.40% 5.40% Poland 6.28% 1.28% Romania 8.30% 3.30% Russia 7.40% 2.40% Serbia 11.75% 6.75% Slovakia 6.28% 1.28% Slovenia 8.75% 3.75% Ukraine 16.25% 11.25% E. Europe & Russia 7.96% 2.96%
Abu Dhabi 5.75% 0.75% Bahrain 7.85% 2.85% Israel 6.05% 1.05% Jordan 11.75% 6.75% Kuwait 5.75% 0.75% Lebanon 11.75% 6.75% Oman 6.05% 1.05% Qatar 5.75% 0.75% Saudi Arabia 5.90% 0.90% United Arab Emirates 5.75% 0.75% Middle East 6.14% 1.14%
Canada 5.00% 0.00% United States of America 5.00% 0.00% North America 5.00% 0.00%
Andorra 6.80% 1.80% Liechtenstein 5.00% 0.00% Austria 5.00% 0.00% Luxembourg 5.00% 0.00% Belgium 5.90% 0.90% Malta 6.80% 1.80% Cyprus 20.00% 15.00% Netherlands 5.00% 0.00% Denmark 5.00% 0.00% Norway 5.00% 0.00% Finland 5.00% 0.00% Portugal 10.40% 5.40% France 5.60% 0.60% Spain 8.30% 3.30% Germany 5.00% 0.00% Sweden 5.00% 0.00% Greece 20.00% 15.00% Switzerland 5.00% 0.00% Iceland 8.30% 3.30% Turkey 8.30% 3.30% Ireland 8.75% 3.75% United Kingdom 5.60% 0.60% Italy 7.85% 2.85% Western Europe 6.29% 1.29%
33!
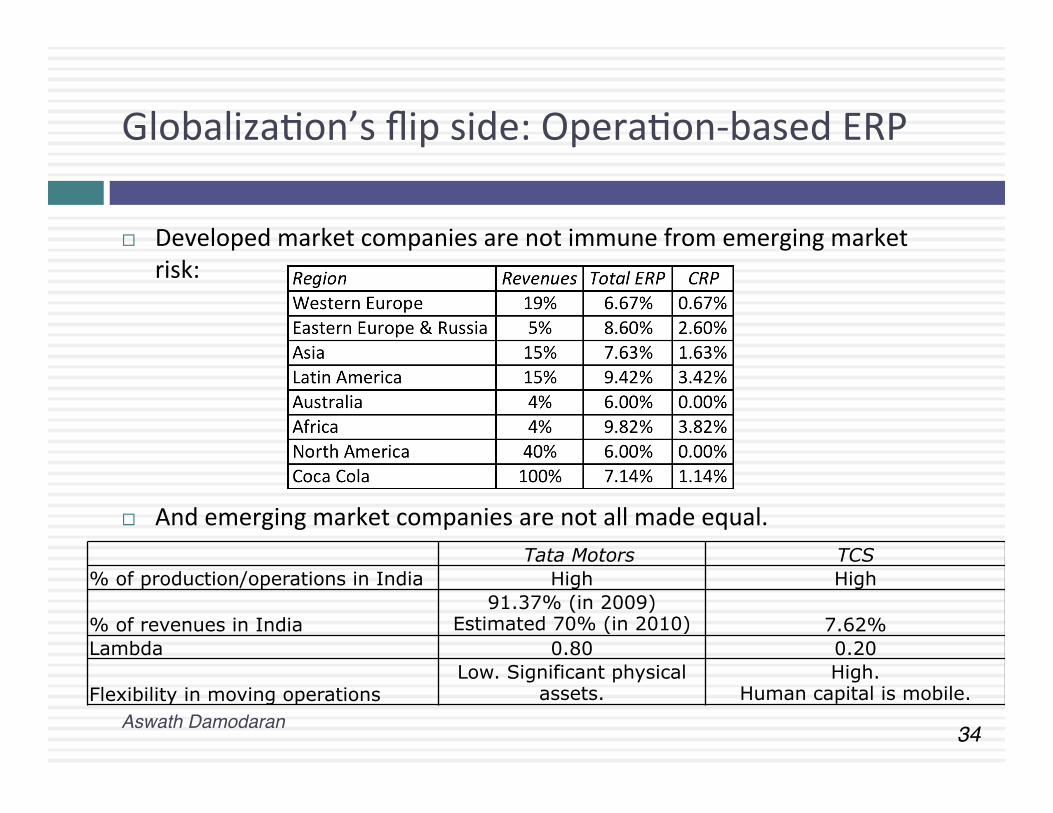
VII. And it is not just emerging market companies that are exposed to this risk..
¨ The “default” approach in valuaCon has been to assign country risk based upon your country of incorporaCon. Thus, if you are incorporated in a developed market, the assumpCon has been that you are not exposed to emerging market risks. If you are incorporated in an emerging market, you are saddled with the enCre country risk.
¨ As companies globalize and look for revenues in foreign markets, this pracCce will under esCmate the costs of equity of developed market companies with significant emerging market risk exposure and over esCmate the costs of equity of emerging market companies with significant developed market risk exposure.
Aswath Damodaran!
34!
GlobalizaCon’s flip side: OperaCon-‐based ERP
Aswath Damodaran!
¨ Developed market companies are not immune from emerging market risk:
¨ And emerging market companies are not all made equal.
Tata Motors TCS % of production/operations in India High High
% of revenues in India 91.37% (in 2009)
Estimated 70% (in 2010) 7.62% Lambda 0.80 0.20
Flexibility in moving operations Low. Significant physical
assets. High.
Human capital is mobile.
35!
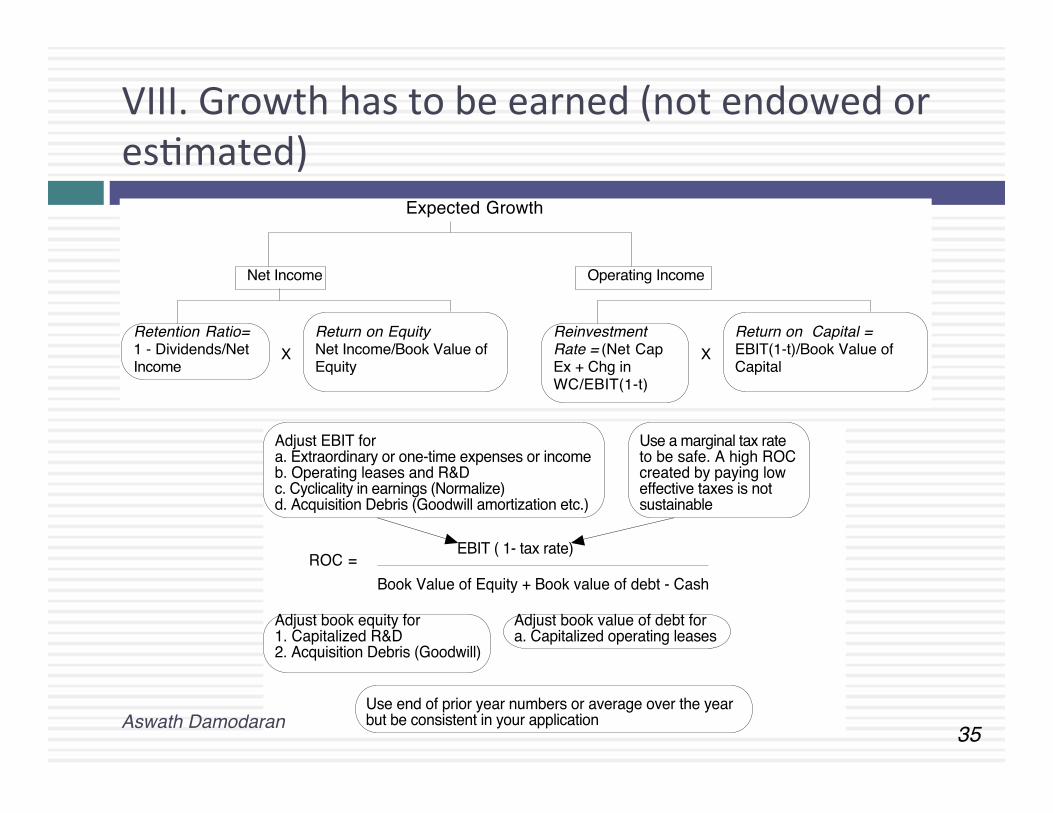
VIII. Growth has to be earned (not endowed or esCmated)
Expected Growth
Net Income Operating Income
Retention Ratio=1 - Dividends/Net Income
Return on EquityNet Income/Book Value of Equity
XReinvestment Rate = (Net Cap Ex + Chg in WC/EBIT(1-t)
Return on Capital =EBIT(1-t)/Book Value of Capital
X
ROC = EBIT ( 1- tax rate)
Book Value of Equity + Book value of debt - Cash
Adjust EBIT fora. Extraordinary or one-time expenses or incomeb. Operating leases and R&Dc. Cyclicality in earnings (Normalize)d. Acquisition Debris (Goodwill amortization etc.)
Use a marginal tax rateto be safe. A high ROC created by paying low effective taxes is not sustainable
Adjust book equity for1. Capitalized R&D2. Acquisition Debris (Goodwill)
Adjust book value of debt fora. Capitalized operating leases
Use end of prior year numbers or average over the yearbut be consistent in your applicationAswath Damodaran!
36!
The Quality of Growth
Aswath Damodaran!
37!
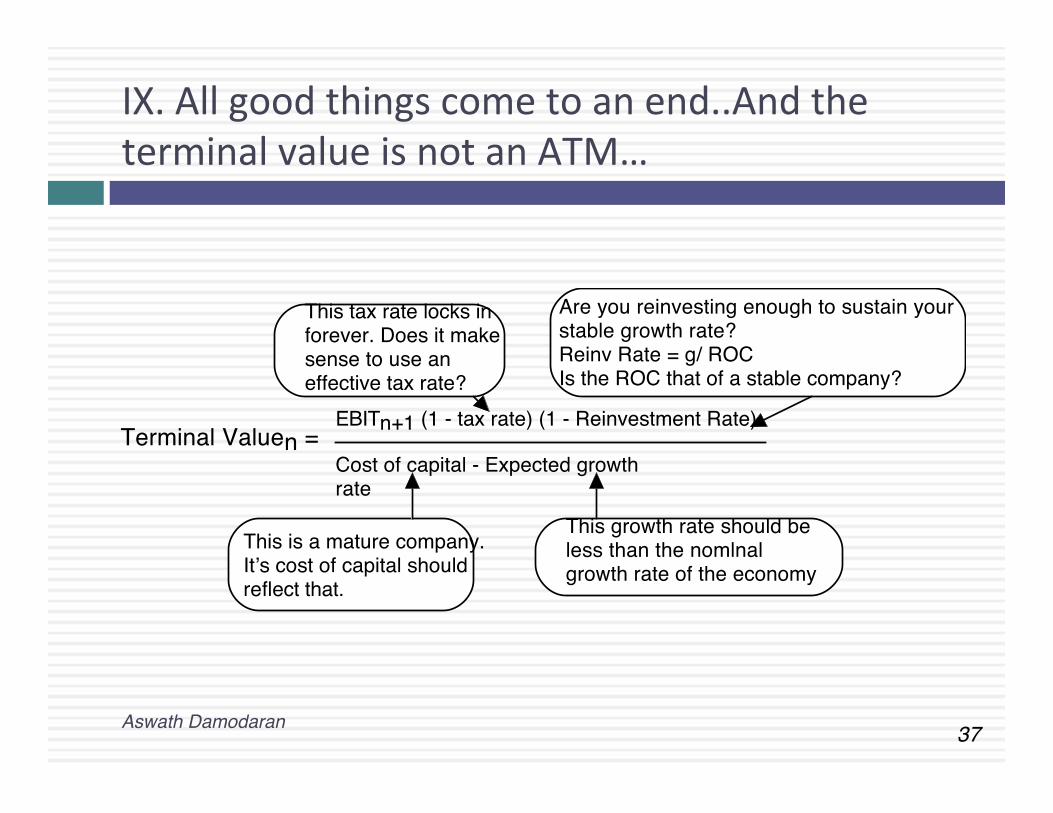
IX. All good things come to an end..And the terminal value is not an ATM…
Aswath Damodaran!
Terminal Valuen =EBITn+1 (1 - tax rate) (1 - Reinvestment Rate)
Cost of capital - Expected growth rate
Are you reinvesting enough to sustain your stable growth rate?Reinv Rate = g/ ROCIs the ROC that of a stable company?
This growth rate should be less than the nomlnal growth rate of the economy
This is a mature company. It’s cost of capital should reflect that.
This tax rate locks in forever. Does it make sense to use an effective tax rate?
38!
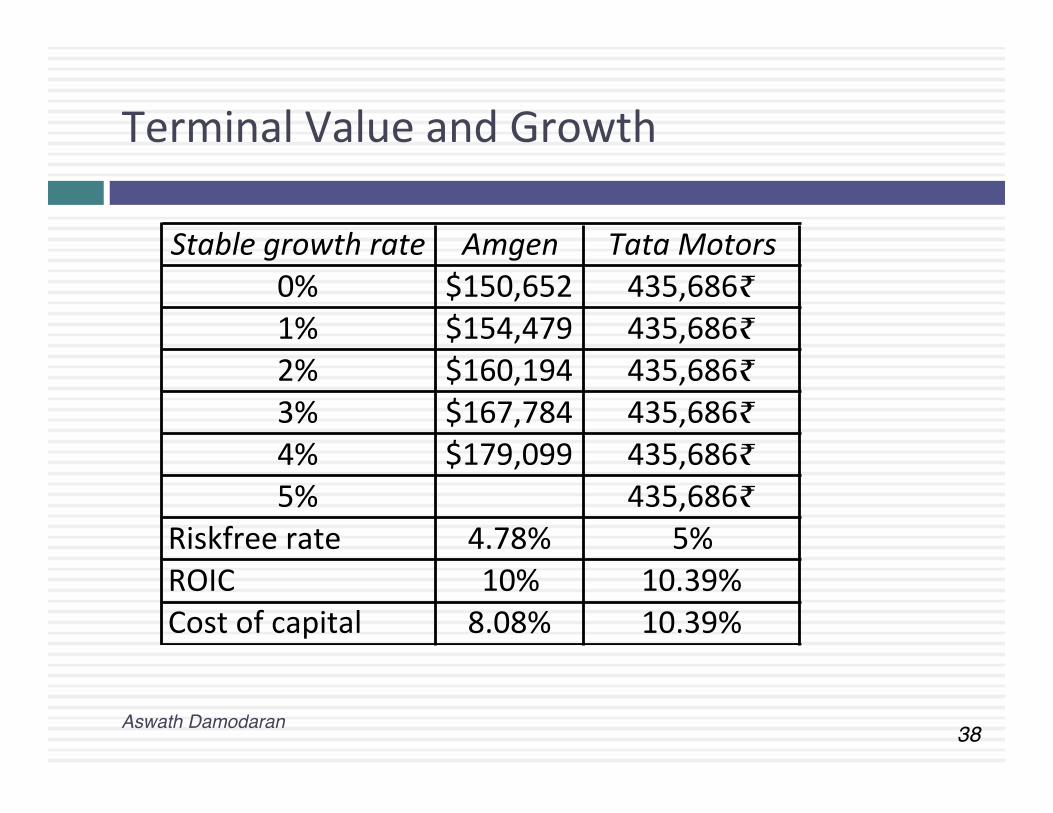
Terminal Value and Growth
Stable'growth'rate Amgen Tata'Motors0% $150,652 435,686₹1% $154,479 435,686₹2% $160,194 435,686₹3% $167,784 435,686₹4% $179,099 435,686₹5% 435,686₹
Riskfree5rate 4.78% 5%ROIC 10% 10.39%Cost5of5capital 8.08% 10.39%
Aswath Damodaran!
THE LOOSE ENDS IN VALUATION…
Aswath Damodaran
Aswath Damodaran!
40!
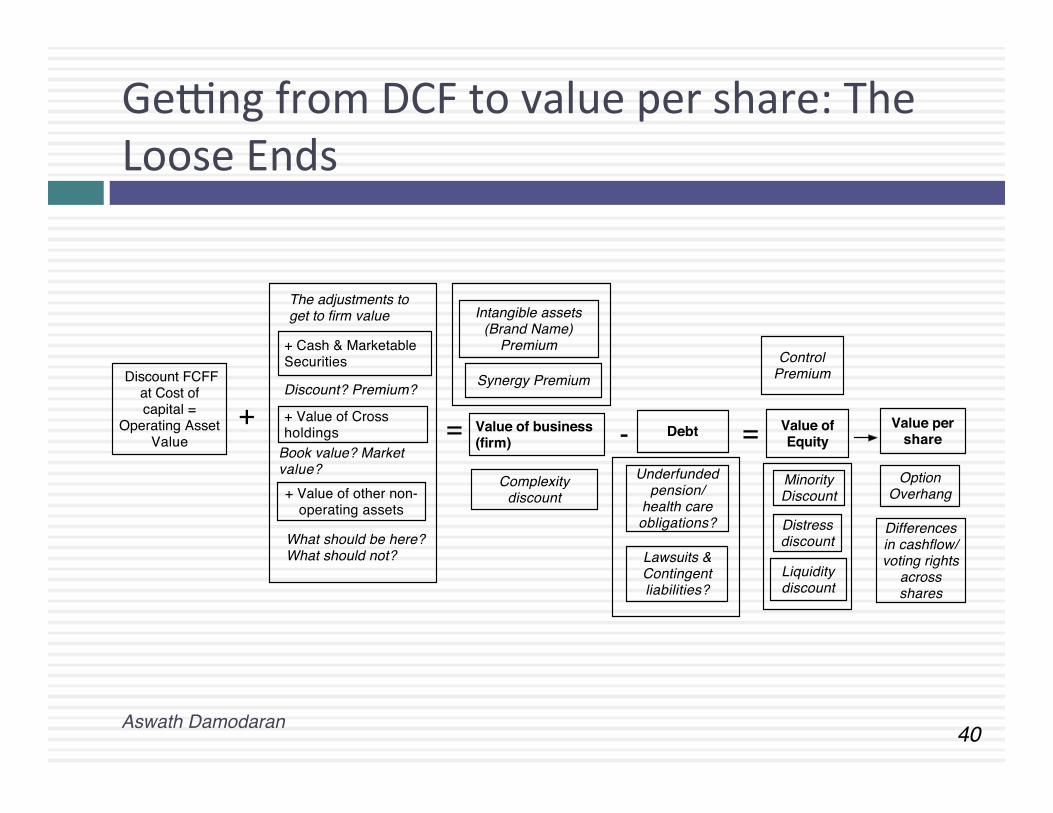
Ge{ng from DCF to value per share: The Loose Ends
Aswath Damodaran!
Discount FCFF at Cost of capital =
Operating Asset Value
The adjustments to get to firm value
+ Cash & Marketable Securities
+ Value of Cross holdings
+ Value of other non-operating assets
Value of business (firm)
Intangible assets (Brand Name)
Premium
Synergy Premium
Complexity discount
+ = - Value of Equity
Distress discount
Control Premium
Minority Discount
Debt
Underfunded pension/
health care obligations?
Lawsuits & Contingent liabilities?
= Value per share
Option Overhang
Differences in cashflow/voting rights
across shares
Liquidity discount
Discount? Premium?
Book value? Market value?
What should be here? What should not?
41!
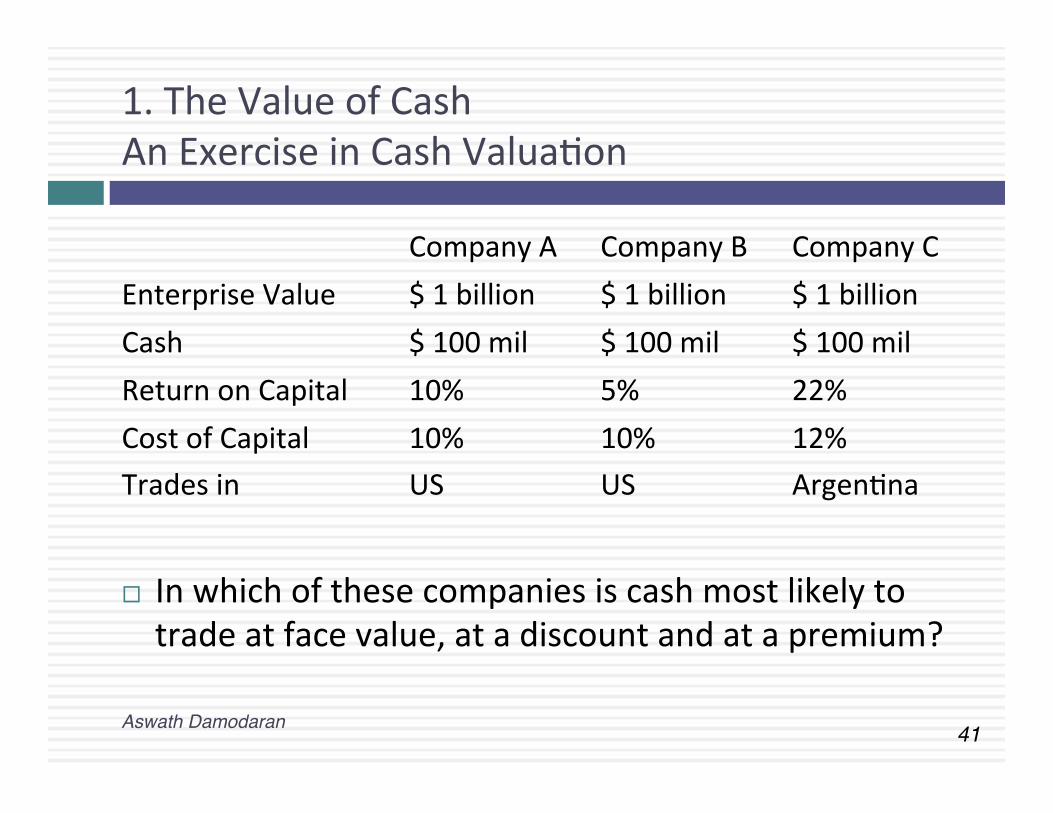
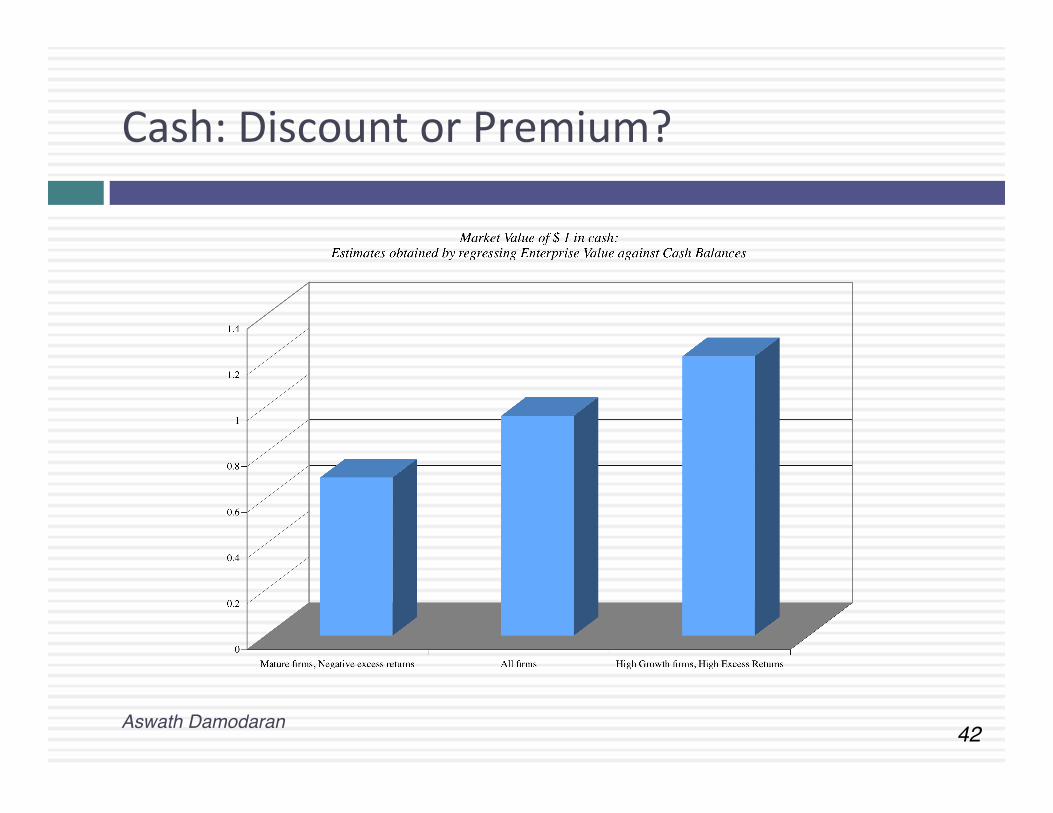
1. The Value of Cash An Exercise in Cash ValuaCon
Company A Company B Company C Enterprise Value $ 1 billion $ 1 billion $ 1 billion Cash $ 100 mil $ 100 mil $ 100 mil Return on Capital 10% 5% 22% Cost of Capital 10% 10% 12% Trades in US US ArgenCna
¨ In which of these companies is cash most likely to trade at face value, at a discount and at a premium?
Aswath Damodaran!
42!
Cash: Discount or Premium?
Aswath Damodaran!
43!
2. Dealing with Holdings in Other firms
¨ Holdings in other firms can be categorized into ¤ Minority passive holdings, in which case only the dividend from the
holdings is shown in the balance sheet ¤ Minority acCve holdings, in which case the share of equity income is
shown in the income statements ¤ Majority acCve holdings, in which case the financial statements are
consolidated. ¨ We tend to be sloppy in pracCce in dealing with cross
holdings. Awer valuing the operaCng assets of a firm, using consolidated statements, it is common to add on the balance sheet value of minority holdings (which are in book value terms) and subtract out the minority interests (again in book value terms), represenCng the porCon of the consolidated company that does not belong to the parent company.
Aswath Damodaran!
44!
How to value holdings in other firms.. In a perfect world..
¨ In a perfect world, we would strip the parent company from its subsidiaries and value each one separately. The value of the combined firm will be ¤ Value of parent company + ProporCon of value of each subsidiary
¨ To do this right, you will need to be provided detailed informaCon on each subsidiary to esCmate cash flows and discount rates.
Aswath Damodaran!
45!
Two compromise soluCons…
¨ The market value soluCon: When the subsidiaries are publicly traded, you could use their traded market capitalizaCons to esCmate the values of the cross holdings. You do risk carrying into your valuaCon any mistakes that the market may be making in valuaCon.
¨ The relaCve value soluCon: When there are too many cross holdings to value separately or when there is insufficient informaCon provided on cross holdings, you can convert the book values of holdings that you have on the balance sheet (for both minority holdings and minority interests in majority holdings) by using the average price to book value raCo of the sector in which the subsidiaries operate.
Aswath Damodaran!
46!
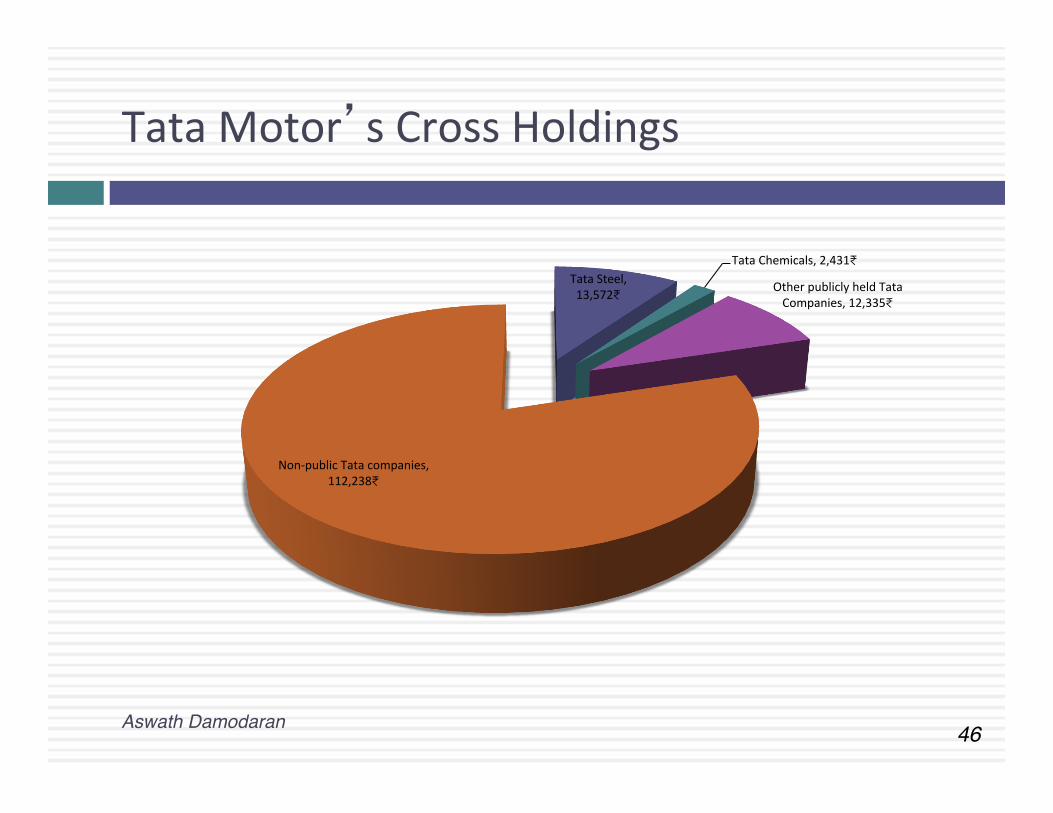
Tata Motor’s Cross Holdings
Aswath Damodaran!
Tata Steel, 13,572₹
Tata Chemicals, 2,431₹
Other publicly held Tata Companies, 12,335₹
Non-‐public Tata companies, 112,238₹
47!
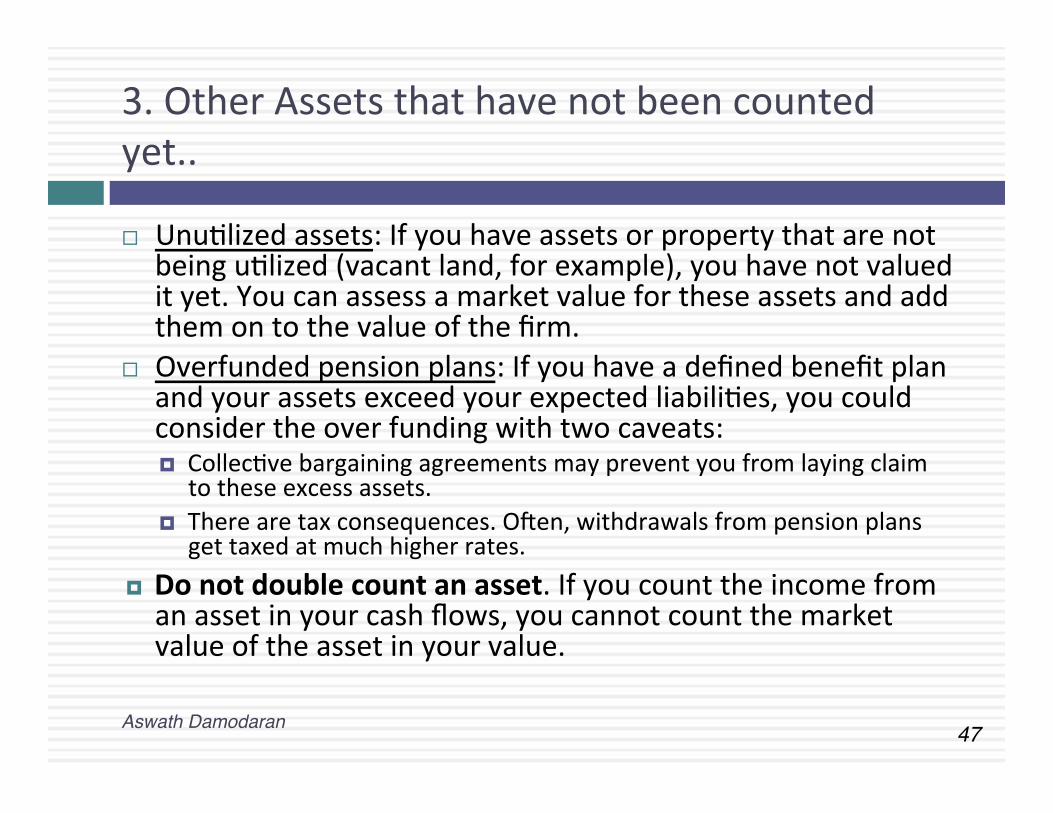
3. Other Assets that have not been counted yet..
¨ UnuClized assets: If you have assets or property that are not being uClized (vacant land, for example), you have not valued it yet. You can assess a market value for these assets and add them on to the value of the firm.
¨ Overfunded pension plans: If you have a defined benefit plan and your assets exceed your expected liabiliCes, you could consider the over funding with two caveats: ¤ CollecCve bargaining agreements may prevent you from laying claim
to these excess assets. ¤ There are tax consequences. Owen, withdrawals from pension plans
get taxed at much higher rates. ¤ Do not double count an asset. If you count the income from an asset in your cash flows, you cannot count the market value of the asset in your value.
Aswath Damodaran!
48!
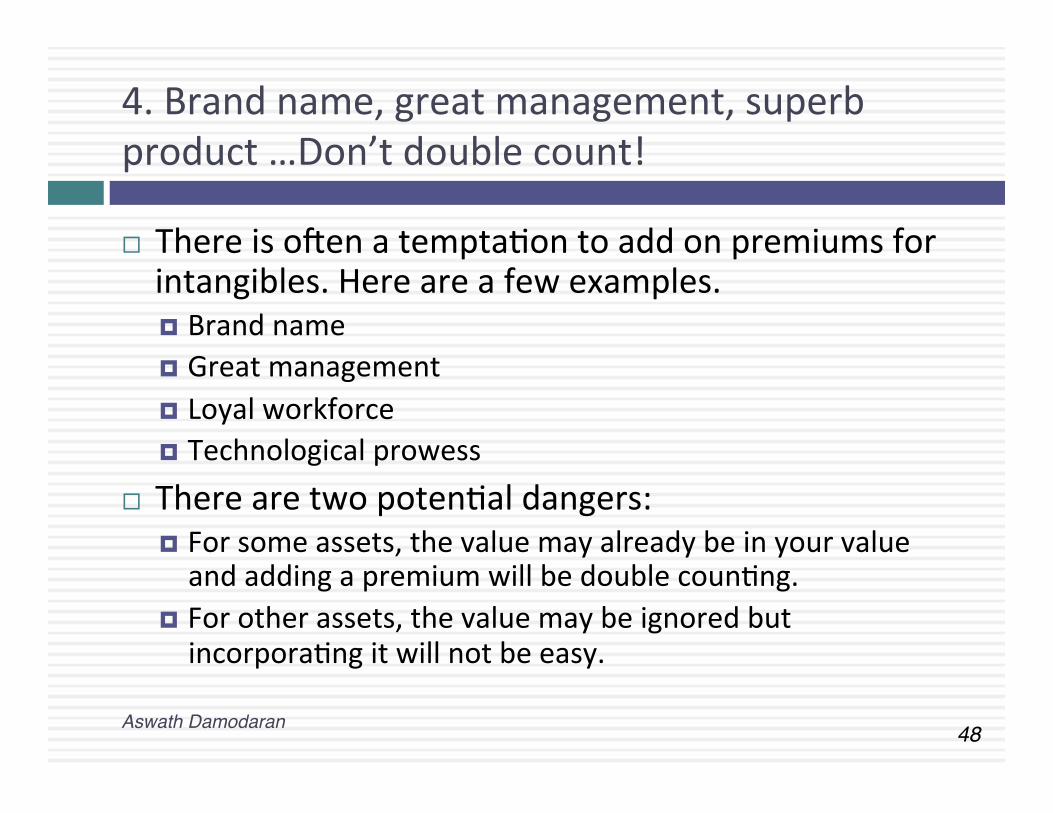
4. Brand name, great management, superb product …Don’t double count!
¨ There is owen a temptaCon to add on premiums for intangibles. Here are a few examples. ¤ Brand name ¤ Great management ¤ Loyal workforce ¤ Technological prowess
¨ There are two potenCal dangers: ¤ For some assets, the value may already be in your value and adding a premium will be double counCng.
¤ For other assets, the value may be ignored but incorporaCng it will not be easy.
Aswath Damodaran!
49!
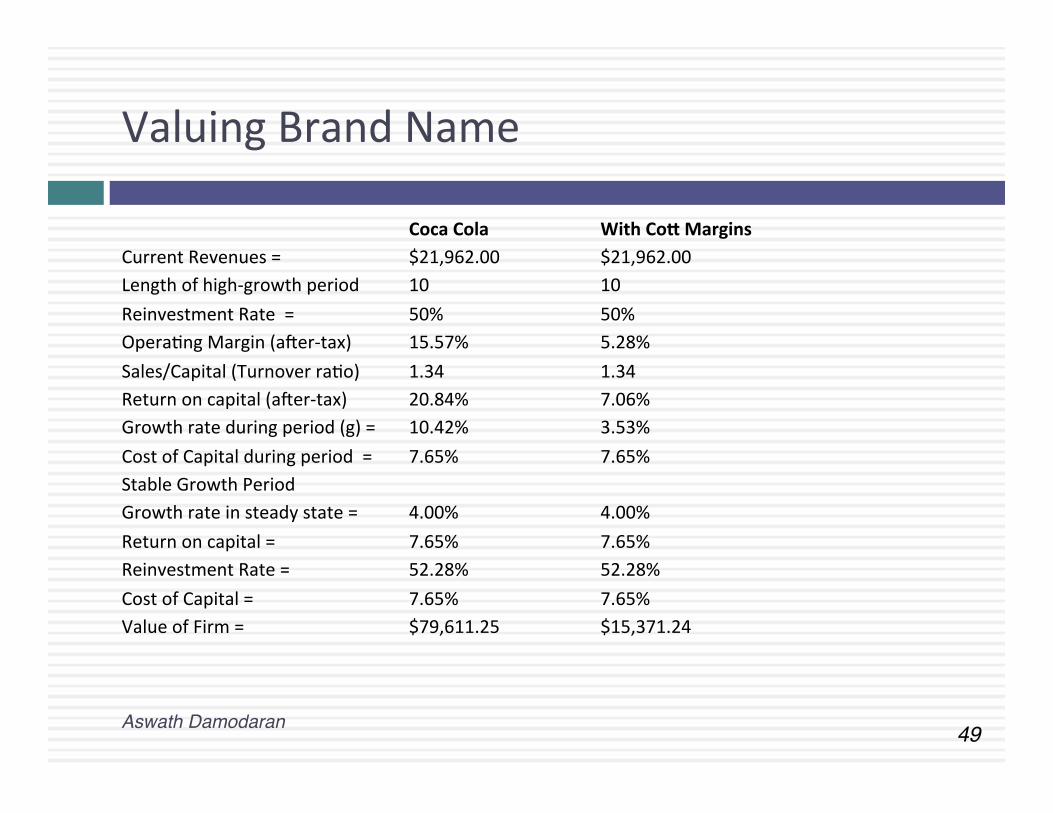
Valuing Brand Name
Coca Cola With Co9 Margins Current Revenues = $21,962.00 $21,962.00 Length of high-‐growth period 10 10 Reinvestment Rate = 50% 50% OperaCng Margin (awer-‐tax) 15.57% 5.28% Sales/Capital (Turnover raCo) 1.34 1.34 Return on capital (awer-‐tax) 20.84% 7.06% Growth rate during period (g) = 10.42% 3.53% Cost of Capital during period = 7.65% 7.65% Stable Growth Period Growth rate in steady state = 4.00% 4.00% Return on capital = 7.65% 7.65% Reinvestment Rate = 52.28% 52.28% Cost of Capital = 7.65% 7.65% Value of Firm = $79,611.25 $15,371.24
Aswath Damodaran!

50!
5. The Value of Control: It’s not always worth 20%!!
¨ The value of the control premium that will be paid to acquire a block of equity will depend upon two factors -‐ ¤ Probability that control of firm will change: This refers to the probability that incumbent management will be replaced. this can be either through acquisiCon or through exisCng stockholders exercising their muscle.
¤ Value of Gaining Control of the Company: The value of gaining control of a company arises from two sources -‐ the increase in value that can be wrought by changes in the way the company is managed and run, and the side benefits and perquisites of being in control
¤ Value of Gaining Control = Present Value (Value of Company with change in control -‐ Value of company without change in control) + Side Benefits of Control
Aswath Damodaran!
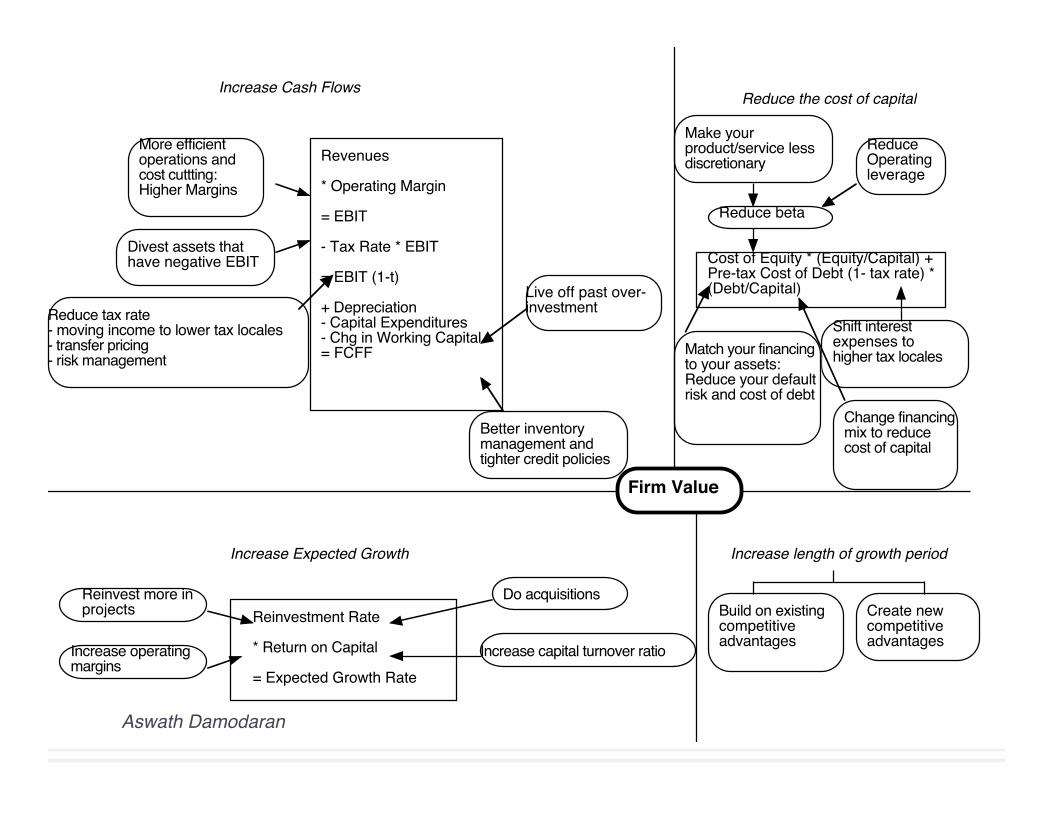
Revenues
* Operating Margin
= EBIT
- Tax Rate * EBIT
= EBIT (1-t)
+ Depreciation- Capital Expenditures- Chg in Working Capital= FCFF
Divest assets thathave negative EBIT
More efficient operations and cost cuttting: Higher Margins
Reduce tax rate- moving income to lower tax locales- transfer pricing- risk management
Live off past over- investment
Better inventory management and tighter credit policies
Increase Cash Flows
Reinvestment Rate
* Return on Capital
= Expected Growth Rate
Reinvest more inprojects
Do acquisitions
Increase operatingmargins
Increase capital turnover ratio
Increase Expected Growth
Firm Value
Increase length of growth period
Build on existing competitive advantages
Create new competitive advantages
Reduce the cost of capital
Cost of Equity * (Equity/Capital) + Pre-tax Cost of Debt (1- tax rate) * (Debt/Capital)
Make your product/service less discretionary
Reduce Operating leverage
Match your financing to your assets: Reduce your default risk and cost of debt
Reduce beta
Shift interest expenses to higher tax locales
Change financing mix to reduce cost of capital
Aswath Damodaran!
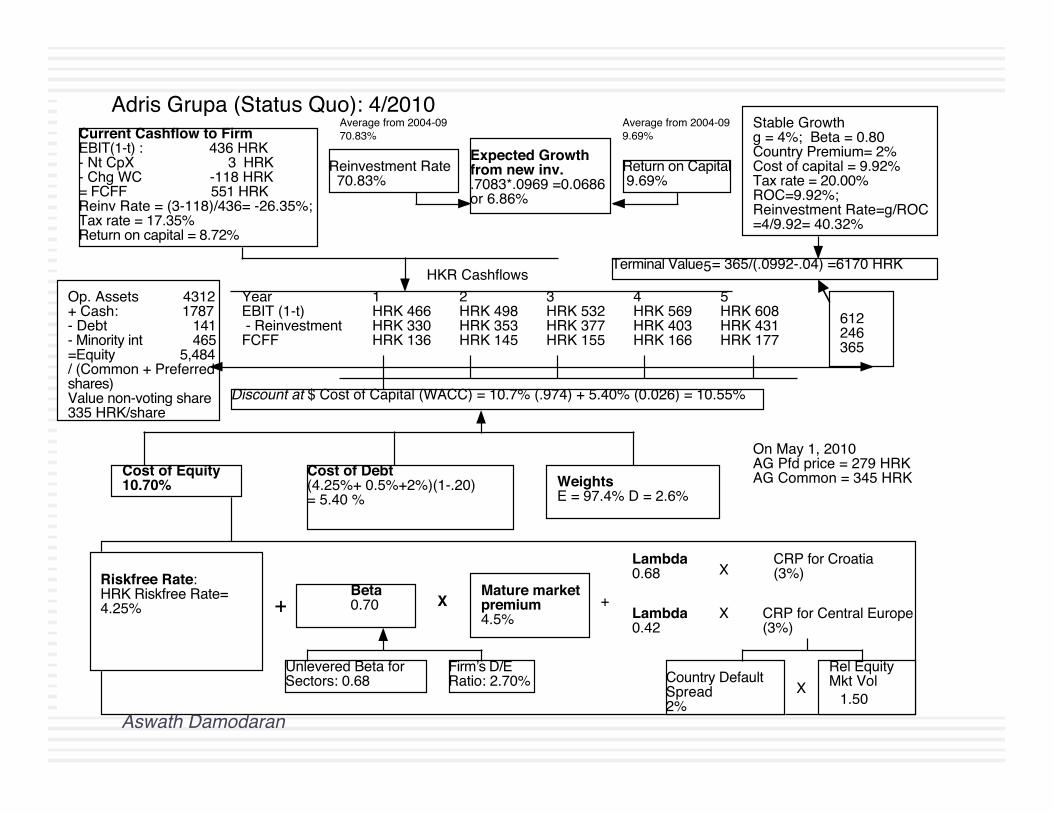
Current Cashflow to FirmEBIT(1-t) : 436 HRK- Nt CpX 3 HRK - Chg WC -118 HRK= FCFF 551 HRKReinv Rate = (3-118)/436= -26.35%; Tax rate = 17.35%Return on capital = 8.72%
Expected Growth from new inv..7083*.0969 =0.0686or 6.86%
Stable Growthg = 4%; Beta = 0.80Country Premium= 2%Cost of capital = 9.92%Tax rate = 20.00% ROC=9.92%; Reinvestment Rate=g/ROC =4/9.92= 40.32%
Terminal Value5= 365/(.0992-.04) =6170 HRK
Cost of Equity10.70%
Cost of Debt(4.25%+ 0.5%+2%)(1-.20)= 5.40 %
WeightsE = 97.4% D = 2.6%
Discount at $ Cost of Capital (WACC) = 10.7% (.974) + 5.40% (0.026) = 10.55%
Op. Assets 4312+ Cash: 1787- Debt 141 - Minority int 465=Equity 5,484/ (Common + Preferred shares) Value non-voting share335 HRK/share
Riskfree Rate:HRK Riskfree Rate= 4.25% +
Beta 0.70 X
Mature market premium 4.5%
Unlevered Beta for Sectors: 0.68
Firmʼs D/ERatio: 2.70%
Adris Grupa (Status Quo): 4/2010
Reinvestment Rate 70.83%
Return on Capital 9.69%
612246365
+
Country Default Spread2%
XRel Equity Mkt Vol
1.50
On May 1, 2010AG Pfd price = 279 HRKAG Common = 345 HRK
HKR Cashflows
Lambda0.68 X
CRP for Croatia (3%)
XLambda0.42
CRP for Central Europe (3%)
Average from 2004-0970.83%
Average from 2004-099.69%
Year 1 2 3 4 5EBIT (1-t) HRK 466 HRK 498 HRK 532 HRK 569 HRK 608 - Reinvestment HRK 330 HRK 353 HRK 377 HRK 403 HRK 431FCFF HRK 136 HRK 145 HRK 155 HRK 166 HRK 177
Aswath Damodaran!
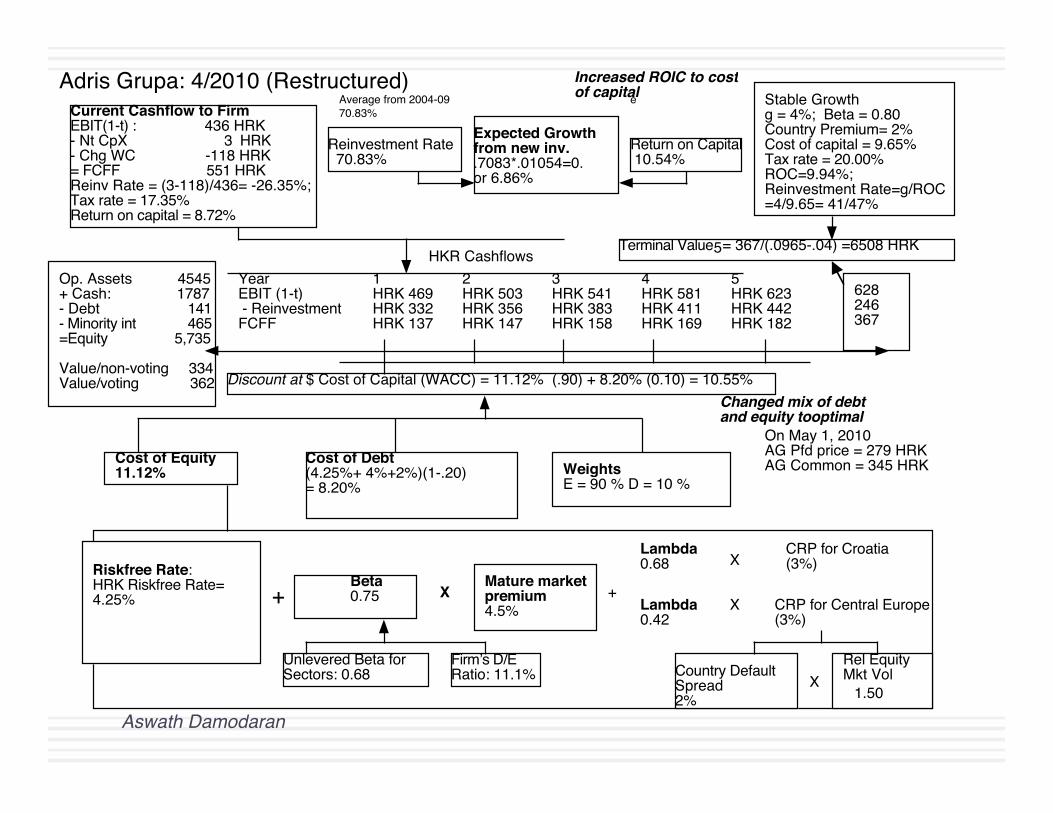
Current Cashflow to FirmEBIT(1-t) : 436 HRK- Nt CpX 3 HRK - Chg WC -118 HRK= FCFF 551 HRKReinv Rate = (3-118)/436= -26.35%; Tax rate = 17.35%Return on capital = 8.72%
Expected Growth from new inv..7083*.01054=0.or 6.86%
Stable Growthg = 4%; Beta = 0.80Country Premium= 2%Cost of capital = 9.65%Tax rate = 20.00% ROC=9.94%; Reinvestment Rate=g/ROC =4/9.65= 41/47%
Terminal Value5= 367/(.0965-.04) =6508 HRK
Cost of Equity11.12%
Cost of Debt(4.25%+ 4%+2%)(1-.20)= 8.20%
WeightsE = 90 % D = 10 %
Discount at $ Cost of Capital (WACC) = 11.12% (.90) + 8.20% (0.10) = 10.55%
Op. Assets 4545+ Cash: 1787- Debt 141 - Minority int 465=Equity 5,735
Value/non-voting 334Value/voting 362
Riskfree Rate:HRK Riskfree Rate= 4.25% +
Beta 0.75 X
Mature market premium 4.5%
Unlevered Beta for Sectors: 0.68
Firmʼs D/ERatio: 11.1%
Adris Grupa: 4/2010 (Restructured)
Reinvestment Rate 70.83%
Return on Capital 10.54%
628246367
+
Country Default Spread2%
XRel Equity Mkt Vol
1.50
On May 1, 2010AG Pfd price = 279 HRKAG Common = 345 HRK
HKR Cashflows
Lambda0.68 X
CRP for Croatia (3%)
XLambda0.42
CRP for Central Europe (3%)
Average from 2004-0970.83%
e
Year 1 2 3 4 5EBIT (1-t) HRK 469 HRK 503 HRK 541 HRK 581 HRK 623 - Reinvestment HRK 332 HRK 356 HRK 383 HRK 411 HRK 442FCFF HRK 137 HRK 147 HRK 158 HRK 169 HRK 182
Increased ROIC to cost of capital
Changed mix of debt and equity tooptimal
Aswath Damodaran!
54!
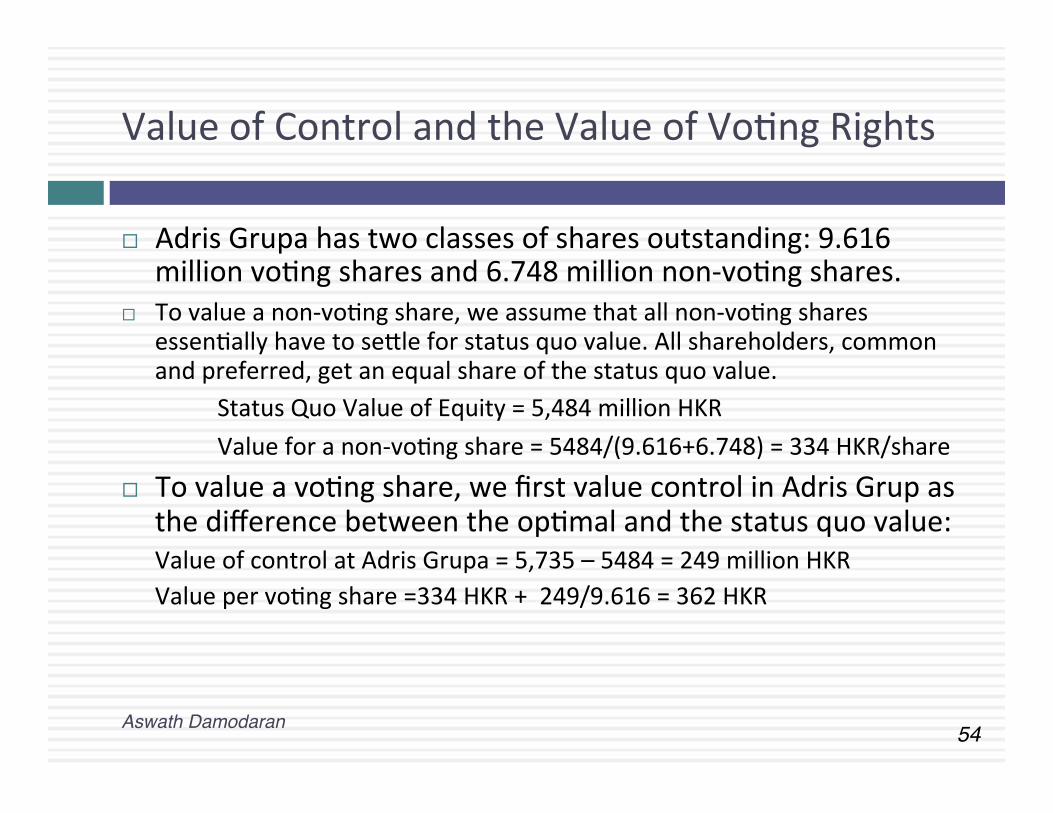
Value of Control and the Value of VoCng Rights
¨ Adris Grupa has two classes of shares outstanding: 9.616 million voCng shares and 6.748 million non-‐voCng shares.
¨ To value a non-‐voCng share, we assume that all non-‐voCng shares essenCally have to seTle for status quo value. All shareholders, common and preferred, get an equal share of the status quo value.
Status Quo Value of Equity = 5,484 million HKR Value for a non-‐voCng share = 5484/(9.616+6.748) = 334 HKR/share
¨ To value a voCng share, we first value control in Adris Grup as the difference between the opCmal and the status quo value: Value of control at Adris Grupa = 5,735 – 5484 = 249 million HKR Value per voCng share =334 HKR + 249/9.616 = 362 HKR
Aswath Damodaran!
THE DARK SIDE OF VALUATION: VALUING DIFFICULT-‐TO-‐VALUE COMPANIES
Aswath Damodaran!
56!
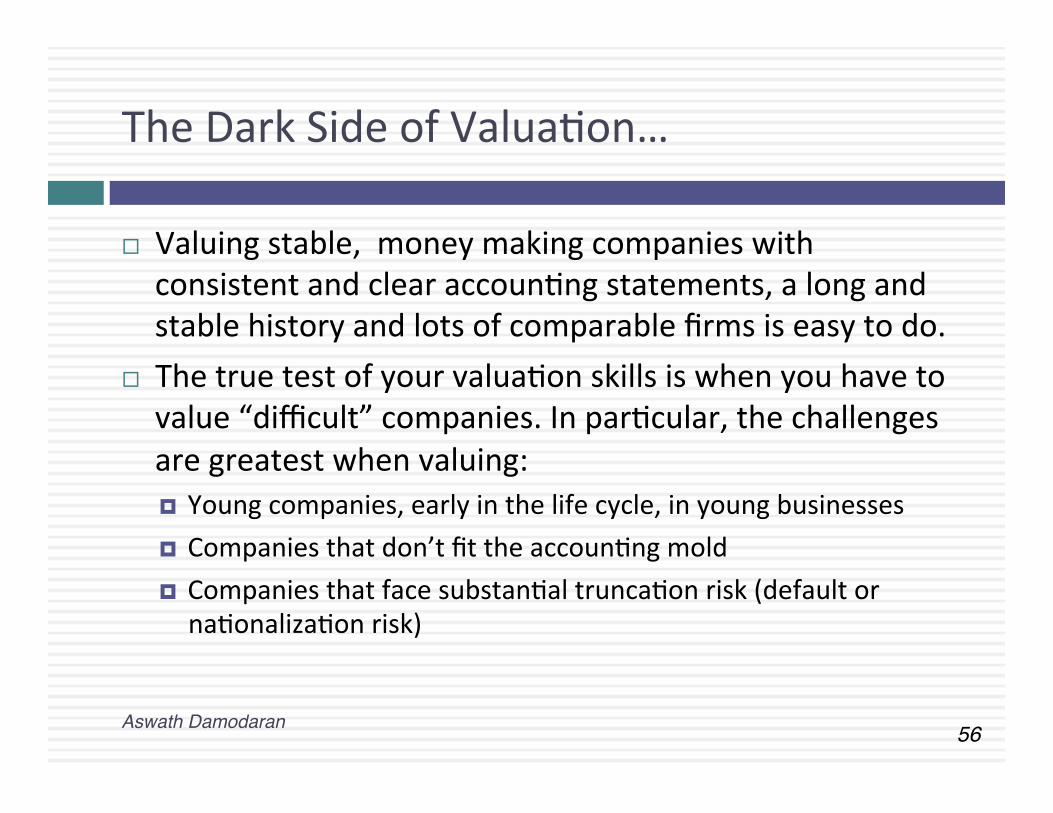
The Dark Side of ValuaCon…
¨ Valuing stable, money making companies with consistent and clear accounCng statements, a long and stable history and lots of comparable firms is easy to do.
¨ The true test of your valuaCon skills is when you have to value “difficult” companies. In parCcular, the challenges are greatest when valuing: ¤ Young companies, early in the life cycle, in young businesses ¤ Companies that don’t fit the accounCng mold ¤ Companies that face substanCal truncaCon risk (default or naConalizaCon risk)
Aswath Damodaran!
57!
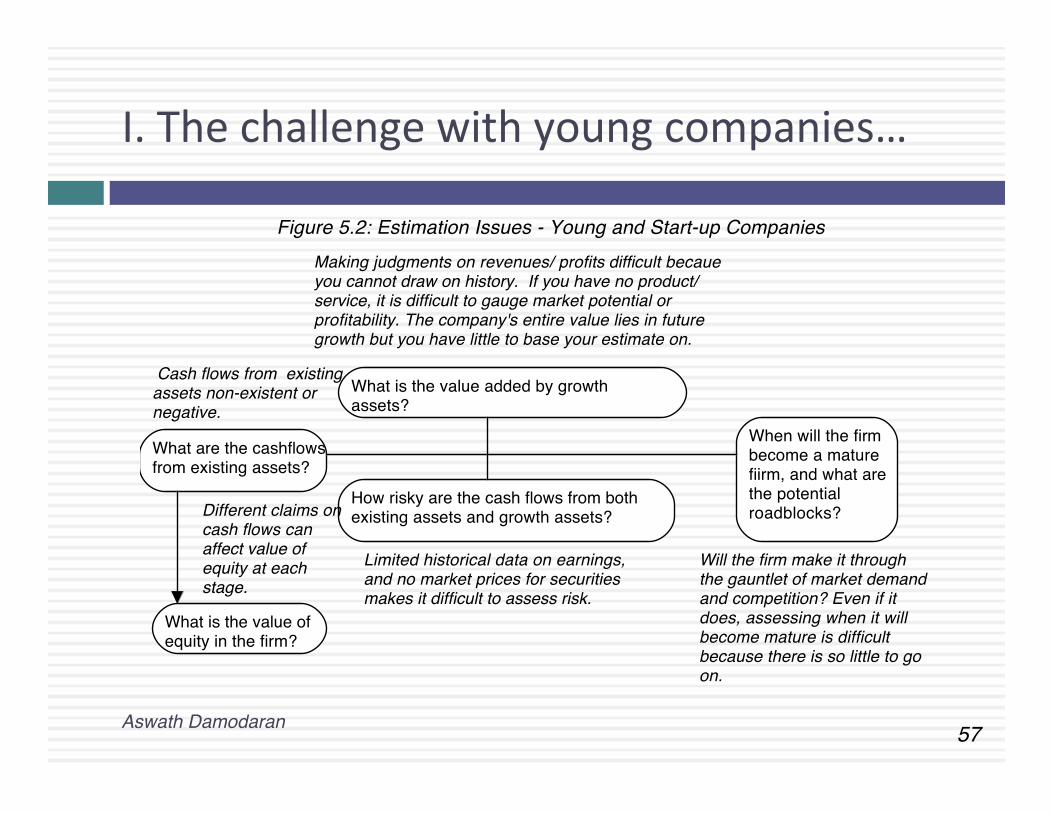
I. The challenge with young companies…
Aswath Damodaran!
What are the cashflows from existing assets?
What is the value added by growth assets?
How risky are the cash flows from both existing assets and growth assets?
When will the firm become a mature fiirm, and what are the potential roadblocks?
Cash flows from existing assets non-existent or negative.
Limited historical data on earnings, and no market prices for securities makes it difficult to assess risk.
Making judgments on revenues/ profits difficult becaue you cannot draw on history. If you have no product/service, it is difficult to gauge market potential or profitability. The company's entire value lies in future growth but you have little to base your estimate on.
Will the firm make it through the gauntlet of market demand and competition? Even if it does, assessing when it will become mature is difficult because there is so little to go on.
Figure 5.2: Estimation Issues - Young and Start-up Companies
What is the value of equity in the firm?
Different claims on cash flows can affect value of equity at each stage.
58!
Upping the ante.. Young companies in young businesses…
¨ When valuing a business, we generally draw on three sources of informaCon ¤ The firm’s current financial statement
n How much did the firm sell? n How much did it earn?
¤ The firm’s financial history, usually summarized in its financial statements. n How fast have the firm’s revenues and earnings grown over Cme? n What can we learn about cost structure and profitability from these trends? n SuscepCbility to macro-‐economic factors (recessions and cyclical firms)
¤ The industry and comparable firm data n What happens to firms as they mature? (Margins.. Revenue growth… Reinvestment
needs… Risk) ¨ It is when valuing these companies that you find yourself tempted by the dark
side, where ¤ “Paradigm shiws” happen… ¤ New metrics are invented … ¤ The story dominates and the numbers lag…
Aswath Damodaran!
Aswath Damodaran!
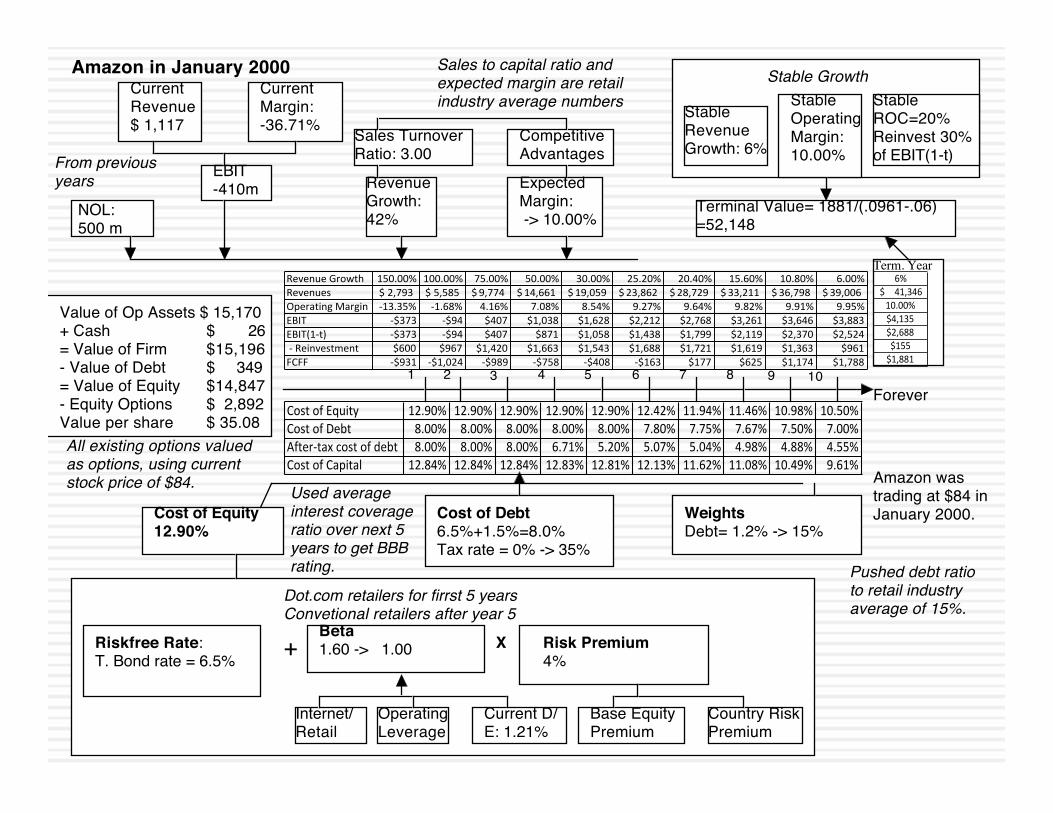
Forever
Terminal Value= 1881/(.0961-.06)=52,148
Cost of Equity12.90%
Cost of Debt6.5%+1.5%=8.0%Tax rate = 0% -> 35%
WeightsDebt= 1.2% -> 15%
Value of Op Assets $ 15,170+ Cash $ 26= Value of Firm $15,196- Value of Debt $ 349= Value of Equity $14,847- Equity Options $ 2,892Value per share $ 35.08
Riskfree Rate:T. Bond rate = 6.5% +
Beta1.60 -> 1.00 X Risk Premium
4%
Internet/Retail
Operating Leverage
Current D/E: 1.21%
Base EquityPremium
Country RiskPremium
CurrentRevenue$ 1,117
CurrentMargin:-36.71% Sales Turnover
Ratio: 3.00CompetitiveAdvantages
Revenue Growth:42%
Expected Margin: -> 10.00%
Stable Growth
StableRevenueGrowth: 6%
StableOperatingMargin: 10.00%
Stable ROC=20%Reinvest 30% of EBIT(1-t)
EBIT-410m
NOL:500 m
Term. Year
2 43 51 6 8 9 107
Amazon in January 2000
Amazon was trading at $84 in January 2000.
Dot.com retailers for firrst 5 yearsConvetional retailers after year 5
Used average interest coverage ratio over next 5 years to get BBB rating. Pushed debt ratio
to retail industry average of 15%.
From previous years
Sales to capital ratio and expected margin are retail industry average numbers
All existing options valued as options, using current stock price of $84.
Cost%of%Equity 12.90% 12.90% 12.90% 12.90% 12.90% 12.42% 11.94% 11.46% 10.98% 10.50%Cost%of%Debt 8.00% 8.00% 8.00% 8.00% 8.00% 7.80% 7.75% 7.67% 7.50% 7.00%After<tax%cost%of%debt 8.00% 8.00% 8.00% 6.71% 5.20% 5.07% 5.04% 4.98% 4.88% 4.55%Cost%of%Capital% 12.84% 12.84% 12.84% 12.83% 12.81% 12.13% 11.62% 11.08% 10.49% 9.61%
Revenue&Growth 150.00% 100.00% 75.00% 50.00% 30.00% 25.20% 20.40% 15.60% 10.80% 6.00%Revenues 2,793$&& 5,585$&& 9,774$& 14,661$& 19,059$& 23,862$& 28,729$& 33,211$& 36,798$& 39,006$&Operating&Margin B13.35% B1.68% 4.16% 7.08% 8.54% 9.27% 9.64% 9.82% 9.91% 9.95%EBIT B$373 B$94 $407 $1,038 $1,628 $2,212 $2,768 $3,261 $3,646 $3,883EBIT(1Bt) B$373 B$94 $407 $871 $1,058 $1,438 $1,799 $2,119 $2,370 $2,524&B&Reinvestment $600 $967 $1,420 $1,663 $1,543 $1,688 $1,721 $1,619 $1,363 $961FCFF B$931 B$1,024 B$989 B$758 B$408 B$163 $177 $625 $1,174 $1,788
6%41,346$(((((
10.00%$4,135$2,688$155$1,881
Aswath Damodaran 60
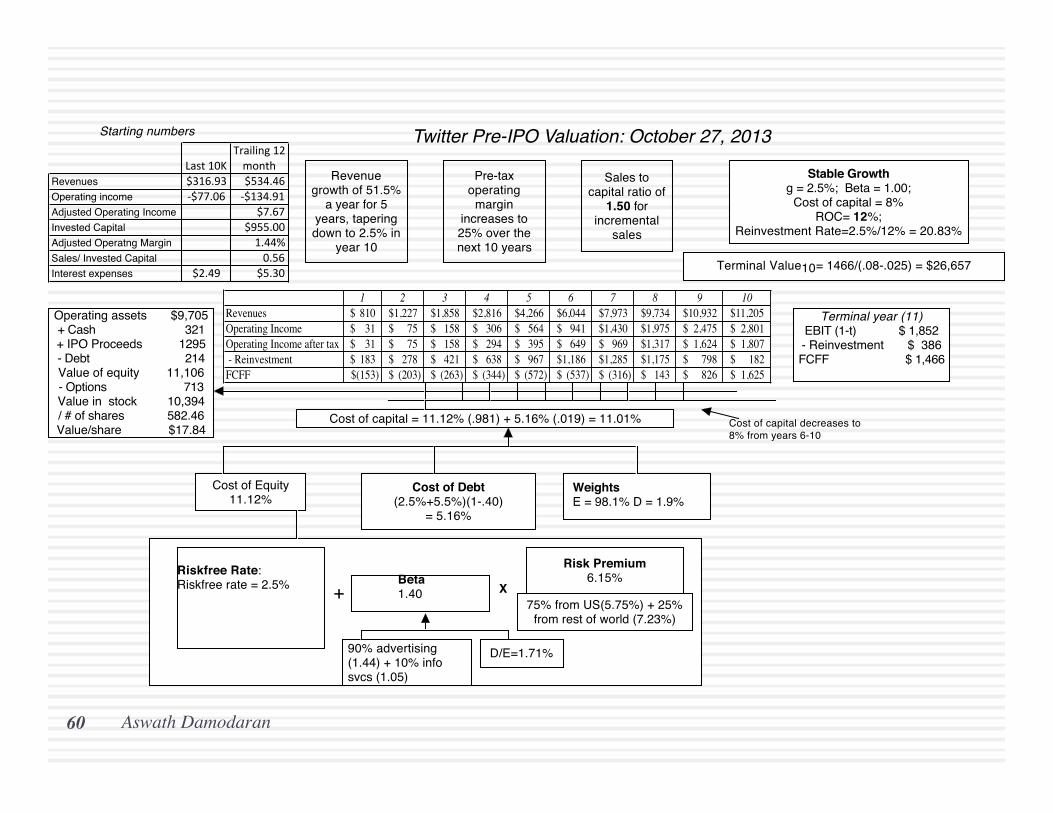
Terminal year (11)EBIT (1-t) $ 1,852- Reinvestment $ 386FCFF $ 1,466
Terminal Value10= 1466/(.08-.025) = $26,657
Cost of capital = 11.12% (.981) + 5.16% (.019) = 11.01%
90% advertising (1.44) + 10% info svcs (1.05)
Risk Premium6.15%
Operating assets $9,705+ Cash 321+ IPO Proceeds 1295- Debt 214Value of equity 11,106- Options 713Value in stock 10,394/ # of shares 582.46Value/share $17.84
Cost of Debt(2.5%+5.5%)(1-.40)
= 5.16%
Cost of Equity11.12%
Stable Growthg = 2.5%; Beta = 1.00;
Cost of capital = 8% ROC= 12%;
Reinvestment Rate=2.5%/12% = 20.83%
WeightsE = 98.1% D = 1.9%
Riskfree Rate:Riskfree rate = 2.5% +
Beta 1.40 X
Cost of capital decreases to 8% from years 6-10
D/E=1.71%
Twitter Pre-IPO Valuation: October 27, 2013
Revenue growth of 51.5%
a year for 5 years, tapering down to 2.5% in
year 10
Pre-tax operating
margin increases to 25% over the next 10 years
Sales to capital ratio of
1.50 for incremental
sales
Starting numbers
75% from US(5.75%) + 25% from rest of world (7.23%)
Last%10KTrailing%12%month
Revenues $316.93 $534.46Operating income :$77.06 :$134.91Adjusted Operating Income $7.67Invested Capital $955.00Adjusted Operatng Margin 1.44%Sales/ Invested Capital 0.56Interest expenses $2.49 $5.30
1 2 3 4 5 6 7 8 9 10Revenues 810$ 1,227$ 1,858$ 2,816$ 4,266$ 6,044$ 7,973$ 9,734$ 10,932$ 11,205$ Operating Income 31$ 75$ 158$ 306$ 564$ 941$ 1,430$ 1,975$ 2,475$ 2,801$ Operating Income after tax 31$ 75$ 158$ 294$ 395$ 649$ 969$ 1,317$ 1,624$ 1,807$ - Reinvestment 183$ 278$ 421$ 638$ 967$ 1,186$ 1,285$ 1,175$ 798$ 182$ FCFF (153)$ (203)$ (263)$ (344)$ (572)$ (537)$ (316)$ 143$ 826$ 1,625$
61!
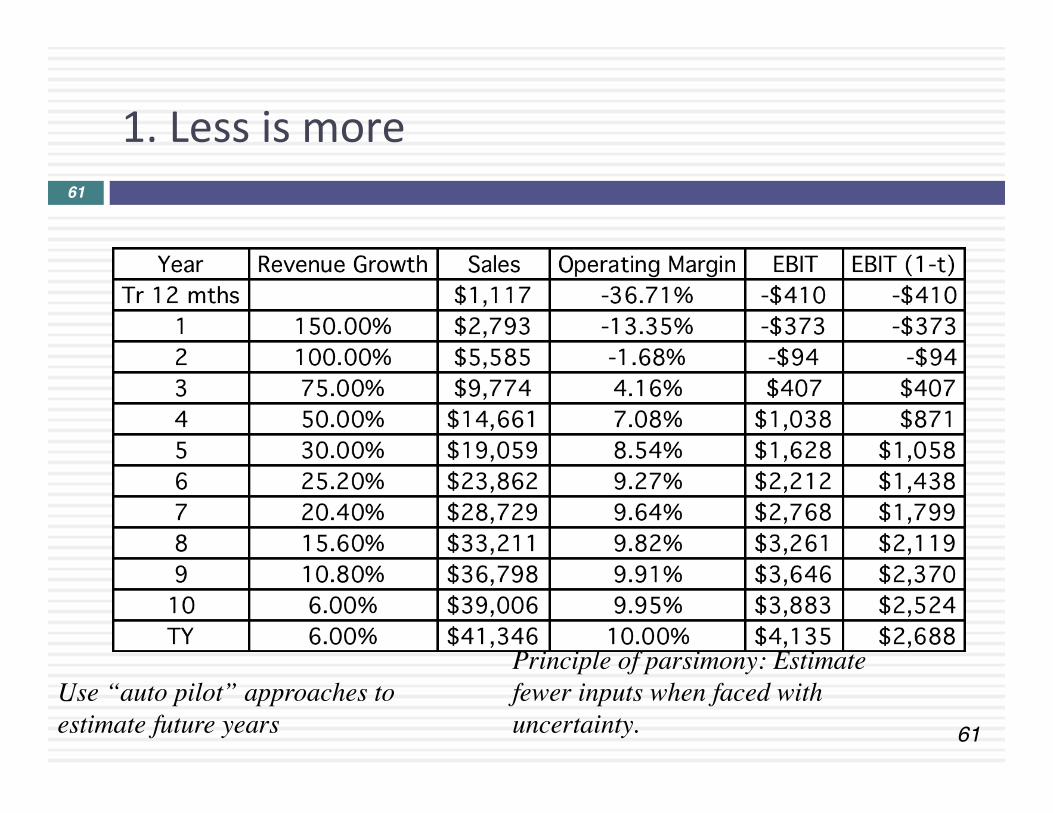
1. Less is more 61!
Principle of parsimony: Estimate fewer inputs when faced with uncertainty.
Use “auto pilot” approaches to estimate future years
62!
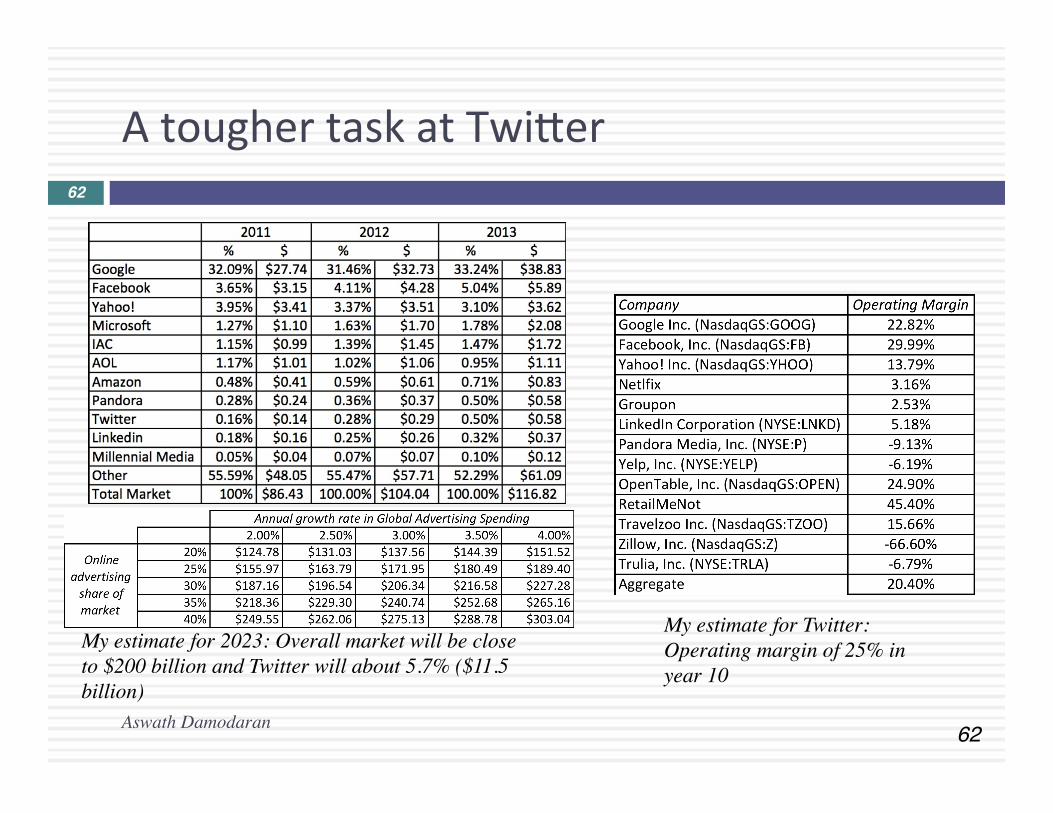
A tougher task at TwiTer
Aswath Damodaran
62!
My estimate for 2023: Overall market will be close to $200 billion and Twitter will about 5.7% ($11.5 billion)
My estimate for Twitter: Operating margin of 25% in year 10
63!
2. Build in “internal” checks for reasonableness…
Aswath Damodaran
63!
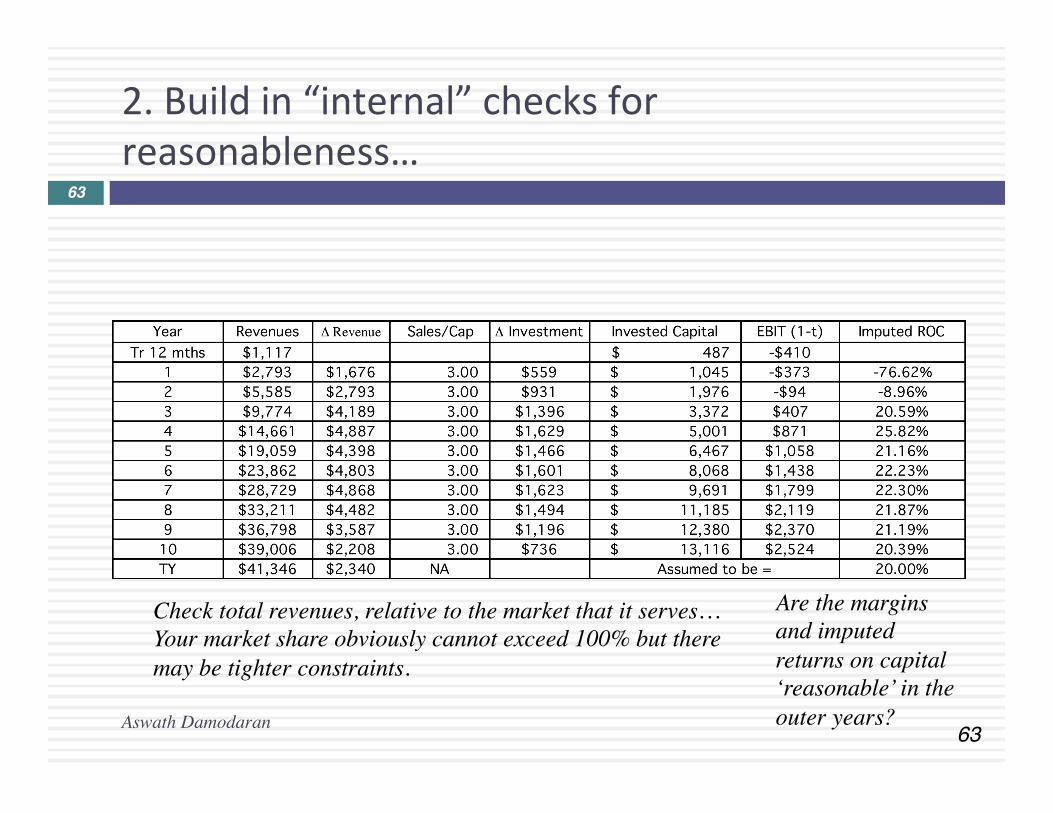
Check total revenues, relative to the market that it serves… Your market share obviously cannot exceed 100% but there may be tighter constraints.
Are the margins and imputed returns on capital ‘reasonable’ in the outer years?
64!
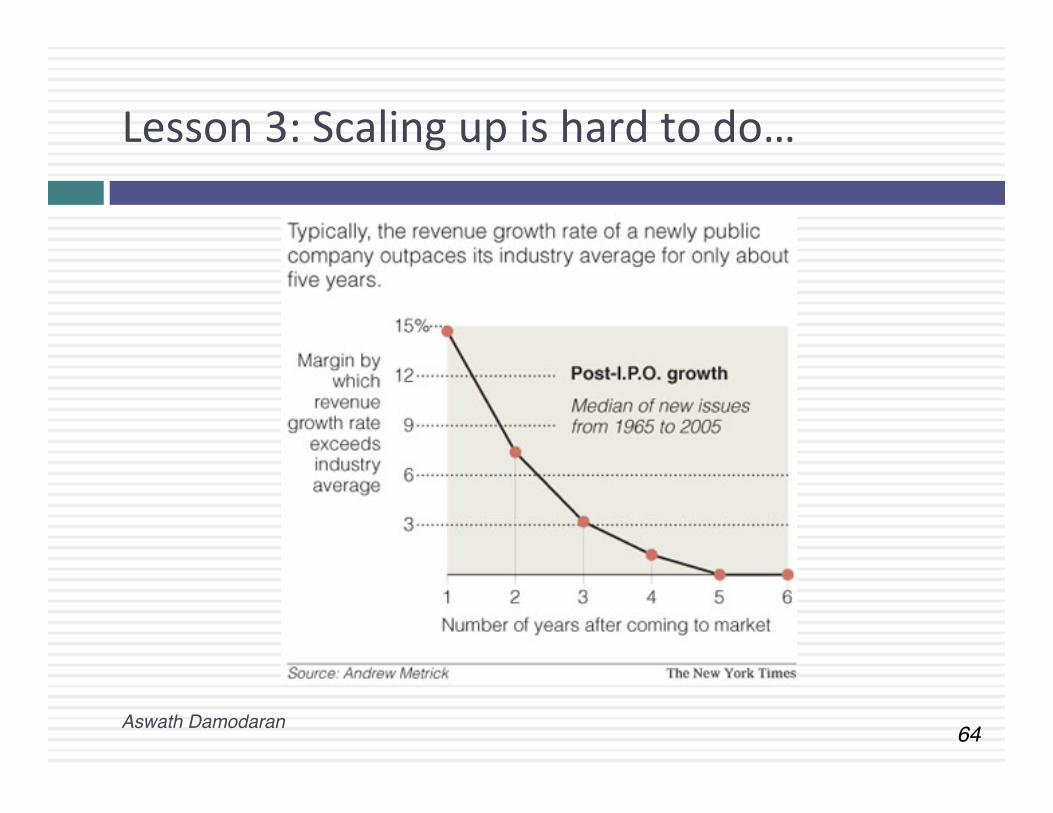
Lesson 3: Scaling up is hard to do…
Aswath Damodaran!
65!
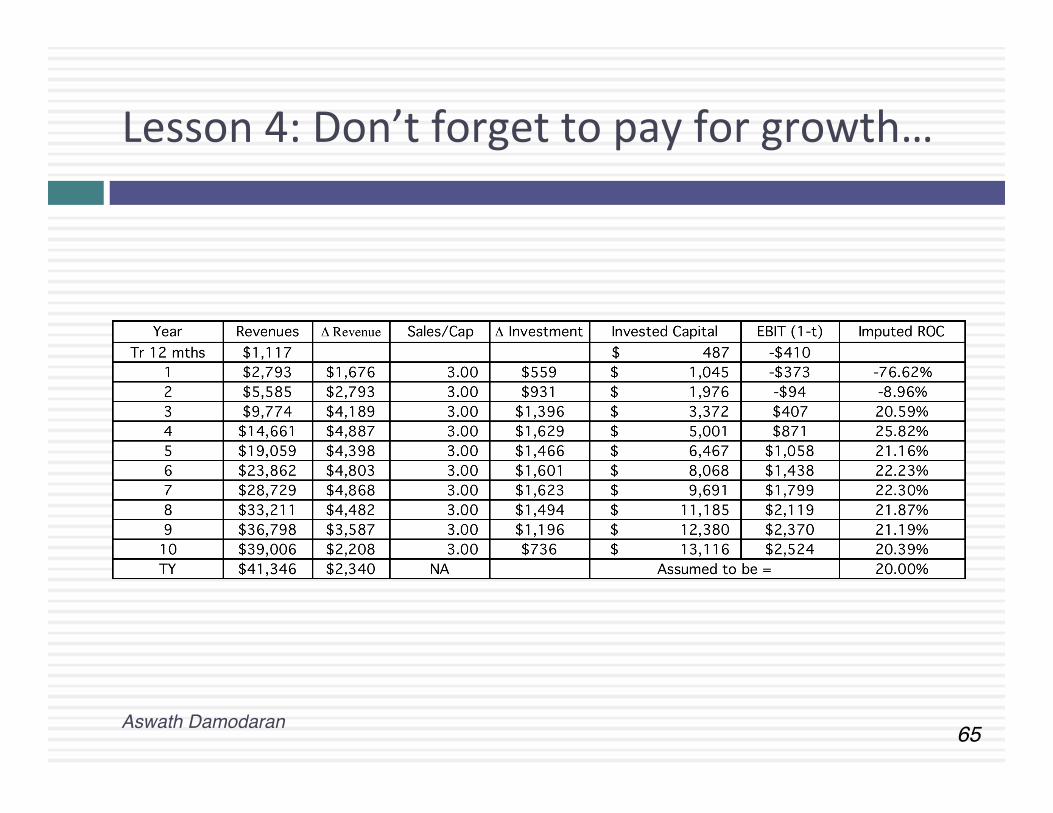
Lesson 4: Don’t forget to pay for growth…
Aswath Damodaran!
66!
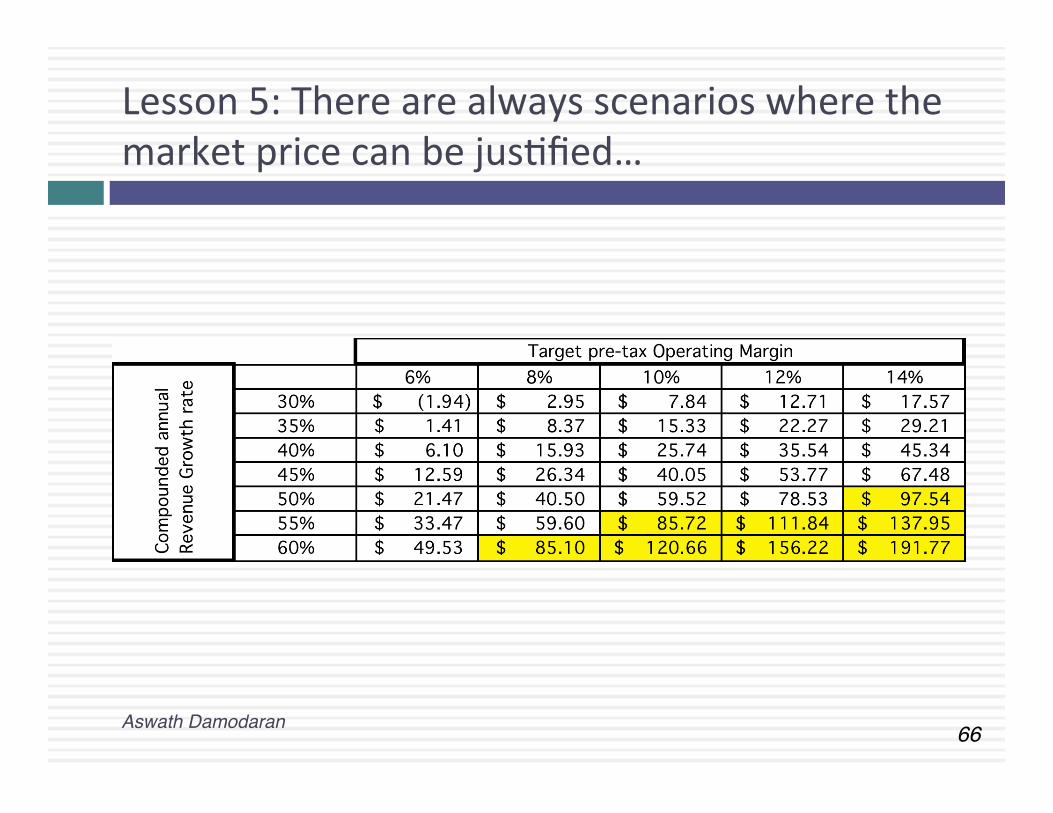
Lesson 5: There are always scenarios where the market price can be jusCfied…
Aswath Damodaran!
67!
Lesson 6: Don’t forget to mop up…
¨ Watch out for “other” equity claims: If you buy equity in a young, growth company, watch out for other (owen hidden) claims on the equity that don’t take the form of common shares. In parCcular, watch for opCons granted to managers, employees, venture capitalists and others (you will be surprised…). ¤ Value these opCons as opCons (not at exercise value) ¤ Take into consideraCon expectaCons of future opCon grants when compuCng expected future earnings/cash flows.
¨ Not all shares are equal: If there are differences in cash flow claims (dividends or liquidaCon) or voCng rights across shares, value these differences. ¤ VoCng rights maTer even at well run companies
Aswath Damodaran!
68!
Lesson 7: You will be wrong 100% of the Cme… and it really is not (always) your fault…
¨ No maTer how careful you are in ge{ng your inputs and how well structured your model is, your esCmate of value will change both as new informaCon comes out about the company, the business and the economy.
¨ As informaCon comes out, you will have to adjust and adapt your model to reflect the informaCon. Rather than be defensive about the resulCng changes in value, recognize that this is the essence of risk.
¨ A test: If your valuaCons are unbiased, you should find yourself increasing esCmated values as owen as you are decreasing values. In other words, there should be equal doses of good and bad news affecCng valuaCons (at least over Cme).
Aswath Damodaran!
69!
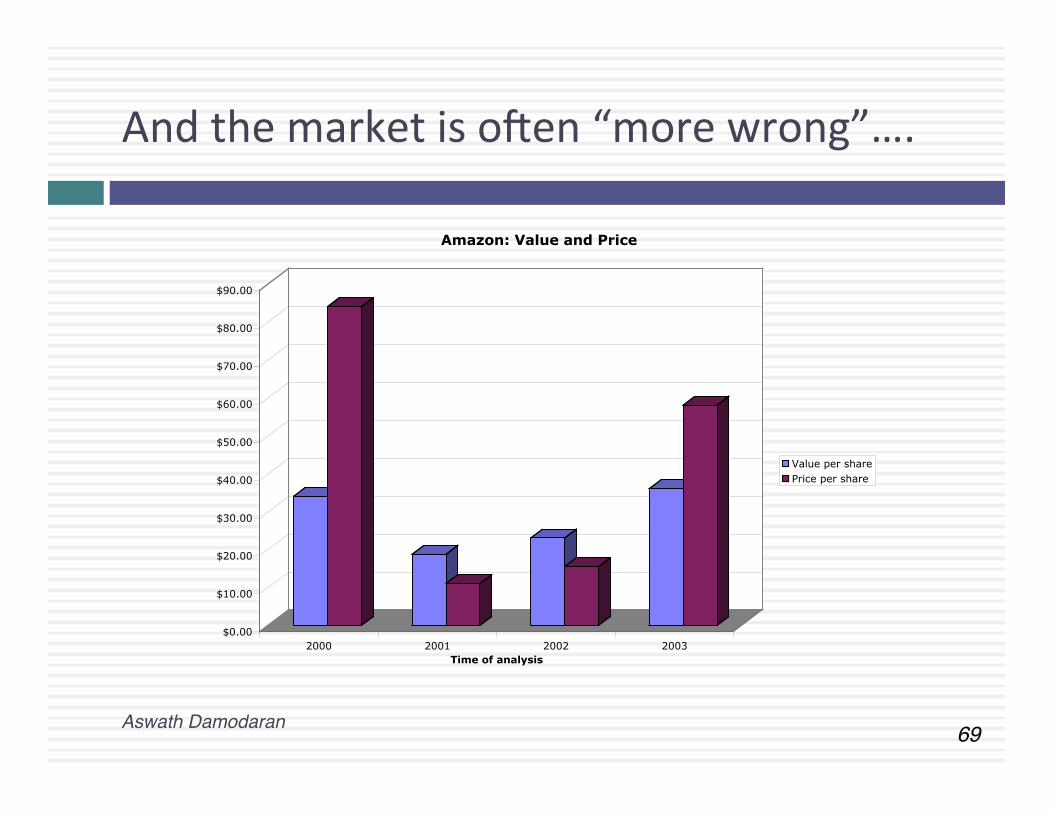
And the market is owen “more wrong”….
$0.00
$10.00
$20.00
$30.00
$40.00
$50.00
$60.00
$70.00
$80.00
$90.00
2000 2001 2002 2003Time of analysis
Amazon: Value and Price
Value per sharePrice per share
Aswath Damodaran!
70!
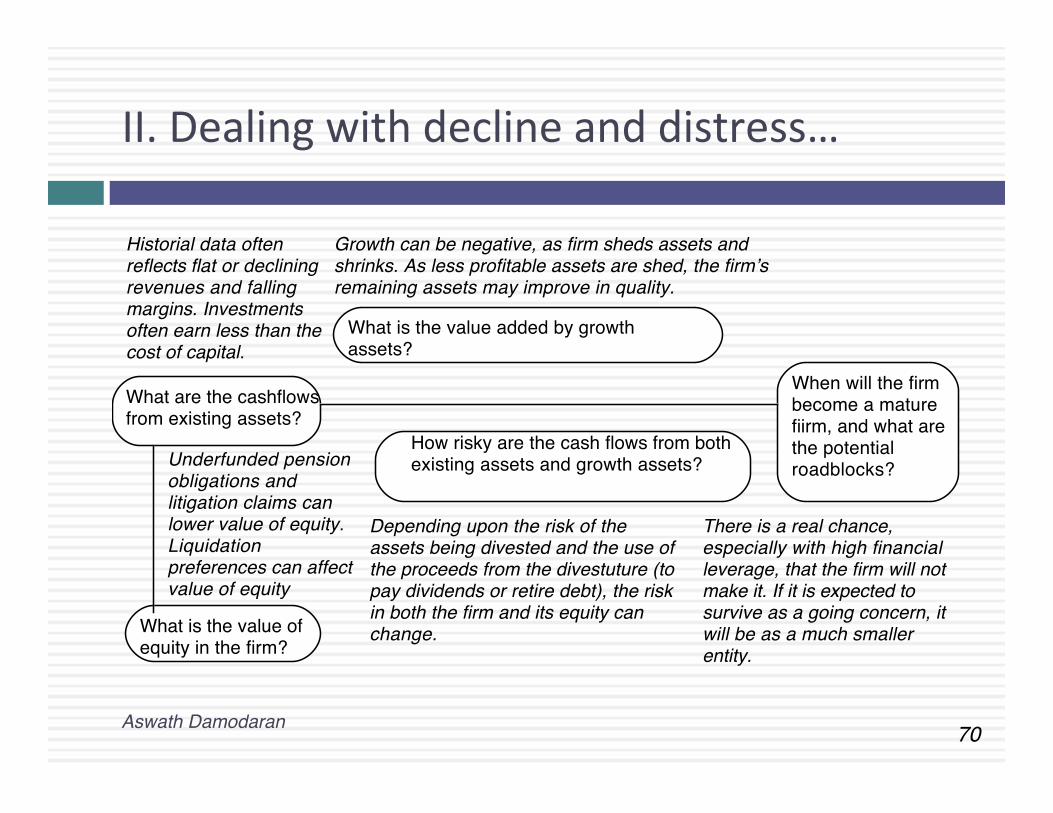
II. Dealing with decline and distress…
What are the cashflows from existing assets?
What is the value added by growth assets?
How risky are the cash flows from both existing assets and growth assets?
When will the firm become a mature fiirm, and what are the potential roadblocks?
Historial data often reflects flat or declining revenues and falling margins. Investments often earn less than the cost of capital.
Depending upon the risk of the assets being divested and the use of the proceeds from the divestuture (to pay dividends or retire debt), the risk in both the firm and its equity can change.
Growth can be negative, as firm sheds assets and shrinks. As less profitable assets are shed, the firm’s remaining assets may improve in quality.
There is a real chance, especially with high financial leverage, that the firm will not make it. If it is expected to survive as a going concern, it will be as a much smaller entity.
What is the value of equity in the firm?
Underfunded pension obligations and litigation claims can lower value of equity. Liquidation preferences can affect value of equity
Aswath Damodaran!
Forever
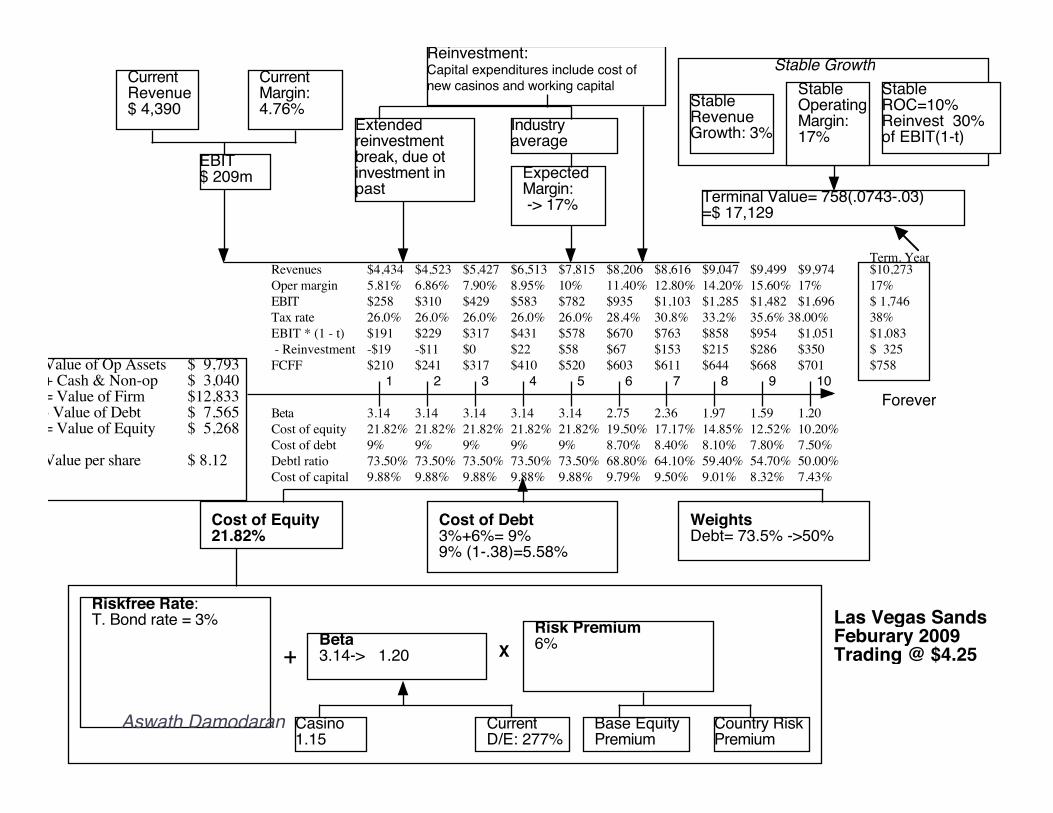
Terminal Value= 758(.0743-.03)=$ 17,129
Cost of Equity21.82%
Cost of Debt3%+6%= 9%9% (1-.38)=5.58%
WeightsDebt= 73.5% ->50%
Value of Op Assets $ 9,793+ Cash & Non-op $ 3,040= Value of Firm $12,833- Value of Debt $ 7,565= Value of Equity $ 5,268
Value per share $ 8.12
Riskfree Rate:T. Bond rate = 3%
+Beta3.14-> 1.20 X
Risk Premium6%
Casino1.15
Current D/E: 277%
Base EquityPremium
Country RiskPremium
CurrentRevenue$ 4,390
CurrentMargin:4.76%
Reinvestment:Capital expenditures include cost of new casinos and working capital
Extended reinvestment break, due ot investment in past
Industry average
Expected Margin: -> 17%
Stable Growth
StableRevenueGrowth: 3%
StableOperatingMargin: 17%
Stable ROC=10%Reinvest 30% of EBIT(1-t)
EBIT$ 209m
$10,27317%$ 1,74638%$1,083$ 325$758
Term. Year
2 431 5 6 8 9 107
Las Vegas SandsFeburary 2009Trading @ $4.25
Beta 3.14 3.14 3.14 3.14 3.14 2.75 2.36 1.97 1.59 1.20Cost of equity 21.82% 21.82% 21.82% 21.82% 21.82% 19.50% 17.17% 14.85% 12.52% 10.20%Cost of debt 9% 9% 9% 9% 9% 8.70% 8.40% 8.10% 7.80% 7.50%Debtl ratio 73.50% 73.50% 73.50% 73.50% 73.50% 68.80% 64.10% 59.40% 54.70% 50.00%Cost of capital 9.88% 9.88% 9.88% 9.88% 9.88% 9.79% 9.50% 9.01% 8.32% 7.43%
Revenues $4,434 $4,523 $5,427 $6,513 $7,815 $8,206 $8,616 $9,047 $9,499 $9,974Oper margin 5.81% 6.86% 7.90% 8.95% 10% 11.40% 12.80% 14.20% 15.60% 17%EBIT $258 $310 $429 $583 $782 $935 $1,103 $1,285 $1,482 $1,696Tax rate 26.0% 26.0% 26.0% 26.0% 26.0% 28.4% 30.8% 33.2% 35.6% 38.00%EBIT * (1 - t) $191 $229 $317 $431 $578 $670 $763 $858 $954 $1,051 - Reinvestment -$19 -$11 $0 $22 $58 $67 $153 $215 $286 $350FCFF $210 $241 $317 $410 $520 $603 $611 $644 $668 $701
Aswath Damodaran!
72!
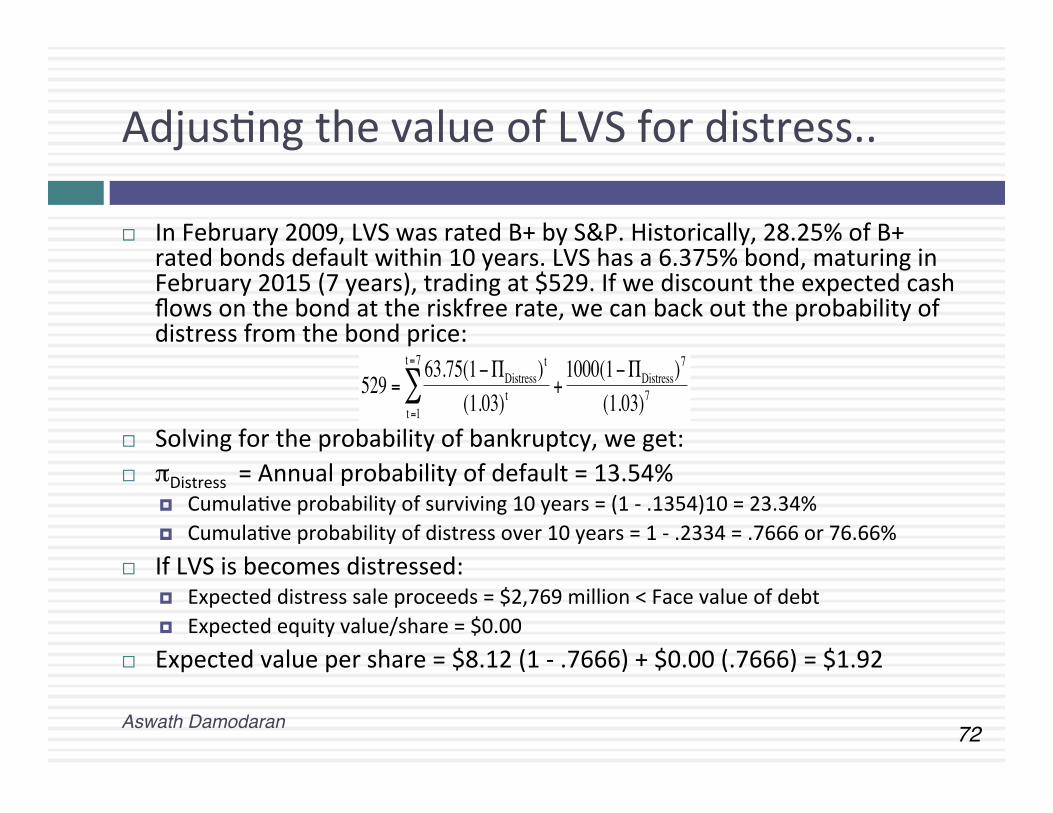
AdjusCng the value of LVS for distress..
¨ In February 2009, LVS was rated B+ by S&P. Historically, 28.25% of B+ rated bonds default within 10 years. LVS has a 6.375% bond, maturing in February 2015 (7 years), trading at $529. If we discount the expected cash flows on the bond at the riskfree rate, we can back out the probability of distress from the bond price:
¨ Solving for the probability of bankruptcy, we get: ¨ πDistress = Annual probability of default = 13.54%
¤ CumulaCve probability of surviving 10 years = (1 -‐ .1354)10 = 23.34% ¤ CumulaCve probability of distress over 10 years = 1 -‐ .2334 = .7666 or 76.66%
¨ If LVS is becomes distressed: ¤ Expected distress sale proceeds = $2,769 million < Face value of debt ¤ Expected equity value/share = $0.00
¨ Expected value per share = $8.12 (1 -‐ .7666) + $0.00 (.7666) = $1.92
€
529 =63.75(1−ΠDistress)
t
(1.03)tt=1
t=7
∑ +1000(1−ΠDistress)
7
(1.03)7
Aswath Damodaran!
73!
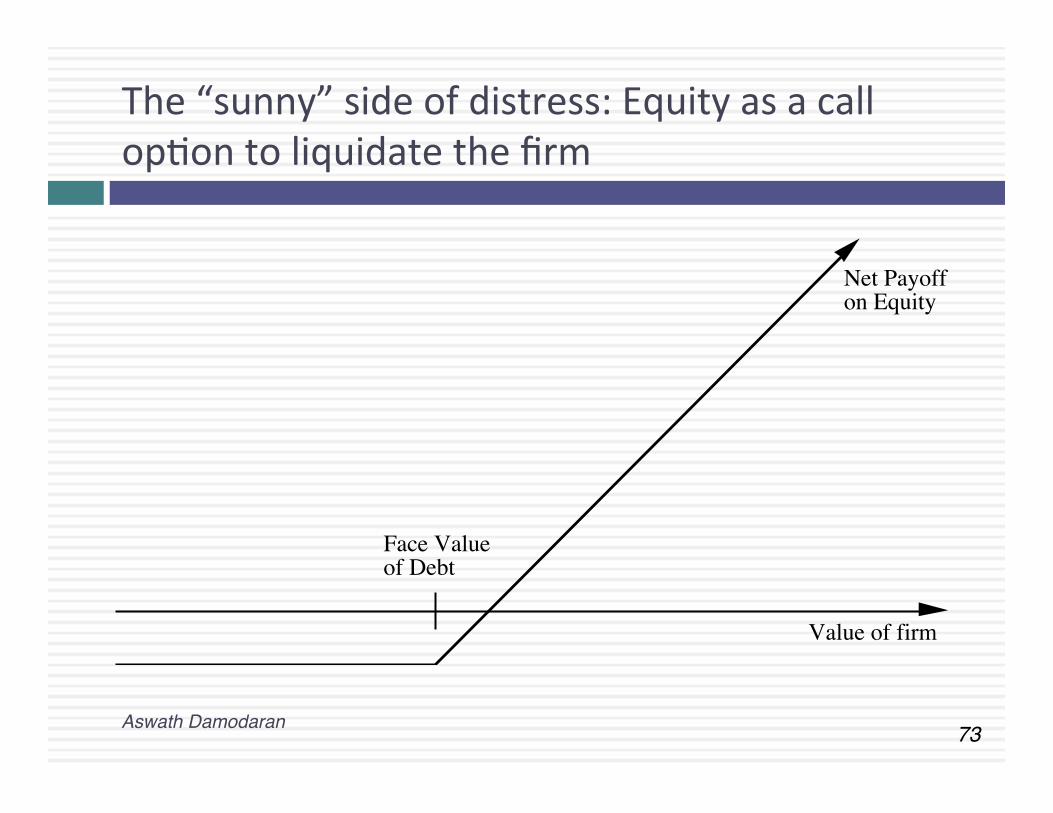
The “sunny” side of distress: Equity as a call opCon to liquidate the firm
Value of firm
Net Payoffon Equity
Face Valueof Debt
Aswath Damodaran!
74!
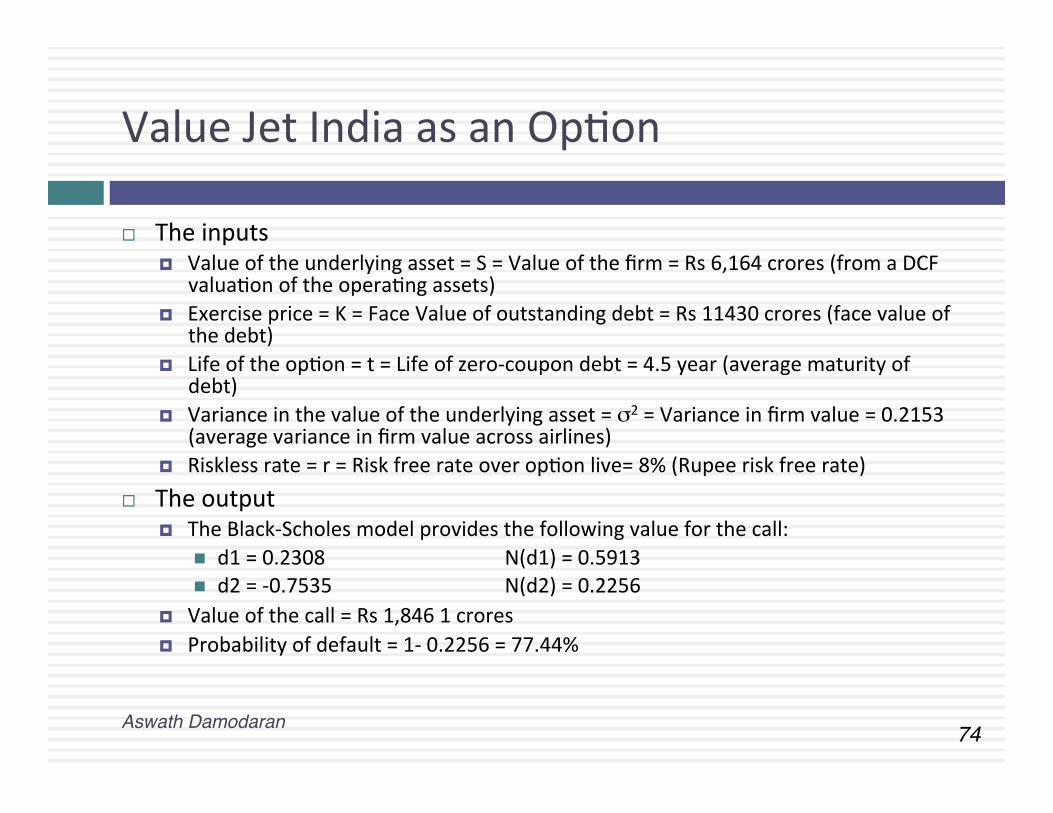
Value Jet India as an OpCon
¨ The inputs ¤ Value of the underlying asset = S = Value of the firm = Rs 6,164 crores (from a DCF
valuaCon of the operaCng assets) ¤ Exercise price = K = Face Value of outstanding debt = Rs 11430 crores (face value of
the debt) ¤ Life of the opCon = t = Life of zero-‐coupon debt = 4.5 year (average maturity of
debt) ¤ Variance in the value of the underlying asset = σ2 = Variance in firm value = 0.2153
(average variance in firm value across airlines) ¤ Riskless rate = r = Risk free rate over opCon live= 8% (Rupee risk free rate)
¨ The output ¤ The Black-‐Scholes model provides the following value for the call:
n d1 = 0.2308 N(d1) = 0.5913 n d2 = -‐0.7535 N(d2) = 0.2256
¤ Value of the call = Rs 1,846 1 crores ¤ Probability of default = 1-‐ 0.2256 = 77.44%
Aswath Damodaran!
75!
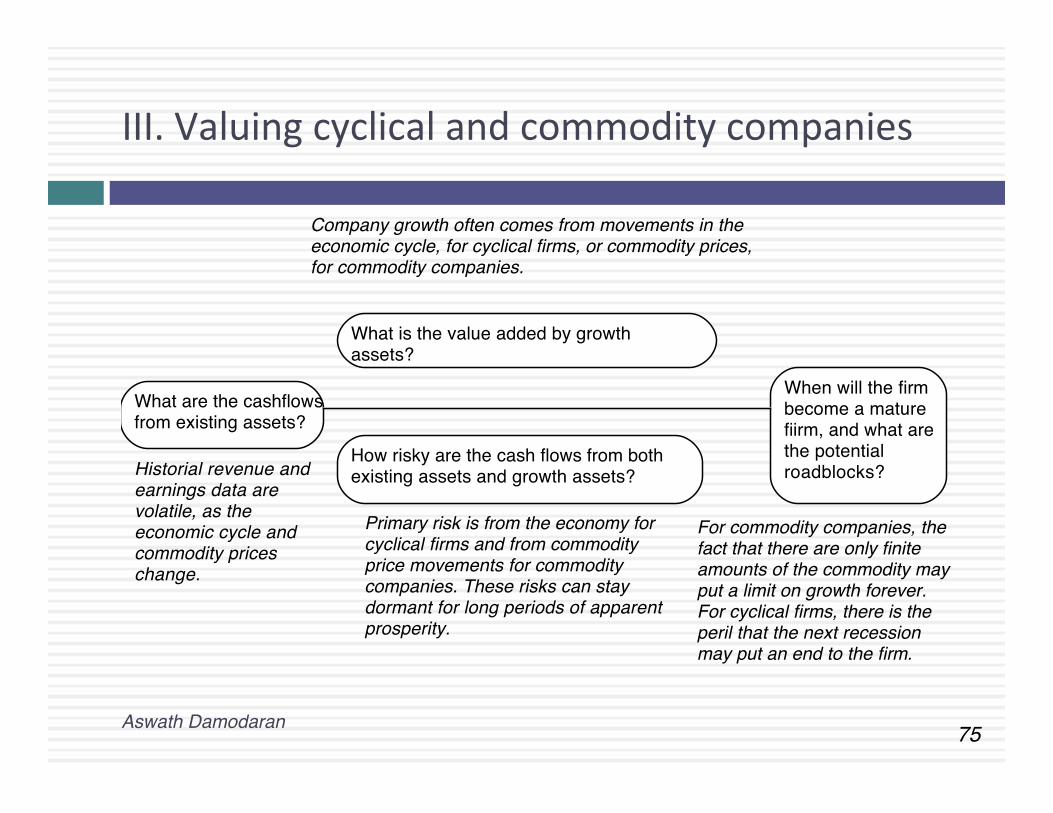
III. Valuing cyclical and commodity companies
What are the cashflows from existing assets?
What is the value added by growth assets?
How risky are the cash flows from both existing assets and growth assets?
When will the firm become a mature fiirm, and what are the potential roadblocks?Historial revenue and
earnings data are volatile, as the economic cycle and commodity prices change.
Primary risk is from the economy for cyclical firms and from commodity price movements for commodity companies. These risks can stay dormant for long periods of apparent prosperity.
Company growth often comes from movements in the economic cycle, for cyclical firms, or commodity prices, for commodity companies.
For commodity companies, the fact that there are only finite amounts of the commodity may put a limit on growth forever. For cyclical firms, there is the peril that the next recession may put an end to the firm.
Aswath Damodaran!
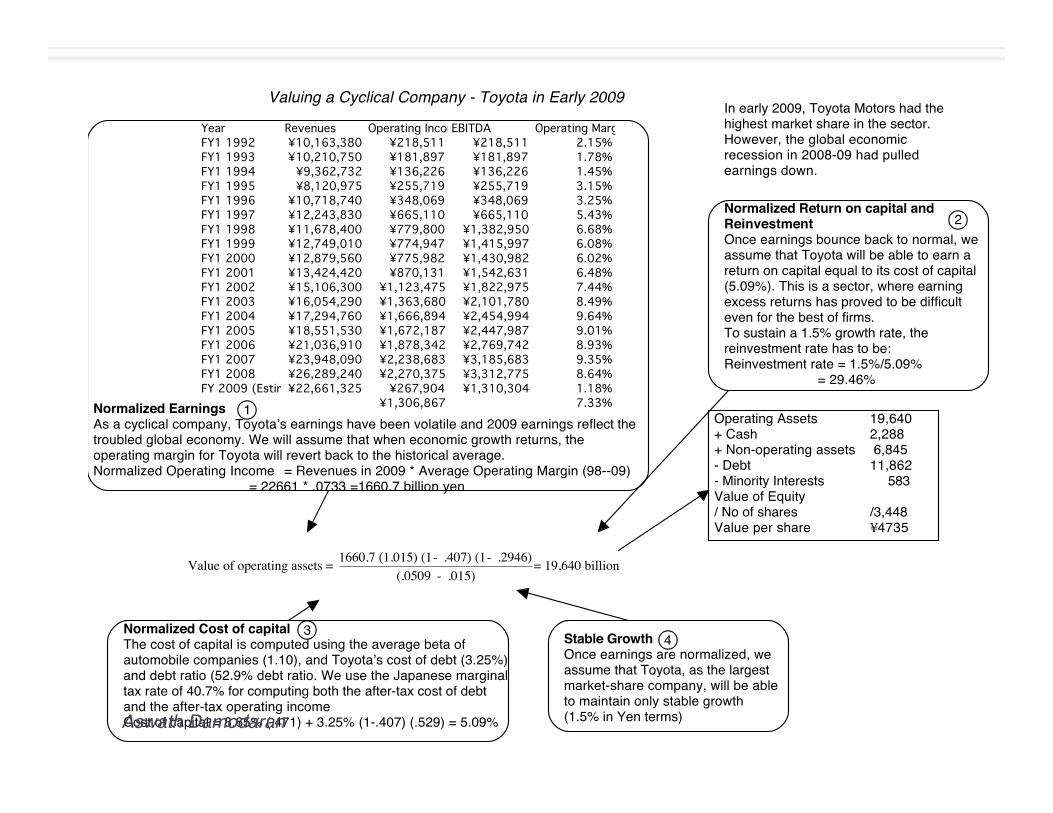
Valuing a Cyclical Company - Toyota in Early 2009
Normalized EarningsAs a cyclical company, Toyota’s earnings have been volatile and 2009 earnings reflect the troubled global economy. We will assume that when economic growth returns, the operating margin for Toyota will revert back to the historical average.Normalized Operating Income = Revenues in 2009 * Average Operating Margin (98--09)
= 22661 * .0733 =1660.7 billion yen
Normalized Cost of capitalThe cost of capital is computed using the average beta of automobile companies (1.10), and Toyota’s cost of debt (3.25%) and debt ratio (52.9% debt ratio. We use the Japanese marginal tax rate of 40.7% for computing both the after-tax cost of debt and the after-tax operating incomeCost of capital = 8.65% (.471) + 3.25% (1-.407) (.529) = 5.09%
Stable GrowthOnce earnings are normalized, we assume that Toyota, as the largest market-share company, will be able to maintain only stable growth (1.5% in Yen terms)
Normalized Return on capital and ReinvestmentOnce earnings bounce back to normal, we assume that Toyota will be able to earn a return on capital equal to its cost of capital (5.09%). This is a sector, where earning excess returns has proved to be difficult even for the best of firms.To sustain a 1.5% growth rate, the reinvestment rate has to be:Reinvestment rate = 1.5%/5.09%
= 29.46%
Operating Assets 19,640+ Cash 2,288+ Non-operating assets 6,845- Debt 11,862- Minority Interests 583Value of Equity/ No of shares /3,448Value per share ¥4735
In early 2009, Toyota Motors had the highest market share in the sector. However, the global economic recession in 2008-09 had pulled earnings down.
1
2
34
Year Revenues Operating IncomeEBITDA Operating MarginFY1 1992 ¥10,163,380 ¥218,511 ¥218,511 2.15%FY1 1993 ¥10,210,750 ¥181,897 ¥181,897 1.78%FY1 1994 ¥9,362,732 ¥136,226 ¥136,226 1.45%FY1 1995 ¥8,120,975 ¥255,719 ¥255,719 3.15%FY1 1996 ¥10,718,740 ¥348,069 ¥348,069 3.25%FY1 1997 ¥12,243,830 ¥665,110 ¥665,110 5.43%FY1 1998 ¥11,678,400 ¥779,800 ¥1,382,950 6.68%FY1 1999 ¥12,749,010 ¥774,947 ¥1,415,997 6.08%FY1 2000 ¥12,879,560 ¥775,982 ¥1,430,982 6.02%FY1 2001 ¥13,424,420 ¥870,131 ¥1,542,631 6.48%FY1 2002 ¥15,106,300 ¥1,123,475 ¥1,822,975 7.44%FY1 2003 ¥16,054,290 ¥1,363,680 ¥2,101,780 8.49%FY1 2004 ¥17,294,760 ¥1,666,894 ¥2,454,994 9.64%FY1 2005 ¥18,551,530 ¥1,672,187 ¥2,447,987 9.01%FY1 2006 ¥21,036,910 ¥1,878,342 ¥2,769,742 8.93%FY1 2007 ¥23,948,090 ¥2,238,683 ¥3,185,683 9.35%FY1 2008 ¥26,289,240 ¥2,270,375 ¥3,312,775 8.64%FY 2009 (Estimate)¥22,661,325 ¥267,904 ¥1,310,304 1.18%
¥1,306,867 7.33%
Value of operating assets =
€
1660.7 (1.015) (1- .407) (1- .2946)(.0509 - .015)
= 19,640 billion
Aswath Damodaran!
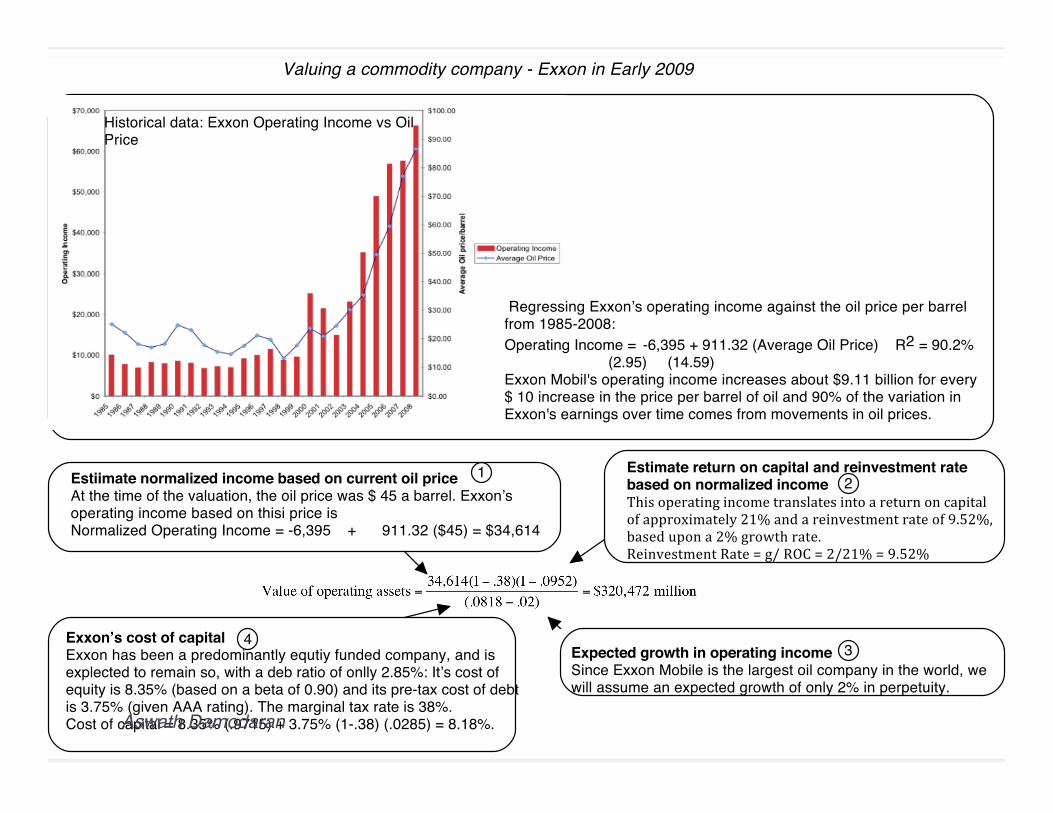
Valuing a commodity company - Exxon in Early 2009
Historical data: Exxon Operating Income vs Oil Price
Regressing Exxonʼs operating income against the oil price per barrel from 1985-2008:Operating Income = -6,395 + 911.32 (Average Oil Price) R2 = 90.2%
(2.95) (14.59)Exxon Mobil's operating income increases about $9.11 billion for every $ 10 increase in the price per barrel of oil and 90% of the variation in Exxon's earnings over time comes from movements in oil prices.
Estiimate normalized income based on current oil priceAt the time of the valuation, the oil price was $ 45 a barrel. Exxonʼs operating income based on thisi price isNormalized Operating Income = -6,395 + 911.32 ($45) = $34,614
Estimate return on capital and reinvestment rate based on normalized incomeThis%operating%income%translates%into%a%return%on%capital%of%approximately%21%%and%a%reinvestment%rate%of%9.52%,%based%upon%a%2%%growth%rate.%%Reinvestment%Rate%=%g/%ROC%=%2/21%%=%9.52%
Expected growth in operating incomeSince Exxon Mobile is the largest oil company in the world, we will assume an expected growth of only 2% in perpetuity.
Exxonʼs cost of capitalExxon has been a predominantly equtiy funded company, and is explected to remain so, with a deb ratio of onlly 2.85%: Itʼs cost of equity is 8.35% (based on a beta of 0.90) and its pre-tax cost of debt is 3.75% (given AAA rating). The marginal tax rate is 38%.Cost of capital = 8.35% (.9715) + 3.75% (1-.38) (.0285) = 8.18%.
12
34
Aswath Damodaran!
78!
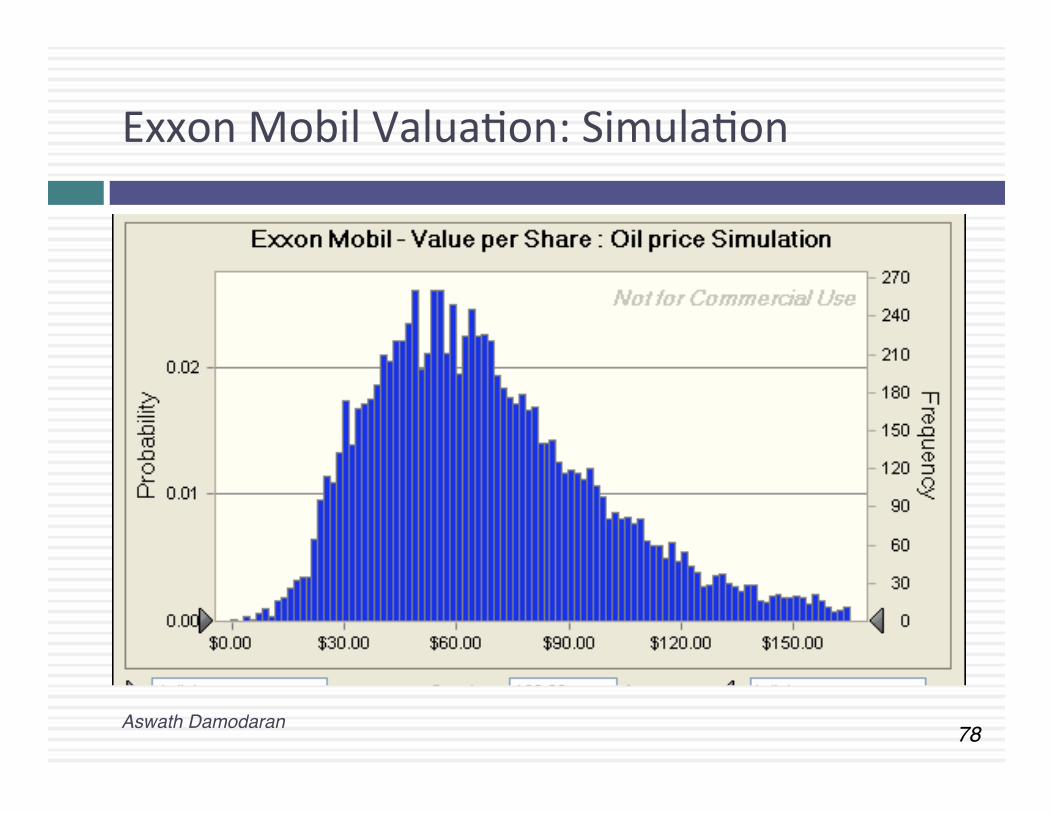
Exxon Mobil ValuaCon: SimulaCon
Aswath Damodaran!
79!
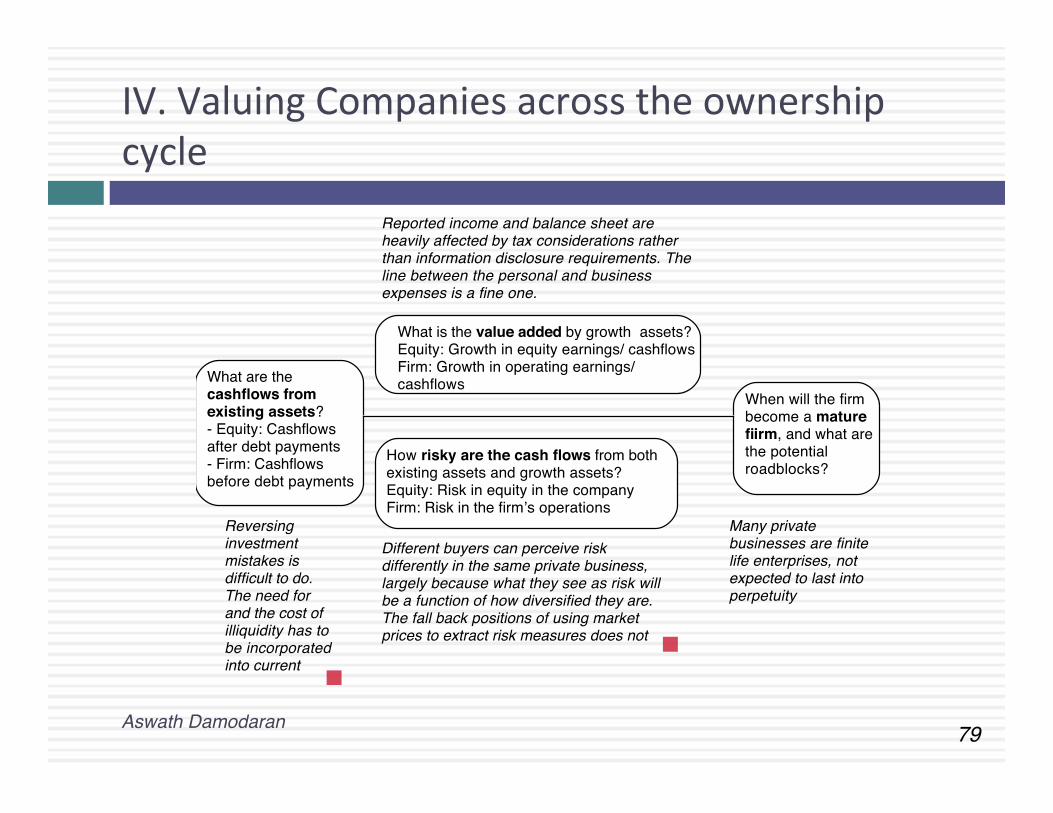
IV. Valuing Companies across the ownership cycle
What are the cashflows from existing assets?- Equity: Cashflows after debt payments- Firm: Cashflows before debt payments
What is the value added by growth assets?Equity: Growth in equity earnings/ cashflowsFirm: Growth in operating earnings/ cashflows
How risky are the cash flows from both existing assets and growth assets?Equity: Risk in equity in the companyFirm: Risk in the firm’s operations
When will the firm become a mature fiirm, and what are the potential roadblocks?
Different buyers can perceive risk differently in the same private business, largely because what they see as risk will be a function of how diversified they are. The fall back positions of using market prices to extract risk measures does not
Reported income and balance sheet are heavily affected by tax considerations rather than information disclosure requirements. The line between the personal and business expenses is a fine one.
Reversing investment mistakes is difficult to do. The need for and the cost of illiquidity has to be incorporated into current
Many private businesses are finite life enterprises, not expected to last into perpetuity
Aswath Damodaran!
Current Cashflow to FirmEBIT(1-t) : 300- Nt CpX 100- Chg WC 40= FCFF 160Reinvestment Rate = 46.67%
Expected Growth in EBIT (1-t).4667*.1364= .06366.36%
Stable Growthg = 4%; Beta =3.00; ROC= 12.54%Reinvestment Rate=31.90%
Terminal Value5= 289/(.1254-.04) = 3,403
Cost of Equity16.26%
Cost of Debt(4.5%+1.00)(1-.40)= 3.30% Weights
E =70% D = 30%
Discount at Cost of Capital (WACC) = 16.26% (.70) + 3.30% (.30) = 12.37%
Firm Value: 2,571+ Cash 125- Debt: 900=Equity 1,796- Illiq Discount 12.5%Adj Value 1,571
Riskfree Rate:Riskfree rate = 4.50%(10-year T.Bond rate)
+Total Beta 2.94 X
Risk Premium4.00%
Unlevered Beta for Sectors: 0.78
Firmʼs D/ERatio: 30/70
Mature riskpremium4%
Country RiskPremium0%
Kristinʼs Kandy: Valuation in March 2006Reinvestment Rate46.67%
Return on Capital13.64%
Term Yr425136289
Synthetic rating = A-
Year 1 2 3 4 5EBIT (1-t) $319 $339 $361 $384 $408 - Reinvestment $149 $158 $168 $179 $191 =FCFF $170 $181 $193 $205 $218
Market Beta: 0.98
Adjusted for ownrernon-diversification
1/3 of risk is market risk
Aswath Damodaran!
81!
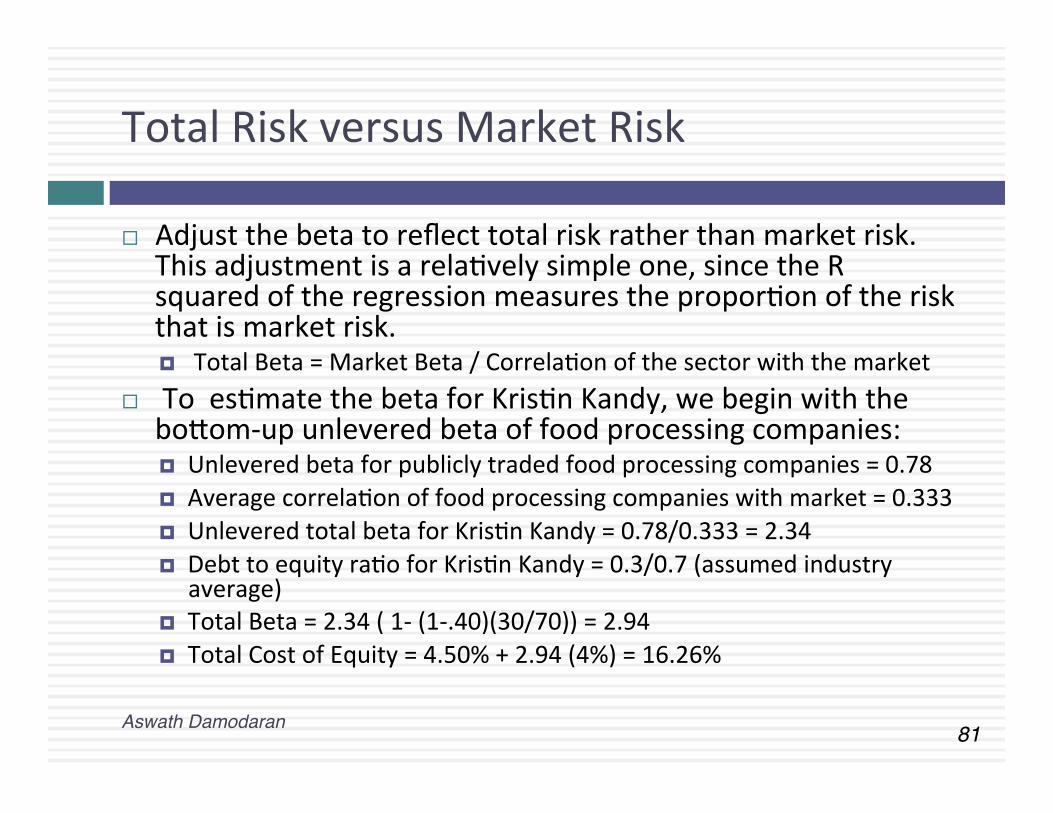
Total Risk versus Market Risk
¨ Adjust the beta to reflect total risk rather than market risk. This adjustment is a relaCvely simple one, since the R squared of the regression measures the proporCon of the risk that is market risk. ¤ Total Beta = Market Beta / CorrelaCon of the sector with the market
¨ To esCmate the beta for KrisCn Kandy, we begin with the boTom-‐up unlevered beta of food processing companies: ¤ Unlevered beta for publicly traded food processing companies = 0.78 ¤ Average correlaCon of food processing companies with market = 0.333 ¤ Unlevered total beta for KrisCn Kandy = 0.78/0.333 = 2.34 ¤ Debt to equity raCo for KrisCn Kandy = 0.3/0.7 (assumed industry
average) ¤ Total Beta = 2.34 ( 1-‐ (1-‐.40)(30/70)) = 2.94 ¤ Total Cost of Equity = 4.50% + 2.94 (4%) = 16.26%
Aswath Damodaran!
RELATIVE VALUATION
Aswath Damodaran
Aswath Damodaran!
83!
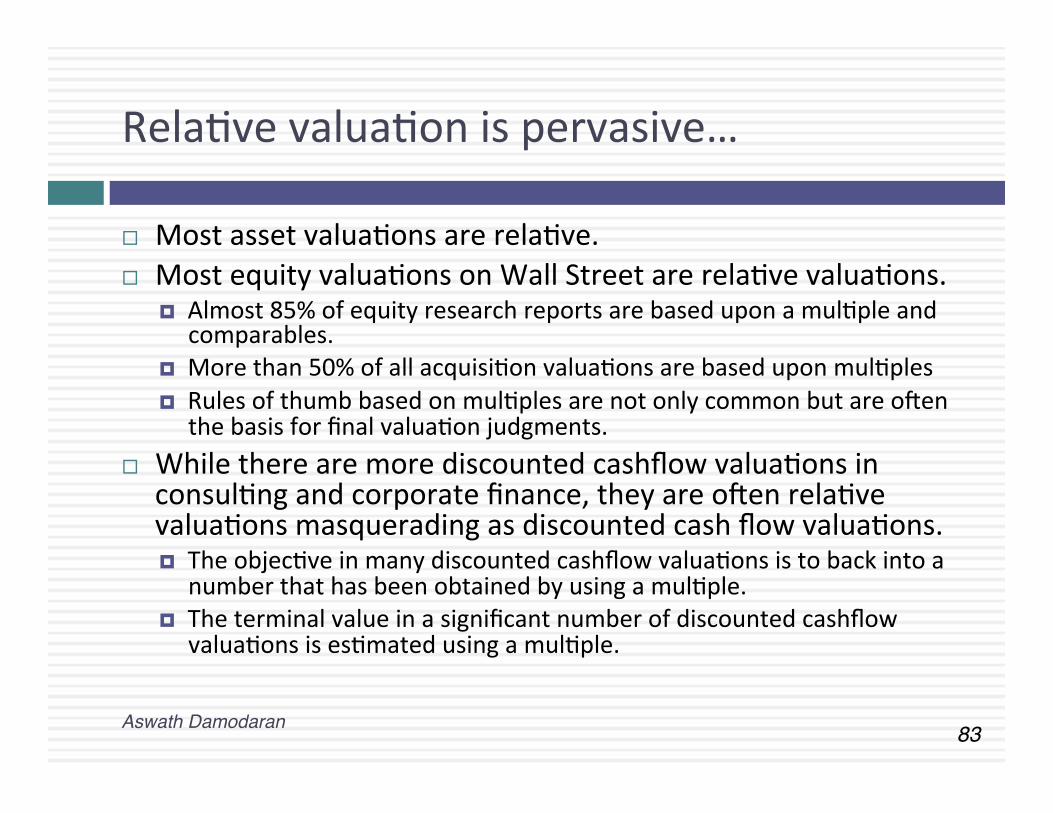
RelaCve valuaCon is pervasive…
Aswath Damodaran!
¨ Most asset valuaCons are relaCve. ¨ Most equity valuaCons on Wall Street are relaCve valuaCons.
¤ Almost 85% of equity research reports are based upon a mulCple and comparables.
¤ More than 50% of all acquisiCon valuaCons are based upon mulCples ¤ Rules of thumb based on mulCples are not only common but are owen
the basis for final valuaCon judgments. ¨ While there are more discounted cashflow valuaCons in
consulCng and corporate finance, they are owen relaCve valuaCons masquerading as discounted cash flow valuaCons. ¤ The objecCve in many discounted cashflow valuaCons is to back into a
number that has been obtained by using a mulCple. ¤ The terminal value in a significant number of discounted cashflow
valuaCons is esCmated using a mulCple.
84!
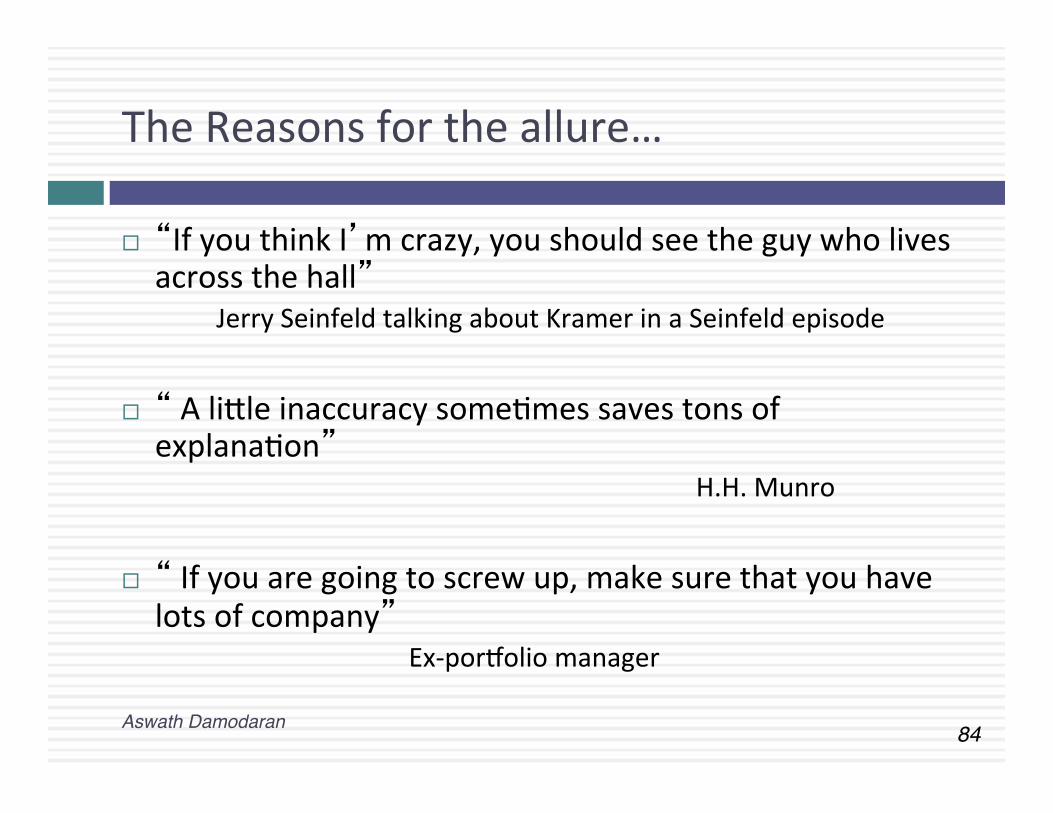
The Reasons for the allure…
Aswath Damodaran!
¨ “If you think I’m crazy, you should see the guy who lives across the hall”
Jerry Seinfeld talking about Kramer in a Seinfeld episode
¨ “ A liTle inaccuracy someCmes saves tons of explanaCon”
H.H. Munro
¨ “ If you are going to screw up, make sure that you have lots of company”
Ex-‐por�olio manager
85!
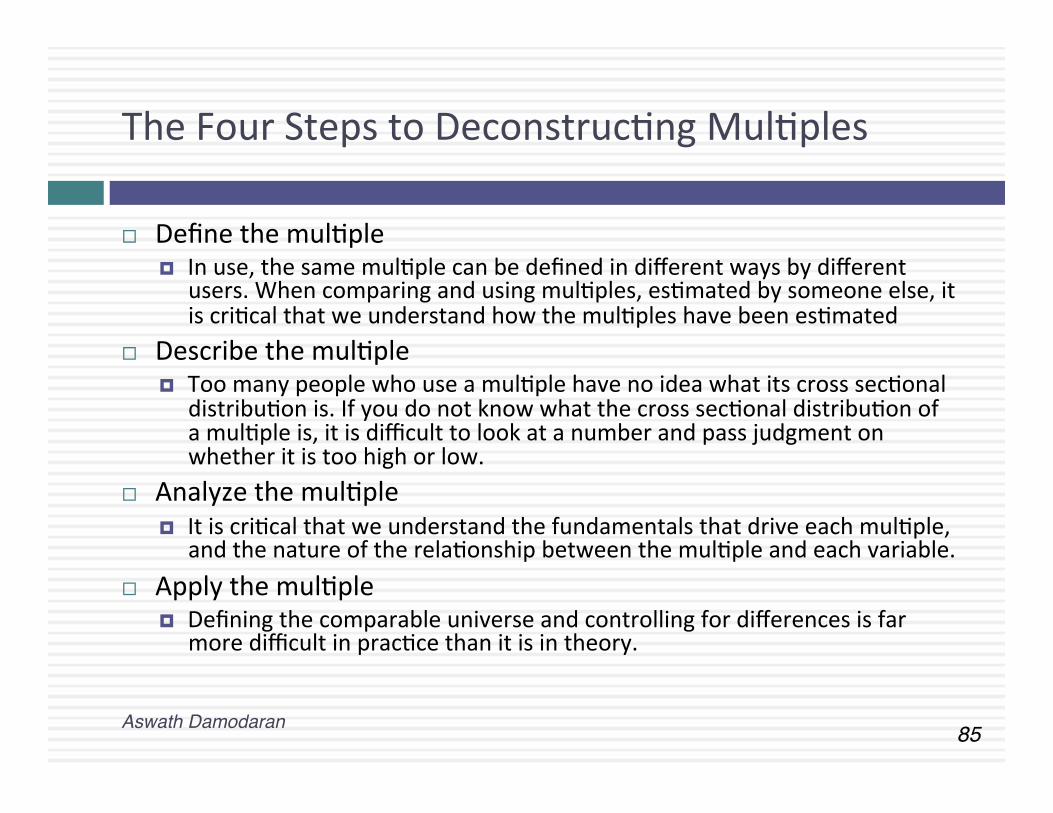
The Four Steps to DeconstrucCng MulCples
Aswath Damodaran!
¨ Define the mulCple ¤ In use, the same mulCple can be defined in different ways by different
users. When comparing and using mulCples, esCmated by someone else, it is criCcal that we understand how the mulCples have been esCmated
¨ Describe the mulCple ¤ Too many people who use a mulCple have no idea what its cross secConal
distribuCon is. If you do not know what the cross secConal distribuCon of a mulCple is, it is difficult to look at a number and pass judgment on whether it is too high or low.
¨ Analyze the mulCple ¤ It is criCcal that we understand the fundamentals that drive each mulCple,
and the nature of the relaConship between the mulCple and each variable. ¨ Apply the mulCple
¤ Defining the comparable universe and controlling for differences is far more difficult in pracCce than it is in theory.
86!
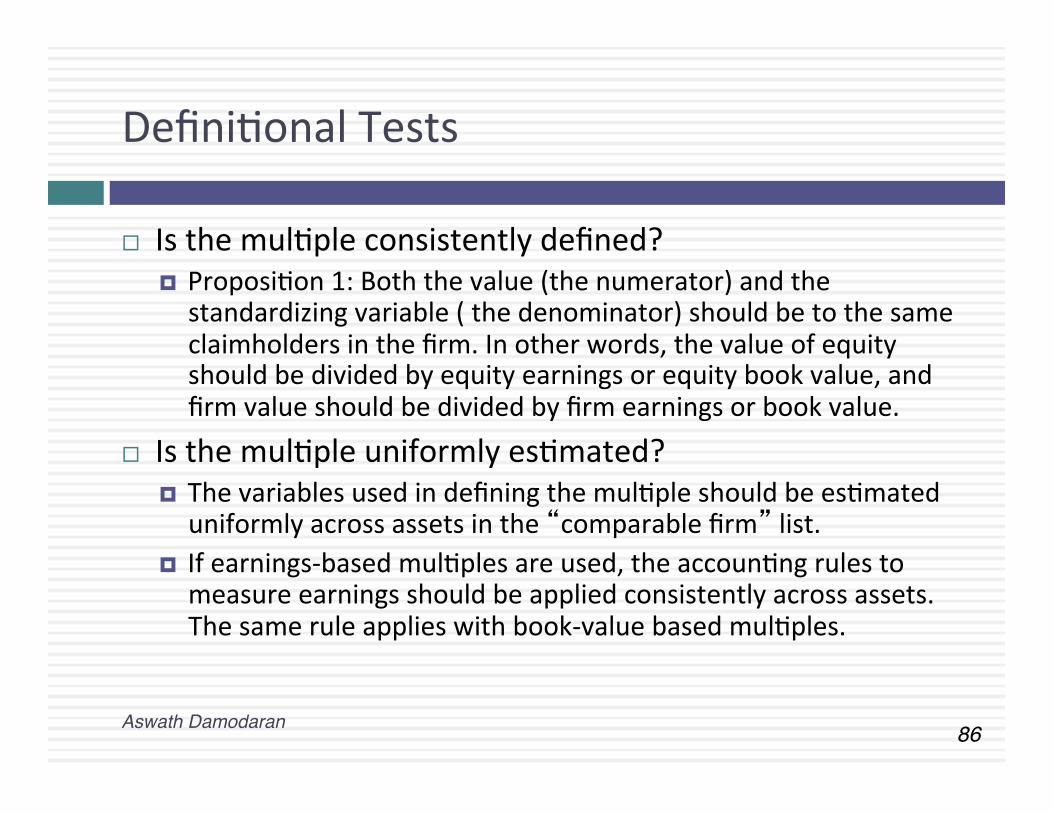
DefiniConal Tests
Aswath Damodaran!
¨ Is the mulCple consistently defined? ¤ ProposiCon 1: Both the value (the numerator) and the standardizing variable ( the denominator) should be to the same claimholders in the firm. In other words, the value of equity should be divided by equity earnings or equity book value, and firm value should be divided by firm earnings or book value.
¨ Is the mulCple uniformly esCmated? ¤ The variables used in defining the mulCple should be esCmated uniformly across assets in the “comparable firm” list.
¤ If earnings-‐based mulCples are used, the accounCng rules to measure earnings should be applied consistently across assets. The same rule applies with book-‐value based mulCples.
87!
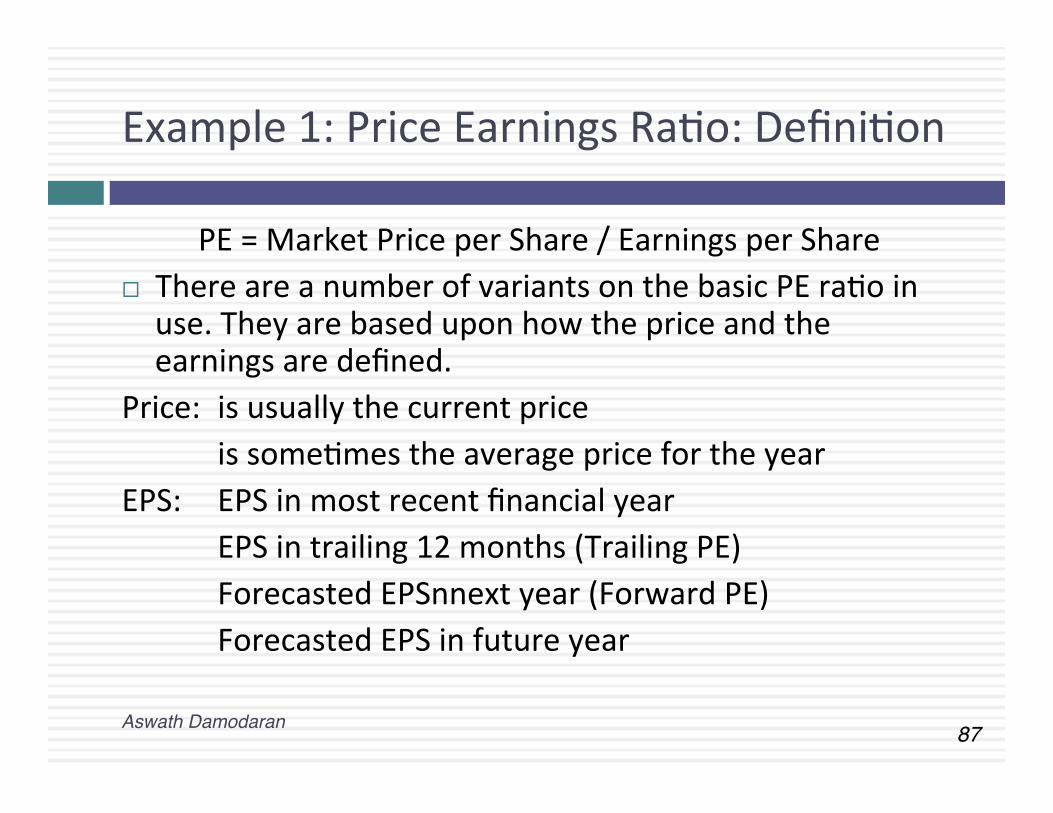
Example 1: Price Earnings RaCo: DefiniCon
Aswath Damodaran!
PE = Market Price per Share / Earnings per Share ¨ There are a number of variants on the basic PE raCo in use. They are based upon how the price and the earnings are defined.
Price: is usually the current price is someCmes the average price for the year
EPS: EPS in most recent financial year EPS in trailing 12 months (Trailing PE) Forecasted EPSnnext year (Forward PE) Forecasted EPS in future year
88!
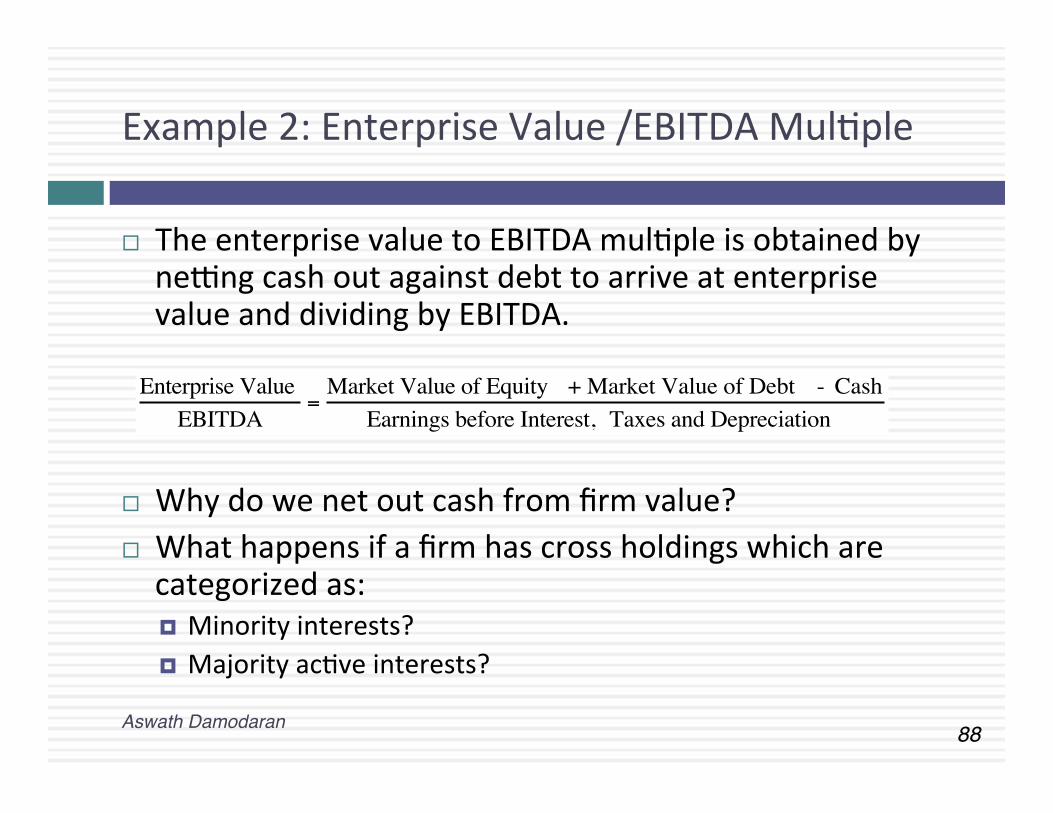
Example 2: Enterprise Value /EBITDA MulCple
Aswath Damodaran!
¨ The enterprise value to EBITDA mulCple is obtained by ne{ng cash out against debt to arrive at enterprise value and dividing by EBITDA.
¨ Why do we net out cash from firm value? ¨ What happens if a firm has cross holdings which are categorized as: ¤ Minority interests? ¤ Majority acCve interests?
€
Enterprise ValueEBITDA
=Market Value of Equity + Market Value of Debt - Cash
Earnings before Interest, Taxes and Depreciation
89!
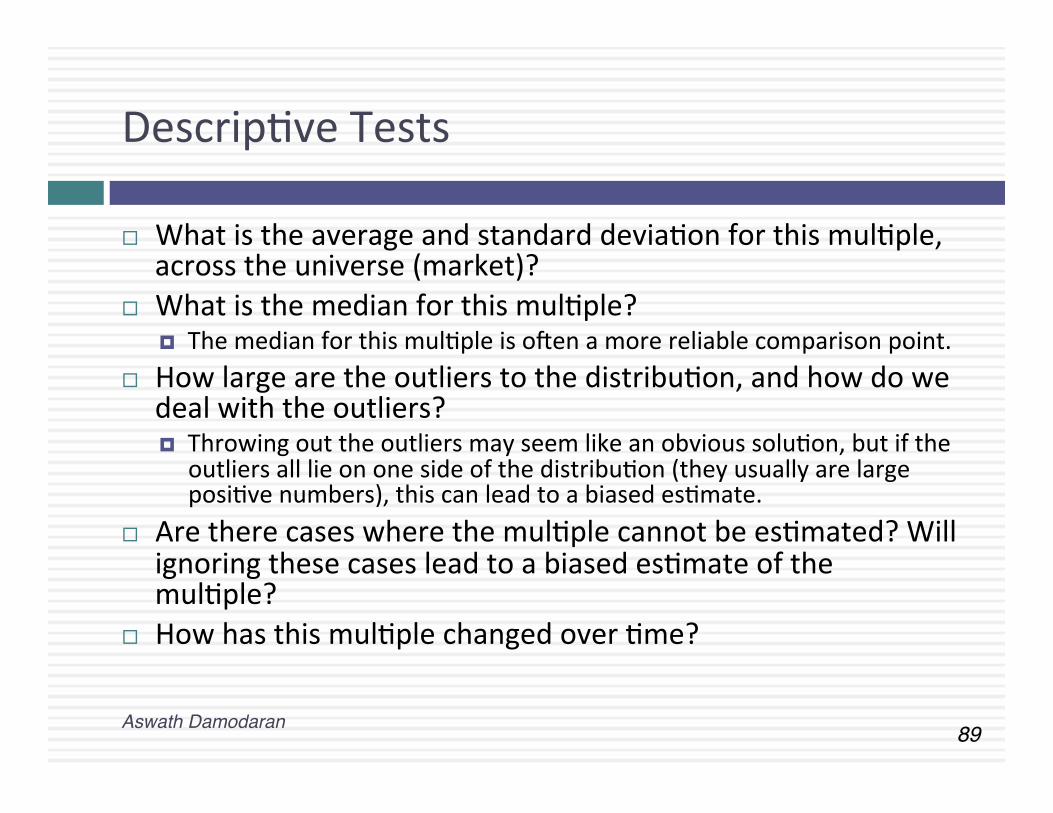
DescripCve Tests
Aswath Damodaran!
¨ What is the average and standard deviaCon for this mulCple, across the universe (market)?
¨ What is the median for this mulCple? ¤ The median for this mulCple is owen a more reliable comparison point.
¨ How large are the outliers to the distribuCon, and how do we deal with the outliers? ¤ Throwing out the outliers may seem like an obvious soluCon, but if the
outliers all lie on one side of the distribuCon (they usually are large posiCve numbers), this can lead to a biased esCmate.
¨ Are there cases where the mulCple cannot be esCmated? Will ignoring these cases lead to a biased esCmate of the mulCple?
¨ How has this mulCple changed over Cme?
90!
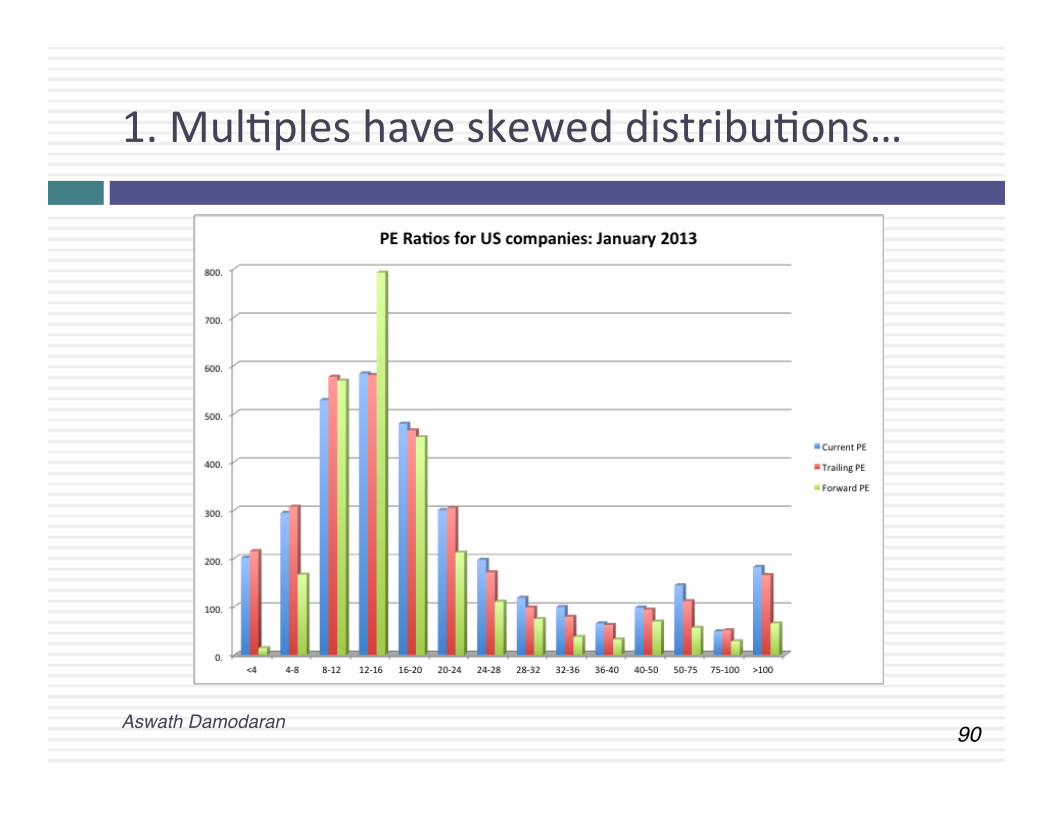
1. MulCples have skewed distribuCons…
Aswath Damodaran!
91!
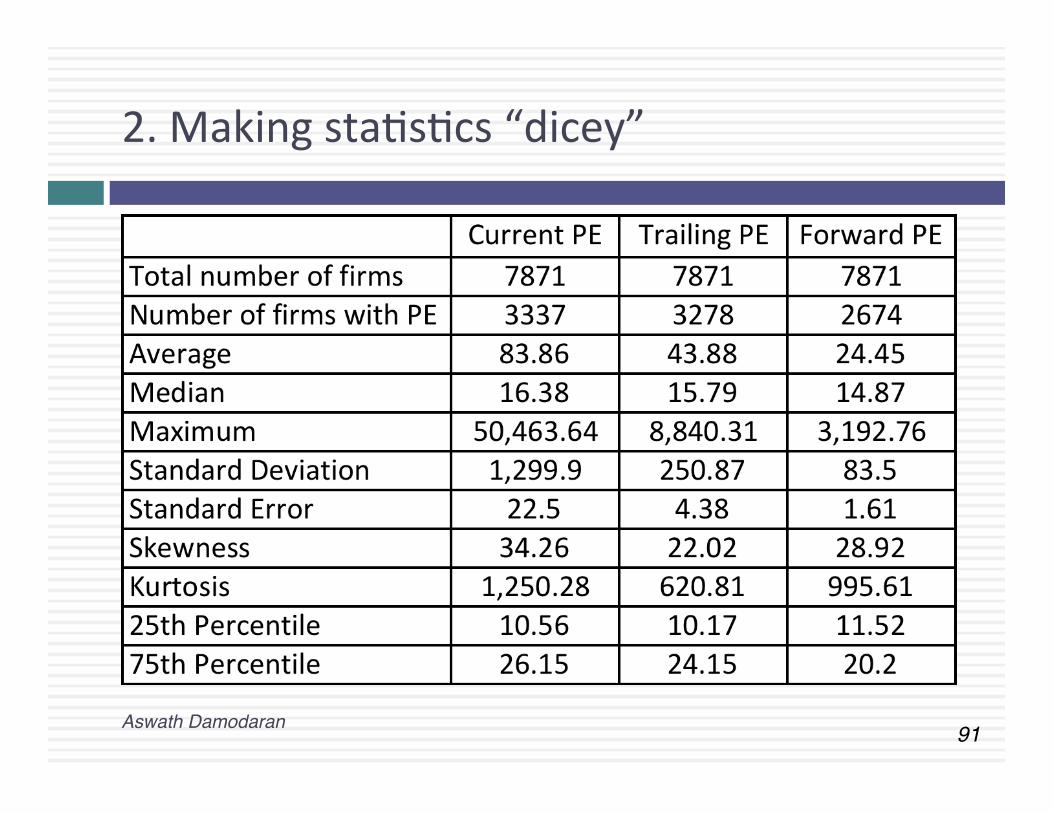
2. Making staCsCcs “dicey”
Aswath Damodaran!
92!
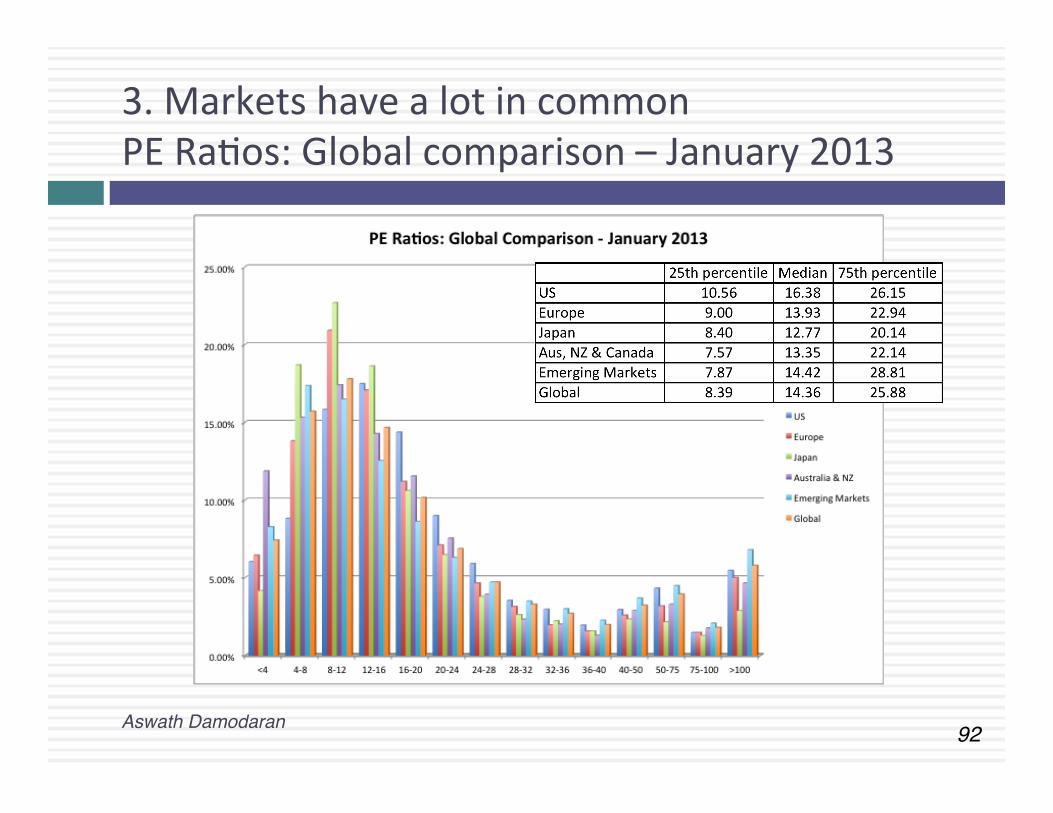
3. Markets have a lot in common PE RaCos: Global comparison – January 2013
Aswath Damodaran!
93!
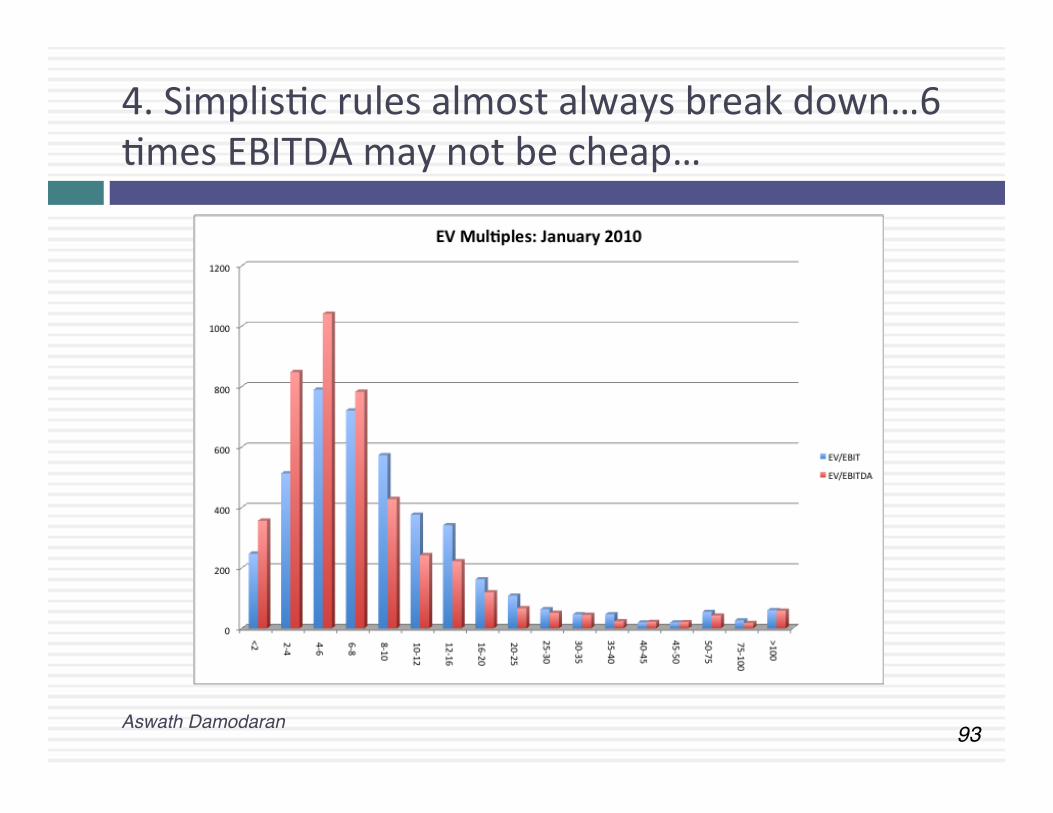
4. SimplisCc rules almost always break down…6 Cmes EBITDA may not be cheap…
Aswath Damodaran!
94!
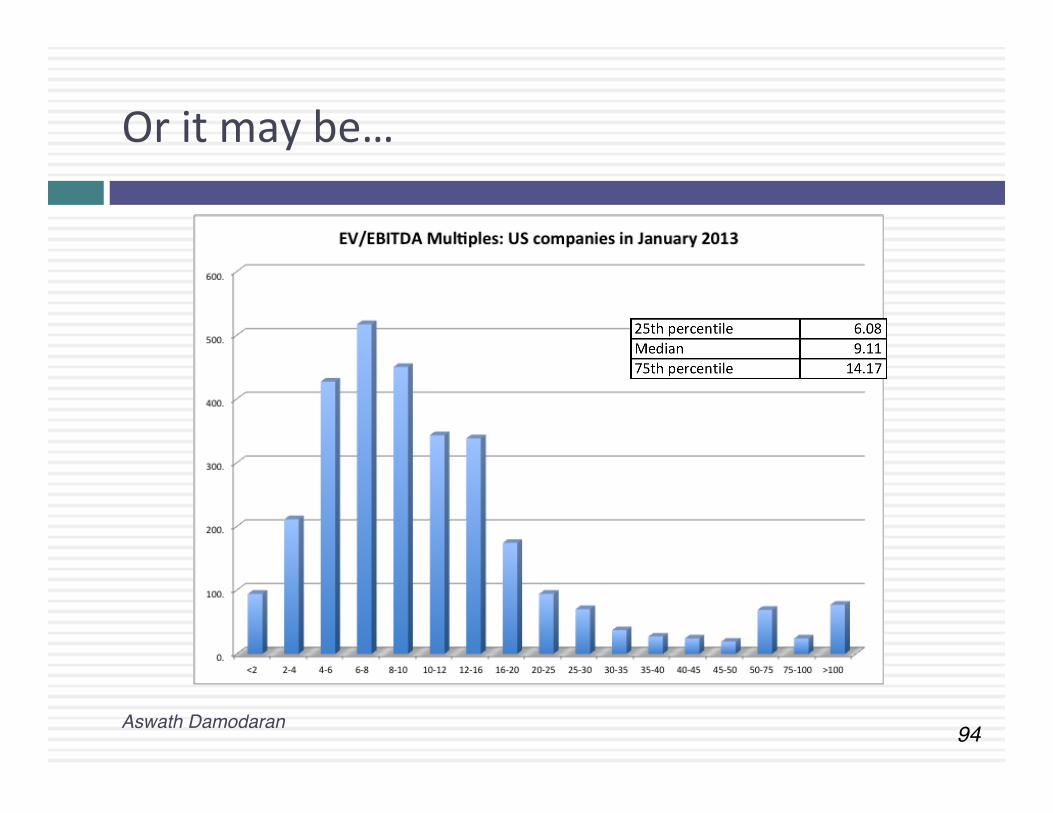
Or it may be…
Aswath Damodaran!
95!
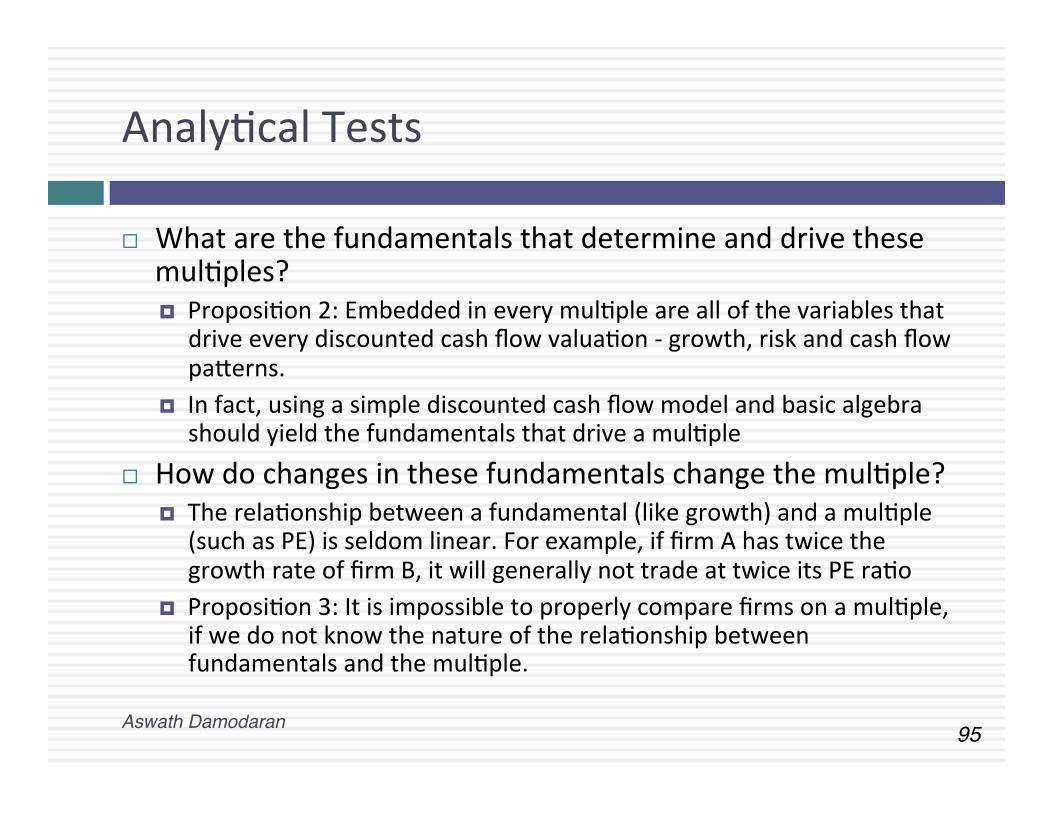
AnalyCcal Tests
Aswath Damodaran!
¨ What are the fundamentals that determine and drive these mulCples? ¤ ProposiCon 2: Embedded in every mulCple are all of the variables that
drive every discounted cash flow valuaCon -‐ growth, risk and cash flow paTerns.
¤ In fact, using a simple discounted cash flow model and basic algebra should yield the fundamentals that drive a mulCple
¨ How do changes in these fundamentals change the mulCple? ¤ The relaConship between a fundamental (like growth) and a mulCple
(such as PE) is seldom linear. For example, if firm A has twice the growth rate of firm B, it will generally not trade at twice its PE raCo
¤ ProposiCon 3: It is impossible to properly compare firms on a mulCple, if we do not know the nature of the relaConship between fundamentals and the mulCple.
96!
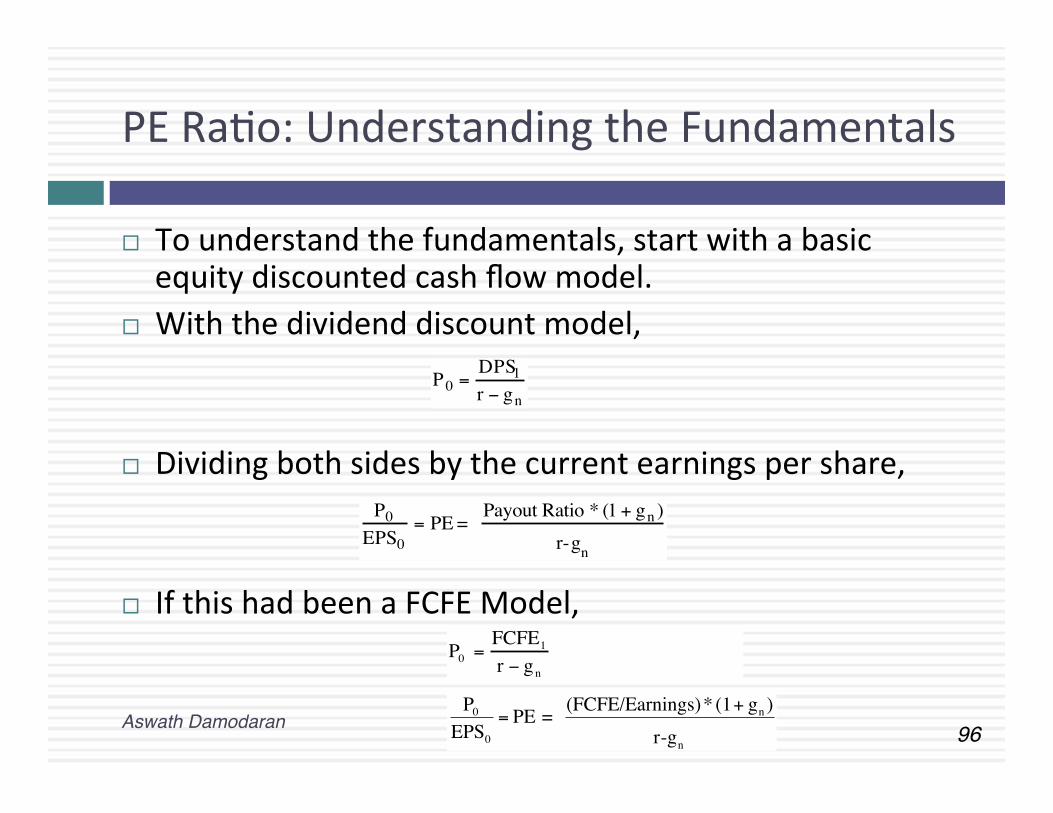
PE RaCo: Understanding the Fundamentals
Aswath Damodaran!
¨ To understand the fundamentals, start with a basic equity discounted cash flow model.
¨ With the dividend discount model,
¨ Dividing both sides by the current earnings per share,
¨ If this had been a FCFE Model,
P0 =DPS1r − gn
P0EPS0
= PE = Payout Ratio * (1 + gn )
r-gn
P0 =FCFE1r − gn
€
P0
EPS0
= PE = (FCFE/Earnings)* (1+ gn )r-gn
97!
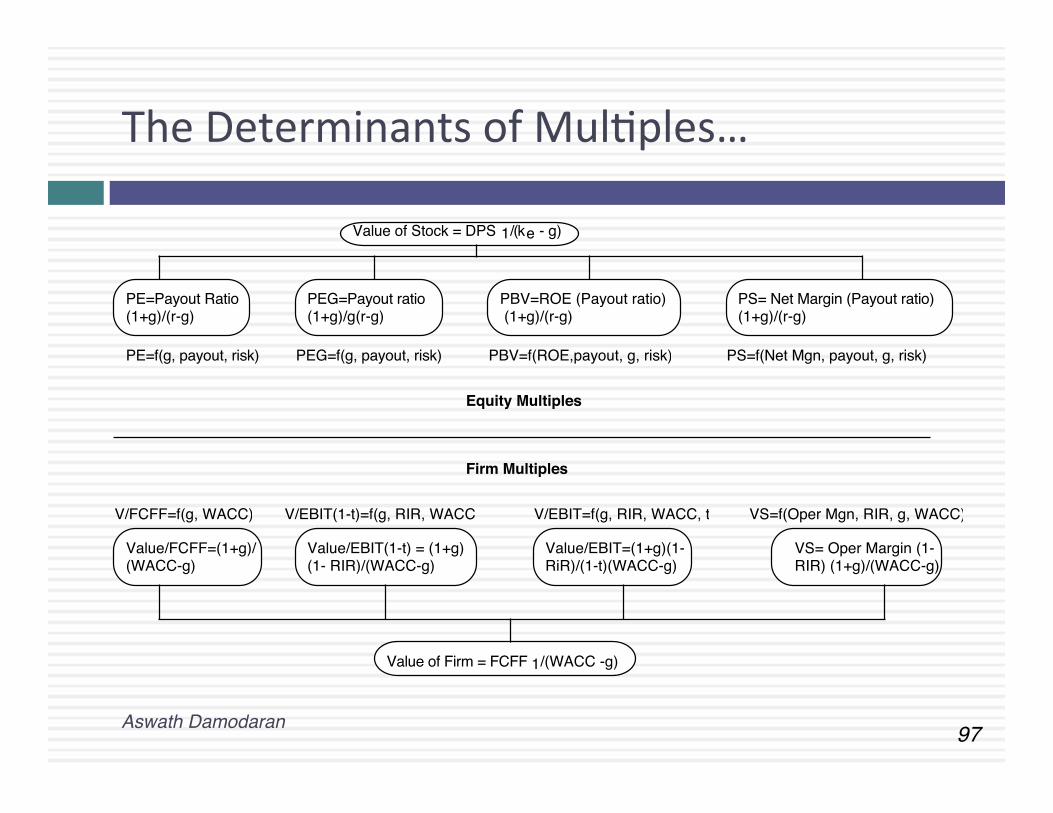
The Determinants of MulCples…
Aswath Damodaran!
Value of Stock = DPS 1/(ke - g)
PE=Payout Ratio (1+g)/(r-g)
PEG=Payout ratio (1+g)/g(r-g)
PBV=ROE (Payout ratio) (1+g)/(r-g)
PS= Net Margin (Payout ratio)(1+g)/(r-g)
Value of Firm = FCFF 1/(WACC -g)
Value/FCFF=(1+g)/(WACC-g)
Value/EBIT(1-t) = (1+g) (1- RIR)/(WACC-g)
Value/EBIT=(1+g)(1-RiR)/(1-t)(WACC-g)
VS= Oper Margin (1-RIR) (1+g)/(WACC-g)
Equity Multiples
Firm Multiples
PE=f(g, payout, risk) PEG=f(g, payout, risk) PBV=f(ROE,payout, g, risk) PS=f(Net Mgn, payout, g, risk)
V/FCFF=f(g, WACC) V/EBIT(1-t)=f(g, RIR, WACC) V/EBIT=f(g, RIR, WACC, t) VS=f(Oper Mgn, RIR, g, WACC)
98!
ApplicaCon Tests
Aswath Damodaran!
¨ Given the firm that we are valuing, what is a “comparable” firm? ¤ While tradiConal analysis is built on the premise that firms in the same sector are comparable firms, valuaCon theory would suggest that a comparable firm is one which is similar to the one being analyzed in terms of fundamentals.
¤ ProposiCon 4: There is no reason why a firm cannot be compared with another firm in a very different business, if the two firms have the same risk, growth and cash flow characterisCcs.
¨ Given the comparable firms, how do we adjust for differences across firms on the fundamentals? ¤ ProposiCon 5: It is impossible to find an exactly idenCcal firm to the one you are valuing.
99!
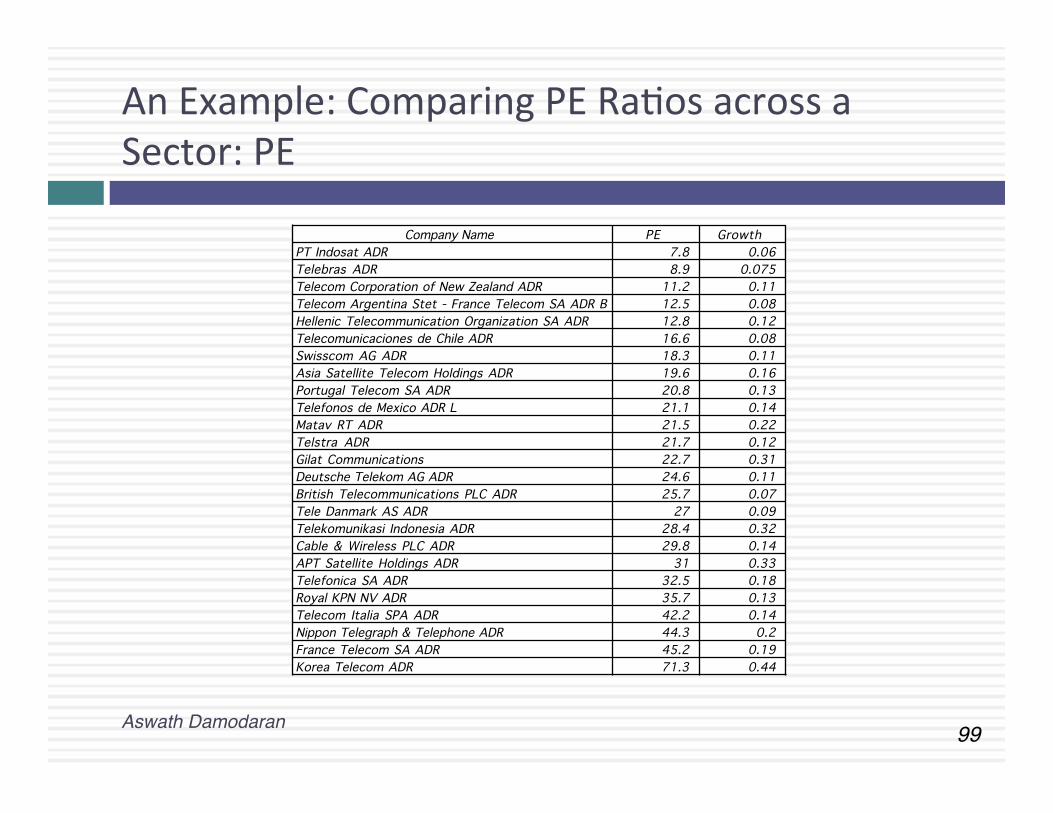
An Example: Comparing PE RaCos across a Sector: PE
Aswath Damodaran!
Company Name PE GrowthPT Indosat ADR 7.8 0.06Telebras ADR 8.9 0.075Telecom Corporation of New Zealand ADR 11.2 0.11Telecom Argentina Stet - France Telecom SA ADR B 12.5 0.08Hellenic Telecommunication Organization SA ADR 12.8 0.12Telecomunicaciones de Chile ADR 16.6 0.08Swisscom AG ADR 18.3 0.11Asia Satellite Telecom Holdings ADR 19.6 0.16Portugal Telecom SA ADR 20.8 0.13Telefonos de Mexico ADR L 21.1 0.14Matav RT ADR 21.5 0.22Telstra ADR 21.7 0.12Gilat Communications 22.7 0.31Deutsche Telekom AG ADR 24.6 0.11British Telecommunications PLC ADR 25.7 0.07Tele Danmark AS ADR 27 0.09Telekomunikasi Indonesia ADR 28.4 0.32Cable & Wireless PLC ADR 29.8 0.14APT Satellite Holdings ADR 31 0.33Telefonica SA ADR 32.5 0.18Royal KPN NV ADR 35.7 0.13Telecom Italia SPA ADR 42.2 0.14Nippon Telegraph & Telephone ADR 44.3 0.2France Telecom SA ADR 45.2 0.19Korea Telecom ADR 71.3 0.44
100!
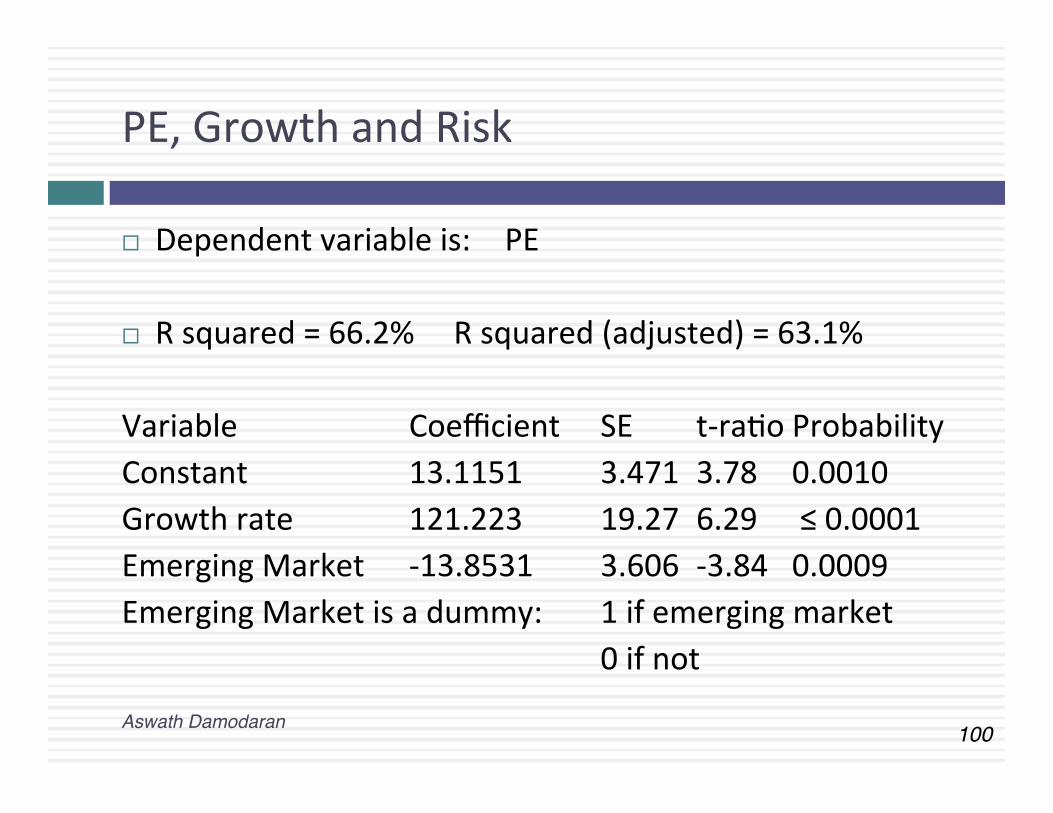
PE, Growth and Risk
Aswath Damodaran!
¨ Dependent variable is: PE
¨ R squared = 66.2% R squared (adjusted) = 63.1%
Variable Coefficient SE t-‐raCo Probability Constant 13.1151 3.471 3.78 0.0010 Growth rate 121.223 19.27 6.29 ≤ 0.0001 Emerging Market -‐13.8531 3.606 -‐3.84 0.0009 Emerging Market is a dummy: 1 if emerging market
0 if not
101!
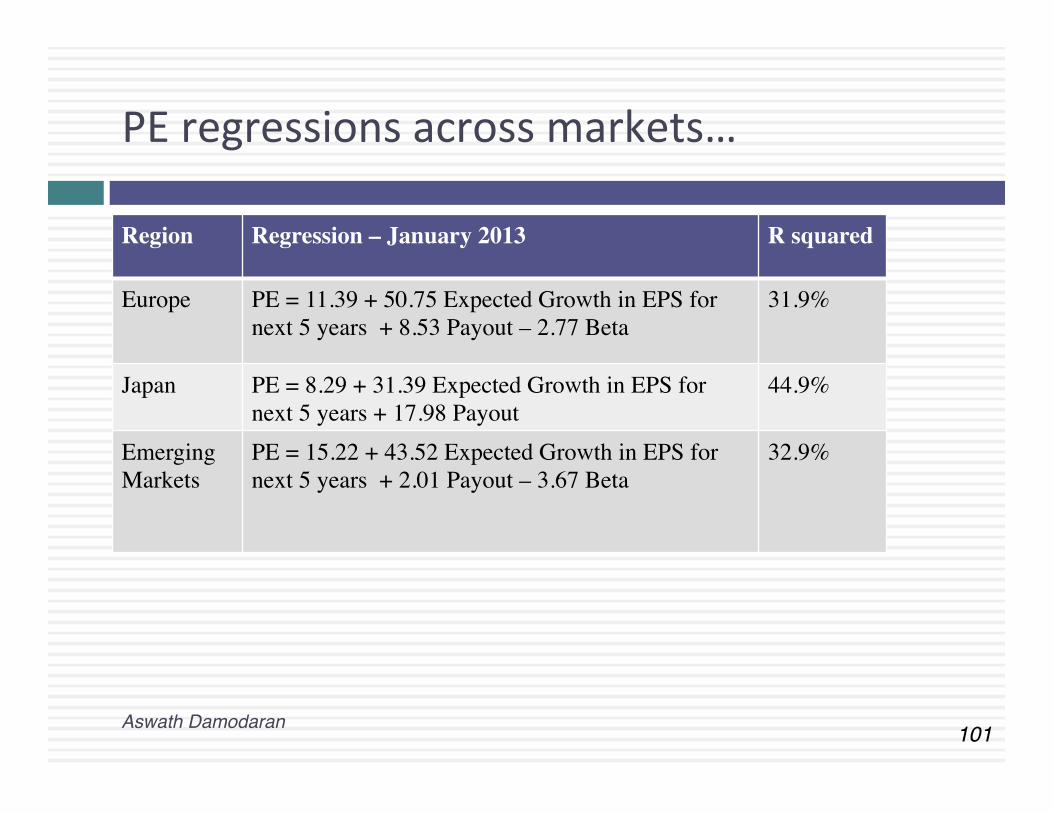
PE regressions across markets…
Aswath Damodaran!
Region Regression – January 2013 R squared
Europe PE = 11.39 + 50.75 Expected Growth in EPS for next 5 years + 8.53 Payout – 2.77 Beta
31.9%
Japan PE = 8.29 + 31.39 Expected Growth in EPS for next 5 years + 17.98 Payout
44.9%
Emerging Markets
PE = 15.22 + 43.52 Expected Growth in EPS for next 5 years + 2.01 Payout – 3.67 Beta
32.9%
102!
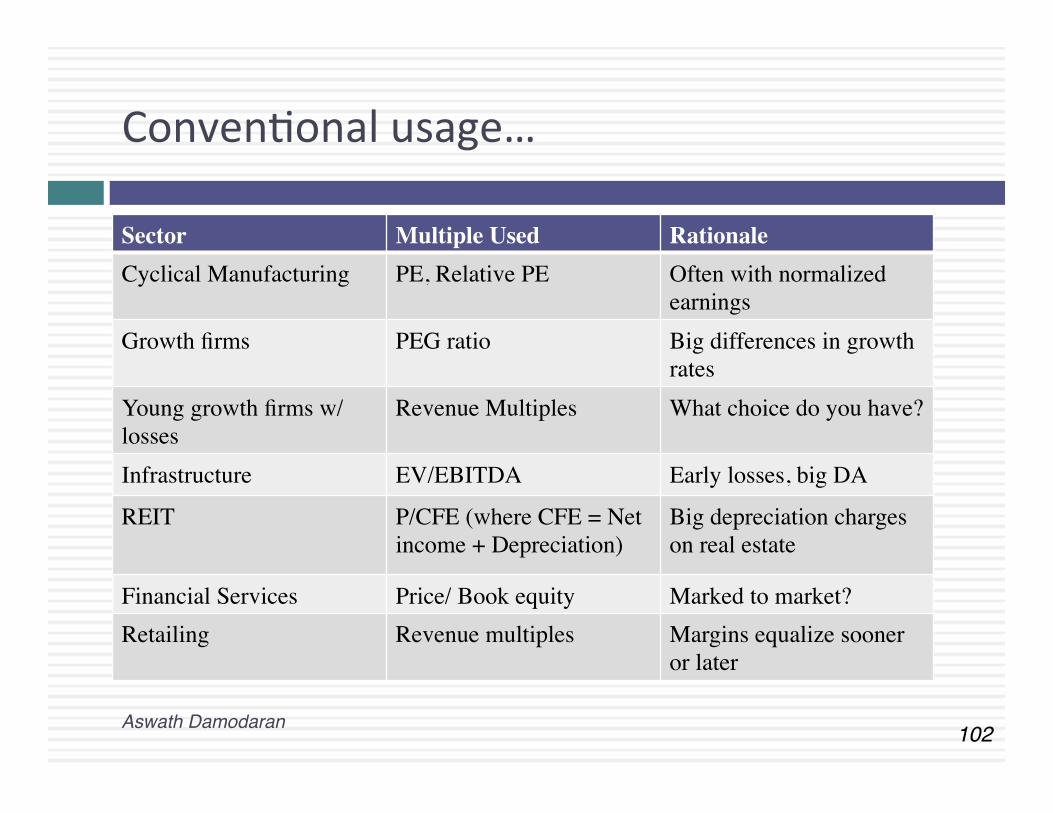
ConvenConal usage…
Aswath Damodaran!
Sector Multiple Used Rationale Cyclical Manufacturing PE, Relative PE Often with normalized
earnings Growth firms PEG ratio Big differences in growth
rates Young growth firms w/ losses
Revenue Multiples What choice do you have?
Infrastructure EV/EBITDA Early losses, big DA
REIT P/CFE (where CFE = Net income + Depreciation)
Big depreciation charges on real estate
Financial Services Price/ Book equity Marked to market? Retailing Revenue multiples Margins equalize sooner
or later
103!
A closing thought…
Aswath Damodaran!