validation of advanced steam turbine technology: a case
TRANSCRIPT
VALIDATION OF ADVANCED STEAM TURBINE TECHNOLOGY – A CASE STUDY OF AN ULTRA SUPER CRITICAL STEAM TURBINE POWER PLANT
Dr. Rainer Quinkertz Siemens AG
Muelheim, Germany
Dr. Thomas Thiemann Siemens AG
Muelheim, Germany
Kai Gierse Siemens AG
Muelheim, Germany
ABSTRACT High efficiency and flexible operation continue to be the
major requirements for power generation because of the benefits of reduced emissions and reduced fuel consumption, i.e. reduced operating costs.
Ultra super critical (USC) steam parameters are the basis for state of the art technology of coal fired power plants with highest efficiency.
An important part of the development process for advanced steam turbines is product validation. This step involves more than just providing evidence of customer guaranteed values (e.g. heat rate or electric output). It also involves proving that the design targets have been achieved and that the operational experience is fed back to designers to further develop the design criteria and enable the next step in the development of highly sophisticated products.
What makes product validation for large size power plant steam turbines especially challenging is the fact that, due to the high costs of the required infrastructure, steam turbine manufacturers usually do not have a full scope / full scale testing facility. Therefore, good customer relations are the key to successful validation.
This paper describes an extensive validation program for a modern state of the art ultra supercritical steam turbine performed at an operating 1000 MW steam power plant in China. Several measuring points in addition to the standard operating measurements were installed at one of the high pressure turbines to record the temperature distribution, e.g. to verify the functionality of the internal cooling system, which is an advanced design feature of the installed modern high pressure steam turbines. Predicted 3D temperature distributions are compared to the actual measurements in
order to verify and evaluate the design rules and the design philosophy applied.
Conclusions are drawn regarding the performance of modern 3D design tools applied in the current design process and an outlook is given on the future potential of modern USC turbines.
INTRODUCTION
Despite growing shares of renewables, fossil fired power plants will continue to be the major electricity supplier in the near future. However, fossil fired power plants will be increasingly required to reduce fuel input and minimize emissions i.e. to increase the efficiency of power generation. The main lever for this is to increase the steam temperature and the steam pressure. These steam parameters are physically limited by material capabilities. Therefore, a major challenge for power plant equipment manufacturers is to optimize the design within customer requirements of lifetime, availability, efficiency and costs.
Steam turbines are among the most highly loaded components within steam power plants, since they need to withstand not only high pressure and high temperature, but also high centrifugal forces.
In order to be competitive, steam turbine designers need to work at the limits of material capabilities. Despite long-term experience and evolutionary development of steam turbines, this remains a considerable challenge.
State of the art temperatures and pressures for modern ultra supercritical steam power plants are 600°C at 280 bar for the main steam, and 620°C at 60 bar for the reheat steam.
Generally, a steam turbine configuration depends on the unit size, the number of reheats selected, and site cooling conditions i.e. condenser backpressure. A typical ultra supercritical turbo-set comprises three separate turbine
Proceedings of ASME Turbo Expo 2011 GT2011
June 6-10, 2011, Vancouver, British Columbia, Canada
GT2011-45816
1 Copyright © 2011 by Siemens Energy, Inc.
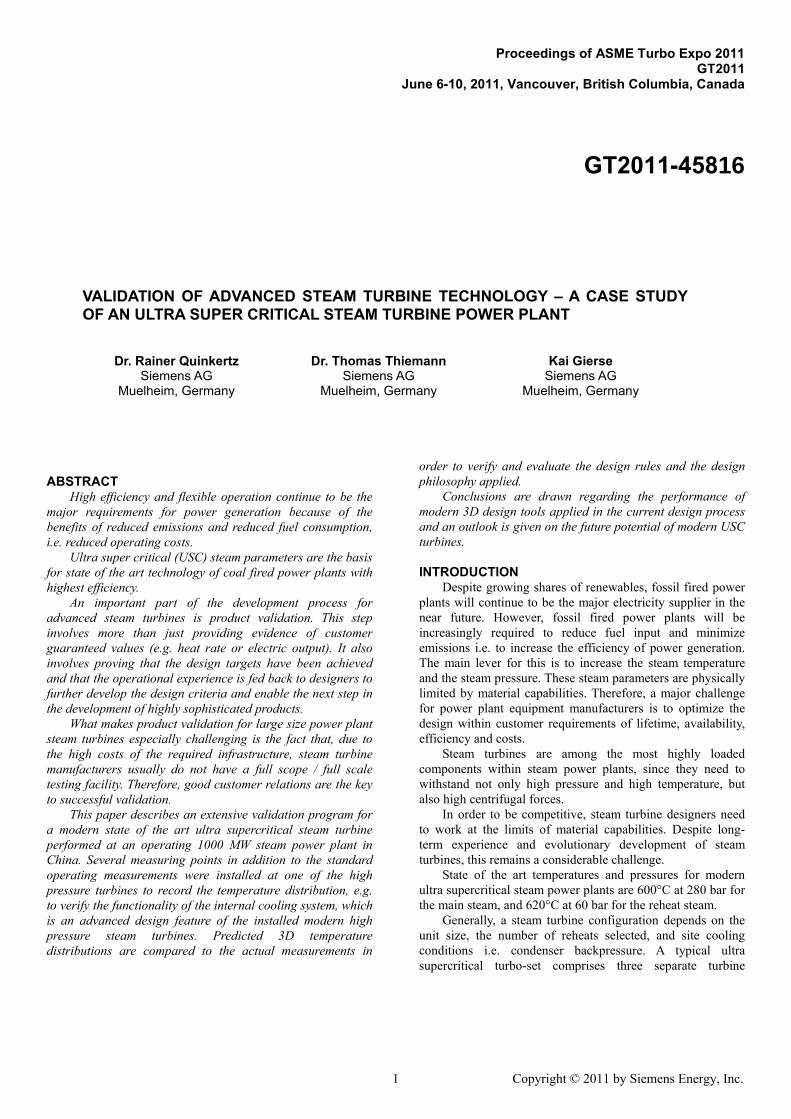
modules operating at different pressure and temperature levels. These modules are the high pressure turbine (HP), intermediate pressure turbine (IP) and, depending on the cooling water conditions, one, two or three low pressure turbines (LP). The generator is directly coupled to the last LP turbine. Figure 1 shows a steam turbine with two LP turbines. A comprehensive description of the specific turbine features of the whole turbo-set is given in [1].
Figure 1: STEAM TURBO-SET WITH SEPARATE HIGH, INTERMEDIATE AND LOW PRESSURE TURBINES
VALIDATION – WHY? The market of today demands highly efficient power
plants with short start-up times, high operating flexibility and low investment costs. As a consequence, a competitive power plant equipment manufacturer needs to continuously develop innovative design concepts and cutting-edge technologies.
For large scale power plants, the penalties e.g. for delayed commissioning, unplanned outages or unmet performance guarantees are extremely high. Therefore, it is absolutely essential that steam turbine manufacturers continuously sharpen their design tools and their know-how by gathering feedback from the plants. This is especially important when extending the existing portfolio by applying new and innovative design concepts.
During the past decades, improvements in modeling the real physics and the availability of advanced high speed computers have lead to enormous progress in the field of numerical simulations, such as Computational Fluid Dynamics (CFD) or Finite Element Analysis (FEA). For many years, these tools have been regularly applied in the design- and technology development process helping to develop innovative solutions in the authors company.
Although the reliability of these tools is continuously being improved, it is well known that the calculated results need a certain degree of validation by comparing to measured values. [2] shows how product validation is applied to bridge the gap between theoretical assumptions and operational results of developed steam turbine components. In most cases, validation is done by conducting laboratory tests (e.g. brush
seals [3], downscaled model steam turbines [4], etc.). However, the components of the real plant cannot always be modeled in such a way that the results can be fully transferred to real conditions.
Besides laboratory trials and regular plant feedback, detailed validation measurements at operating turbines are of utmost value. Even the largest known testing facility for steam turbines does not reach full scale [5]. Therefore full scale validation measurements have to be conducted in an operating power plant. Due to the boundary conditions in such a plant, the effort for such validation measurements is very high and requires close cooperation between the owner of the plant and the manufacturer of the turbine. The authors’ company has gained many years of experience with such site testing programs, e.g. [6].
FUNDAMENTALS During the operation of steam turbines, expanded or
throttled steam conditions as well as heat transfer effects at the bearings influence the temperature distribution within the turbine components. During steady state operation, the temperature fields within the walls of the components are time independent. However, during start-up, shut-down and load changes time-dependent steam conditions occur which cause transient temperature fields.
Knowledge of the temperature distribution is essential for the calculation and evaluation of free thermal expansion, thermal distortion and thermal stresses of the turbine components. For optimal efficiency, the radial clearance between steady and rotating parts needs to be as small as possible. However, for best flexibility and availability aspects during transient operation tight clearances might be disadvantageous. Thus, the structural integrity as well as the functionality of the components depend strongly on the quality of the calculated temperature distribution. Furthermore, it is possible to optimize start-up and shut-down procedures as well as load changes based on known temperature distribution and corresponding stresses.
The heat flow between steam and metal surface mainly affects the rate of heating up or cooling down of the component. Possible mechanisms of heat transfer between steam and surface are condensation, convection and radiation. Since the temperature difference between two components is small and the absolute level of temperature is not excessive the effect of radiation is negligible in this context.
Temperature Distribution The time-dependent heat flow and the resulting
temperature distribution in a body can be calculated by applying a Fourier differential equation assuming constant material parameters. For cylindrical coordinates this has the following form:
HP turbine
IP turbine LP turbines
2 Copyright © 2011 by Siemens Energy, Inc.
22
2
22
2 11
dz
d
d
d
rdr
d
rdr
da
dt
d
(1)
with ca / (2)
The turbine operation modes can be divided into three
ranges with respect to the temperature distribution and deformation behavior:
Transient state: Locally variable and time-dependent temperature differences
Quasi steady state: Locally constant temperature differences with time-dependent absolute temperature levels
Steady state: Locally constant and time-independent temperature differences
Detailed explanations of transient and stationary
temperature distributions in certain bodies are given in [7, 8, 9].
Calculation Tools and procedures For the previously listed formula a mathematically closed
solution is not possible. Thus, advanced numerical tools are required to calculate the temperature distribution within complex-shaped steam turbine components with adequate accuracy. The Finite-Element-Method (FEM) is a numerical technique for calculating approximate solutions of partial differential equations. During the design process of turbine components, this method is well established at the authors’ company for performing three-dimensional mechanical calculations and optimizations.
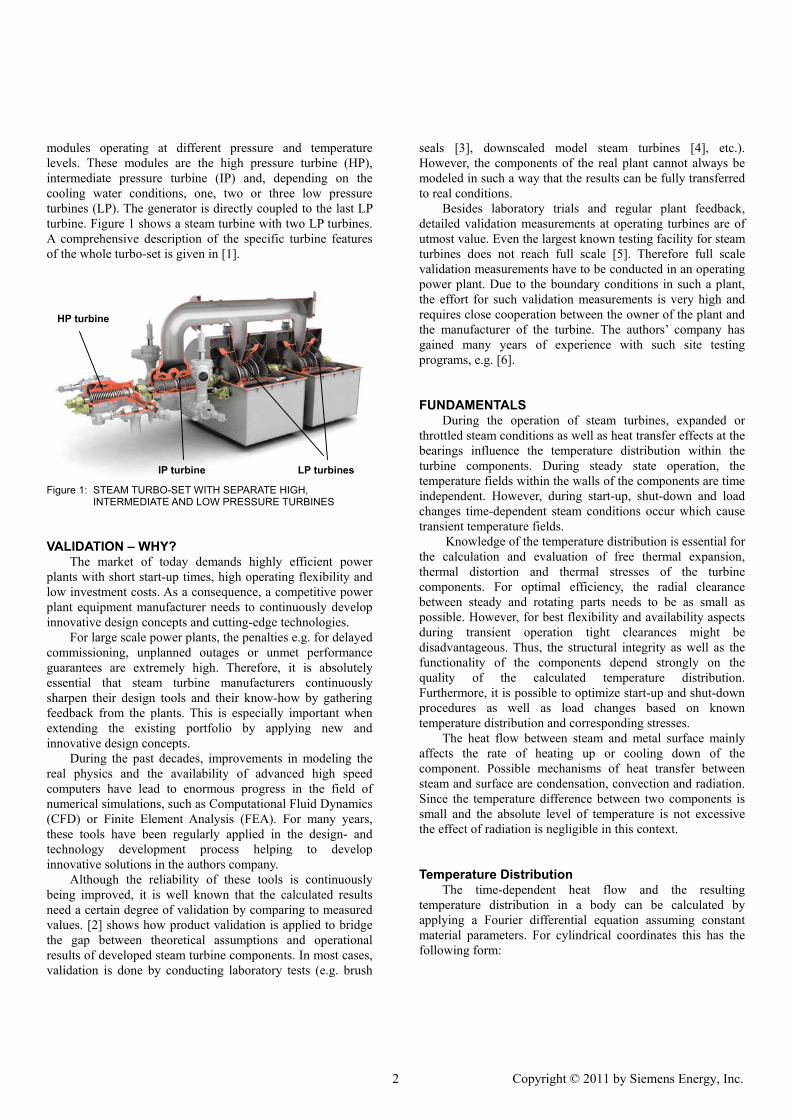
Figure 2: TEMPERATURE DISTRIBUTION FOR HP OUTER CASING INLET (LEFT) AND EXHAUST PART CALCULATED BY FEM
Based on extended operational experience, it is a
substantial part of the know-how of a steam turbine manufacturer to define rules of heat transfer for the specific geometries, materials and steam flow conditions. The resulting parameters define the required boundary conditions for the FEM calculations. Figure 2 shows as an example the results of a thermal FEM calculation for steady state operation of both outer casing parts of the HP turbine. The calculated temperature distribution is the basis of further mechanical evaluations such as strength assessments or functionality checks.
Thermal Casing Deflection and it’s Effect on Radial Clearances
Thermal deflection of turbine casings is a well known effect. Especially during transient operating phases with low steam flow velocity, temperature differences can lead to significant thermal deflections of the inner and outer casings. These deflections occur due to inhomogeneous temperature distributions within a body.
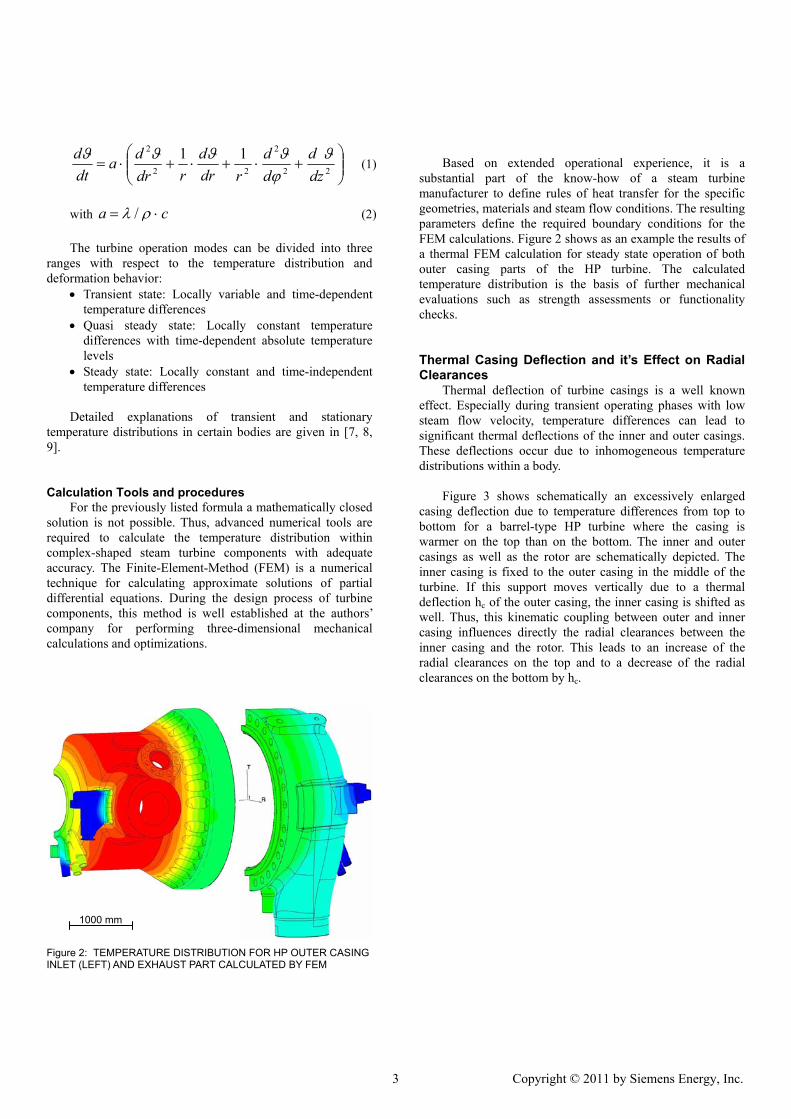
Figure 3 shows schematically an excessively enlarged
casing deflection due to temperature differences from top to bottom for a barrel-type HP turbine where the casing is warmer on the top than on the bottom. The inner and outer casings as well as the rotor are schematically depicted. The inner casing is fixed to the outer casing in the middle of the turbine. If this support moves vertically due to a thermal deflection hc of the outer casing, the inner casing is shifted as well. Thus, this kinematic coupling between outer and inner casing influences directly the radial clearances between the inner casing and the rotor. This leads to an increase of the radial clearances on the top and to a decrease of the radial clearances on the bottom by hc.
1000 mm
3 Copyright © 2011 by Siemens Energy, Inc.
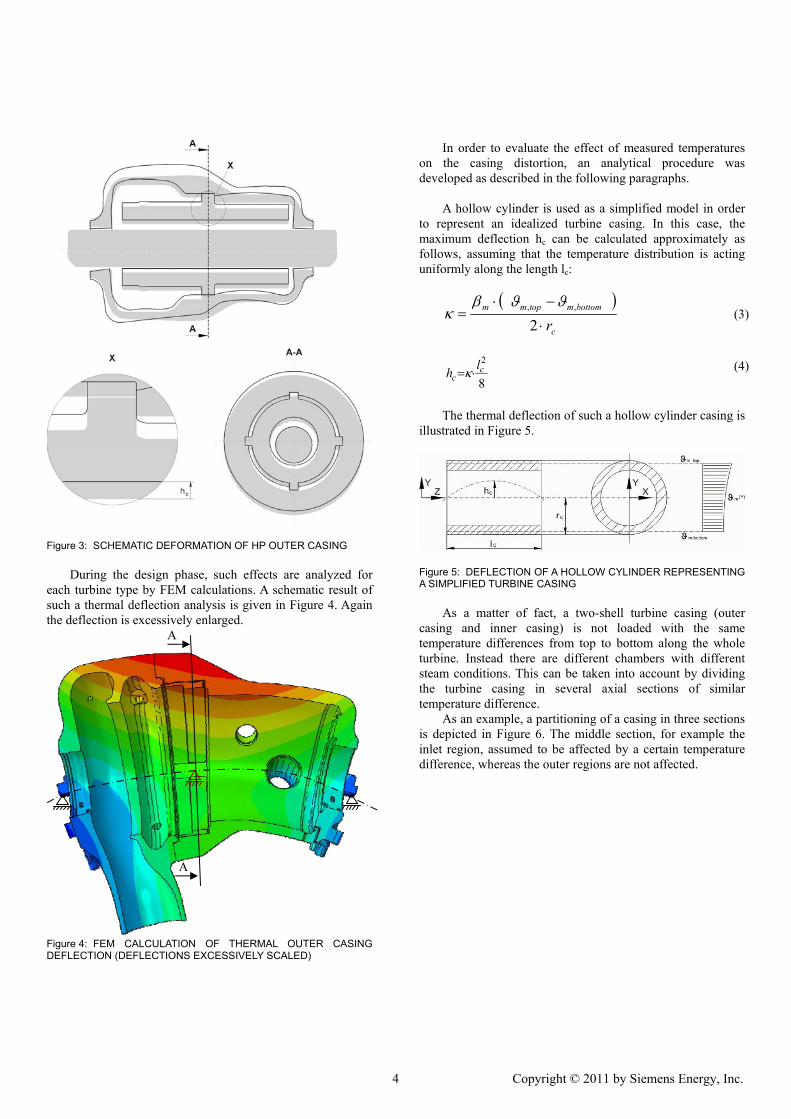
Figure 3: SCHEMATIC DEFORMATION OF HP OUTER CASING
During the design phase, such effects are analyzed for
each turbine type by FEM calculations. A schematic result of such a thermal deflection analysis is given in Figure 4. Again the deflection is excessively enlarged.
Figure 4: FEM CALCULATION OF THERMAL OUTER CASING DEFLECTION (DEFLECTIONS EXCESSIVELY SCALED)
In order to evaluate the effect of measured temperatures on the casing distortion, an analytical procedure was developed as described in the following paragraphs.
A hollow cylinder is used as a simplified model in order
to represent an idealized turbine casing. In this case, the maximum deflection hc can be calculated approximately as follows, assuming that the temperature distribution is acting uniformly along the length lc:
c
bottommtopmm
r
2,,
(3)
8
2c
cl
h (4)
The thermal deflection of such a hollow cylinder casing is
illustrated in Figure 5.
Figure 5: DEFLECTION OF A HOLLOW CYLINDER REPRESENTING A SIMPLIFIED TURBINE CASING
As a matter of fact, a two-shell turbine casing (outer
casing and inner casing) is not loaded with the same temperature differences from top to bottom along the whole turbine. Instead there are different chambers with different steam conditions. This can be taken into account by dividing the turbine casing in several axial sections of similar temperature difference.
As an example, a partitioning of a casing in three sections is depicted in Figure 6. The middle section, for example the inlet region, assumed to be affected by a certain temperature difference, whereas the outer regions are not affected.
A
A
4 Copyright © 2011 by Siemens Energy, Inc.
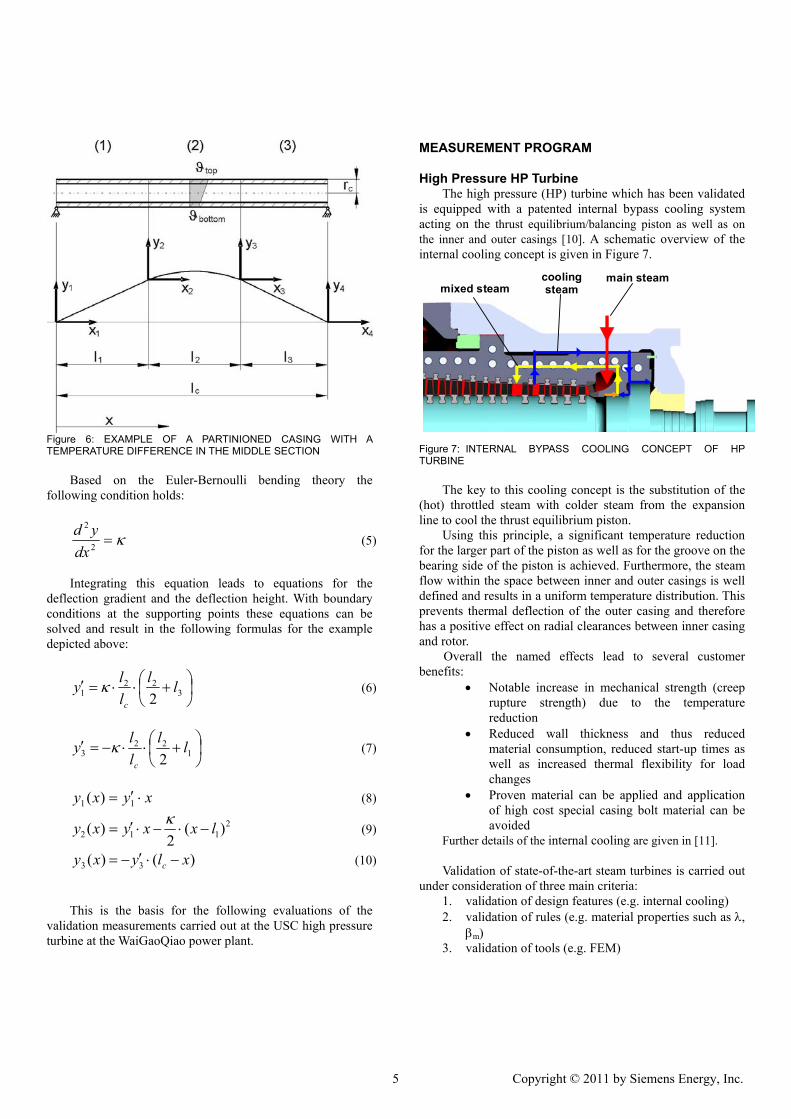
Figure 6: EXAMPLE OF A PARTINIONED CASING WITH A TEMPERATURE DIFFERENCE IN THE MIDDLE SECTION
Based on the Euler-Bernoulli bending theory the
following condition holds:
2
2
dx
yd (5)
Integrating this equation leads to equations for the
deflection gradient and the deflection height. With boundary conditions at the supporting points these equations can be solved and result in the following formulas for the example depicted above:
3
221 2
ll
l
ly
c
(6)
1
223 2
ll
l
ly
c
(7)
xyxy 11 )( (8)
2112 )(
2)( lxxyxy
(9)
)()( 33 xlyxy c (10)
This is the basis for the following evaluations of the
validation measurements carried out at the USC high pressure turbine at the WaiGaoQiao power plant.
MEASUREMENT PROGRAM
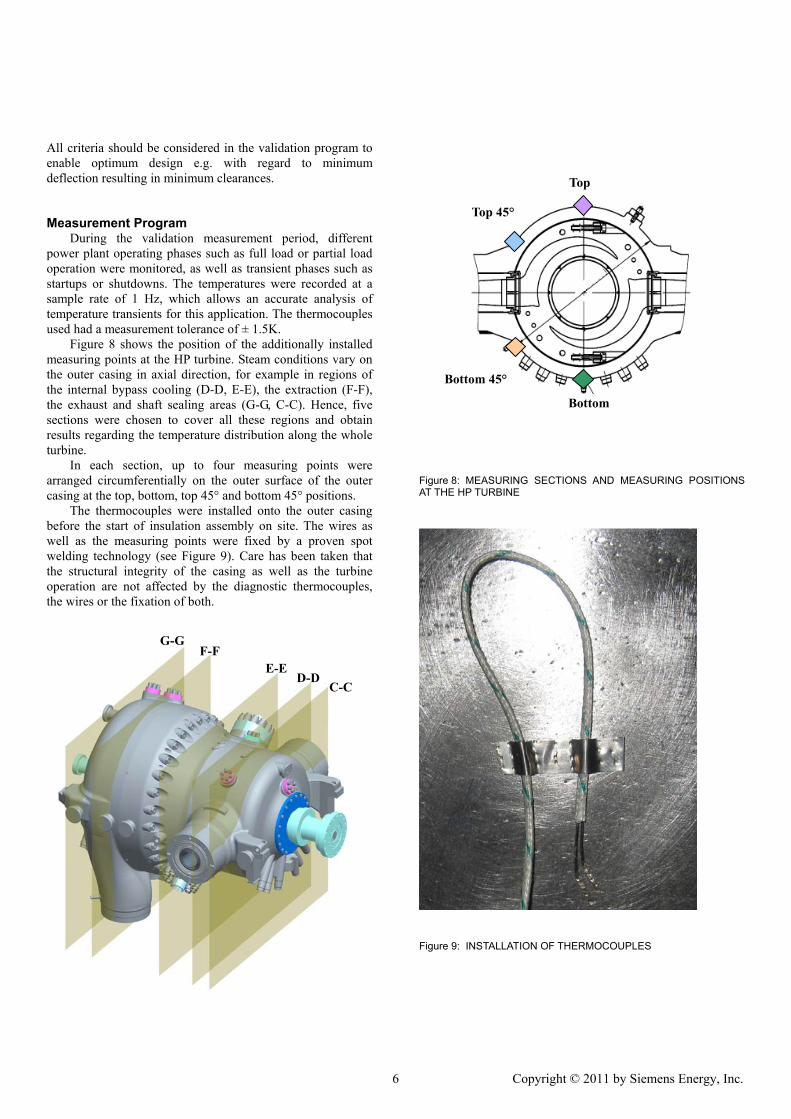
High Pressure HP Turbine The high pressure (HP) turbine which has been validated
is equipped with a patented internal bypass cooling system acting on the thrust equilibrium/balancing piston as well as on the inner and outer casings [10]. A schematic overview of the internal cooling concept is given in Figure 7.
Figure 7: INTERNAL BYPASS COOLING CONCEPT OF HP TURBINE
The key to this cooling concept is the substitution of the
(hot) throttled steam with colder steam from the expansion line to cool the thrust equilibrium piston.
Using this principle, a significant temperature reduction for the larger part of the piston as well as for the groove on the bearing side of the piston is achieved. Furthermore, the steam flow within the space between inner and outer casings is well defined and results in a uniform temperature distribution. This prevents thermal deflection of the outer casing and therefore has a positive effect on radial clearances between inner casing and rotor.
Overall the named effects lead to several customer benefits:
Notable increase in mechanical strength (creep rupture strength) due to the temperature reduction
Reduced wall thickness and thus reduced material consumption, reduced start-up times as well as increased thermal flexibility for load changes
Proven material can be applied and application of high cost special casing bolt material can be avoided
Further details of the internal cooling are given in [11]. Validation of state-of-the-art steam turbines is carried out
under consideration of three main criteria: 1. validation of design features (e.g. internal cooling) 2. validation of rules (e.g. material properties such as ,
m) 3. validation of tools (e.g. FEM)
coolingsteammixed steam
main steam
5 Copyright © 2011 by Siemens Energy, Inc.
All criteria should be considered in the validation program to enable optimum design e.g. with regard to minimum deflection resulting in minimum clearances.
Measurement Program During the validation measurement period, different
power plant operating phases such as full load or partial load operation were monitored, as well as transient phases such as startups or shutdowns. The temperatures were recorded at a sample rate of 1 Hz, which allows an accurate analysis of temperature transients for this application. The thermocouples used had a measurement tolerance of ± 1.5K.
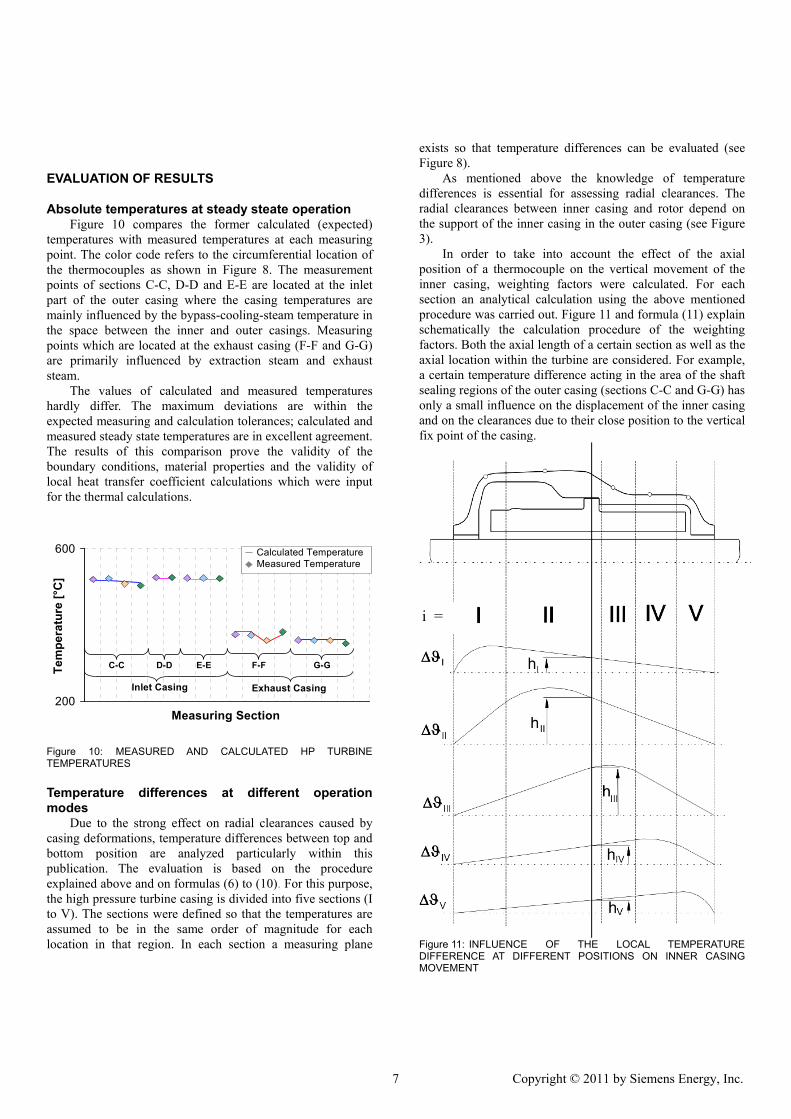
Figure 8 shows the position of the additionally installed measuring points at the HP turbine. Steam conditions vary on the outer casing in axial direction, for example in regions of the internal bypass cooling (D-D, E-E), the extraction (F-F), the exhaust and shaft sealing areas (G-G, C-C). Hence, five sections were chosen to cover all these regions and obtain results regarding the temperature distribution along the whole turbine.
In each section, up to four measuring points were arranged circumferentially on the outer surface of the outer casing at the top, bottom, top 45° and bottom 45° positions.
The thermocouples were installed onto the outer casing before the start of insulation assembly on site. The wires as well as the measuring points were fixed by a proven spot welding technology (see Figure 9). Care has been taken that the structural integrity of the casing as well as the turbine operation are not affected by the diagnostic thermocouples, the wires or the fixation of both.
Figure 8: MEASURING SECTIONS AND MEASURING POSITIONS AT THE HP TURBINE
Figure 9: INSTALLATION OF THERMOCOUPLES
C-CD-D
E-E F-F
G-G
Top
Top 45°
Bottom 45°
Bottom
6 Copyright © 2011 by Siemens Energy, Inc.
EVALUATION OF RESULTS
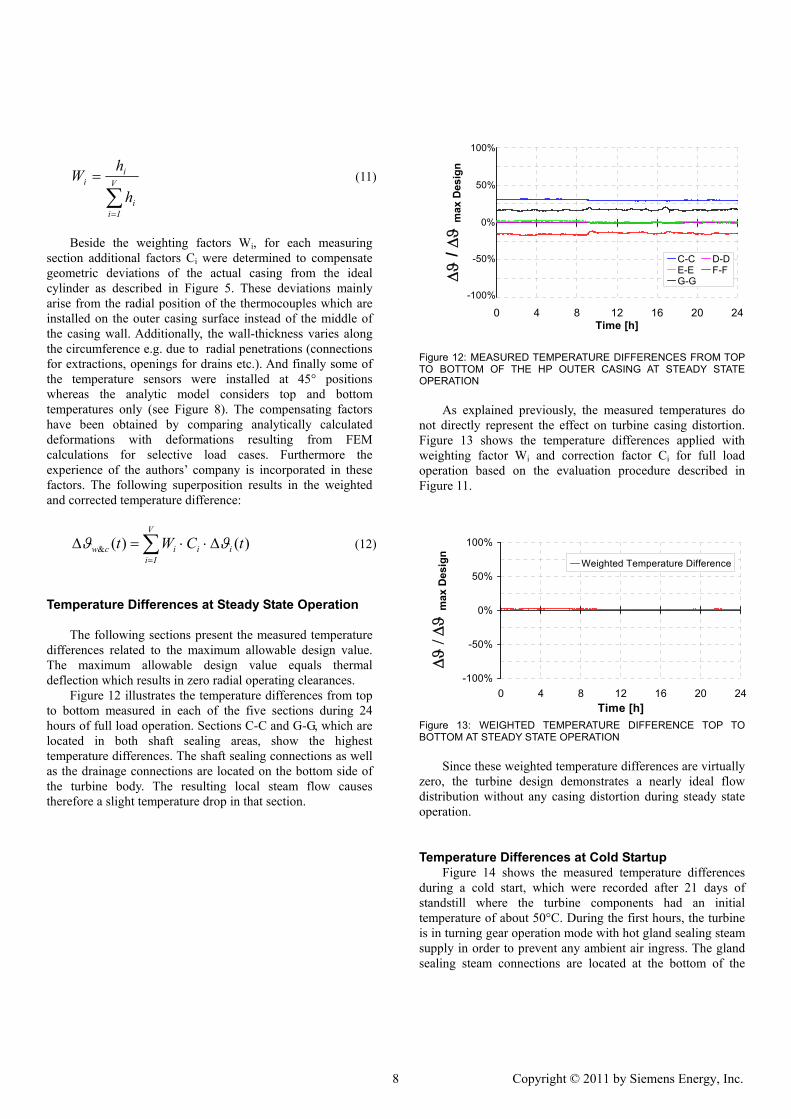
Absolute temperatures at steady steate operation Figure 10 compares the former calculated (expected)
temperatures with measured temperatures at each measuring point. The color code refers to the circumferential location of the thermocouples as shown in Figure 8. The measurement points of sections C-C, D-D and E-E are located at the inlet part of the outer casing where the casing temperatures are mainly influenced by the bypass-cooling-steam temperature in the space between the inner and outer casings. Measuring points which are located at the exhaust casing (F-F and G-G) are primarily influenced by extraction steam and exhaust steam.
The values of calculated and measured temperatures hardly differ. The maximum deviations are within the expected measuring and calculation tolerances; calculated and measured steady state temperatures are in excellent agreement. The results of this comparison prove the validity of the boundary conditions, material properties and the validity of local heat transfer coefficient calculations which were input for the thermal calculations.
200
600
Measuring Section
Te
mp
erat
ure
[°C
]
Inlet Casing Exhaust Casing
C-C D-D E-E F-F G-G
Calculated Temperature Measured Temperature
Figure 10: MEASURED AND CALCULATED HP TURBINE TEMPERATURES
Temperature differences at different operation modes
Due to the strong effect on radial clearances caused by casing deformations, temperature differences between top and bottom position are analyzed particularly within this publication. The evaluation is based on the procedure explained above and on formulas (6) to (10). For this purpose, the high pressure turbine casing is divided into five sections (I to V). The sections were defined so that the temperatures are assumed to be in the same order of magnitude for each location in that region. In each section a measuring plane
exists so that temperature differences can be evaluated (see Figure 8).
As mentioned above the knowledge of temperature differences is essential for assessing radial clearances. The radial clearances between inner casing and rotor depend on the support of the inner casing in the outer casing (see Figure 3).
In order to take into account the effect of the axial position of a thermocouple on the vertical movement of the inner casing, weighting factors were calculated. For each section an analytical calculation using the above mentioned procedure was carried out. Figure 11 and formula (11) explain schematically the calculation procedure of the weighting factors. Both the axial length of a certain section as well as the axial location within the turbine are considered. For example, a certain temperature difference acting in the area of the shaft sealing regions of the outer casing (sections C-C and G-G) has only a small influence on the displacement of the inner casing and on the clearances due to their close position to the vertical fix point of the casing.
Figure 11: INFLUENCE OF THE LOCAL TEMPERATURE DIFFERENCE AT DIFFERENT POSITIONS ON INNER CASING MOVEMENT
i =
7 Copyright © 2011 by Siemens Energy, Inc.
V
Iii
ii
h
hW (11)
Beside the weighting factors Wi, for each measuring
section additional factors Ci were determined to compensate geometric deviations of the actual casing from the ideal cylinder as described in Figure 5. These deviations mainly arise from the radial position of the thermocouples which are installed on the outer casing surface instead of the middle of the casing wall. Additionally, the wall-thickness varies along the circumference e.g. due to radial penetrations (connections for extractions, openings for drains etc.). And finally some of the temperature sensors were installed at 45° positions whereas the analytic model considers top and bottom temperatures only (see Figure 8). The compensating factors have been obtained by comparing analytically calculated deformations with deformations resulting from FEM calculations for selective load cases. Furthermore the experience of the authors’ company is incorporated in these factors. The following superposition results in the weighted and corrected temperature difference:
V
Iiiiicw tCWt )()(& (12)
Temperature Differences at Steady State Operation
The following sections present the measured temperature differences related to the maximum allowable design value. The maximum allowable design value equals thermal deflection which results in zero radial operating clearances.
Figure 12 illustrates the temperature differences from top to bottom measured in each of the five sections during 24 hours of full load operation. Sections C-C and G-G, which are located in both shaft sealing areas, show the highest temperature differences. The shaft sealing connections as well as the drainage connections are located on the bottom side of the turbine body. The resulting local steam flow causes therefore a slight temperature drop in that section.
0 4 8 12 16 20 24Time [h]
/
max
Des
ign
C-C D-DE-E F-FG-G
0%
50%
100%
-50%
-100%
Figure 12: MEASURED TEMPERATURE DIFFERENCES FROM TOP TO BOTTOM OF THE HP OUTER CASING AT STEADY STATE OPERATION
As explained previously, the measured temperatures do not directly represent the effect on turbine casing distortion. Figure 13 shows the temperature differences applied with weighting factor Wi and correction factor Ci for full load operation based on the evaluation procedure described in Figure 11.
-100%
-50%
0%
50%
100%
0 4 8 12 16 20 24
Time [h]
m
ax D
esig
n
Weighted Temperature Difference
Figure 13: WEIGHTED TEMPERATURE DIFFERENCE TOP TO BOTTOM AT STEADY STATE OPERATION
Since these weighted temperature differences are virtually
zero, the turbine design demonstrates a nearly ideal flow distribution without any casing distortion during steady state operation.
Temperature Differences at Cold Startup Figure 14 shows the measured temperature differences
during a cold start, which were recorded after 21 days of standstill where the turbine components had an initial temperature of about 50°C. During the first hours, the turbine is in turning gear operation mode with hot gland sealing steam supply in order to prevent any ambient air ingress. The gland sealing steam connections are located at the bottom of the
8 Copyright © 2011 by Siemens Energy, Inc.
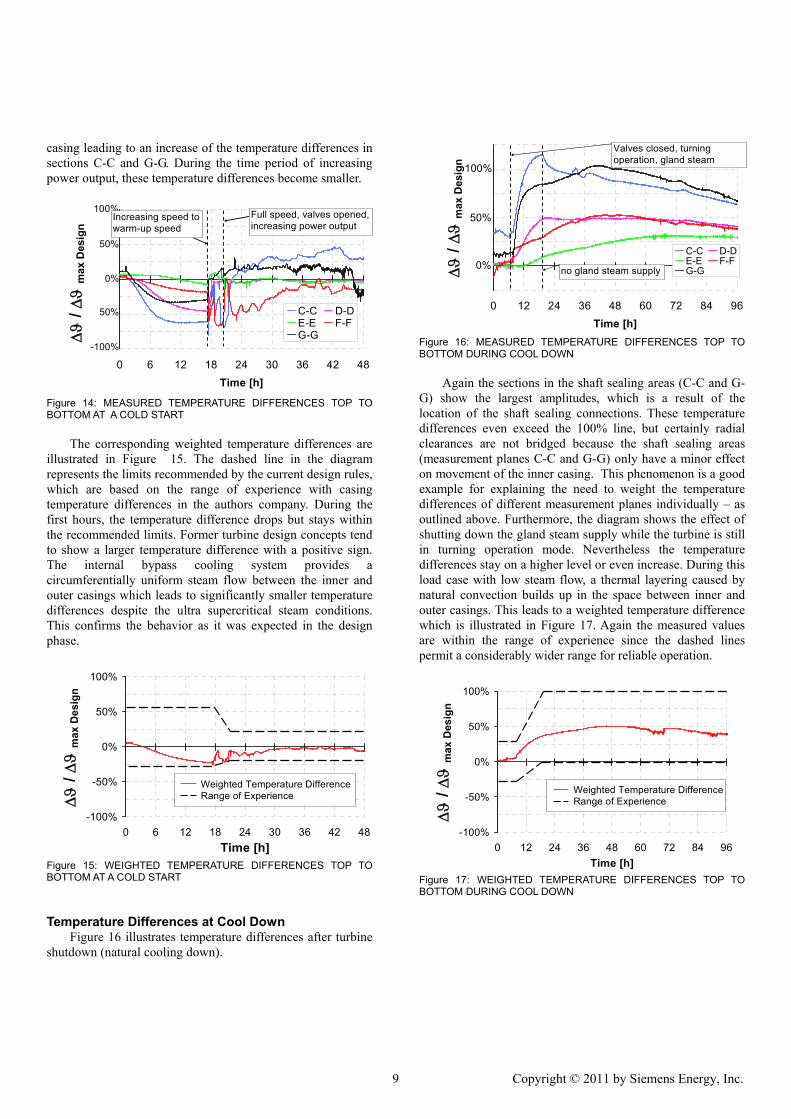
casing leading to an increase of the temperature differences in sections C-C and G-G. During the time period of increasing power output, these temperature differences become smaller.
0 6 12 18 24 30 36 42 48
Time [h]
/
max
Des
ign
C-C D-DE-E F-FG-G
Full speed, valves opened, increasing power output
100%
0%
50%
Increasing speed to warm-up speed
-100%
50%
Figure 14: MEASURED TEMPERATURE DIFFERENCES TOP TO BOTTOM AT A COLD START
The corresponding weighted temperature differences are
illustrated in Figure 15. The dashed line in the diagram represents the limits recommended by the current design rules, which are based on the range of experience with casing temperature differences in the authors company. During the first hours, the temperature difference drops but stays within the recommended limits. Former turbine design concepts tend to show a larger temperature difference with a positive sign. The internal bypass cooling system provides a circumferentially uniform steam flow between the inner and outer casings which leads to significantly smaller temperature differences despite the ultra supercritical steam conditions. This confirms the behavior as it was expected in the design phase.
-100%
-50%
0%
50%
100%
0 6 12 18 24 30 36 42 48
Time [h]
/
max
Des
ign
Weighted Temperature Difference Range of Experience
Figure 15: WEIGHTED TEMPERATURE DIFFERENCES TOP TO BOTTOM AT A COLD START
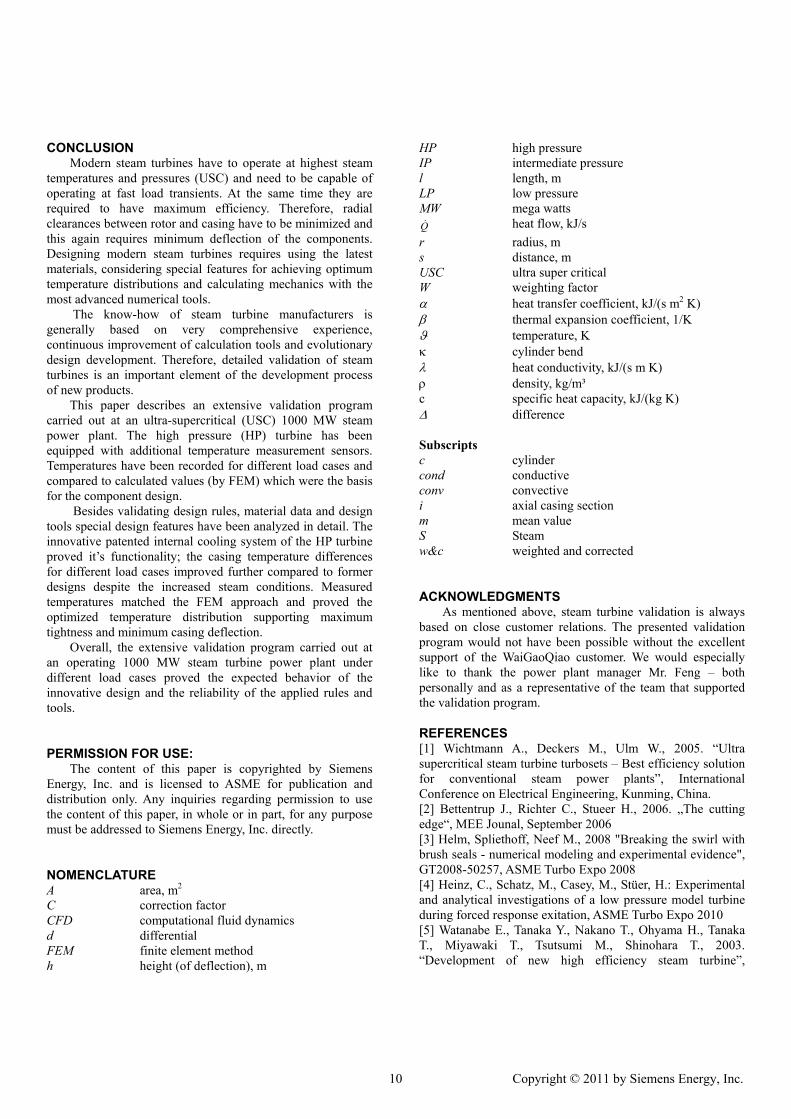
Temperature Differences at Cool Down Figure 16 illustrates temperature differences after turbine
shutdown (natural cooling down).
0 12 24 36 48 60 72 84 96
Time [h]
/
max
Des
ign
C-C D-DE-E F-FG-G
Valves closed, turning operation, gland steam
no gland steam supply
100%
50%
0%
Figure 16: MEASURED TEMPERATURE DIFFERENCES TOP TO BOTTOM DURING COOL DOWN
Again the sections in the shaft sealing areas (C-C and G-
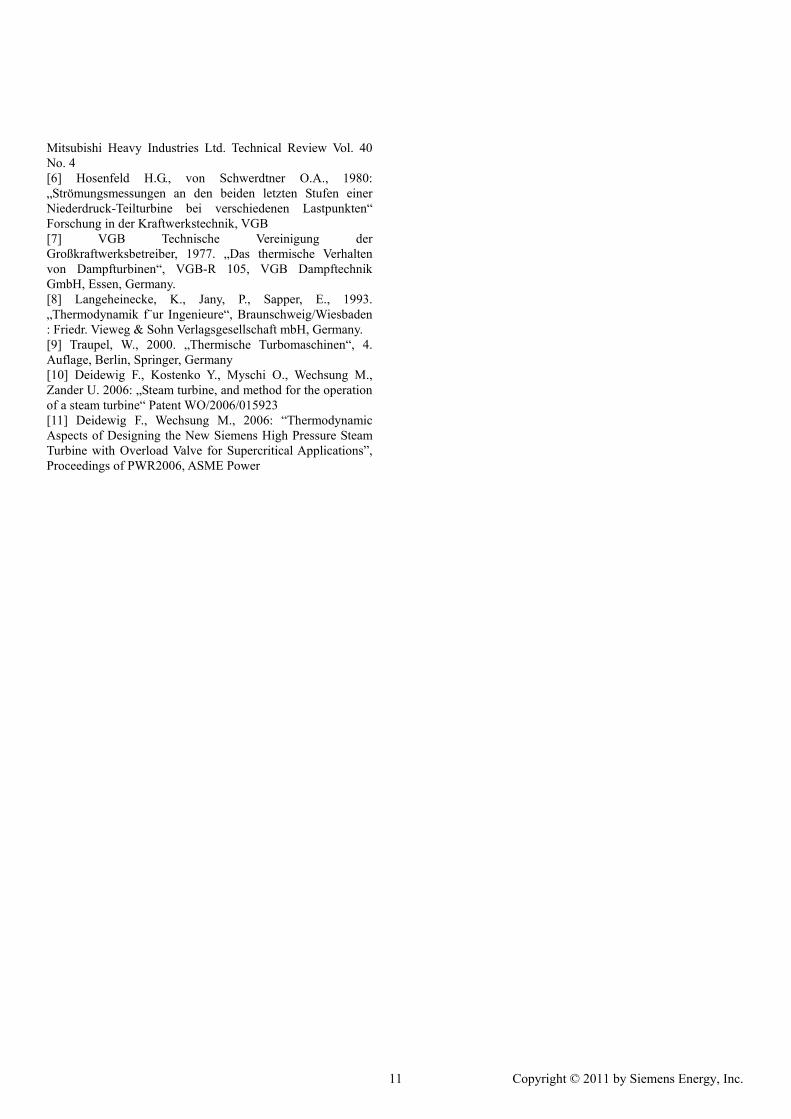
G) show the largest amplitudes, which is a result of the location of the shaft sealing connections. These temperature differences even exceed the 100% line, but certainly radial clearances are not bridged because the shaft sealing areas (measurement planes C-C and G-G) only have a minor effect on movement of the inner casing. This phenomenon is a good example for explaining the need to weight the temperature differences of different measurement planes individually – as outlined above. Furthermore, the diagram shows the effect of shutting down the gland steam supply while the turbine is still in turning operation mode. Nevertheless the temperature differences stay on a higher level or even increase. During this load case with low steam flow, a thermal layering caused by natural convection builds up in the space between inner and outer casings. This leads to a weighted temperature difference which is illustrated in Figure 17. Again the measured values are within the range of experience since the dashed lines permit a considerably wider range for reliable operation.
-100%
-50%
0%
50%
100%
0 12 24 36 48 60 72 84 96
Time [h]
/
max
Des
ign
Weighted Temperature Difference Range of Experience
Figure 17: WEIGHTED TEMPERATURE DIFFERENCES TOP TO BOTTOM DURING COOL DOWN
9 Copyright © 2011 by Siemens Energy, Inc.
CONCLUSION Modern steam turbines have to operate at highest steam
temperatures and pressures (USC) and need to be capable of operating at fast load transients. At the same time they are required to have maximum efficiency. Therefore, radial clearances between rotor and casing have to be minimized and this again requires minimum deflection of the components. Designing modern steam turbines requires using the latest materials, considering special features for achieving optimum temperature distributions and calculating mechanics with the most advanced numerical tools.
The know-how of steam turbine manufacturers is generally based on very comprehensive experience, continuous improvement of calculation tools and evolutionary design development. Therefore, detailed validation of steam turbines is an important element of the development process of new products.
This paper describes an extensive validation program carried out at an ultra-supercritical (USC) 1000 MW steam power plant. The high pressure (HP) turbine has been equipped with additional temperature measurement sensors. Temperatures have been recorded for different load cases and compared to calculated values (by FEM) which were the basis for the component design.
Besides validating design rules, material data and design tools special design features have been analyzed in detail. The innovative patented internal cooling system of the HP turbine proved it’s functionality; the casing temperature differences for different load cases improved further compared to former designs despite the increased steam conditions. Measured temperatures matched the FEM approach and proved the optimized temperature distribution supporting maximum tightness and minimum casing deflection.
Overall, the extensive validation program carried out at an operating 1000 MW steam turbine power plant under different load cases proved the expected behavior of the innovative design and the reliability of the applied rules and tools.
PERMISSION FOR USE: The content of this paper is copyrighted by Siemens
Energy, Inc. and is licensed to ASME for publication and distribution only. Any inquiries regarding permission to use the content of this paper, in whole or in part, for any purpose must be addressed to Siemens Energy, Inc. directly.
NOMENCLATURE A area, m2 C correction factor CFD computational fluid dynamics d differential FEM finite element method h height (of deflection), m
HP high pressure IP intermediate pressure l length, m LP low pressure MW mega watts Q heat flow, kJ/s
r radius, m s distance, m USC ultra super critical W weighting factor
heat transfer coefficient, kJ/(s m2 K) thermal expansion coefficient, 1/K temperature, K cylinder bend heat conductivity, kJ/(s m K) density, kg/m³ c specific heat capacity, kJ/(kg K) difference Subscripts c cylinder cond conductive conv convective i axial casing section m mean value S Steam w&c weighted and corrected
ACKNOWLEDGMENTS As mentioned above, steam turbine validation is always
based on close customer relations. The presented validation program would not have been possible without the excellent support of the WaiGaoQiao customer. We would especially like to thank the power plant manager Mr. Feng – both personally and as a representative of the team that supported the validation program.
REFERENCES [1] Wichtmann A., Deckers M., Ulm W., 2005. “Ultra supercritical steam turbine turbosets – Best efficiency solution for conventional steam power plants”, International Conference on Electrical Engineering, Kunming, China. [2] Bettentrup J., Richter C., Stueer H., 2006. „The cutting edge“, MEE Jounal, September 2006 [3] Helm, Spliethoff, Neef M., 2008 "Breaking the swirl with brush seals - numerical modeling and experimental evidence", GT2008-50257, ASME Turbo Expo 2008 [4] Heinz, C., Schatz, M., Casey, M., Stüer, H.: Experimental and analytical investigations of a low pressure model turbine during forced response exitation, ASME Turbo Expo 2010 [5] Watanabe E., Tanaka Y., Nakano T., Ohyama H., Tanaka T., Miyawaki T., Tsutsumi M., Shinohara T., 2003. “Development of new high efficiency steam turbine”,
10 Copyright © 2011 by Siemens Energy, Inc.
Mitsubishi Heavy Industries Ltd. Technical Review Vol. 40 No. 4 [6] Hosenfeld H.G., von Schwerdtner O.A., 1980: „Strömungsmessungen an den beiden letzten Stufen einer Niederdruck-Teilturbine bei verschiedenen Lastpunkten“ Forschung in der Kraftwerkstechnik, VGB [7] VGB Technische Vereinigung der Großkraftwerksbetreiber, 1977. „Das thermische Verhalten von Dampfturbinen“, VGB-R 105, VGB Dampftechnik GmbH, Essen, Germany. [8] Langeheinecke, K., Jany, P., Sapper, E., 1993. „Thermodynamik f¨ur Ingenieure“, Braunschweig/Wiesbaden : Friedr. Vieweg & Sohn Verlagsgesellschaft mbH, Germany. [9] Traupel, W., 2000. „Thermische Turbomaschinen“, 4. Auflage, Berlin, Springer, Germany [10] Deidewig F., Kostenko Y., Myschi O., Wechsung M., Zander U. 2006: „Steam turbine, and method for the operation of a steam turbine“ Patent WO/2006/015923 [11] Deidewig F., Wechsung M., 2006: “Thermodynamic Aspects of Designing the New Siemens High Pressure Steam Turbine with Overload Valve for Supercritical Applications”, Proceedings of PWR2006, ASME Power
11 Copyright © 2011 by Siemens Energy, Inc.