valencia single family homes november 2014
TRANSCRIPT

Nov-2014512,500
Nov-2012430,500
%19
Change82,000
Nov-2012 vs Nov-2014: The median sold price is up 19%Median Sold Price by Month
RE/MAX's Paris911 Team
Nov-2012 vs. Nov-2014
Connor and Paris MacIVOR
Clarus MarketMetrics® 12/08/2014Information not guaranteed. © 2014 - 2015 Terradatum and its suppliers and licensors (www.terradatum.com/about/partners).
1/2
MLS: CRMLS Bedrooms:AllAll
Construction Type:All2 Year Monthly SqFt:
Bathrooms: Lot Size:All All Square FootagePeriod:All
Cities:Property Types: : Residential
ValenciaPrice:

Median Sold Price by MonthNov-2012 vs Nov-2014: The median sold price is up 19%
RE/MAX's Paris911 TeamConnor and Paris MacIVOR
Sold Median Price Units Avg DOMTime Period
Nov-14 512,500 58 64
Oct-14 562,500 66 73
Sep-14 529,950 56 73
Aug-14 552,500 64 68
Jul-14 530,000 53 58
Jun-14 555,000 57 51
May-14 550,000 62 62
Apr-14 535,000 69 50
Mar-14 485,000 45 73
Feb-14 515,000 35 59
Jan-14 470,000 54 61
Dec-13 472,500 58 66
Nov-13 480,000 48 52
Oct-13 494,000 63 46
Sep-13 515,000 47 44
Aug-13 480,000 61 43
Jul-13 457,000 71 42
Jun-13 467,500 60 47
May-13 450,000 67 40
Apr-13 465,000 71 46
Mar-13 425,520 59 62
Feb-13 463,500 45 67
Jan-13 410,000 39 38
Dec-12 447,500 62 74
Nov-12 430,500 42 97
Clarus MarketMetrics® 12/08/2014Information not guaranteed. © 2014 - 2015 Terradatum and its suppliers and licensors (www.terradatum.com/about/partners).
22/

Nov-2012 vs Nov-2014: The median price of for sale properties is up 27% and the median price of sold properties is up 19%
RE/MAX's Paris911 Team
Nov-2012 vs. Nov-2014
447,450 27
Connor and Paris MacIVOR
567,041Nov-2014
Median For Sale vs Median Sold
ChangeNov-2012 %119,591
Nov-2012 Nov-2014 %430,500 19
Nov-2012 vs. Nov-2014
512,500Change82,000
Clarus MarketMetrics® 12/08/2014Information not guaranteed. © 2014 - 2015 Terradatum and its suppliers and licensors (www.terradatum.com/about/partners).
1/2
MLS: CRMLS Bedrooms:AllAll
Construction Type:All2 Year Monthly SqFt:
Bathrooms: Lot Size:All All Square FootagePeriod:All
Cities:Property Types: : Residential
ValenciaPrice:

Median For Sale vs Median SoldNov-2012 vs Nov-2014: The median price of for sale properties is up 27% and the median price of sold properties is up 19%
RE/MAX's Paris911 TeamConnor and Paris MacIVOR
For SaleMedian SoldMedianFor Sale # Properties # PropertiesSold Price Difference
Time Period
Nov-14 157 58567,041 512,500 -54,541Oct-14 206 66572,200 562,500 -9,700Sep-14 238 56574,603 529,950 -44,653Aug-14 251 64575,000 552,500 -22,500Jul-14 258 53575,000 530,000 -45,000Jun-14 249 57578,000 555,000 -23,000May-14 230 62579,949 550,000 -29,949Apr-14 224 69569,949 535,000 -34,949Mar-14 211 45569,000 485,000 -84,000Feb-14 192 35562,475 515,000 -47,475Jan-14 197 54575,000 470,000 -105,000Dec-13 188 58540,000 472,500 -67,500Nov-13 214 48539,500 480,000 -59,500Oct-13 224 63539,450 494,000 -45,450Sep-13 238 47534,950 515,000 -19,950Aug-13 218 61530,000 480,000 -50,000Jul-13 198 71525,000 457,000 -68,000Jun-13 184 60499,949 467,500 -32,449May-13 163 67480,000 450,000 -30,000Apr-13 159 71480,000 465,000 -15,000Mar-13 157 59479,800 425,520 -54,280Feb-13 157 45469,900 463,500 -6,400Jan-13 137 39475,000 410,000 -65,000Dec-12 129 62449,000 447,500 -1,500Nov-12 140 42447,450 430,500 -16,950
Clarus MarketMetrics®Information not guaranteed. © 2014 - 2015 Terradatum and its suppliers and licensors (www.terradatum.com/about/partners).
12/08/201422/

Nov-201458
Nov-201242
%38
Change16
Nov-2012 vs Nov-2014: The number of Sold properties is up 38%Sold Properties by Month
RE/MAX's Paris911 Team
Nov-2012 vs. Nov-2014
Connor and Paris MacIVOR
Clarus MarketMetrics® 12/08/2014Information not guaranteed. © 2014 - 2015 Terradatum and its suppliers and licensors (www.terradatum.com/about/partners).
1/2
MLS: CRMLS Bedrooms:AllAll
Construction Type:All2 Year Monthly SqFt:
Bathrooms: Lot Size:All All Square FootagePeriod:All
Cities:Property Types: : Residential
ValenciaPrice:

Sold Properties by MonthNov-2012 vs Nov-2014: The number of Sold properties is up 38%
RE/MAX's Paris911 TeamConnor and Paris MacIVOR
Time Period
Full Market
Units Median Price Avg DOM
Bank Properties
Units % Bank Median Price
Non-Bank Properties
Units % Non-Bank Median Price
Nov-14 512,50058 64 2 3.4 470,000 56 96.6 512,500
Oct-14 562,50066 73 4 6.1 543,375 62 93.9 562,500
Sep-14 529,95056 73 3 5.4 911,500 53 94.6 515,000
Aug-14 552,50064 68 5 7.8 504,000 59 92.2 560,000
Jul-14 530,00053 58 2 3.8 405,000 51 96.2 540,000
Jun-14 555,00057 51 0 0.0 57 100.0 555,000
May-14 550,00062 62 4 6.5 649,500 58 93.5 547,500
Apr-14 535,00069 50 7 10.1 575,000 62 89.9 527,500
Mar-14 485,00045 73 5 11.1 470,000 40 88.9 490,000
Feb-14 515,00035 59 2 5.7 628,500 33 94.3 515,000
Jan-14 470,00054 61 9 16.7 403,000 45 83.3 475,000
Dec-13 472,50058 66 7 12.1 430,000 51 87.9 482,500
Nov-13 480,00048 52 3 6.2 340,000 45 93.8 484,000
Oct-13 494,00063 46 14 22.2 439,000 49 77.8 500,000
Sep-13 515,00047 44 7 14.9 460,000 40 85.1 520,000
Aug-13 480,00061 43 10 16.4 398,000 51 83.6 487,500
Jul-13 457,00071 42 12 16.9 385,000 59 83.1 465,000
Jun-13 467,50060 47 10 16.7 392,500 50 83.3 489,500
May-13 450,00067 40 15 22.4 379,900 52 77.6 468,500
Apr-13 465,00071 46 16 22.5 432,500 55 77.5 476,000
Mar-13 425,52059 62 16 27.1 344,750 43 72.9 460,000
Feb-13 463,50045 67 17 37.8 369,900 28 62.2 531,250
Jan-13 410,00039 38 18 46.2 380,500 21 53.8 420,000
Dec-12 447,50062 74 30 48.4 377,500 32 51.6 459,325
Nov-12 430,50042 97 17 40.5 350,000 25 59.5 470,000
Clarus MarketMetrics® 12/08/2014Information not guaranteed. © 2014 - 2015 Terradatum and its suppliers and licensors (www.terradatum.com/about/partners).
22/

Nov-201448
Nov-201244
%9
Change4
Nov-2012 vs Nov-2014: The number of Under Contract properties is up 9%Under Contract Properties by Month
RE/MAX's Paris911 Team
Nov-2012 vs. Nov-2014
Connor and Paris MacIVOR
Clarus MarketMetrics® 12/08/2014Information not guaranteed. © 2014 - 2015 Terradatum and its suppliers and licensors (www.terradatum.com/about/partners).
1/2
AllBathrooms: SqFt:All
: Residential
All Square FootageConstruction Type: Lot Size:CRMLS
Valencia
Period: 2 Year MonthlyPrice:MLS:
All AllAll
Property Types:
Bedrooms:
Cities:

Under Contract Properties by MonthNov-2012 vs Nov-2014: The number of Under Contract properties is up 9%
RE/MAX's Paris911 TeamConnor and Paris MacIVOR
Median Price UnitsUnits Median Price% Non-Bank
Full Market
% BankAvg DOMMedian Price
Bank Properties
Units
Non-Bank Properties
Time PeriodNov-14 532,45048 47 534,95083.340467,50016.78Oct-14 525,00074 63 529,00093.269460,0006.85Sep-14 545,00065 72 547,45089.258509,25010.87Aug-14 553,45060 73 543,99091.755639,0008.35Jul-14 544,00058 58 549,00098.357460,0001.71Jun-14 549,38754 61 549,387100.0540.00May-14 552,50058 59 558,95089.752505,00010.36Apr-14 542,45068 60 545,00092.663450,0007.45Mar-14 520,00057 63 520,00093.053462,9507.04Feb-14 530,00055 58 539,00089.149512,50010.96Jan-14 510,00053 68 499,98084.945555,00015.18Dec-13 475,00039 58 484,90089.735394,45010.34Nov-13 483,70044 59 483,70095.542462,0504.52Oct-13 495,00059 55 497,45091.554469,9008.55Sep-13 493,50056 59 500,00080.445449,00019.611Aug-13 530,00051 43 530,00088.245502,50011.86Jul-13 475,00055 50 477,45087.348409,90012.77Jun-13 469,99059 37 475,00086.451425,00013.68May-13 449,99959 32 450,00089.853424,90010.26Apr-13 475,00065 31 475,00084.655447,00015.410Mar-13 449,90071 41 479,80077.555362,50022.516Feb-13 450,00059 61 459,95076.345349,95023.714Jan-13 440,50042 60 526,95066.728372,50033.314Dec-12 420,00039 56 464,45066.726350,00033.313Nov-12 435,00044 67 442,50063.628387,49936.416
Clarus MarketMetrics® 12/08/2014Information not guaranteed. © 2014 - 2015 Terradatum and its suppliers and licensors (www.terradatum.com/about/partners).
22/

Nov-201444
Nov-201242
%5
Change2
Nov-2012 vs Nov-2014: The number of New properties is up 5%New Properties by Month
RE/MAX's Paris911 Team
Nov-2012 vs. Nov-2014
Connor and Paris MacIVOR
Clarus MarketMetrics® 12/08/2014Information not guaranteed. © 2014 - 2015 Terradatum and its suppliers and licensors (www.terradatum.com/about/partners).
1/2
MLS: CRMLS Bedrooms:AllAll
Construction Type:All2 Year Monthly SqFt:
Bathrooms: Lot Size:All All Square FootagePeriod:All
Cities:Property Types: : Residential
ValenciaPrice:

New Properties by MonthNov-2012 vs Nov-2014: The number of New properties is up 5%
RE/MAX's Paris911 TeamConnor and Paris MacIVOR
Median Price UnitsUnits Median Price% Non-Bank
Full Market
% BankMedian Price
Bank Properties
Units
Non-Bank Properties
Time PeriodNov-14 555,00044 2 4.5 704,950 42 95.5 555,000Oct-14 559,00059 4 6.8 589,950 55 93.2 559,000Sep-14 557,45074 7 9.5 525,000 67 90.5 564,900Aug-14 552,49966 6 9.1 619,450 60 90.9 549,949Jul-14 555,00081 0 0.0 81 100.0 555,000Jun-14 558,00090 4 4.4 659,720 86 95.6 553,500May-14 569,94990 5 5.6 434,900 85 94.4 578,000Apr-14 519,90079 7 8.9 485,000 72 91.1 529,500Mar-14 535,00091 7 7.7 483,230 84 92.3 549,500Feb-14 540,00067 8 11.9 485,000 59 88.1 544,900Jan-14 569,50071 3 4.2 695,000 68 95.8 559,250Dec-13 502,50030 5 16.7 495,000 25 83.3 515,000Nov-13 510,00061 4 6.6 409,950 57 93.4 530,000Oct-13 499,99058 5 8.6 400,000 53 91.4 500,000Sep-13 529,00089 12 13.5 476,500 77 86.5 539,900Aug-13 530,00092 11 12.0 525,000 81 88.0 530,000Jul-13 509,47584 18 21.4 414,450 66 78.6 547,450Jun-13 489,90087 10 11.5 465,600 77 88.5 499,000May-13 487,45082 9 11.0 415,000 73 89.0 509,000Apr-13 475,00078 8 10.3 441,449 70 89.7 475,000Mar-13 465,00065 13 20.0 365,000 52 80.0 489,950Feb-13 469,00072 13 18.1 349,900 59 81.9 489,000Jan-13 484,40058 7 12.1 475,000 51 87.9 490,000Dec-12 448,70039 13 33.3 459,000 26 66.7 443,100Nov-12 449,97542 15 35.7 379,900 27 64.3 490,000
Clarus MarketMetrics® 12/08/2014Information not guaranteed. © 2014 - 2015 Terradatum and its suppliers and licensors (www.terradatum.com/about/partners).
22/

Nov-2014157
Nov-2012140
%12
Change17
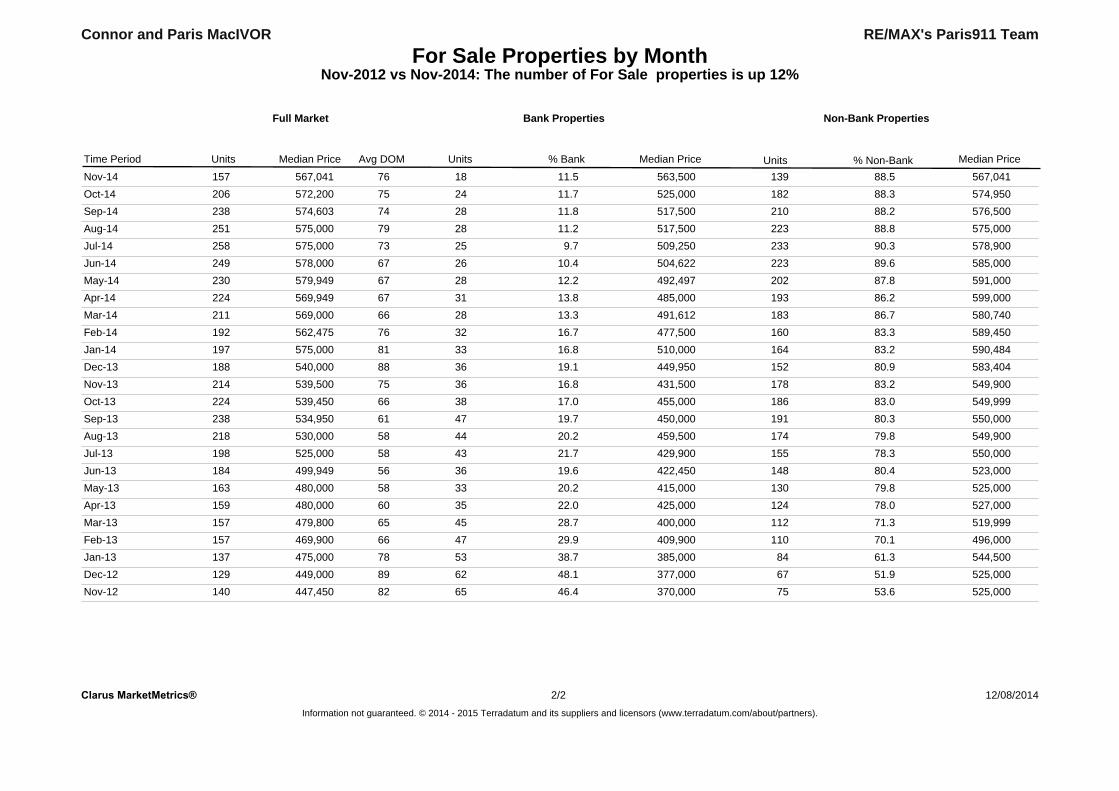
Nov-2012 vs Nov-2014: The number of For Sale properties is up 12%For Sale Properties by Month
RE/MAX's Paris911 Team
Nov-2012 vs. Nov-2014
Connor and Paris MacIVOR
Clarus MarketMetrics® 12/08/2014Information not guaranteed. © 2014 - 2015 Terradatum and its suppliers and licensors (www.terradatum.com/about/partners).
1/2
MLS: CRMLS Bedrooms:AllAll
Construction Type:All2 Year Monthly SqFt:
Bathrooms: Lot Size:All All Square FootagePeriod:All
Cities:Property Types: : Residential
ValenciaPrice:
For Sale Properties by MonthNov-2012 vs Nov-2014: The number of For Sale properties is up 12%
RE/MAX's Paris911 TeamConnor and Paris MacIVOR
Median Price UnitsUnits Median Price% Non-Bank
Full Market
% BankAvg DOMMedian Price
Bank Properties
Units
Non-Bank Properties
Time Period
Nov-14 567,041157 76 18 11.5 563,500 139 88.5 567,041Oct-14 572,200206 75 24 11.7 525,000 182 88.3 574,950Sep-14 574,603238 74 28 11.8 517,500 210 88.2 576,500Aug-14 575,000251 79 28 11.2 517,500 223 88.8 575,000Jul-14 575,000258 73 25 9.7 509,250 233 90.3 578,900Jun-14 578,000249 67 26 10.4 504,622 223 89.6 585,000May-14 579,949230 67 28 12.2 492,497 202 87.8 591,000Apr-14 569,949224 67 31 13.8 485,000 193 86.2 599,000Mar-14 569,000211 66 28 13.3 491,612 183 86.7 580,740Feb-14 562,475192 76 32 16.7 477,500 160 83.3 589,450Jan-14 575,000197 81 33 16.8 510,000 164 83.2 590,484Dec-13 540,000188 88 36 19.1 449,950 152 80.9 583,404Nov-13 539,500214 75 36 16.8 431,500 178 83.2 549,900Oct-13 539,450224 66 38 17.0 455,000 186 83.0 549,999Sep-13 534,950238 61 47 19.7 450,000 191 80.3 550,000Aug-13 530,000218 58 44 20.2 459,500 174 79.8 549,900Jul-13 525,000198 58 43 21.7 429,900 155 78.3 550,000Jun-13 499,949184 56 36 19.6 422,450 148 80.4 523,000May-13 480,000163 58 33 20.2 415,000 130 79.8 525,000Apr-13 480,000159 60 35 22.0 425,000 124 78.0 527,000Mar-13 479,800157 65 45 28.7 400,000 112 71.3 519,999Feb-13 469,900157 66 47 29.9 409,900 110 70.1 496,000Jan-13 475,000137 78 53 38.7 385,000 84 61.3 544,500Dec-12 449,000129 89 62 48.1 377,000 67 51.9 525,000Nov-12 447,450140 82 65 46.4 370,000 75 53.6 525,000
Clarus MarketMetrics® 12/08/2014Information not guaranteed. © 2014 - 2015 Terradatum and its suppliers and licensors (www.terradatum.com/about/partners).
22/

Nov-201421
Nov-20126
%250
Change15
Nov-2012 vs Nov-2014: The number of Expired properties is up 250%Expired Properties by Month
RE/MAX's Paris911 Team
Nov-2012 vs. Nov-2014
Connor and Paris MacIVOR
12/08/2014Clarus MarketMetrics® 1/2
MLS: CRMLS Bedrooms:AllAll
Construction Type:All2 Year Monthly SqFt:
Bathrooms: Lot Size:All All Square FootagePeriod:All
Cities:Property Types: : Residential
ValenciaPrice:

Expired Properties by MonthNov-2012 vs Nov-2014: The number of Expired properties is up 250%
RE/MAX's Paris911 TeamConnor and Paris MacIVOR
Median Price Units% BankAvg DOMUnits Median Price
Bank Properties
Units
Non-Bank Properties
% Non-Bank Median Price
Full Market
Nov-14 540,00021 113 4 19.0 448,950 17 81.0 550,000Oct-14 785,00019 101 3 15.8 669,900 16 84.2 830,000Sep-14 586,20026 74 1 3.8 699,000 25 96.2 579,900Aug-14 649,00027 93 2 7.4 505,000 25 92.6 679,799Jul-14 600,00015 92 2 13.3 445,000 13 86.7 629,000Jun-14 584,45018 52 1 5.6 499,995 17 94.4 599,000May-14 649,90013 76 0 0.0 13 100.0 649,900Apr-14 532,45016 57 3 18.8 460,000 13 81.2 725,000Mar-14 640,0009 71 0 0.0 9 100.0 640,000Feb-14 489,90017 52 5 29.4 390,000 12 70.6 557,450Jan-14 667,34019 74 1 5.3 639,900 18 94.7 708,420Dec-13 635,00023 71 2 8.7 417,500 21 91.3 639,900Nov-13 542,50012 132 3 25.0 350,000 9 75.0 599,900Oct-13 632,50012 44 1 8.3 615,000 11 91.7 650,000Sep-13 557,45016 91 3 18.8 429,900 13 81.2 575,000Aug-13 525,00018 45 3 16.7 533,500 15 83.3 520,000Jul-13 629,00017 55 3 17.6 370,000 14 82.4 649,500Jun-13 470,88811 29 3 27.3 325,000 8 72.7 589,000May-13 495,0007 142 1 14.3 425,000 6 85.7 502,500Apr-13 775,00013 97 1 7.7 295,000 12 92.3 837,000Mar-13 449,9005 145 2 40.0 500,000 3 60.0 449,900Feb-13 482,0006 84 1 16.7 239,900 5 83.3 499,000Jan-13 569,60010 110 5 50.0 340,500 5 50.0 799,900Dec-12 484,10011 146 3 27.3 379,500 8 72.7 589,500Nov-12 724,9506 138 0 0.0 6 100.0 724,950
Clarus MarketMetrics® 12/08/2014Information not guaranteed. © 2014 - 2015 Terradatum and its suppliers and licensors (www.terradatum.com/about/partners).
22/

Nov-2012 vs Nov-2014: The number of for sale properties is up 12% and the number of sold properties is up 38%
RE/MAX's Paris911 Team
Nov-2012 vs. Nov-2014
140 12
Connor and Paris MacIVOR
157Nov-2014
Supply & Demand by Month
ChangeNov-2012 %17
Nov-2012 Nov-2014 %42 38
Nov-2012 vs. Nov-2014
58Change
16
Clarus MarketMetrics® 12/08/2014Information not guaranteed. © 2014 - 2015 Terradatum and its suppliers and licensors (www.terradatum.com/about/partners).
1/2
MLS: CRMLS Bedrooms:AllAll
Construction Type:All2 Year Monthly SqFt:
Bathrooms: Lot Size:All All Square FootagePeriod:All
Cities:Property Types: : Residential
ValenciaPrice:

Supply & Demand by MonthNov-2012 vs Nov-2014: The number of for sale properties is up 12% and the number of sold properties is up 38%
Connor and Paris MacIVOR RE/MAX's Paris911 Team
For Sale Sold# Properties
Avg DOM Avg DOM# Properties
Time Period
Nov-14 76 64157 58Oct-14 75 73206 66Sep-14 74 73238 56Aug-14 79 68251 64Jul-14 73 58258 53Jun-14 67 51249 57May-14 67 62230 62Apr-14 67 50224 69Mar-14 66 73211 45Feb-14 76 59192 35Jan-14 81 61197 54Dec-13 88 66188 58Nov-13 75 52214 48Oct-13 66 46224 63Sep-13 61 44238 47Aug-13 58 43218 61Jul-13 58 42198 71Jun-13 56 47184 60May-13 58 40163 67Apr-13 60 46159 71Mar-13 65 62157 59Feb-13 66 67157 45Jan-13 78 38137 39Dec-12 89 74129 62Nov-12 82 97140 42
Clarus MarketMetrics® 12/08/2014Information not guaranteed. © 2014 - 2015 Terradatum and its suppliers and licensors (www.terradatum.com/about/partners).
22/

Nov-201447
Nov-201267
%-30
Change-20
Nov-2012 vs Nov-2014: The average days on market is down -30%The Average Days on Market by Month
RE/MAX's Paris911 Team
Nov-2012 vs. Nov-2014
Connor and Paris MacIVOR
ValenciaAll 2 Year Monthly
Cities:Period:Price:
Property Types: : Residential
12/08/20141/2Clarus MarketMetrics®
All Square FootageBedrooms: All AllSqFt:
All Lot Size:Bathrooms:AllConstruction Type:MLS: CRMLS

The Average Days on Market by MonthNov-2012 vs Nov-2014: The average days on market is down -30%
RE/MAX's Paris911 TeamConnor and Paris MacIVOR
# UC UnitsAvg DOMTime PeriodNov-14 4847Oct-14 7463Sep-14 6572Aug-14 6073Jul-14 5858Jun-14 5461May-14 5859Apr-14 6860Mar-14 5763Feb-14 5558Jan-14 5368Dec-13 3958Nov-13 4459Oct-13 5955Sep-13 5659Aug-13 5143Jul-13 5550Jun-13 5937May-13 5932Apr-13 6531Mar-13 7141Feb-13 5961Jan-13 4260Dec-12 3956Nov-12 4467
Clarus MarketMetrics® 2/2 12/08/2014Information not guaranteed. © 2014 - 2015 Terradatum and its suppliers and licensors (www.terradatum.com/about/partners).

Nov-2012 vs Nov-2014: The average months supply of inventory is down -10.0%
RE/MAX's Paris911 Team
Nov-2012 vs. Nov-2014
2.0 -10.0
Connor and Paris MacIVOR
1.8Nov-2014
Months Supply of Inventory
ChangeNov-2012 %-0.2
Clarus MarketMetrics® 12/08/2014Information not guaranteed. © 2014 - 2015 Terradatum and its suppliers and licensors (www.terradatum.com/about/partners).
1/2
MLS: CRMLS Bedrooms:AllAll
Construction Type:All2 Year Monthly SqFt:
Bathrooms: Lot Size:All All Square FootagePeriod:All
Cities:Property Types: : Residential
ValenciaPrice:

Months Supply of InventoryNov-2012 vs Nov-2014: The average months supply of inventory is down -10.0%
Connor and Paris MacIVOR RE/MAX's Paris911 Team
During MonthLast Day of Month MSI# Units For Sale # UC Units
UC Avg DOMTime Period
Nov-14 48 4788 1.8Oct-14 74 63113 1.5Sep-14 65 72147 2.3Aug-14 60 73164 2.7Jul-14 58 58185 3.2Jun-14 54 61177 3.3May-14 58 59159 2.7Apr-14 68 60140 2.1Mar-14 57 63145 2.5Feb-14 55 58120 2.2Jan-14 53 68125 2.4Dec-13 39 58126 3.2Nov-13 44 59158 3.6Oct-13 59 55153 2.6Sep-13 56 59166 3.0Aug-13 51 43149 2.9Jul-13 55 50126 2.3Jun-13 59 37114 1.9May-13 59 3297 1.6Apr-13 65 3181 1.2Mar-13 71 4181 1.1Feb-13 59 6192 1.6Jan-13 42 6085 2.0Dec-12 39 5679 2.0Nov-12 44 6790 2.0
Clarus MarketMetrics® 12/08/2014Information not guaranteed. © 2014 - 2015 Terradatum and its suppliers and licensors (www.terradatum.com/about/partners).
22/