v118n1a2 a mine-to-mill economic analysis model and ... · tracer in a plastic shell has been...
TRANSCRIPT
In a copper mining operation, the copperrecovery in the mineral processing circuit isaffected by upstream operations. The upstreamoperations in a conventional copper mineinclude blasting, excavation, crushing,transportation, stockpile storage, as well asmilling in semi-autogenous grinding (SAG)and ball mills. Varying the specific explosiveenergy may have a significant impact on thedownstream comminution processes, and canmaximize the cost savings between blastingand ball milling while achieving a sufficientlysmall P80 at the ball mill (Chung andKatsabanis, 2000; Nielson and Lownds, 1997;Nielsen and Malvik, 1999; Scott, 1996). P80 isthe 80% passing size in the cumulative sizedistribution (both post-blast and post-millfragmentation), and it is generally used as arepresentative size of the fragmentation in thehard-rock mining industry. However, for amine with two or more ore types, thesesavings are difficult to estimate in absence of
an ore-tracking method that can detect oretype as well as estimate fragment sizes (Kimand Kemeny, 2011). There are challenges toore-tracking methods as well, resulting fromthorough mixing of ore, for example at thestockpiles. Dissimilarities between ore types interms of their blastability, crushability, andgrindability add to the complexity ofestimating the energy expenditure required toachieve a target P80 during milling. Insummary, although it may be difficult, it isimportant for mine operators to distinguishbetween ore types so as to be able to calibratethe total explosives energy accordingly inorder to maximize the total cost savings over aperiod of time.
Tracking systems have been used in minesfor other purposes in the past. A system basedon a radio frequency identification (RFID)tracer in a plastic shell has been developed(Jansen et al., 2009). Although this tracer doesnot provide continuous tracking of all oretypes in a mine, it could be used to track oretransported between stockpiles and bins.Similarly, RFID tracers have been used to trackblast movements (La Rosa and Thornton,2011). Continuous tracking already exists forall ore transported from pits to crushers(Modular Mining, 2014). This tracking isbased on global positioning system (GPS)devices attached to the trucks hauling ore fromshovel sites to the primary crushers. However,the tracking process does not continue throughthe comminution circuit and stockpiles. Thus,tracking ore movement from blast sites to theball mills requires prediction and tagging ofore type of each individual fragmenttransported on trucks and conveyors. Taggingand prediction is useful in mines where themajority of fragments are over 1 inch
A mine-to-mill economic analysis modeland spectral imaging-based trackingsystem for a copper mineby S.S. Nageshwaraniyer, K. Kim, and Y-J Son
An economic analysis model is proposed for estimating the cost savingsincurred in all operations, from blasting to milling, in a copper mine usingspectral imaging-based tracking. A conventional mid-sized copper mine inArizona with two ore types is used as a case study. First, a combinedregression and discrete event simulation model of the material-handlingnetwork of the mine, constructed in ArenaTM, is used mainly to obtainthroughput information at pits, crusher, and mills as well as the stochasticpower consumption at each operation from mine to mill. The two ore typesare assumed to be distinguished using a spectral imaging-based trackingmethod. The main components of the spectral imaging-based trackingmethod are a multispectral camera and a regression model consisting ofpartial least-squares, principal component, or logistic regression methods.Partial least-squares, principal component, and logistic regression methodsare then compared to select the best method to distinguish various oretypes sampled from the mine. Finally, an economic analysis model basedon tracking results fed to the simulation model is used to demonstrate thecost savings for each ore type as a function of the specific explosiveenergies. This is a preliminary study of the economic analysis of overallcost savings before testing in an actual copper mine.
mine-to-mill optimization, copper mine, ore tracking, hyperspectralimaging, multispectral, discrete event simulation.
* University of Arizona, USA.© The Southern African Institute of Mining and
Metallurgy, 2018. ISSN 2225-6253. Paper receivedMar. 2017; revised paper received May 2017.
7VOLUME 118 �
http://dx.doi.org/10.17159/2411-9717/2018/v118n1a2
A mine-to-mill economic analysis model and spectral imaging-based tracking system
(2.54 cm) in size, which, in the authors’ experience, is thetypical cut-off size for feasible prediction of ore type. Wherefragment sizes are smaller, bulk tagging and prediction canbe more useful than individual tagging and prediction. X-rayfluorescence, X-ray diffraction, and imaging spectrometry arepossible technologies that can be used to remotely sense themineral content in fragments (Klug and Alexander, 1954).Imaging spectrometry relies on obtaining electromagneticspectra from the minerals of interest. It has been used in thepast to detect minerals having spectral reflectancecharacteristics (SRC) in the visible and invisible parts of theelectromagnetic spectrum. Some of its applications includemineral mapping (Tangestani et al., 2011), vegetationspecies identification (Bechtel, Ribard, and Sánchez-Azofeifa,2002), and rock discrimination (Sgavetti et al., 2007; Combset al., 2011) among others. The works cited have shown thatwavelengths between 400 nm and 2500 nm, comprising bothvisible and near-infrared (VNIR) and short-wave infrared(SWIR) spectra, are the most useful for discrimination.Statistical analysis methods such as partial least-squaresregression (PLSR) can be used for discriminating betweenmineral types based on a hyperspectral image (Haaland andThomas, 1988; Blanco and Peguero, 2011). Principalcomponent regression (PCR) is a method similar to PLSR thatuses principal component analysis (PCA) to determine theunknown regression coefficients. Logistic regression (LR) isanother competitive method for discriminant analysis, wherethe output specifies a particular fragment explicitly andcategorically as belonging to an ore type.
To solve the tracking problem, we developed a spectralimaging-based automated tracking method for ore types andfragmentation. We demonstrate cost savings from applyingthe proposed system using a simulated conventional coppermine. A generic small-sized copper mine with two differenttypes of ore – hard and soft rock (names of ore aligned withthose used in the case study) – is considered. In general,mathematical programming and computer simulation can beapplied to model mining operations in order to obtain variousperformance measures such as production and equipmentutilization. When used as a standalone tool, stochasticprogramming is best suited for instances where the goal is tomaximize a performance measure such as production underconstraints with stochastic model parameters (Kataoka,1963; Kall, Wallace, and Kall, 1994; Sahinidis, 2004;Santelices et al., 2017). But when combined with simulation,in addition to maximization of a measure, the combined toolcan be used to evaluate system performance measures as wellas keep track of detailed system statuses over time, such aslocations of trucks and movement of ore on conveyors.Simulation models of most processes in mines can beconstructed through a combination of discrete eventsimulation and process simulation. The need to use processsimulation arises when environmental factors underlyingcrushing and grinding processes vary significantly enough toimpact performance measures such as quality of throughput.There are several recent applications of process simulation tomodel the underlying dynamics in crushers (Asbjörnsson,Hulthén, and Evertsson, 2012, 2013; da Cunha, de Carvalho,and Tavares, 2013; Asbjörnsson et al., 2016). Discrete eventsimulation has been applied to model truck-shovel haulageoperations in surface coal mines, underground mines, and
similar operations in construction such as earth movement(Zhang, 2008; Meng et al., 2013; Nageshwaraniyer, Son, andDessureault, 2013; Salama, Greberg, and Schunnesson,2014; Torkamani, and Askari-Nasab, 2015; Park, Choi, andPark, 2016). Discrete event simulation software packagessuch as ArenaTM and SIMIOTM have become popular becausethey offer easy-to-use graphical user interfaces and attractiveanimation capabilities. An early, but thorough, review ofsoftware used in mine system simulation in the USA isprovided by Sturgul (1999). Since conducting experiments atall locations from mine to mill in a real mine in order tocollect inputs and outputs for estimating cost savings isdifficult, a regression model (using experimental data fromone of many operations of the mine) and discrete eventsimulation model using ArenaTM software are used to modelall the mining operations in this study. The Monte Carlotechnique is embedded in ArenaTM and is used to estimatethe confidence intervals in performance measures such asproduction, equipment utilization, and queue times caused byuncertainties from shovel loading times, truck haul, anddumping times.
In this work, the first objective is to model all operationsfrom blasting to grinding using a combination of regressionand discrete event simulation. Constructing very granularmodels for blasting requires an understanding of theunderlying physics. However, models predicting aggregatedblast particle-size distributions have been constructed in thepast based on linear regression (Kim and Kemeny, 2011;Modular Mining, 2014). Hence, real data for blastingparameters such as explosives energy, burden, spacing, rockproperties (tensile strength or mode I fracture toughness),and block size of the bench face is used to construct ablasting regression model to predict the resulting particle sizedistribution (Kim and Kemeny, 2011). A MS Excel® linearregression tool has been used to estimate the coefficients ofthe blasting regression model. The other operations, such asexcavation and transportation of ore via trucks andconveyors to crushers and grinders, mimic supply chainsystems, and are therefore modelled using discrete eventsimulation in ArenaTM. The data for blasting and otheroperations, as well as the structure of the simulated mine, isbased on a mid-sized copper mine in Arizona. One of themain contributions of this paper is to specify the mean costsavings percentage, together with its confidence interval, as afunction of specific explosives energy.
The spectral imaging-based tracking method proposedinvolves a combination of software and hardware. Thesoftware tools used are SPLIT Online 4.1 (image processingsystem) and a MATLAB-based regression model. SPLITOnline 4.1 is used to estimate fragment contours andvolumes. At the core of SPLIT Online 4.1 technology areparticle delineation algorithms used for marking outlines offragments in truck dumps, muckpiles, and moving conveyorbelts (Kemeny, Mofya, and Kaunda, 2002; Latham et al.,2003; BoBo et al., 2004). PLSR, PCR, and LR are comparedfor selecting the best prediction model for distinguishingsamples from real mines, using the built-in functions inMATLAB. The main hardware components used in themethod are multispectral cameras. The regression algorithmsmentioned above are used to distinguish between ore typesin each image delivered by the multispectral camera. The
�
8 VOLUME 118
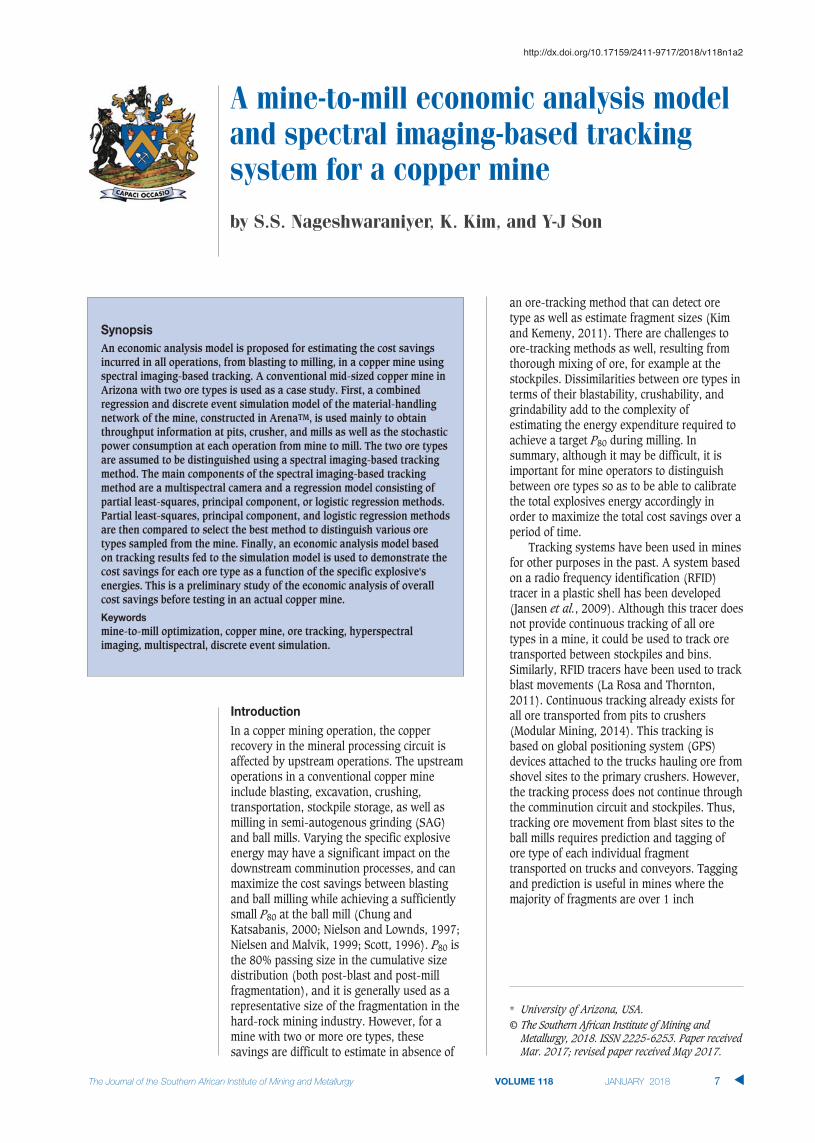
VNIR camera costs less than the SWIR camera because theSWIR camera captures much higher wavelengths. A 3D full-motion video spectral imaging (FMV-SI) camera such as theone from Surface Optics (SOC, 2014) is better than line-scanner cameras in retaining spectral information, even atmedium to high conveyor speeds (approx. 1 m/s in Figure 1).Since training and validation testing on real ore samples isnecessary for comparisons between different regressionalgorithms, the second objective of this work is to collect andperform laboratory tests on ore samples from different mines.The tests were conducted on both a static surface (wood) aswell as a moving conveyor. The third objective is todetermine the combination of multispectral camera andregression model for prediction that can most accuratelydetect and distinguish different ore types. To the bestknowledge of the authors, this is one of the firstinvestigations in which VNIR, SWIR, and FMV-SI camerashave been studied for distinguishing between ore types onmoving conveyors in a laboratory setting.
A brief description of the blasting regression model, aswell as the simulation model of the mine used as a casestudy, is provided. This is followed by a discussion of resultsfrom testing different regression models on different oresamples using VNIR and SWIR cameras. A technique forintegrating the detected ore type information with delineationinformation for implementation in the real mine is explained.The economic analysis of the overall cost savings achievedthrough the proposed spectral imaging-based tracking isdiscussed, and finally, the conclusions are presented.
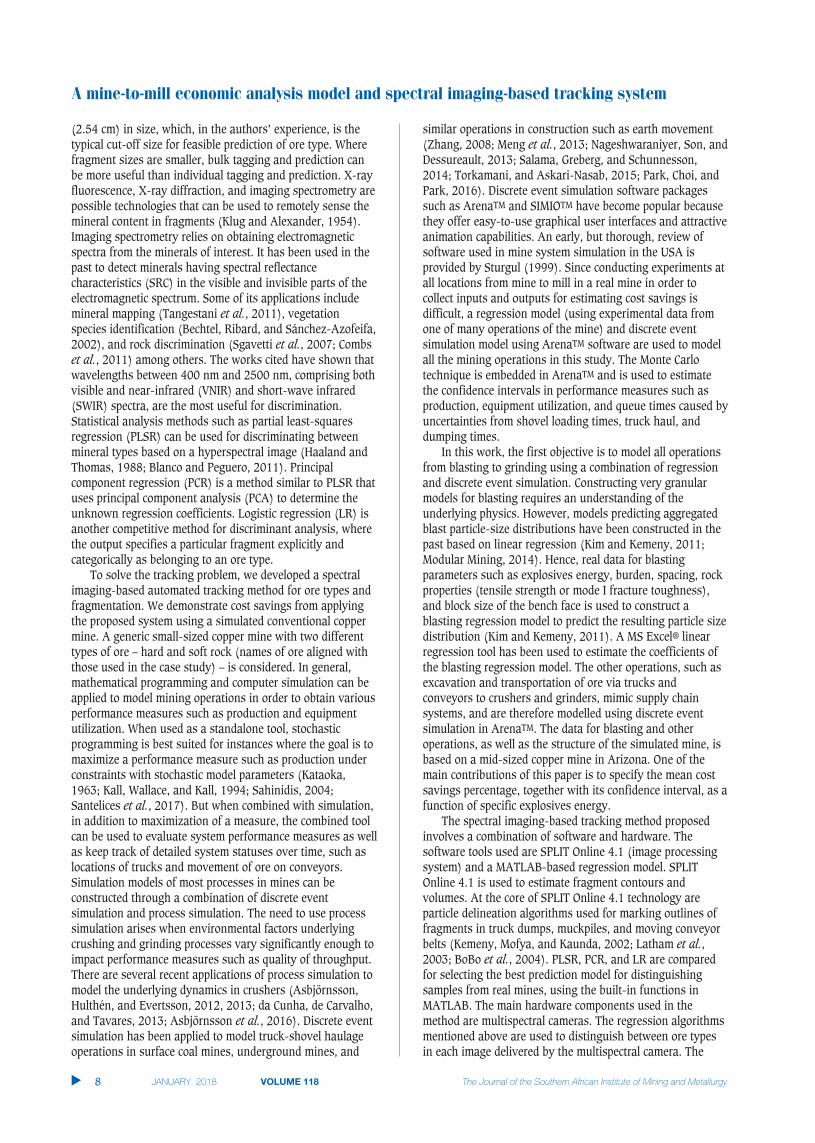
Three simulation sub-models were developed in ArenaTM forthe mid-sized copper mine: (1) forward blasting model, (2)reverse blasting model, and (3) comminution model (seeFigure 2). The forward blasting model simulates the blasting
process using site-specific blasting models at the pits (Kimand Kemeny, 2011). Two main assumptions are made for thesimulation modelling: (1) a specific number of truckloads perday per pit along with cycle times is assumed, and (2) errorsin blasting parameters – burden and spacing – are assumedto be induced by drill error and the mismatch between drillpattern and blast direction. The actual value of the error inblasting parameters can be obtained from operational blastdata. In the experiments conducted, the errors are assumed tofollow a uniform distribution. For example, if the error inburden is 5%, then the actual burden in a blast can varybetween –5% and +5% of its mean value. Two ore types areconsidered in this model, and one shot per day is made ateach of the pits. This sub-model is used to determine thecoefficients of the site-specific blasting model when there isonly limited data availablefor blasting parameters, such asburden, spacing, and particle size distribution of ore in truckbeds.
For constructing our site-specific blasting model, datafrom visible range cameras at a real copper mine in Arizonawas used. F80 of shots – the bench face block size (80%passing size) before blasting – and particle size distributionsof blasted ore dumped into trucks were provided. F80, benchheight, and tensile strength (T0), are taken to bedeterministic variables. During the simulation run, for each
A mine-to-mill economic analysis model and spectral imaging-based tracking system
9VOLUME 118 �
pit, the values of burden, spacing, bench height, T0, F80, andP80 from each truckload were recorded into an MS Accessdatabase. The site-specific blasting model taken from Kimand Kemeny (2011) and its logarithmic form used inregression analysis are given in Equations [1] and [2],respectively. Although additional efforts are needed tovalidate this model for many mines around the world, theresults presented by Kim and Kemeny (2011) applying thisblasting model on data from a real copper mine arepromising. ESE is the specific explosives energy, whereas F80and P80 are the 80% passing sizes before and after the shotrespectively. ln(A) is the intercept, and B, C, and D are thecoefficients in the regression model.
ESE = A (F80)B(P80)C(T0)D [1]
ln(ESE) = ln(A)+Bln(F80)+Cln(P80)+Dln(T0) [2]
The above model was also applied by Nageshwaraniyer,Kim, and Son (2015) using an MS Excel regression analysistool on same sample data as in this paper, and the best modelcoefficients were chosen using the R2 value (which is theproportion of variation in ESE as explained by variation in T0,P80, and F80). Values of R2 above 0.9 were obtained, whichimplied that the regression model had a good fit betweendependent (ESE) and independent variables (T0, P80, andF80). Thus, ESE values could be explained by our sample datausing the site-specific blasting model. The estimatedregression coefficients were then provided as input to thereverse blasting model in order to determine the product ofburden and spacing for a desired P80 for each ore type, giventhe F80, bench height, explosives energy, tensile strength,and specific gravity for the corresponding pit. After manysimulation replicas, the mean of product of burden andspacing along with the confidence intervals were recorded. Ifthere is a known relationship between burden and spacing,the burden and spacing values can be deduced separatelyfrom this product of burden and spacing. If such arelationship is unavailable, different combinations of burdenand spacing yielding the abovementioned product can bereviewed, and the best combination among these can bechosen by blast engineers for application at the real mine.
The P80 of each blast from the forward blasting modelserves as input to the comminution model, which in turn isused to simulate truck haulage, crushing, stockpiling, andgrinding operations. Using the forward blasting model, plusthe F80, power setting (with uncertainty) and the associatedBond work indices for each comminution process, we can
estimate throughput as well as the P80 for each of thesecomminution processes. Thus, the forward blasting model isused to construct a model to predict blast fragmentation, thereverse blasting model is used to determine burden andspacing (for a desired P80) when needed, and thecomminution model is used to estimate throughput and P80values for crushing and grinding operations.
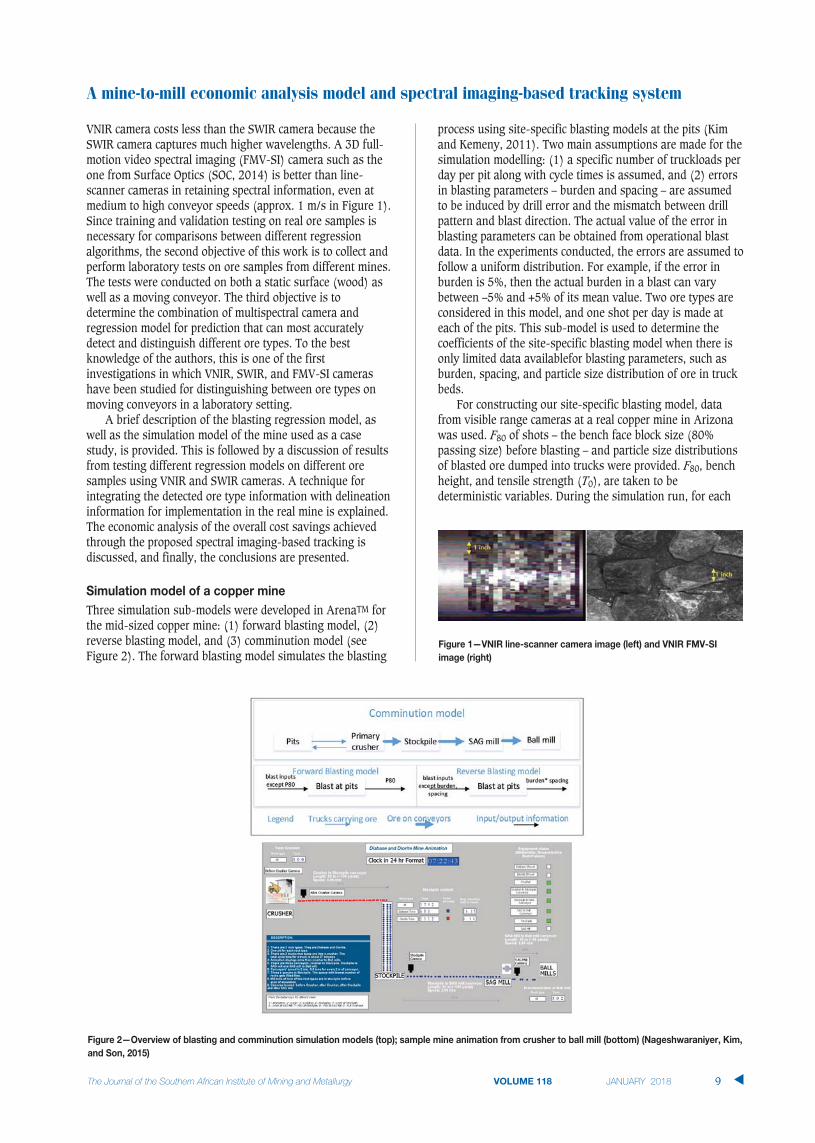
In this work, three types of regression techniques wereapplied for prediction of ore types from images of orefragments: PLSR, PCR, and LR. Fragments of different sizeswere present in each sample image. This was done in order toanalyse the effect of varying fragment sizes on accuracy ofprediction of rock types based on statistical regressiontechniques. The fragments, collected from a mid-sized coppermine in southern Arizona, were not cleaned before imaging,so as to mimic a real-world situation. In some cases, fineswere added. Spectral imaging-based prediction involvescalibration of the image, training and validation of regressionmodel, and prediction. Calibration mainly involves correctingand recalculating the intensities, in raw multispectral images,of fragments on moving conveyors, based on the extremevalues of intensities obtained from images taken at the samesite on a static conveyor. Thereafter, for each pixel, theintensity values across all wavelengths are converted intoabsorbance values. As an example, in Figure 3, PLSR wasused for distinguishing between QMP (quartz monzoniteporphyry) and diorite, using the corresponding multispectralimage as input. The image of a conveyor moving at 1 m/swas captured by a multispectral five-band camera with1024×1360 pixel resolution; the spectral wavelength rangewas 400–1000 nm. For training, 11 pixels covering QMP(bright fragments; assigned ‘1’), diorite (other fragments;assigned ‘0’), and background (tray; assigned ‘0’) werechosen. PLSR in this case was trained to predict the pixel-wise likelihood that there is QMP in an image. When thetrained PLSR was validated, it produced the image depicted inFigure 3, where pixels that are more likely to be QMP exhibitred or yellow colours and other pixels blue or green colours.The bright red fragments are QMP and the others are diorite.The sets of scenarios that were considered are as follows: (1)QMP and diorite, (2) QMP and andesite, and (3) diorite andandesite. In each of these images, training was performed
A mine-to-mill economic analysis model and spectral imaging-based tracking system
�
10 VOLUME 118
A mine-to-mill economic analysis model and spectral imaging-based tracking system
VOLUME 118 11 �
using spectral information from all types of materialsavailable that could be visually identified. A summary ofconveyor tests performed using this camera for ore typeprediction in a laboratory setting is provided in Table I.
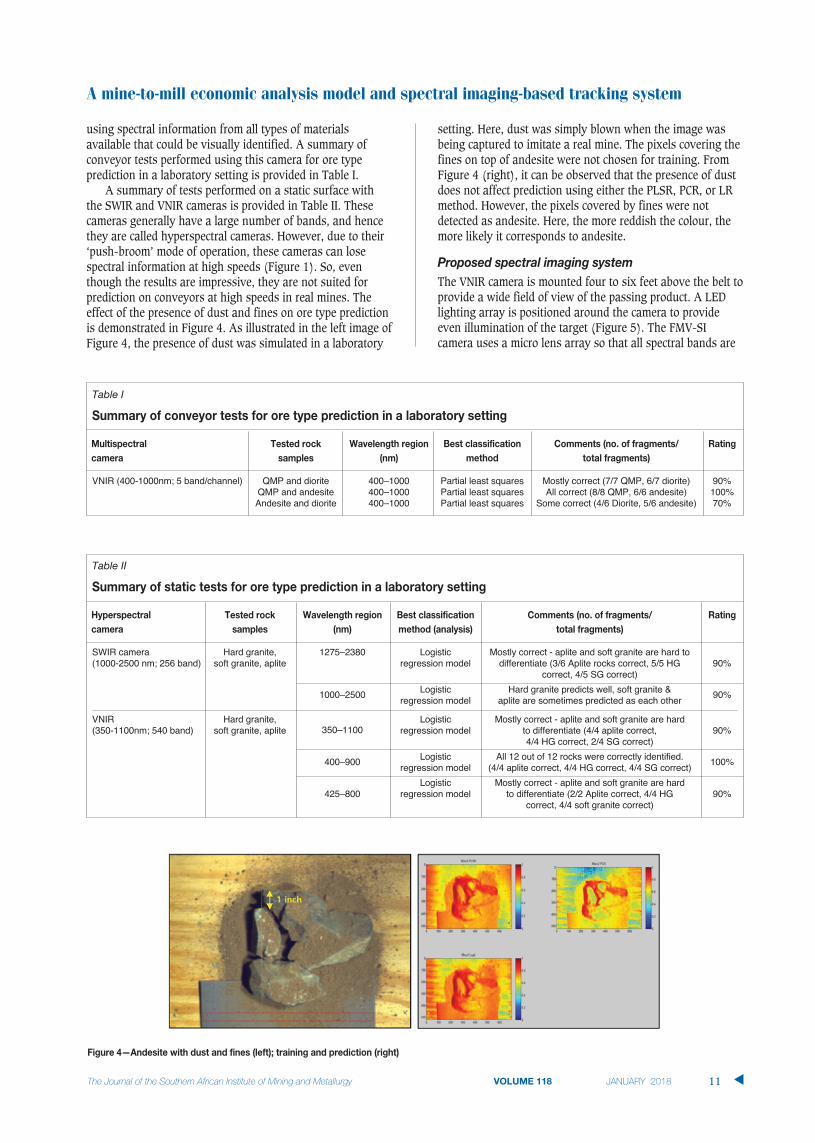
A summary of tests performed on a static surface withthe SWIR and VNIR cameras is provided in Table II. Thesecameras generally have a large number of bands, and hencethey are called hyperspectral cameras. However, due to their‘push-broom’ mode of operation, these cameras can losespectral information at high speeds (Figure 1). So, eventhough the results are impressive, they are not suited forprediction on conveyors at high speeds in real mines. Theeffect of the presence of dust and fines on ore type predictionis demonstrated in Figure 4. As illustrated in the left image ofFigure 4, the presence of dust was simulated in a laboratory
setting. Here, dust was simply blown when the image wasbeing captured to imitate a real mine. The pixels covering thefines on top of andesite were not chosen for training. FromFigure 4 (right), it can be observed that the presence of dustdoes not affect prediction using either the PLSR, PCR, or LRmethod. However, the pixels covered by fines were notdetected as andesite. Here, the more reddish the colour, themore likely it corresponds to andesite.
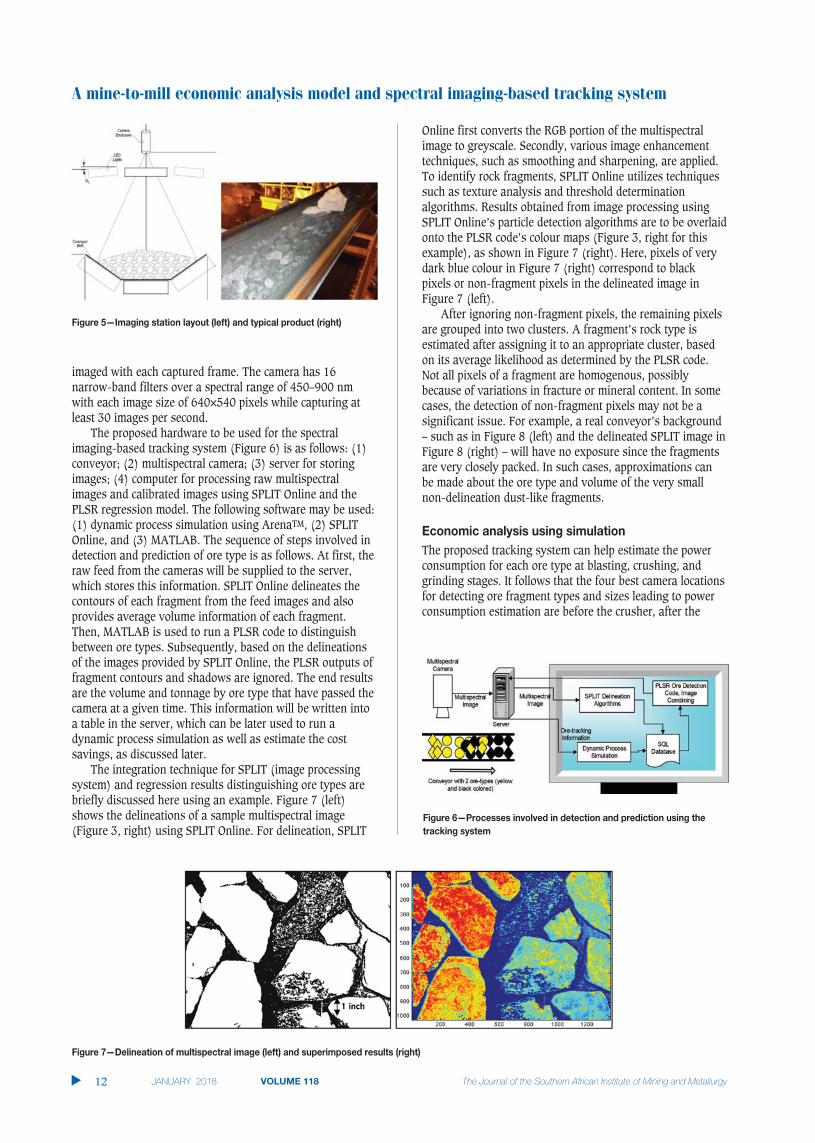
The VNIR camera is mounted four to six feet above the belt toprovide a wide field of view of the passing product. A LEDlighting array is positioned around the camera to provideeven illumination of the target (Figure 5). The FMV-SIcamera uses a micro lens array so that all spectral bands are
Table II
SWIR camera Hard granite, 1275–2380 Logistic Mostly correct - aplite and soft granite are hard to(1000-2500 nm; 256 band) soft granite, aplite regression model differentiate (3/6 Aplite rocks correct, 5/5 HG 90%
correct, 4/5 SG correct)
1000–2500 Logistic Hard granite predicts well, soft granite & 90%regression model aplite are sometimes predicted as each other
VNIR Hard granite, 350–1100
Logistic Mostly correct - aplite and soft granite are hard(350-1100nm; 540 band) soft granite, aplite regression model to differentiate (4/4 aplite correct, 90%
4/4 HG correct, 2/4 SG correct)
400–900 Logistic All 12 out of 12 rocks were correctly identified. 100%regression model (4/4 aplite correct, 4/4 HG correct, 4/4 SG correct)Logistic Mostly correct - aplite and soft granite are hard
425–800 regression model to differentiate (2/2 Aplite correct, 4/4 HG 90%correct, 4/4 soft granite correct)
Table I
VNIR (400-1000nm; 5 band/channel) QMP and diorite 400–1000 Partial least squares Mostly correct (7/7 QMP, 6/7 diorite) 90%QMP and andesite 400–1000 Partial least squares All correct (8/8 QMP, 6/6 andesite) 100%Andesite and diorite 400–1000 Partial least squares Some correct (4/6 Diorite, 5/6 andesite) 70%
A mine-to-mill economic analysis model and spectral imaging-based tracking system
�
12 VOLUME 118
imaged with each captured frame. The camera has 16narrow-band filters over a spectral range of 450–900 nmwith each image size of 640×540 pixels while capturing atleast 30 images per second.
The proposed hardware to be used for the spectralimaging-based tracking system (Figure 6) is as follows: (1)conveyor; (2) multispectral camera; (3) server for storingimages; (4) computer for processing raw multispectralimages and calibrated images using SPLIT Online and thePLSR regression model. The following software may be used:(1) dynamic process simulation using ArenaTM, (2) SPLITOnline, and (3) MATLAB. The sequence of steps involved indetection and prediction of ore type is as follows. At first, theraw feed from the cameras will be supplied to the server,which stores this information. SPLIT Online delineates thecontours of each fragment from the feed images and alsoprovides average volume information of each fragment.Then, MATLAB is used to run a PLSR code to distinguishbetween ore types. Subsequently, based on the delineationsof the images provided by SPLIT Online, the PLSR outputs offragment contours and shadows are ignored. The end resultsare the volume and tonnage by ore type that have passed thecamera at a given time. This information will be written intoa table in the server, which can be later used to run adynamic process simulation as well as estimate the costsavings, as discussed later.
The integration technique for SPLIT (image processingsystem) and regression results distinguishing ore types arebriefly discussed here using an example. Figure 7 (left)shows the delineations of a sample multispectral image(Figure 3, right) using SPLIT Online. For delineation, SPLIT
Online first converts the RGB portion of the multispectralimage to greyscale. Secondly, various image enhancementtechniques, such as smoothing and sharpening, are applied.To identify rock fragments, SPLIT Online utilizes techniquessuch as texture analysis and threshold determinationalgorithms. Results obtained from image processing usingSPLIT Online’s particle detection algorithms are to be overlaidonto the PLSR code’s colour maps (Figure 3, right for thisexample), as shown in Figure 7 (right). Here, pixels of verydark blue colour in Figure 7 (right) correspond to blackpixels or non-fragment pixels in the delineated image inFigure 7 (left).
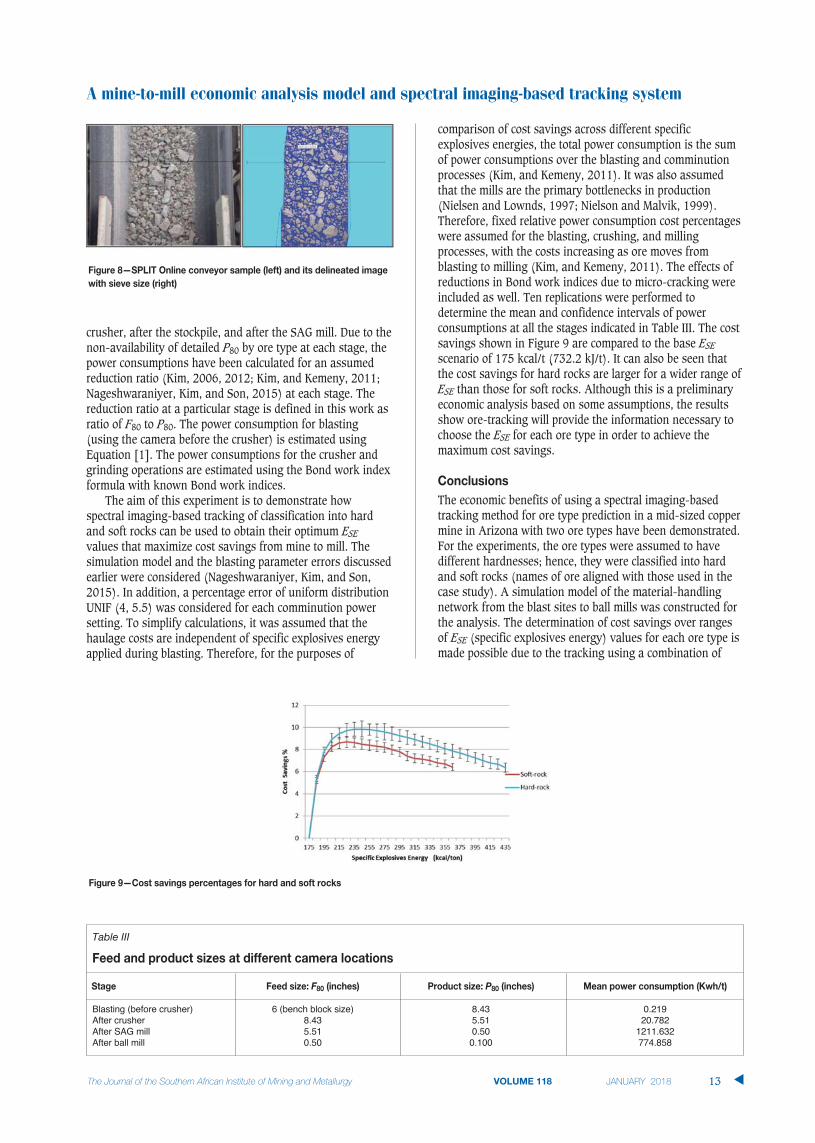
After ignoring non-fragment pixels, the remaining pixelsare grouped into two clusters. A fragment’s rock type isestimated after assigning it to an appropriate cluster, basedon its average likelihood as determined by the PLSR code.Not all pixels of a fragment are homogenous, possiblybecause of variations in fracture or mineral content. In somecases, the detection of non-fragment pixels may not be asignificant issue. For example, a real conveyor’s background– such as in Figure 8 (left) and the delineated SPLIT image inFigure 8 (right) – will have no exposure since the fragmentsare very closely packed. In such cases, approximations canbe made about the ore type and volume of the very smallnon-delineation dust-like fragments.
The proposed tracking system can help estimate the powerconsumption for each ore type at blasting, crushing, andgrinding stages. It follows that the four best camera locationsfor detecting ore fragment types and sizes leading to powerconsumption estimation are before the crusher, after the
crusher, after the stockpile, and after the SAG mill. Due to thenon-availability of detailed P80 by ore type at each stage, thepower consumptions have been calculated for an assumedreduction ratio (Kim, 2006, 2012; Kim, and Kemeny, 2011;Nageshwaraniyer, Kim, and Son, 2015) at each stage. Thereduction ratio at a particular stage is defined in this work asratio of F80 to P80. The power consumption for blasting(using the camera before the crusher) is estimated usingEquation [1]. The power consumptions for the crusher andgrinding operations are estimated using the Bond work indexformula with known Bond work indices.
The aim of this experiment is to demonstrate howspectral imaging-based tracking of classification into hardand soft rocks can be used to obtain their optimum ESEvalues that maximize cost savings from mine to mill. Thesimulation model and the blasting parameter errors discussedearlier were considered (Nageshwaraniyer, Kim, and Son,2015). In addition, a percentage error of uniform distributionUNIF (4, 5.5) was considered for each comminution powersetting. To simplify calculations, it was assumed that thehaulage costs are independent of specific explosives energyapplied during blasting. Therefore, for the purposes of
comparison of cost savings across different specificexplosives energies, the total power consumption is the sumof power consumptions over the blasting and comminutionprocesses (Kim, and Kemeny, 2011). It was also assumedthat the mills are the primary bottlenecks in production(Nielsen and Lownds, 1997; Nielson and Malvik, 1999).Therefore, fixed relative power consumption cost percentageswere assumed for the blasting, crushing, and millingprocesses, with the costs increasing as ore moves fromblasting to milling (Kim, and Kemeny, 2011). The effects ofreductions in Bond work indices due to micro-cracking wereincluded as well. Ten replications were performed todetermine the mean and confidence intervals of powerconsumptions at all the stages indicated in Table III. The costsavings shown in Figure 9 are compared to the base ESEscenario of 175 kcal/t (732.2 kJ/t). It can also be seen thatthe cost savings for hard rocks are larger for a wider range ofESE than those for soft rocks. Although this is a preliminaryeconomic analysis based on some assumptions, the resultsshow ore-tracking will provide the information necessary tochoose the ESE for each ore type in order to achieve themaximum cost savings.
The economic benefits of using a spectral imaging-basedtracking method for ore type prediction in a mid-sized coppermine in Arizona with two ore types have been demonstrated.For the experiments, the ore types were assumed to havedifferent hardnesses; hence, they were classified into hardand soft rocks (names of ore aligned with those used in thecase study). A simulation model of the material-handlingnetwork from the blast sites to ball mills was constructed forthe analysis. The determination of cost savings over rangesof ESE (specific explosives energy) values for each ore type ismade possible due to the tracking using a combination of
A mine-to-mill economic analysis model and spectral imaging-based tracking system
VOLUME 118 13 �
Table III
Blasting (before crusher) 6 (bench block size) 8.43 0.219After crusher 8.43 5.51 20.782After SAG mill 5.51 0.50 1211.632After ball mill 0.50 0.100 774.858
A mine-to-mill economic analysis model and spectral imaging-based tracking system
multispectral camera, SPLIT Online fragment delineationalgorithm, and an ore type regression model in MATLAB.After conducting tests using visible and near-infrared (VNIR)and short-wave infrared (SWIR) cameras with the number ofbands ranging between 5 to 540, we concluded that:
(1) VNIR range cameras should be chosen, since theycost less while achieving similar effectiveness toSWIR cameras in ore type prediction
(2) Only up to five bands were needed fordistinguishing the various samples we obtainedfrom real mines
(3) A 3D full-motion video spectral imaging camera isbetter than line-scanner cameras in retainingspectral information at medium to high conveyorspeeds.
It was observed that the cost savings as a function of ESEdo not behave the same way for the two ore types, whichimplies that the spectral imaging-based tracking iseconomically beneficial for the mine.
ASBJÖRNSSON, G., HULTHÉN, E., and EVERTSSON, M. 2012. Modelling and dynamicsimulation of gradual performance deterioration of a crushing circuit–Including time dependence and wear. Minerals Engineering, vol. 33.pp. 13–19.
ASBJÖRNSSON, G., HULTHÉN, E., and EVERTSSON, M. 2013. Modelling andsimulation of dynamic crushing plant behavior with MATLAB/Simulink.Minerals Engineering, vol. 43. pp. 112–120.
ASBJÖRNSSON, G., BENGTSSON, M., HULTHÉN, E., and EVERTSSON, M. 2016. Modellingof discrete downtime in continuous crushing operation. MineralsEngineering, vol. 98. pp. 22–29.
BECHTEL, R., RIVARD, B., and SÁNCHEZ-AZOFEIFA, A. 2002. Spectral properties offoliose and crustose lichens based on laboratory experiments. RemoteSensing of Environment, vol. 82, no. 2. pp. 389–396.
BLANCO, M. and PEGUERO, A. 2011. A new and simple PLS calibration methodfor NIR spectroscopy. API determination in intact solid formulations.Analytical Methods, vol. 4, no. 6. pp. 1507–1512.
BOBO, T.W., NORTON, B., KEMENY, J.M., and TAYLOR, M. 2004. Split-Online®
digital image analysis system to quantify particle size for the industrialmineral industry. 2004 SME Annual Meeting Preprints.
CHUNG, S.H. and KATSABANIS, P.D. 2000. Fragmentation prediction usingimproved engineering formulae. Fragblast, vol. 4, no. 3-4. pp. 198–207.
COMBS, J.H., KUDENOV, M.W., CRAVEN, J., and KEMENY, J.M. 2011. Evaluation ofrock faces with hyperspectral imaging. Proceedings of the 45th US RockMechanics/Geomechanics Symposium. American Rock MechanicsAssociation, Alexandria, VA.
DA CUNHA, E.R., DE CARVALHO, R.M., and TAVARES, L.M. 2013. Simulation ofsolids flow and energy transfer in a vertical shaft impact crusher usingDEM. Minerals Engineering, vol. 43. pp. 85–90.
HAALAND, D.M. AND THOMAS, E.V. 1988. Partial least-squares methods forspectral analyses. 1. Relation to other quantitative calibration methodsand the extraction of qualitative information. Analytical Chemistry, vol. 60, no. 11, pp. 1193–1202.
JANSEN, W., MORRISON, R., WORTLEY, M., and RIVETT, T. 2009. Tracer-based mine-mill ore tracking via process hold-ups at Northparkes Mine. Proceedings ofthe Tenth Mill Operators' Conference, Adelaide, SA. Australasian Instituteof Mining an Metallurgy, Melbourne. pp. 345–356.
KALL, P., WALLACE, S.W., and KALL, P. 1994. Stochastic Programming. Wiley,Chichester, UK.
Kataoka, S. 1963. A stochastic programming model. Econometrica, vol. 31, no. 1–2. pp. 181–196.
KEMENY, J., MOFYA, E., KAUNDA, R., AND LEVER, P. 2002. Improvements in blastfragmentation models using digital image processing. Fragblast, vol. 6,no. 3–4. pp. 311–320.
KIM, K. 2006. Blasting design using fracture toughness and image analysis ofthe bench face and muckpile. Master’s thesis, Virginia Tech.
KIM, K. and KEMENY, J.M. 2011. Site specific blasting model for mine-to-milloptimization. Proceedings of the SME Annual Meeting and Exhibit andCMA 113th National Western Mining Conference 2011. SME, Littleton,CO.
KIM, K. 2012. Rock fracturing and mine to mill optimization. Doctoraldissertation, University of Arizona.
KLUG, H.P. and ALEXANDER, L.E. 1954. X-ray Diffraction Procedures. Vol. 2.Wiley, New York.
LA ROSA, D. and THORNTON, D. 2011. Blast movement modelling andmeasurement. Proceedings of the 35th International Symposium on theApplications of Computers and Mathematics in the Mineral Industries(APCOM 2011). Australasian Institute of Mining and Metallurgy,Melbourne. pp. 297–310.
LATHAM, J.P., KEMENY, J., MAERZ, N., NOY, M., SCHLEIFER, J., and TOSE, S. 2003. Ablind comparison between results of four image analysis systems using aphoto-library of piles of sieved fragments. Fragblast, vol. 7, no. 2. pp. 105–132.
MENG, C., NAGESHWARANIYER, S.S., MAGHSOUDI, A., SON, Y.J., and DESSUREAULT, S.2013. Data-driven modeling and simulation framework for materialhandling systems in coal mines. Computers and Industrial Engineering,vol. 64, no. 3. pp. 766–779.
MODULAR MINING. 2014. http://mmsi.com
NAGESHWARANIYER, S.S., KIM, K.M., and SON, Y.J. 2015. Optimal blast designusing a discrete event simulation model in a hard-rock mine. MiningEngineering, vol. 67, no. 11. pp. 47–53.
NAGESHWARANIYER, S.S., SON, Y.J., and DESSUREAULT, S. 2013. Simulation-basedoptimal planning for material handling networks in mining. Simulation,vol. 89, no. 3. pp. 330-345. https://doi.org/10.1177/0037549712464278
NIELSEN, K., and LOWNDS, C.M. 1997. Enhancement of taconite crushing andgrinding through primary blasting. International Journal of RockMechanics and Mining Sciences, vol. 34, no. 3. p. 226–e1.
NIELSEN, K. and MALVIK, T. 1999. Grindability enhancement by blast-inducedmicrocracks. Powder Technology, vol. 105, no. 1. pp. 52–56.
PARK, S., CHOI, Y., and PARK, H.S. 2016. Optimization of truck-loader haulagesystems in an underground mine using simulation methods. GeosystemEngineering, vol. 19, no. 5. pp. 222–231.
SALAMA, A., GREBERG, J., and SCHUNNESSON, H. 2014. The use of discrete eventsimulation for underground haulage mining equipment selection.International Journal of Mining and Mineral Engineering, vol. 5, no. 3. pp. 256–271.
SAHINIDIS, N.V. 2004. Optimization under uncertainty: state-of-the-art andopportunities. Computers and Chemical Engineering, vol. 28, no. 6. pp. 971–983.
SANTELICES, G., PASCUAL, R., LÜER-VILLAGRA, A., MACCAWLEY, A., and GALAR, D.2017. Integrating mining loading and hauling equipment selection andreplacement decisions using stochastic linear programming. InternationalJournal of Mining, Reclamation and Environment, vol. 31, no. 1. pp. 52–65.
SCOTT, A. ED. 1996. Open pit blast design: analysis and optimisation. JKMRCMonograph Series in Mining and Mineral Processing, no. 1. JuliusKruttschnitt Mineral Research Centre, University of Queensland.
SGAVETTI, M., POMPILIO, L., CARLI, C., DE SANCTIS, M.C., CAPACCIONI, F., CREMONESE,G., and FLAMINI, E. 2007. BepiColombo SIMBIO-SYS data: Preliminaryevaluation for rock discrimination and recognition in both low and highresolution spectroscopic data in the visible and near infrared spectralintervals. Planetary and Space Science, vol. 55, no. 11. pp. 1596–1613.
SOC. 2014. Surface Optics Corp. www.surfaceoptics.com.
STURGUL, J.R. 1999. Discrete mine system simulation in the United States.International Journal of Surface Mining, Reclamation and Environment,vol. 13, no. 2. pp. 37–41.
TANGESTANI, M.H., JAFFARI, L., VINCENT, R.K., and SRIDHAR, B.M. 2011. Spectralcharacterization and ASTER-based lithological mapping of an ophiolitecomplex: A case study from Neyriz ophiolite, SW Iran. Remote Sensing ofEnvironment, vol. 115, no. 9. pp. 2243–2254.
TORKAMANI, E. and ASKARI-NASAB, H. 2015. A linkage of truck-and-shoveloperations to short-term mine plans using discrete-event simulation.International Journal of Mining and Mineral Engineering, vol. 6, no. 2. pp. 97–118.
ZHANG, H. 2008. Multi-objective simulation-optimization for earth movingoperations. Automation in Construction, vol. 18, no. 1. pp. 79–86. �
�
14 VOLUME 118