utah's air quality program
TRANSCRIPT

Utah’s Air Quality Program
Bryce BirdDepartment of Environmental Quality
Division of Air Quality
801-536-4000

Air Quality Issues
� Current Status Update
� Air Quality Trends
� Recent Actions
� Solid Fuel Burning Analysis
� Key Upcoming Issues
� New ozone standard
� Clean Power Plan

Utah experiences good air quality, except forabout 5% of days on average when we exceed
current federal health standards
Utah Division of Air Quality3

Air Pollutants
4
Ground Level Ozone Particulate MatterPM10 and PM2.5

National Ambient Air Quality Standards
2006 2008 2010Revised 2012

0
10
20
30
40
50
Da
ys*
ab
ov
e t
he
sta
nd
ard
s
Salt Lake Co. Cache Co. Utah Co.
* Days with monitored values above the level of the current National Ambient Air
Quality Standards combined for PM2.5 and ozone (PM2.5 standard revised in 2006,
ozone standard revised in 2008) through 7/14/2015
Number of Days That Are and Those That Would Have Been Above the Current Federal Standards
Salt Lake, Cache, and Utah County Areas
6

Air Quality
Policy
Emissions
Chemistry/
Meteorology/
Topography
Population
Exposure/
Impairment
Available Controls
7

SL County Area Source Emissions
Surface Coating
Consumer and
Commercial Solvents
Residential Heating
Commercial Heating Food
Prep.
Download emissions data at:http://www.airquality.utah.gov/Pollutants/ParticulateMatter/PM25/presentations/index.html
Sewage

Utah County Area Source Emissions
Surface Coating
Consumer and
Commercial Solvents
Residential Heating
Commercial Heating
Food Prep.
Download emissions data at:http://www.airquality.utah.gov/Pollutants/ParticulateMatter/PM25/index.html
Livestock

Emission Reductions by Source CategoryIdentified In the SLC, UT PM2.5 SIP
Hashed = SIP reductions

Utah Summary of State Air EmissionsTotal Tons Emitted
2,544,438.86
2,178,226.382,055,565.62
1,769,191.40
0
500,000
1,000,000
1,500,000
2,000,000
2,500,000
3,000,000
2002 2005 2008 2011
Statewide Emissions
Combined Inventory
http://www.deq.utah.gov/ProgramsServices/programs/air/emissionsinventories/inventories/index.htm

0
10
20
30
40
50
60
1986 1991 1996 2001 2006 2011
Part
icu
late
Mate
r (µ
g/m
3 )
Year
Particulate Matter (PM) Standards - AnnualPM10-Bountiful (BT/BV) PM10-Cottonwood PM10-Hawthorne PM10-Logan PM10-Lindon
PM10-Magna PM10-N. Salt Lake PM10-North Provo PM10-Ogden (O2/RY) PM10-Tooele (GV)
PM2.5-Brigham City PM2.5-Logan PM2.5-Bountiful (BT/BV) PM2.5-Cottonwood PM2.5-Magna
PM2.5-Hawthorne PM2.5-Rose Park PM2.5-N. Salt Lake PM2.5-Tooele (T3) PM2.5-North Provo
PM2.5-Lindon PM2.5-Highland PM2.5-Spanish Fork PM2.5-Ogden (O2) PM2.5-Harrisville
PM10 Standard (Annual)(µg/m3 ) PM2.5 Standard (Annual)(µg/m3 )
Particulate Matter 10 (PM10) - (1987-2005)
Particulate Matter 2.5 (PM2.5) -(1997-Current)


Effects of Regional Haze

Regional Haze Key Points• Utah was one of the first states to develop and implement a regional haze
State Implementation Plan (RH SIP) in 2003
• The RH SIP was updated in 2008 following a revision to the implementation requirements by EPA
• The RH SIP was substantially approved in 2012 by EPA including a determination that Utah had met the reasonable progress demonstration for the first planning period (77 FR 74355, December 14, 2012)
• EPA determined that two technical elements were not adequately addressed in the RH SIP but again determined that the overall plan was adequate. The Air Quality Board addressed these elements through a SIP revision on April 4th, 2015


Three Day Forecast�Notify the Public of:
�Forecast Air Quality Conditions to allow the Public to Plan Activities
�Public Health Advisories
�Air Pollution Alert and Action Days

Workload Challenges
� New Standards and development of State Implementation Plans
� New Monitoring Equipment Requirements
� Increased expectations for real-time access to air monitoring information
� More public participation in agency actions including appeals

2014 Compliance Activities2009 Activities
� Inspections 1931 978
� Audits/Reviews 5287
� Complaints Received 472 149
� Compliance Advisories 321 124
� Warning Letters 110 81
� Settlements 62 43
� Penalties Assessed $2,510,829
� SEPs Credited $1,161,268

Air Quality Partnerships

Incentives Update$100,000 in grants to reduce emissions from heavy-duty diesel engines:
� Jordan School District: $30,642 to replace an old school bus with a new bus
� Logan City: $40,000 to retrofit 19 city vehicles with Diesel Oxygenation Catalyst (DOCs) and Diesel Particulate Filters (DPFs)
� Nibley City: $10,500 to retrofit three city vehicles with DOCs
� Uintah City: $4,006 to retrofit one city vehicle with a DOC
� Utah State University: $14,852 to retrofit a piece of equipment with a DPF
Lawnmower Exchange Program
� 388 Electric Lawnmowers were purchased at the May event
20 Sole Source Burning Exchanges to Natural Gas or Propane
http://deq.utah.gov/ProgramsServices/programs/air/carrot/index.htm

Incentives Update (CARROT)
http://deq.utah.gov/ProgramsServices/programs/air/carrot/index.htm

Research Update
http://deq.utah.gov/ProgramsServices/programs/air/research/index.htm
Portable Monitoring Trailer* Increase DAQ's flexibility in monitoring in different area for specific purposes. —DAQ
Toxics StudyExpand DAQ analysis of toxics monitoring; compare new, temporary WV site with 2000-2002 data; temporary site in Provo; more frequent monitoring.—DAQ & U of U
Exceptional Events Modeling (Wildfire, Aerosols, Ozone, Wind-blown Dust) Inventory development; source apportionment; STILT & STILTCHEM model.—U of U
Cold Start Emissions Comprehensive study of cold start emissions for policy and regulatory purposes.—USU & WSU (NCAST)
Uinta Basin Oil & Gas EmissionsFormaldehyde emissions from non combustion sources. (Identified in the UBOS study as an important contributor to ozone.)—Bingham Research Center/USU
Oil & Gas Projection/Decline Curve Analysis (Extension of DAQ Whitepaper Methodology Improve assumptions in the projection of Uinta Basin development and emissions growth.—U oF U
Winter Ozone Photochemical Modeling IAddresses temperature dependent reactions or organic nitrate. Builds upon the work of Dr. William Carter done for UGR Wyoming. Add SAPRC chemistry and speciation profile to CMAQ.—USU/BYU
Winter Ozone Photochemical Modeling II (CB05/CB06 Low Temperature Organic Nitrate & HONO Chemistry—Sole-source Contract with ENVIRON)
A different approach from the SAPRC mechanism but important because it can apply to summer O3 modeling. Includes consulting for implementation of the HONO chemistry improvement.—ENVIRON
Improve Winter Atmospheric Modeling (Along Wasatch Front)
Incorporate model improvements for winter conditions that were developed for the Uinta Basin into Wasatch Front cold pool conditions.—U oF U
Wasatch Front Wood Burning Emissions* Survey of residential wood burning emissions; ground truth are-source inventory.—U oF U/DAQ
GSL O3 Measurement Study (Summer 2015)Atmospheric boundary layer analysis; air quality model conceptual understanding & model verification; mobile/van surface ozone monitoring on lake perimeter; stationary monitors to compare against mobile data.—U oF U/DAQ
Inversion Vertical Profile StudyUsing a weather balloon to obtain detailed vertical measurements of many pollutants before, during, and after an inversion.—WSU
https://www.google.com/url?rct=j&sa=t&url=http://fox13now.com/2015/06/18/researchers-working-to-determine-why-ozone-is-increasing-around-great-salt-lake/&ct=ga&cd=CAAYADIaMjRhNzZlNzg3ZDFkMjA1Nzpjb206ZW46VVM&usg=AFQjCNFFrJxBHIyzvD7FE6Thq-D8u_MGmA

Education – Results
Have you changed any of your personal behavior to help improve Utah’s air quality?
Which of the following air quality strategies have you tried in the past two months in order to help improve Utah’s air quality?

Solid Fuel Burning
� Survey of burning practices in non-attainment areas
� Additional analysis of air monitoring for source identification
� Additional consideration will follow the completion of the analysis
32% of households have burning appliances42% of those burned in the past 12-months95,000 cords of wood were burned

Immediate Issues� PM2.5 Plan – Implementing 31 new rules
� Increased incentives and education about voluntary measures (UCAIR and Envision Utah)
� PM10 SIP revision (December 2015)
� Ozone – Uinta Basin winter
� Clean up existing equipment, Streamlined permitting for cleanest new equipment, Improved inventory through connection with Oil Gas and Mining
� Coordination with Counties, Tribe, Industry and Land Managers to cut emissions and facilitate production
� Carbon Emissions Regulations for Electrical Generation under CAA 111(d)

Uinta Basin Multi-Prong Approach
• Science based solutions - monitoring coupled with winter studies
• Enforcement of existing rules – review of DOGM production data
• Optimize permitting program for Oil and Gas – new GAO BACT on new equipment
• Reduce emissions from existing equipment - new rules for Oil and Gas
• Public awareness – publish air pollution data to the web with forecasts

2%
97%
Uinta Basin 2011 Annual Anthropogenic VOC Emissions
Area
Non-Road Mobile
On-Road Mobile
Point Sources
Oil and Gas AreaSources
Oil and Gas Nonroad(2013)

TimeE
mis
sio
ns
New Wells
Existing Wells
Emissions Decline
Current Emissions Level
Time
Pro
duction
New Wells
Existing Wells
Production Growth
* Using growth and decline factors to project VOC emissions from oil and gas
production, Journal of the Air & Waste Management Association Volume 65, Issue 1, 2015


Future Issues
� Local research that informs local decisions
� Ozone – State-wide under expected 2015 revised standard
� Understanding long-range transport, exceptional events and chemical pathways of formation
� Increased Monitoring and Modeling
� Mercury
� Air Toxics
� Regional Haze planning

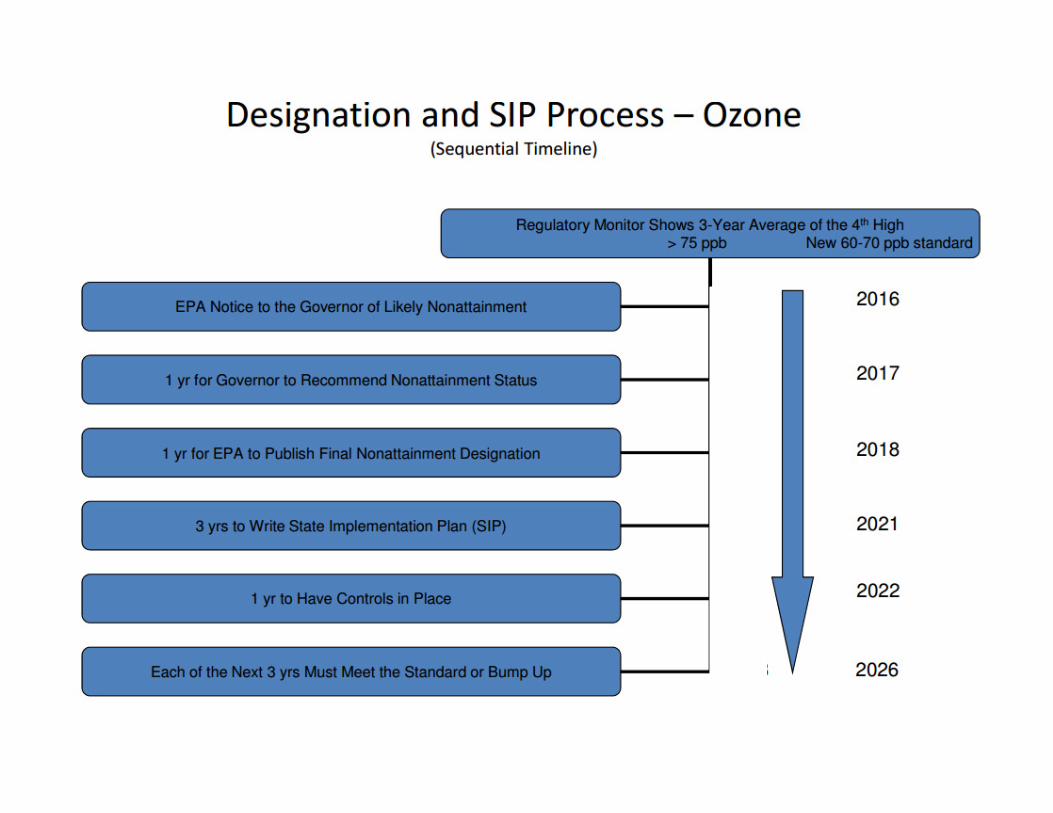
New Ozone Standard?
35
Zhang et al., 2011 Atmospheric Environment


Questions?
www.deq.utah.gov
www.airquality.utah.gov
www.cleanair.utah.gov