uspto 8520944 b2 aug 27 2013 patent for scribb
TRANSCRIPT
8/12/2019 Uspto 8520944 b2 Aug 27 2013 Patent for Scribb
http://slidepdf.com/reader/full/uspto-8520944-b2-aug-27-2013-patent-for-scribb 1/34
c12 United States PatentCimbalista, Jr.
54) METHOD OR IMPROVING VISUALIZATION
OF INFRARED IMAGES
76) Inventor: Mario Cimbalista, Jr. Curitiba BR)
* Notice: Subject to any disclaimer, the term of this
patent is extended or adjusted under 35U.S.C. 154 b) by 332 days.
21) Appl. No.: 12/926,655
22) Filed: Dec. 2, 2010
65) Prior Publication Data
US 2011 /0091102 Al Apr. 21, 2011
Related U.S. Application Data
63) Continuation-in-part of application No. 11/722,711,
filed as application No. PCT/BR2005/000201 on Sep.22, 2005, now abandoned.
30) Foreign Application Prior ity Data
Dec. 24, 2004 BR) ............................ ...... 8403235 U
51) Int. Cl.
G06K9 00 2006.01)
52) U.S. Cl.
USPC .......................................................... 382/167
r,).m ilil<1ern
httter
US008520944B2
10) Patent No.: US 8,520,944 B2Aug. 27, 201345) Date of Patent:
58) Field of Classification Search
None
56)
CN
DEP
su
See application file for complete search history.
References Cited
FOREIGN PATENT DOCUMENTS
1404796 A103 59 192 A1
10-148580 A1800655 A1
3/20037/20056/19983/1993
Primary Examiner Nirav G Patel
74) Attorney Agent or i rm Matthias Scholl, PC;Matthias Scholl
57) ABSTRACT
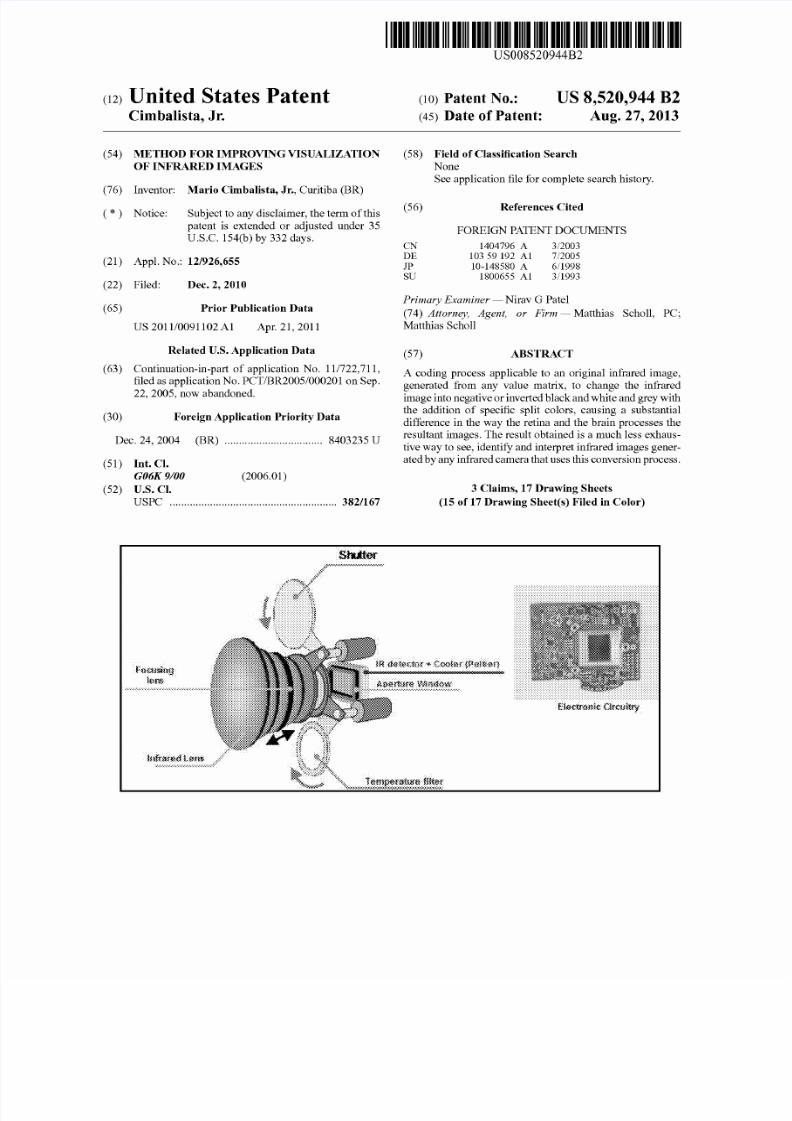
A coding process applicable to an original infrared image,
generated from any value matrix, to change the infrared
image into negative or inverted black and white and grey withthe addition of specific split colors, causing a substantial
difference in the way the retina and the brain processes theresultant images. The result obtained is a much less exhaus
tive way to see, identify and interpret infrared images gener
ated by any infrared camera that uses this conversion process.
3 Claims, 17 Drawing Sheets
15 of 17 Drawing Sheet s) Filed in Color)
8/12/2019 Uspto 8520944 b2 Aug 27 2013 Patent for Scribb
http://slidepdf.com/reader/full/uspto-8520944-b2-aug-27-2013-patent-for-scribb 2/34
U.S. Patent
F i · c u ~ n gl l ~
Aug. 27 2013 Sheet of 17 US 8 520 944 B2
FIG l
FIG 2
FlG 3
8/12/2019 Uspto 8520944 b2 Aug 27 2013 Patent for Scribb
http://slidepdf.com/reader/full/uspto-8520944-b2-aug-27-2013-patent-for-scribb 3/34
U.S. Patent Aug. 27 2013 Sheet 2 of 17 US 8 520 944 B2
FIG 4a FIG 4b
FIG Sa FIG 5b FIG 5c
FIG 7
8/12/2019 Uspto 8520944 b2 Aug 27 2013 Patent for Scribb
http://slidepdf.com/reader/full/uspto-8520944-b2-aug-27-2013-patent-for-scribb 4/34
U.S. atent Aug. 27 2013 Sheet 3 of 17 US 8 520 944 B2
FIG 6
8/12/2019 Uspto 8520944 b2 Aug 27 2013 Patent for Scribb
http://slidepdf.com/reader/full/uspto-8520944-b2-aug-27-2013-patent-for-scribb 5/34
U.S. Patent Aug. 27 2013 Sheet 4 of 17 US 8 520 944 B2
O s t ~ r b e r g 1935
FIG 8a
8/12/2019 Uspto 8520944 b2 Aug 27 2013 Patent for Scribb
http://slidepdf.com/reader/full/uspto-8520944-b2-aug-27-2013-patent-for-scribb 6/34
U.S. Patent Aug. 27 2013 Sheet 5 o 17
l i ~ N f : : - t V ~
:c -::: {,
\ ~ : · : .•.
Retina > ·<:.,. ·-..
ibre
Gpti8 Net'f i: l ; ~ y o : ' ~
FIG. 8b
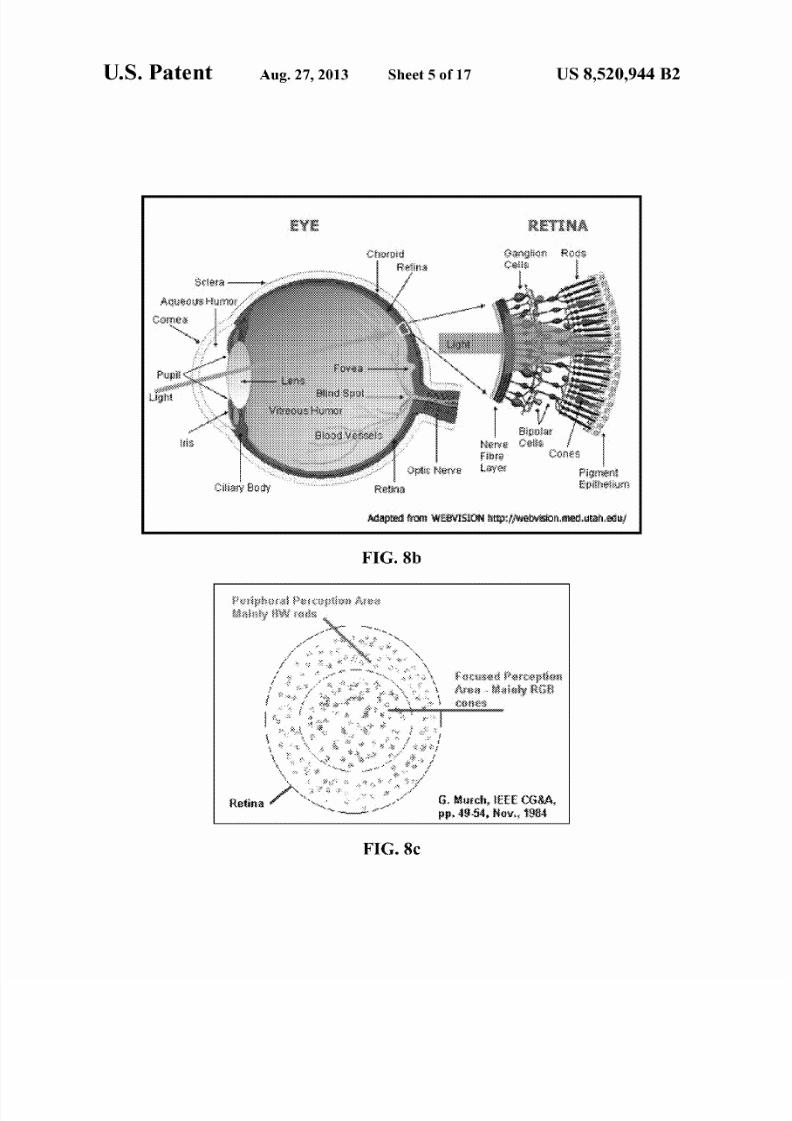
FIG. 8c
G. Murch, lf.EE: CG&A,pp 49-54. ~ { I V 19$4
US 8 520 944 B2
8/12/2019 Uspto 8520944 b2 Aug 27 2013 Patent for Scribb
http://slidepdf.com/reader/full/uspto-8520944-b2-aug-27-2013-patent-for-scribb 7/34
U.S. atent Aug. 27 2013 Sheet 6 o 17 US 8 520 944 B2
FIG. 9
8/12/2019 Uspto 8520944 b2 Aug 27 2013 Patent for Scribb
http://slidepdf.com/reader/full/uspto-8520944-b2-aug-27-2013-patent-for-scribb 8/34
U.S. atent Aug. 27 2013 Sheet 7 o 17 US 8 520 944 B2
FIG. 10
8/12/2019 Uspto 8520944 b2 Aug 27 2013 Patent for Scribb
http://slidepdf.com/reader/full/uspto-8520944-b2-aug-27-2013-patent-for-scribb 9/34
U.S. atent Aug. 27 2013 Sheet 8 o 17 US 8 520 944 B2
FIG.
8/12/2019 Uspto 8520944 b2 Aug 27 2013 Patent for Scribb
http://slidepdf.com/reader/full/uspto-8520944-b2-aug-27-2013-patent-for-scribb 10/34
U.S. atent Aug. 27 2013 Sheet 9 of 17 US 8 520 944 B2
FIG 12
8/12/2019 Uspto 8520944 b2 Aug 27 2013 Patent for Scribb
http://slidepdf.com/reader/full/uspto-8520944-b2-aug-27-2013-patent-for-scribb 11/34
U S atent Aug. 27 2013 Sheet 10 of 17 US 8 520 944 B2
FIG 3
FIG 4
FIG 15
8/12/2019 Uspto 8520944 b2 Aug 27 2013 Patent for Scribb
http://slidepdf.com/reader/full/uspto-8520944-b2-aug-27-2013-patent-for-scribb 12/34
U.S. Patent Aug. 27 2013
FIG 16a
Sheet 11 of 17
FIG 16b
FIG. 17
FIG 18
US 8 520 944 B2
3CJ D C.
· t
1 s o ~ c
8/12/2019 Uspto 8520944 b2 Aug 27 2013 Patent for Scribb
http://slidepdf.com/reader/full/uspto-8520944-b2-aug-27-2013-patent-for-scribb 13/34
U.S. atent Aug. 27, 2013 Sheet 12 o 17 US 8,520,944 B2
F IG. 19
_11- IG. 20
8/12/2019 Uspto 8520944 b2 Aug 27 2013 Patent for Scribb
http://slidepdf.com/reader/full/uspto-8520944-b2-aug-27-2013-patent-for-scribb 14/34
U.S. atent Aug. 27 2013 Sheet 13 o 17 US 8 520 944 B2
FIG. 2
FIG. 22
8/12/2019 Uspto 8520944 b2 Aug 27 2013 Patent for Scribb
http://slidepdf.com/reader/full/uspto-8520944-b2-aug-27-2013-patent-for-scribb 15/34
U.S. atent Aug. 27 2013 Sheet 14 of 17 US 8 520 944 B2
FIG. 23a
FIG 23b
8/12/2019 Uspto 8520944 b2 Aug 27 2013 Patent for Scribb
http://slidepdf.com/reader/full/uspto-8520944-b2-aug-27-2013-patent-for-scribb 16/34
U.S. atent Aug. 27 2013 Sheet 15 of 17 US 8 520 944 B
FIG. 24
FIG.25
FIG 26a
FIG 26b
8/12/2019 Uspto 8520944 b2 Aug 27 2013 Patent for Scribb
http://slidepdf.com/reader/full/uspto-8520944-b2-aug-27-2013-patent-for-scribb 17/34
U.S. atent Aug. 27 2013 Sheet 16 o 17 US 8 520 944 B2
FIG. 27
8/12/2019 Uspto 8520944 b2 Aug 27 2013 Patent for Scribb
http://slidepdf.com/reader/full/uspto-8520944-b2-aug-27-2013-patent-for-scribb 18/34
U.S. atent Aug. 27 2013 Sheet 17 of 17 US 8 520 944 B2
FlG 28a FlG 28b
FIG 28c FIG 28d
8/12/2019 Uspto 8520944 b2 Aug 27 2013 Patent for Scribb
http://slidepdf.com/reader/full/uspto-8520944-b2-aug-27-2013-patent-for-scribb 19/34
US 8,520,944 B2
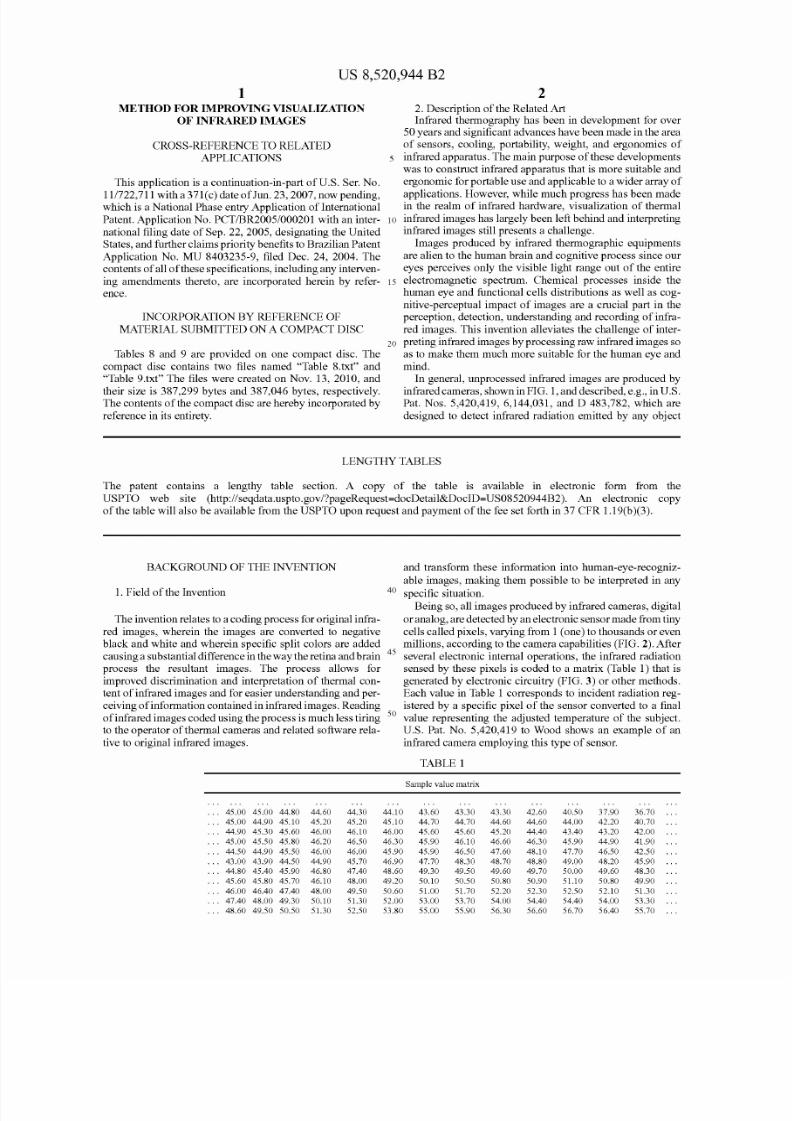
1METHOD FOR IMPROVING VISUALIZATION
OF INFRARED IMAGES
CROSS-REFERENCE TO RELATED
APPLICATIONS
This application is a continuation-in-part of U.S. Ser. No.
11/722,711 with a 371(c) date ofJun. 23,2007, now pending,
which is a National Phase entry Application oflnternational
Patent. Application No. PCT/BR2005/000201 wi th an inter
national filing date of Sep. 22, 2005, designating the United
States, and further claims priority benefits to Brazilian Patent
Application No. MU 8403235-9, filed Dec. 24, 2004. The
contents of all of hese specifications, including any interven
ing amendments thereto, are incorporated herein by refer
ence.
INCORPORATION BY REFERENCE OF
MATERIAL SUBMITTED ON A COMPACT DISC
Tables 8 and 9 are provided on one compact disc. The
compact disc contains two files named Table 8.txt and
Table 9.txt The files were created on Nov. 13, 2010, andtheir size is 387,299 bytes and 387,046 bytes, respectively.
The contents of the compact disc are hereby incorporated by
reference in its entirety.
22. Description of the Related ArtInfrared thermography has been in development for over
50 years and significant advances have been made in the area
of sensors, cooling, portability, weight, and ergonomics of
infrared apparatus. The main purpose of these developments
was to construct infrared apparatus that is more suitable and
ergonomic for portable use and applicable to a wider array of
applications. However, while much progress has been made
in the realm of infrared hardware, visualization of thermal
10 infrared images has largely been left behind and interpreting
infrared images still presents a challenge.
Images produced by infrared thermographic equipments
are alien to the human brain and cognitive process since our
eyes perceives only the vis ible light range out of the entire
15 electromagnetic spectrum. Chemical processes inside the
human eye and functional cells distributions as well as cog
nitive-perceptual impact of images are a crucial part in the
perception, detection, understanding and recording of infra
red images. This invention alleviates the challenge of inter-
20 preting infrared images by processing raw infrared images so
as to make them much more suitable for the human eye and
mind.
In general, unprocessed infrared images are produced byinfrared cameras, showninFIG.1 and described, e.g., in U.S.
Pat. Nos. 5,420,419, 6,144,031, and D 483,782, which are
designed to detect infrared radiation emitted by any object
LENGTHY TABLES
The patent contains a lengthy table section. A copy of the table is available in electronic form from the
USPTO web site (http://seqdata.uspto.gov/?pageRequest=docDetail&DociD=US08520944B2). n electronic copy
of the table will also be available from the USPTO upon request and payment of the fee set forth in 37 CFR 1.19(b )(3).
BACKGROUND OF THE INVENTION
1 Field of the Invention
The invention relates to a coding process for original infra
red images, wherein the images are converted to negative
black and white and wherein specific split colors are added
causing a substantial difference in the way the retina and brain
process the resultant images. The process allows for
improved discrimination and interpretation of thermal con
tent of infrared images and for easier understanding and per
ceivingof nformation contained in infrared images. Reading
of nfrared images coded using the process ismuch less tiring
to the operator of thermal cameras and related software rela
tive to original infrared images.
45.00 45.00 44.80 44.60 44.30
45.00 44.90 45.10 45.20 45.20
44.90 45.30 45.60 46.00 46.10
45.00 45.50 45.80 46.20 46.50
44.50 44.90 45.50 46.00 46.00
43.00 43.90 44.50 44.90 45.70
44.80 45.40 45.90 46.80 47.40
45.60 45.80 45.70 46.10 48.00
46.00 46.40 47.40 48.00 49.50
47.40 48.00 49.30 50.10 51.30
48.60 49.50 50.50 51.30 52.50
and transform these information into human-eye-recognizable images, making them possible to be interpreted in any
40 specific situation.
Being so, all images produced by infrared cameras, digital
or analog, are detected by an electronic sensor made from tiny
cells called pixels, varying from 1 (one) to thousands or even
millions, according to the camera capabilities (FIG. 2 . After45
several electronic internal operations, the infrared radiation
sensed by these pixels is coded to a matrix (Table 1) that is
generated by electronic circuitry (FIG. 3 or other methods.
Each value in Table 1 corresponds to incident radiation reg
istered by a specific pixel of the sensor converted to a final50
value representing the adjusted temperature of the subject.
44.10
45.10
46.00
46.30
45.90
46.90
48.60
49.20
50.60
52.00
53.80
U.S. Pat. No. 5,420,419 to Wood shows an example of an
infrared camera employing this type of sensor.
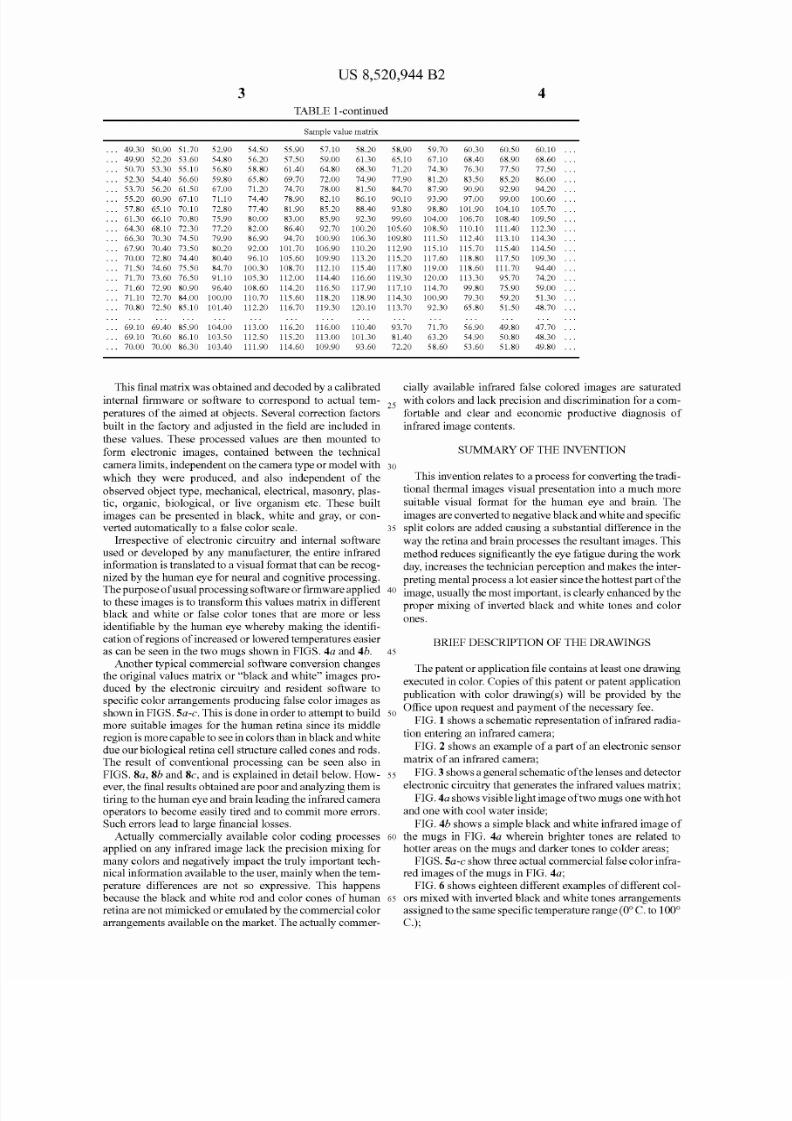
TABLE 1
Sample value matrix
43.60 43.30 43.30 42.60 40.50 37.90 36.70
44.70 44.70 44.60 44.60 44.00 42.20 40.70
45.60 45.60 45.20 44.40 43.40 43.20 42.00
45.90 46.10 46.60 46.30 45.90 44.90 41.90
45.90 46.50 47.60 48.10 47.70 46.50 42.50
47.70 48.30 48.70 48.80 49.00 48.20 45.90
49.30 49.50 49.60 49.70 50.00 49.60 48.30
50.10 50.50 50.80 50.90 51.10 50.80 49.90
51.00 51.70 52.20 52.30 52.50 52.10 51.30
53.00 53.70 54.00 54.40 54.40 54.00 53.30
55.00 55.90 56.30 56.60 56.70 56.40 55.70
8/12/2019 Uspto 8520944 b2 Aug 27 2013 Patent for Scribb
http://slidepdf.com/reader/full/uspto-8520944-b2-aug-27-2013-patent-for-scribb 20/34
US 8,520,944 B2
3 4
TABLE -continued
Sample value matrix
49.30 50.90 51.70 52.90 54.50 55.90 57.10 58.20 58.90 59.70 60.30 60.50 60.10
49.90 52.20 53.60 54.80 56.20 57.50 59.00 61.30 65.10 67.10 68.40 68.90 68.60
50.70 53.30 55.10 56.80 58.80 61.40 64.80 68.30 71.20 74.30 76.30 77.50 77.50
52.30 54.40 56.60 59.80 65.80 69.70 72.00 74.90 77.90 81.20 83.50 85.20 86.00
53.70 56.20 61.50 67.00 71.20 74.70 78.00 81.50 84.70 87.90 90.90 92.90 94.2055.20 60.90 67.10 71.10 74.40 78.90 82.10 86.10 90.10 93.90 97.00 99.00 100.60
57.80 65.10 70.10 72.80 77.40 81.90 85.20 88.40 93.80 98.80 101.90 104.10 105.70
61.30 66.10 70.80 75.90 80.00 83.00 85.90 92.30 99.60 104.00 106.70 108.40 109.50
64.30 68.10 72.30 77.20 82.00 86.40 92.70 100.20 105.60 108.50 110.10 111.40 112.30
66.30 70.30 74.50 79.90 86.90 94.70 100.90 106.30 109.80 111.50 112.40 113.10 114.30
67.90 70.40 73.50 80.20 92.00 101.70 106.90 110.20 112.90 115.10 115.70 115.40 114.50
70.00 72.80 74.40 80.40 96.10 105.60 109.90 113.20 115.20 117.60 118.80 117.50 109.30
71.50 74.60 75.50 84.70 100.30 108.70 112.10 115.40 117.80 119.00 118.60 111.70 94.40
71.70 73.60 76.50 91.10 105.30 112.00 114.40 116.60 119.30 120.00 113.30 95.70 74.20
71.60 72.90 80.90 96.40 108.60 114.20 116.50 117.90 117.10 114.70 99.80 75.90 59.00
71.10 72.70 84.00 100.00 110.70 115.60 118.20 118.90 114.30 100.90 79.30 59.20 51.30
70.80 72.50 85.10 101.40 112.20 116.70 119.30 120.10 113.70 92.30 65.80 51.50 48.70
69.10 69.40 85.90 104.00 113.00 116.20 116.00 110.40 93.70 71.70 56.90 49.80 47.70
69.10 70.60 86.10 103.50 112.50 115.20 113.00 101.30 81.40 63.20 54.90 50.80 48.30
70.00 70.00 86.30 103.40 111.90 114.60 109.90 93.60 72.20 58.60 53.60 51.80 49.80
cially available infrared false colored images are saturated
25with colors and l ack precision and discrimination for a com
fortable and clear and economic productive diagnosis of
This final matrix was obtained and decoded by a calibrated
internal firmware or software to correspond to actual tem
peratures of the aimed at objects. Several correction factors
built in the factory and adjusted in the field are included in
these values. These processed values are then mounted to
form electronic images, contained between the technical
camera limits, independent on the camera type or model with 30
which they were produced, and also independent of the
observed object type, mechanical, electrical, masonry, plas
tic, organic, biological, or live organism etc. These built
images c n be presented in black, white and gray, or con
verted automatically to a false color scale.
infrared image contents.
SUMMARY OF THE INVENTION
This invention relates to a process for converting the tradi
tiona thermal images visual presenta tion into a much more
suitable visual format for the human eye and brain. The
images are converted to negative black and white and specific
35 split colors are added causing a substantial difference in the
way the retina and b rain processes the resultant images. This
method reduces significantly the eye fatigue during the work
day, increases the technician perception and makes the inter-
Irrespective of electronic circuitry and internal software
used or developed by any manufacturer, the entire infrared
information is translated to a visual format that ca n be recognized by the human eye for neural and cognitive processing.
The purpose ofusual processing software or firmware applied 40
to these images is to transform this values matrix in different
black and white or false color tones that are more or less
identifiable by the human eye whereby making the identifi
cation of regions of increased or lowered temperatures easier
as can be seen in the two mugs shown in FIGS. 4a and 4b. 45
Another typical commercial software conversion changesthe original values matrix or "black and white" images pro
duced by the electronic circuitry and resident software to
specific color arrangements producing false color images as
shown in FIGS. Sa-c. This is done in order to attempt to build 50
more suitable images for the human retina since its middle
region is more capable to see in colors than in black and white
due ou r biological retina cell structure called cones and rods.The result of conventional processing can be seen also in
FIGS. Sa Sb and Sc and is explained in detail below. How- 55
ever, the final results obtained are poor and analyzing them is
tiring to the hum an eye and brain leading the infrared camera
operators to become easily tired and to commit more errors.
Such errors lead to large financial losses.
Actually commercially available color coding processes 60
applied on any infrared image lack the precision mixing for
many colors and negatively impact the truly important tech
nical information available to the user, mainly when the tem
perature differences are not so expressive. This happens
because the black and white rod and color cones of human 6
retina are not mimicked or emulated by the commercial color
arrangements available on the market. The actually commer-
preting mental process a lot easier since the hottest part of he
image, usually the most important, is clearly enhanced by the
proper mixing of inverted black and white tones and color
ones.
BRIEF DESCRIPTION OF THE DRAWINGS
The patent or application file contains at least one drawing
executed in color. Copies of this patent or patent application
publication with color drawing(s) will be provided by the
Office upon request a nd payment of the necessary fee.
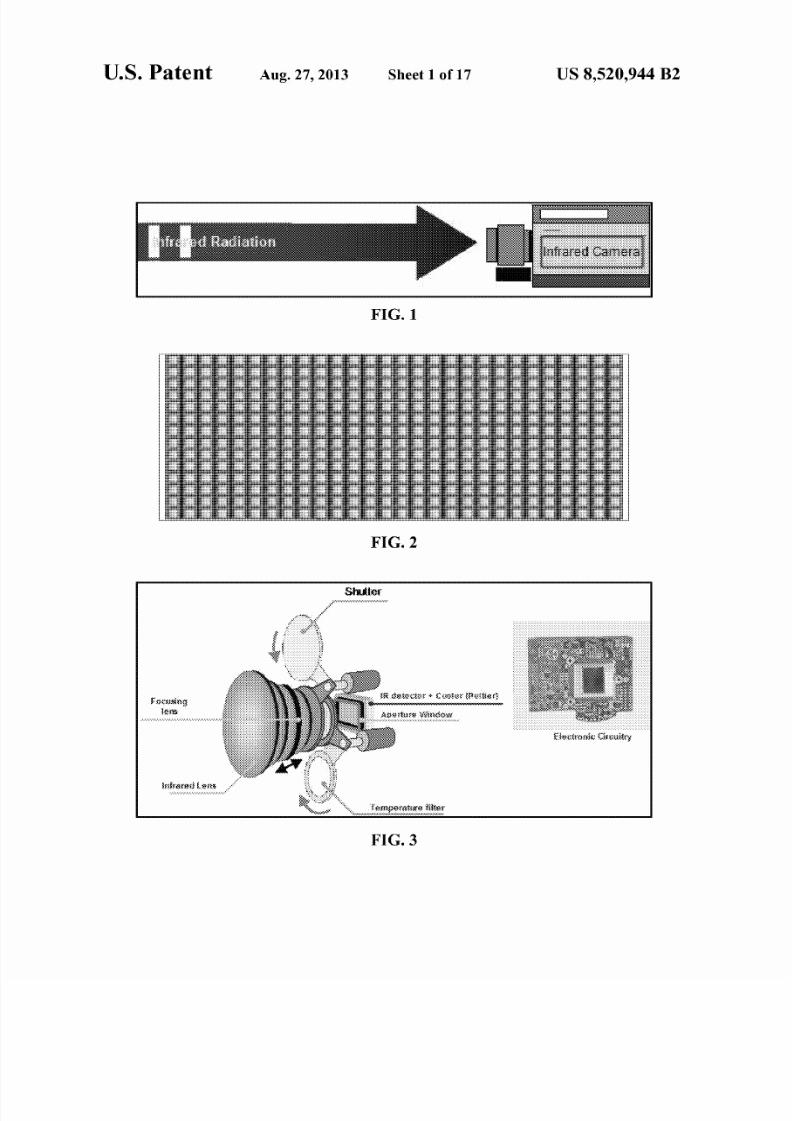
FIG. 1 shows a schematic representation of nfrared radia
tion entering n infrared camera;
FIG. 2 shows n example of a part of n electronic senso r
matrix of an infrared camera;
FIG. 3 shows a general schematic of he lenses and detector
electronic circuitry that generates the infrared values matrix;
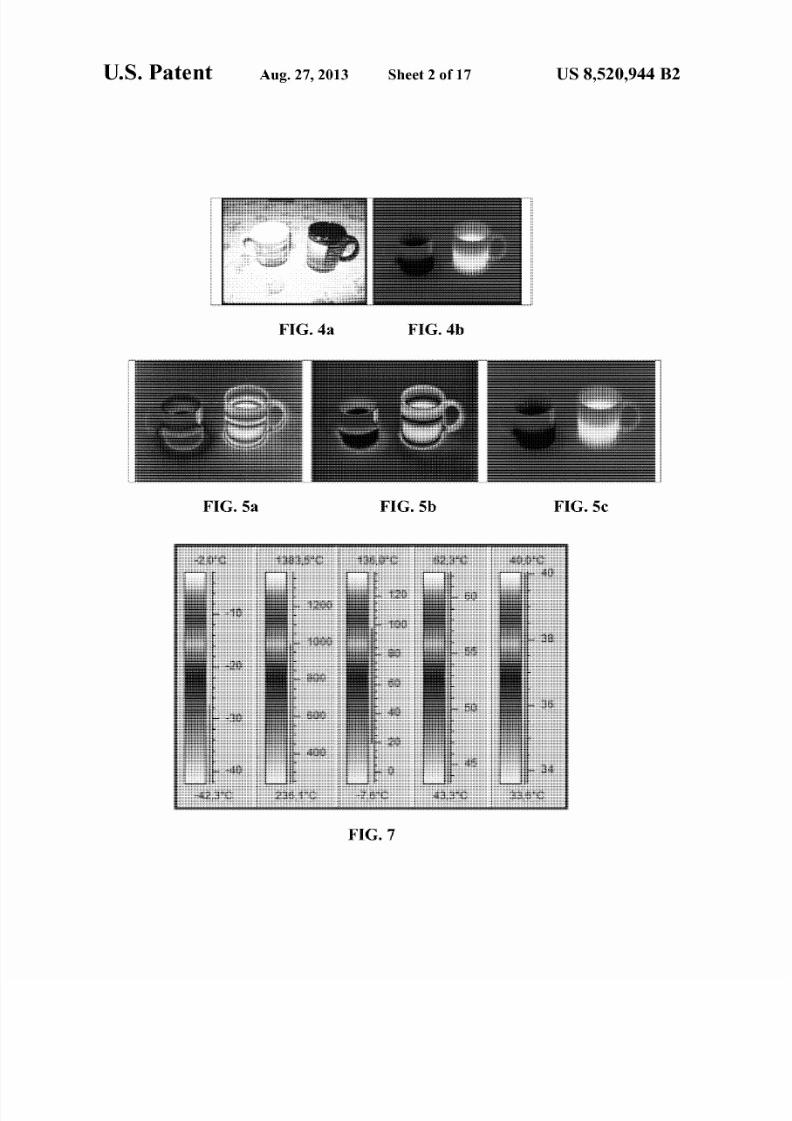
FIG. 4a shows visible light image of wo mugs one with hot
and one with cool water inside;
FIG. 4b shows a simple black and white infrared image of
the mugs in FIG. 4a wherein brighter tones are related to
hotter areas on the mugs and darker tones to colder areas;
FIGS. Sa-c show three actual commercial false color infra
red images of the mugs in FIG. a;
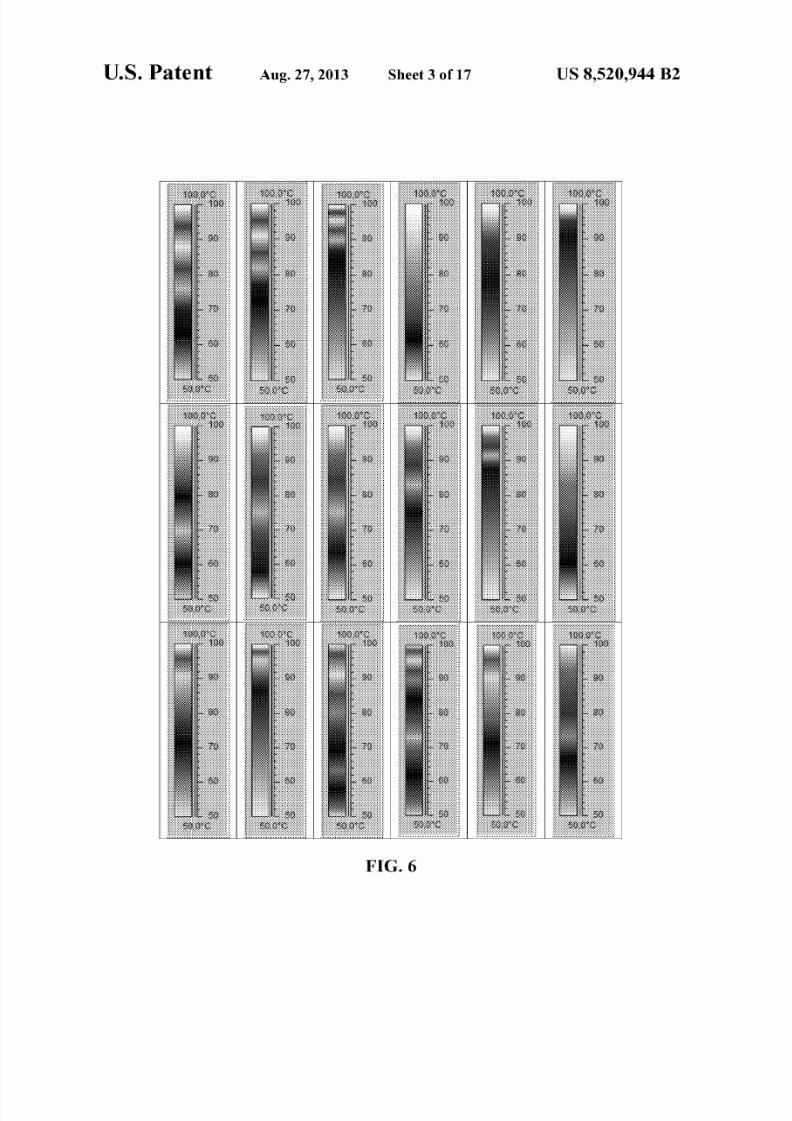
FIG. 6 shows eighteen different examples of different col
ors mixed with inverted black and white tones arrangements
assigned to the same specific temperature range (0° C. to 100°
C.);
8/12/2019 Uspto 8520944 b2 Aug 27 2013 Patent for Scribb
http://slidepdf.com/reader/full/uspto-8520944-b2-aug-27-2013-patent-for-scribb 21/34
US 8,520,944 B2
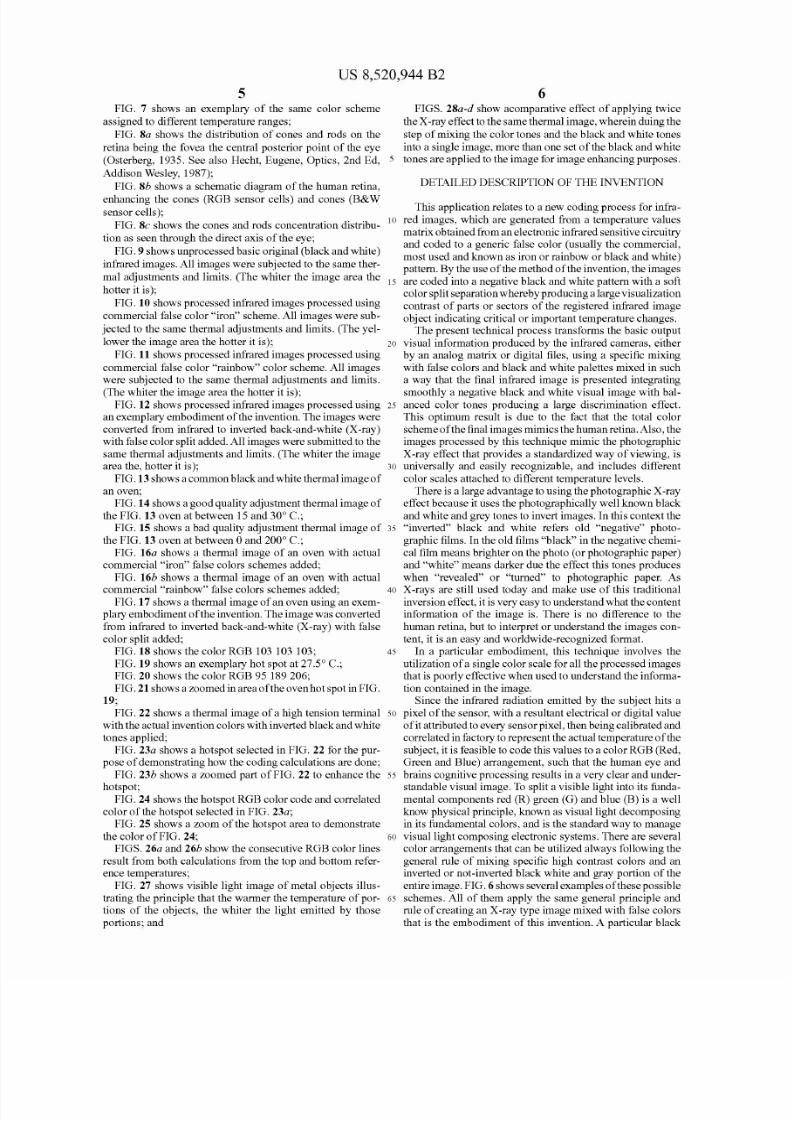
5FIG. 7 shows an exemplary of the same color scheme
assigned to different temperature ranges;
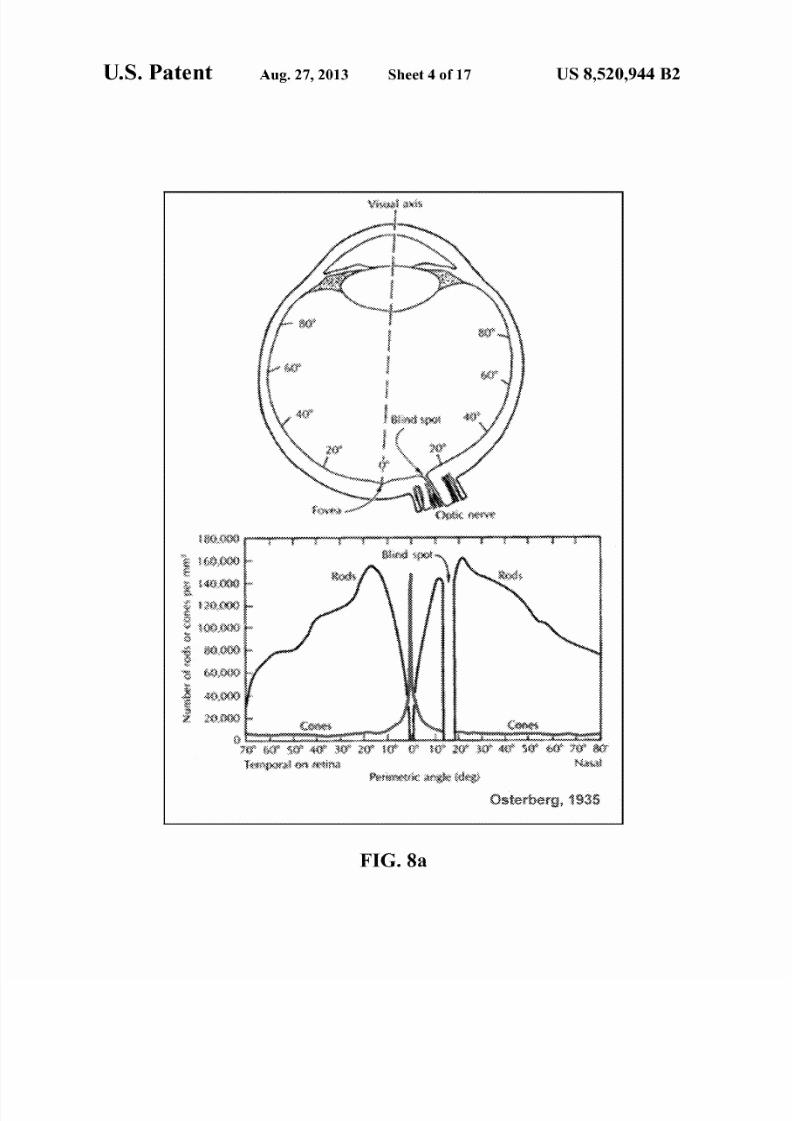
FIG. Sa shows the distribution of cones and rods on the
retina being the fovea the central posterior point of the eye
(Osterberg, 1935. See also Hecht, Eugene, Optics, 2nd Ed,
Addison Wesley, 1987);
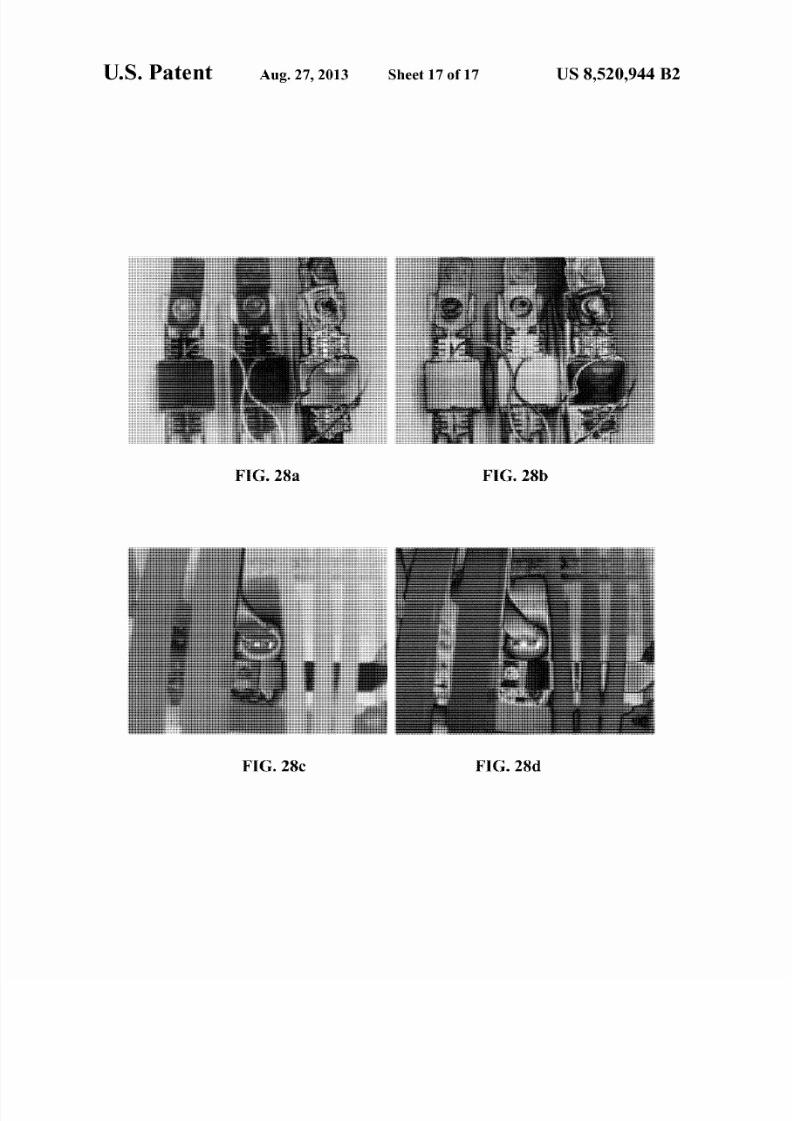
6FIGS. 28a d show acomparative effect of applying twice
the X -ray effect to the same thermal image, wherein duing the
step of mixing the color tones and the black and white tones
into a single image, more than one set of the black and white
tones are applied to the image for image enhancing purposes.
DETAILED DESCRIPTION OF THE INVENTIONFIG. Sb shows a schematic diagram of the human retina,
enhancing the cones (RGB sensor cells) and cones (B&W
sensor cells);
FIG. Sc shows the cones and rods concentration distribu-10
This application relates to a new coding process for infra
red images, which are generated from a temperature values
matrix obtained from an electronic infrared sensitive circuitry
and coded to a generic false color (usually the commercial,
most used and known as iron or rainbow or black and white)
pattern. By the use of he method of he invention, the images
tion as seen through the direct axis of the eye;
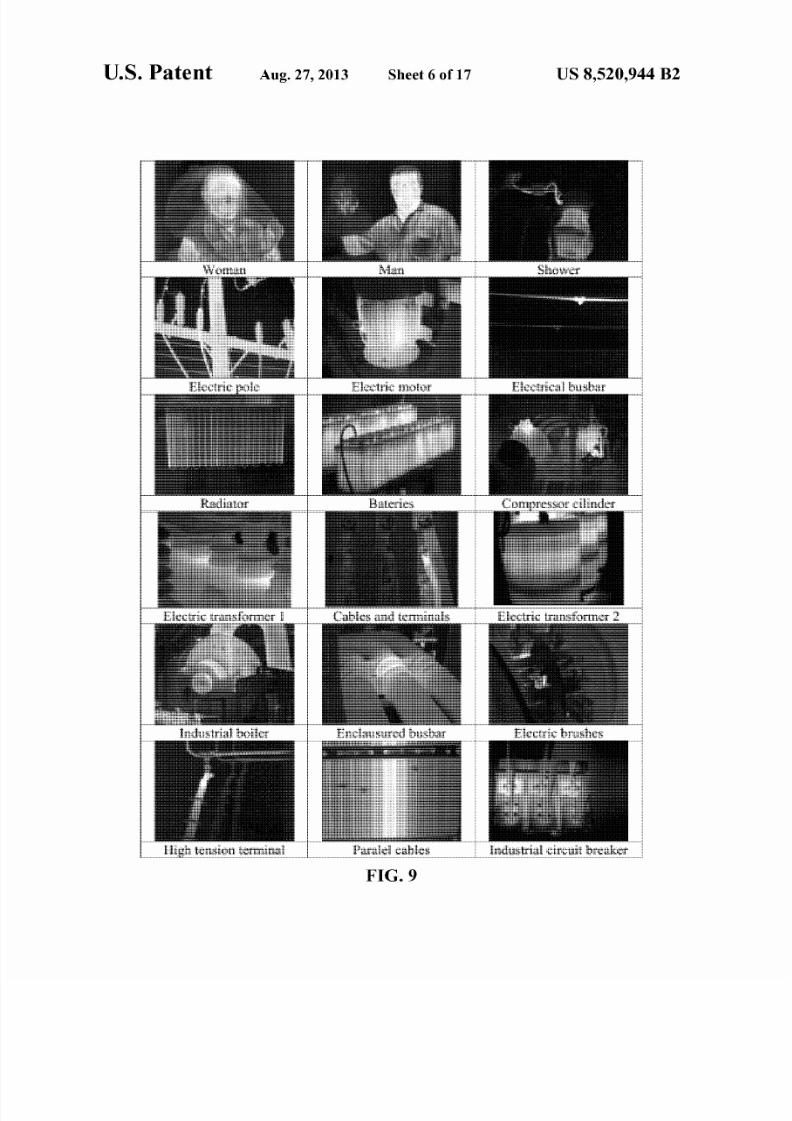
FIG. 9 shows unprocessed basic original (black and white)
infrared images. All images were subjected to the same ther
mal adjustments and limits. (The whiter the image area the
hotter it is);
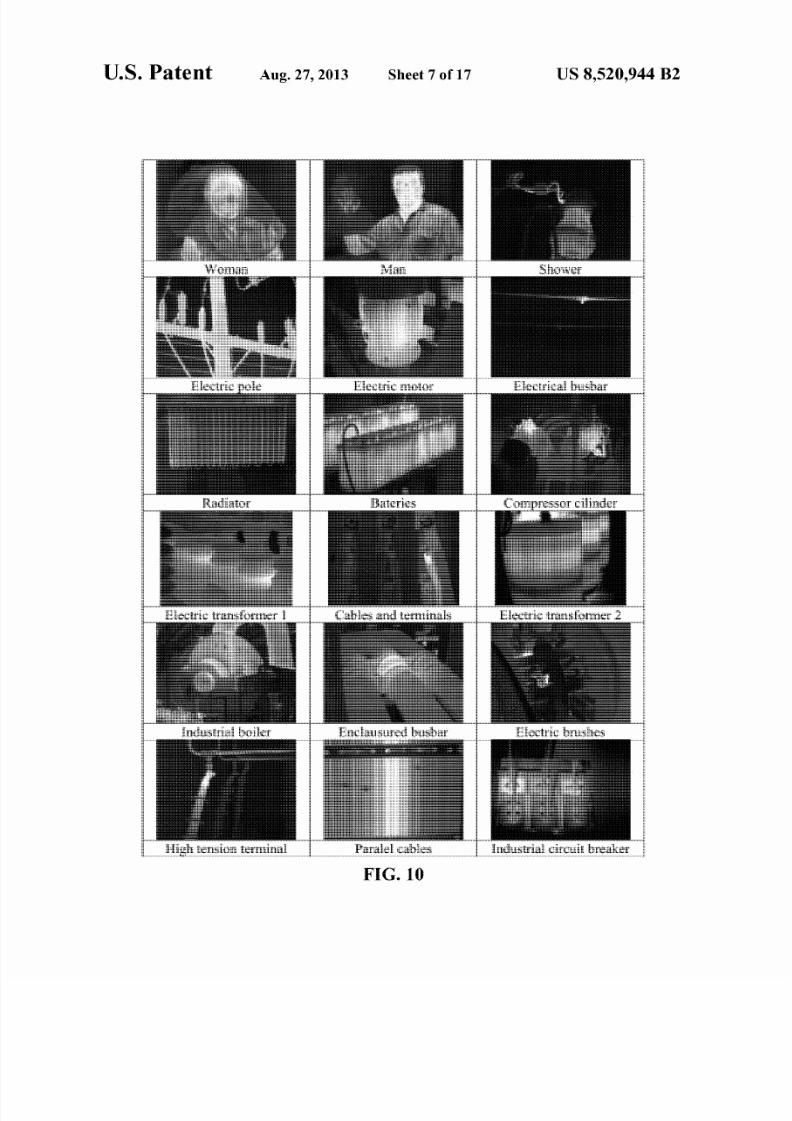
FIG. 10 shows processed infrared images processed using
commercial false color iron scheme. All images were sub
jecte d to the same thermal adjustments and limits. (The yel
lower the image area the hotter it is);
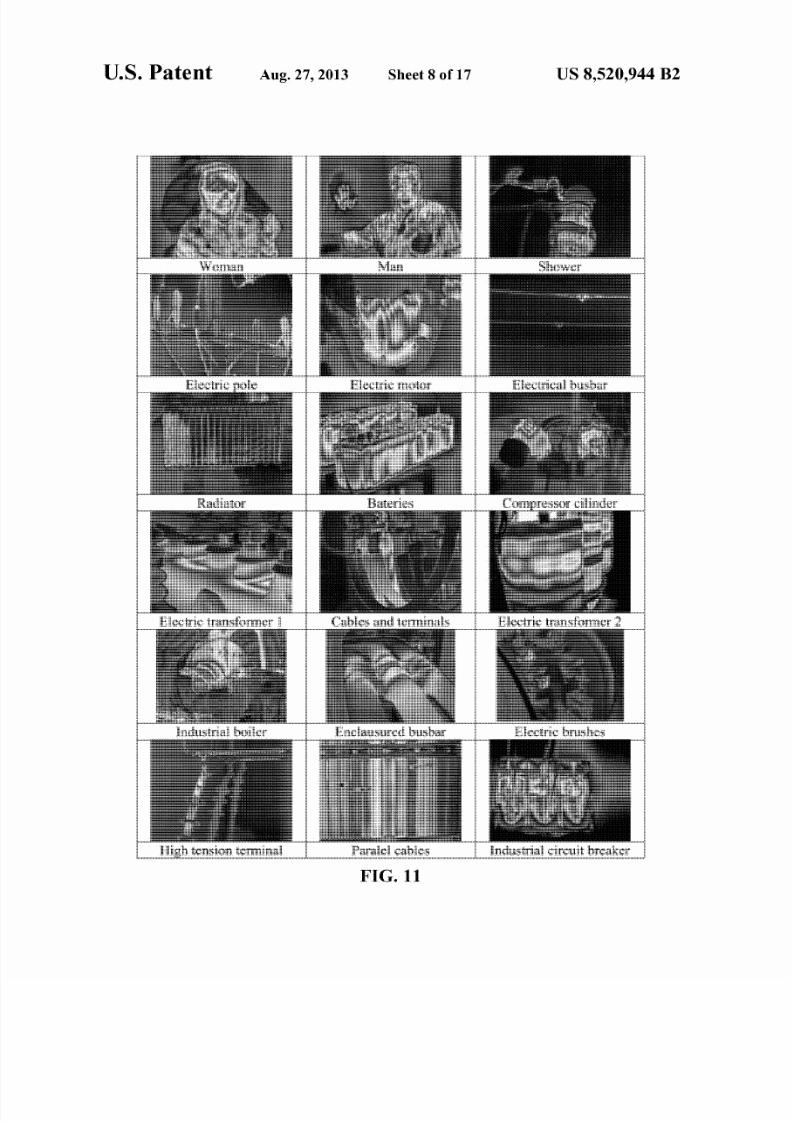
FIG. 11 shows processed infrared images processed using
commercial false color rainbow color scheme. All images
were subjected to the same thermal adjustments and limits.(The whiter the image area the hotter it is);
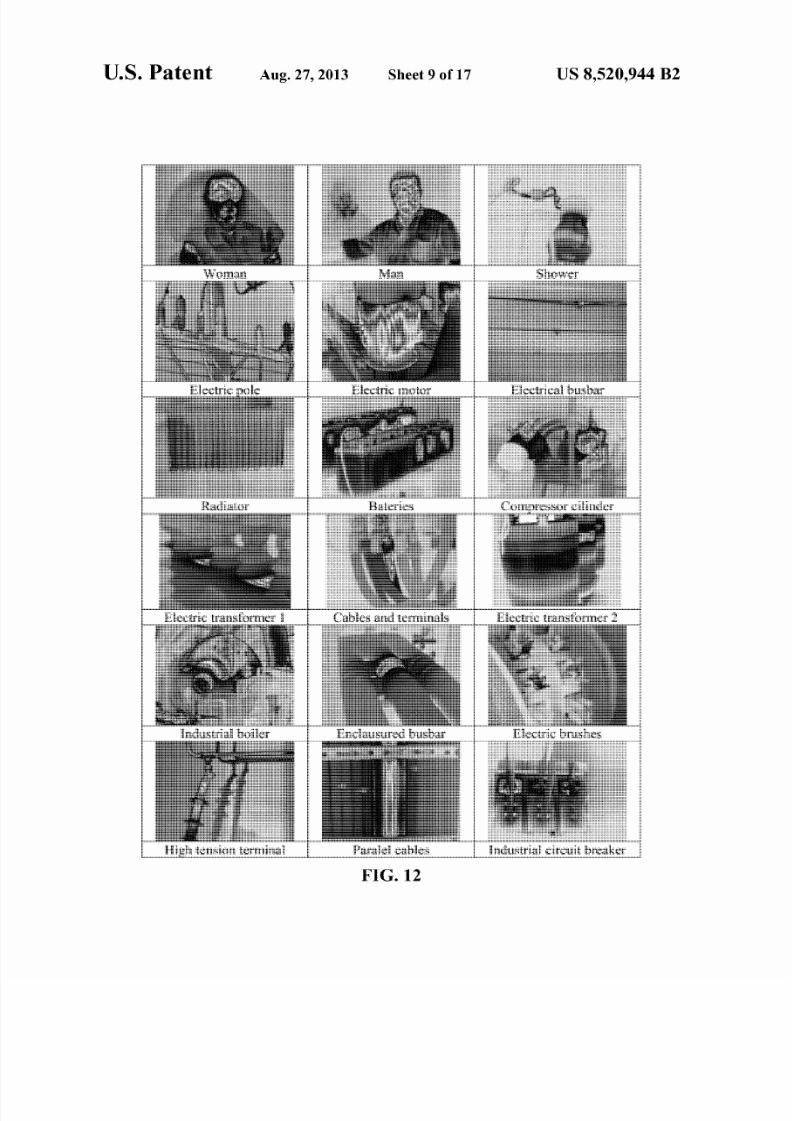
FIG. 12 shows processed infrared images processed using
an exemplary embodiment of he invention. The images were
converted from infrared to inverted back-and-white (X-ray)
with false color split added. All images were submitted to the
same thermal adjustments and limits. (The whiter the image
area the, hotter it is);
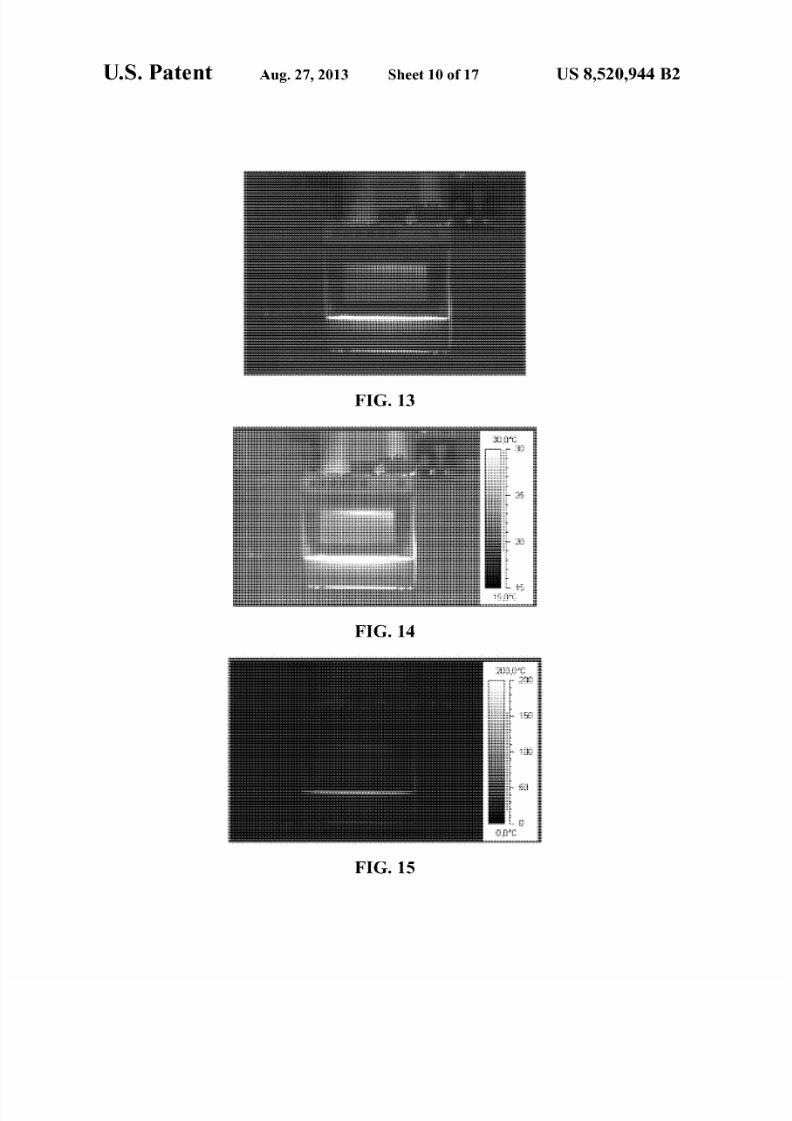
FIG.13 shows a common black and white thermal image of
an oven;
FIG. 14 shows a good quality adjustment thermal image of
the FIG. 13 oven at between 5 and 30° C.;
FIG. 15 shows a bad quality adjustment thermal image of
the FIG. 13 oven at between 0 and 200° C.;
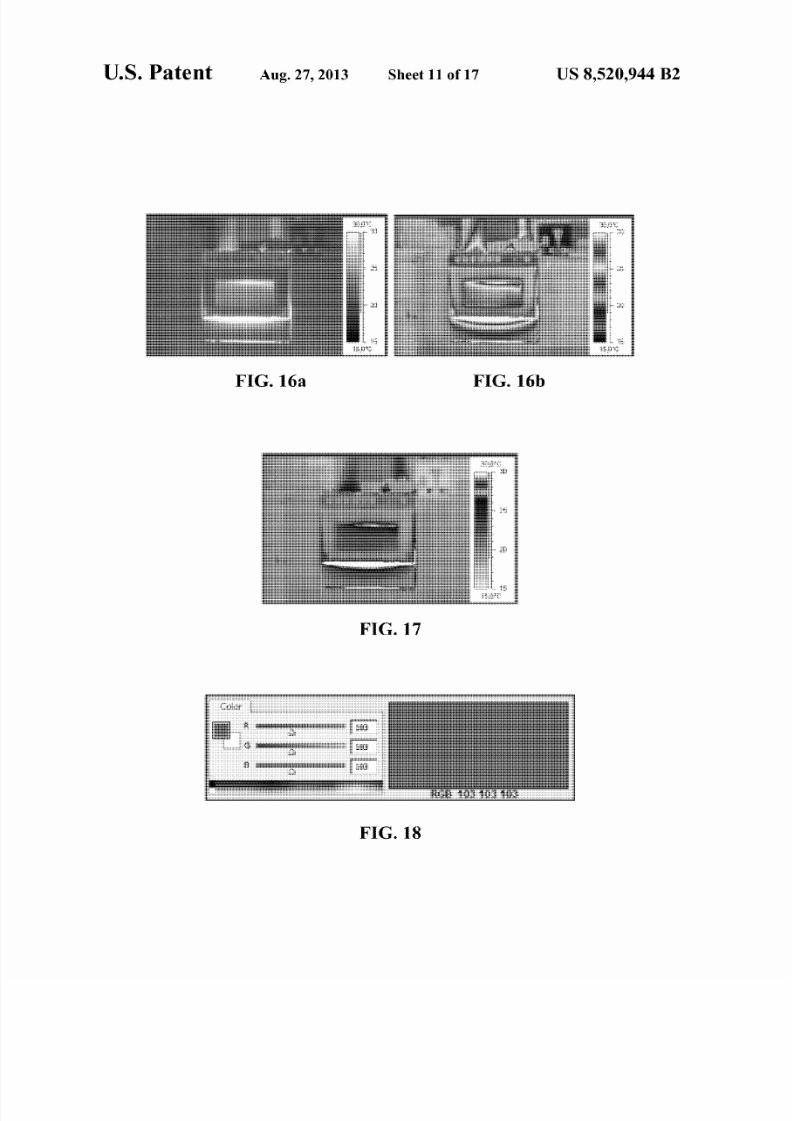
FIG. 16a shows a thermal image of an oven with actual
commercial iron false colors schemes added;FIG. 16b shows a thermal image of an oven with actual
commercial rainbow false colors schemes added;
FIG. 17 shows a thermal image of an oven using an exem
plary embodiment of he invention. The image was converted
from infrared to inverted back-and-white (X-ray) with false
color split added;
FIG. 18 shows the color RGB 103 103 103;
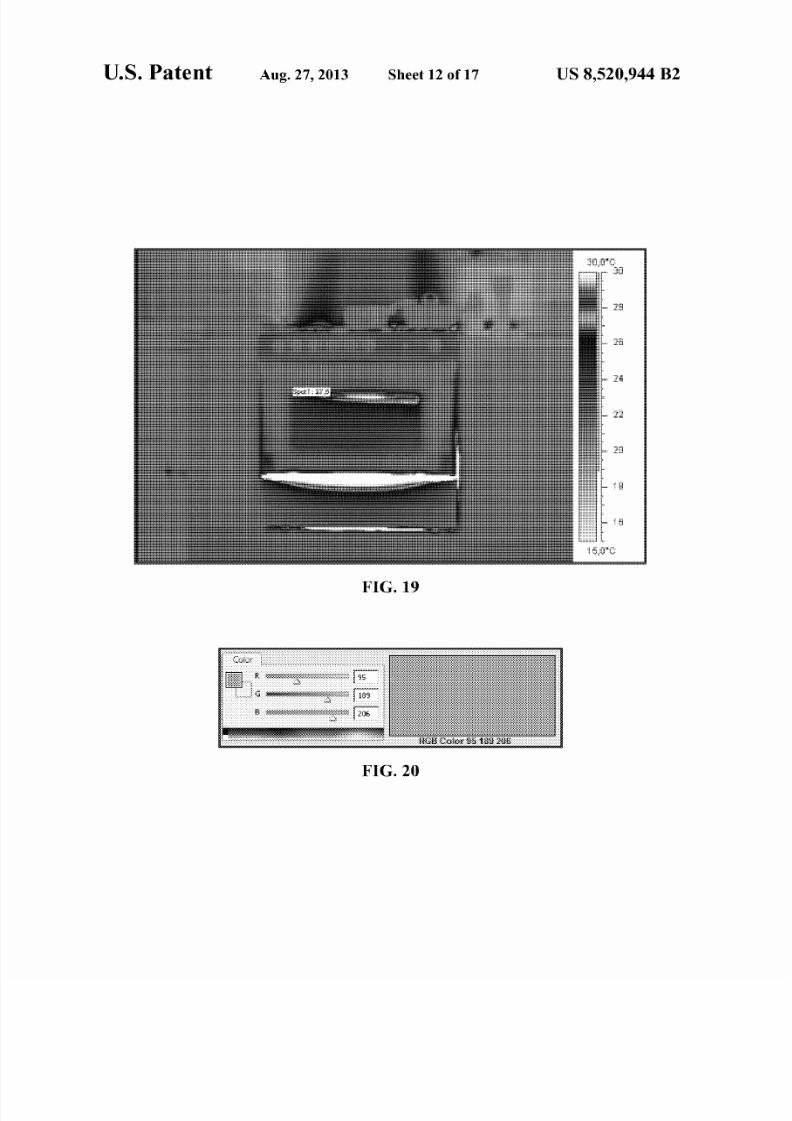
FIG. 19 shows an exemplary hot spot at 27.5° C.;
FIG. 20 shows the color RGB 95 189 206;
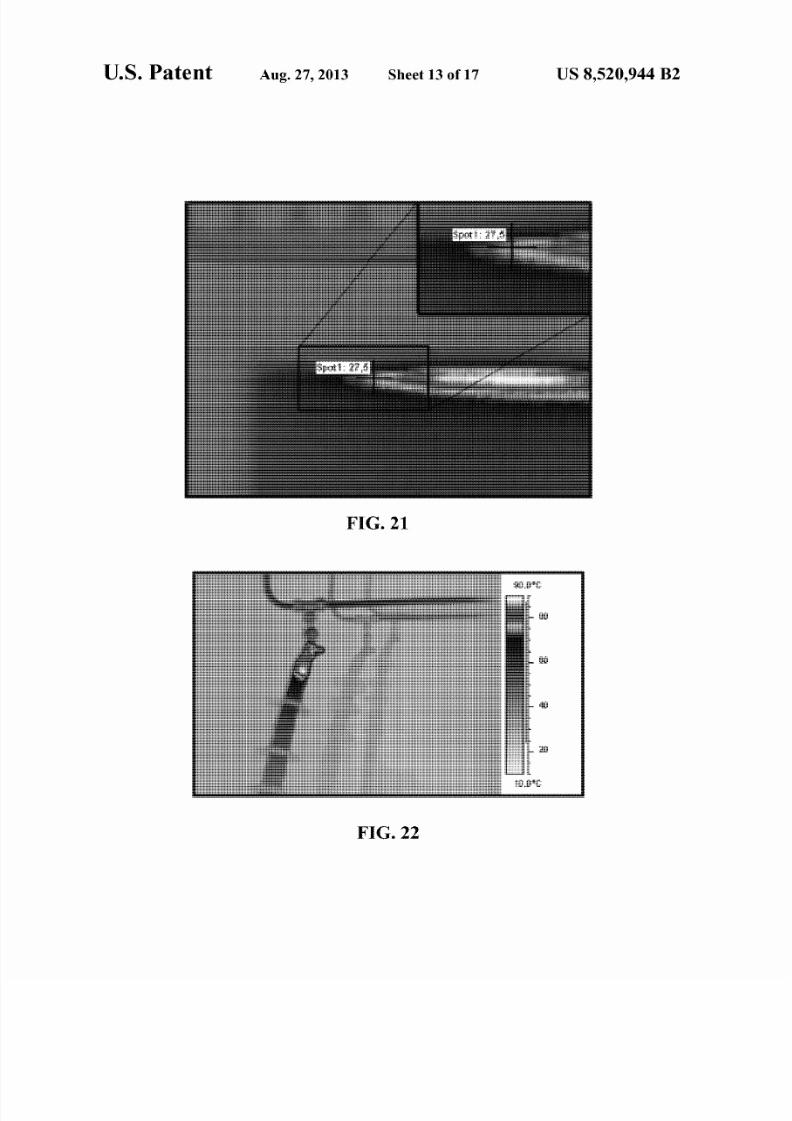
FIG. 21 shows a zoomed in area of he oven hot spot in FIG.
19;
FIG. 22 shows a thermal image of a high tension terminal
with the actual invention colors with inverted black and whit e
tones applied;
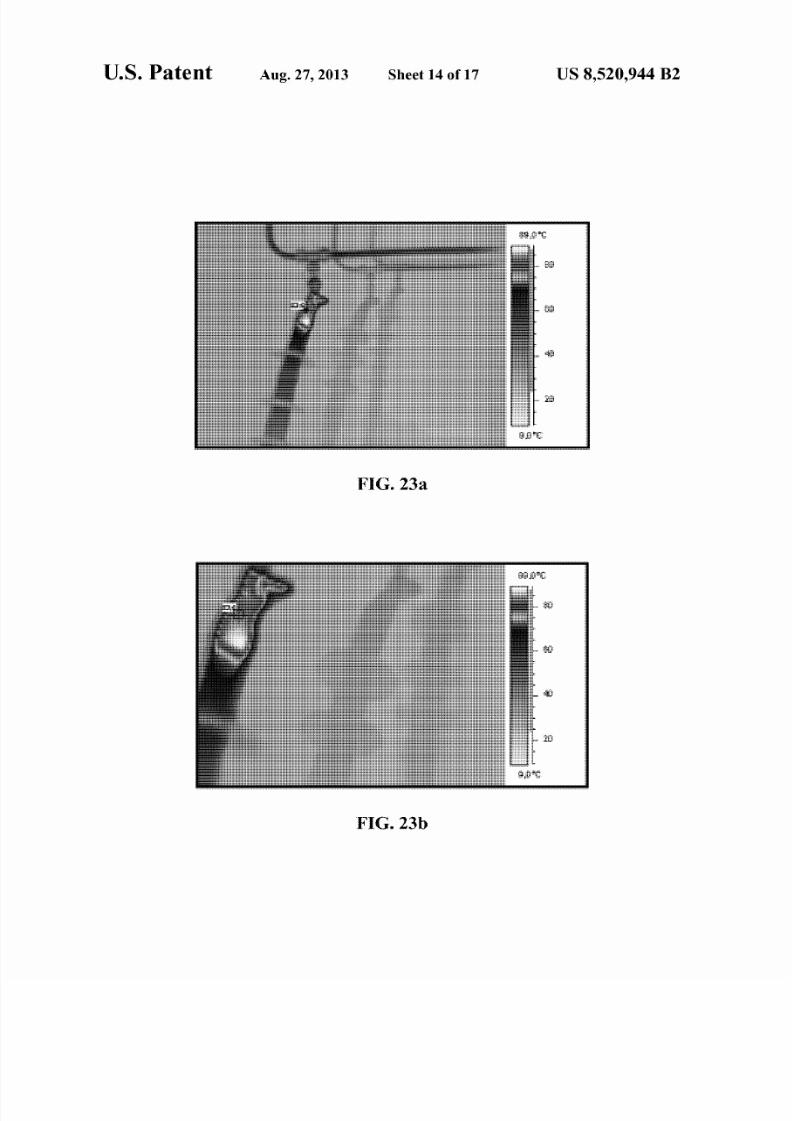
FIG. 23a shows a hotspot selectedin
FIG. 22 for the purpose of demonstrating how the coding calculations are done;
FIG. 23b shows a zoomed part of FIG. 22 to enhance the
hotspot;
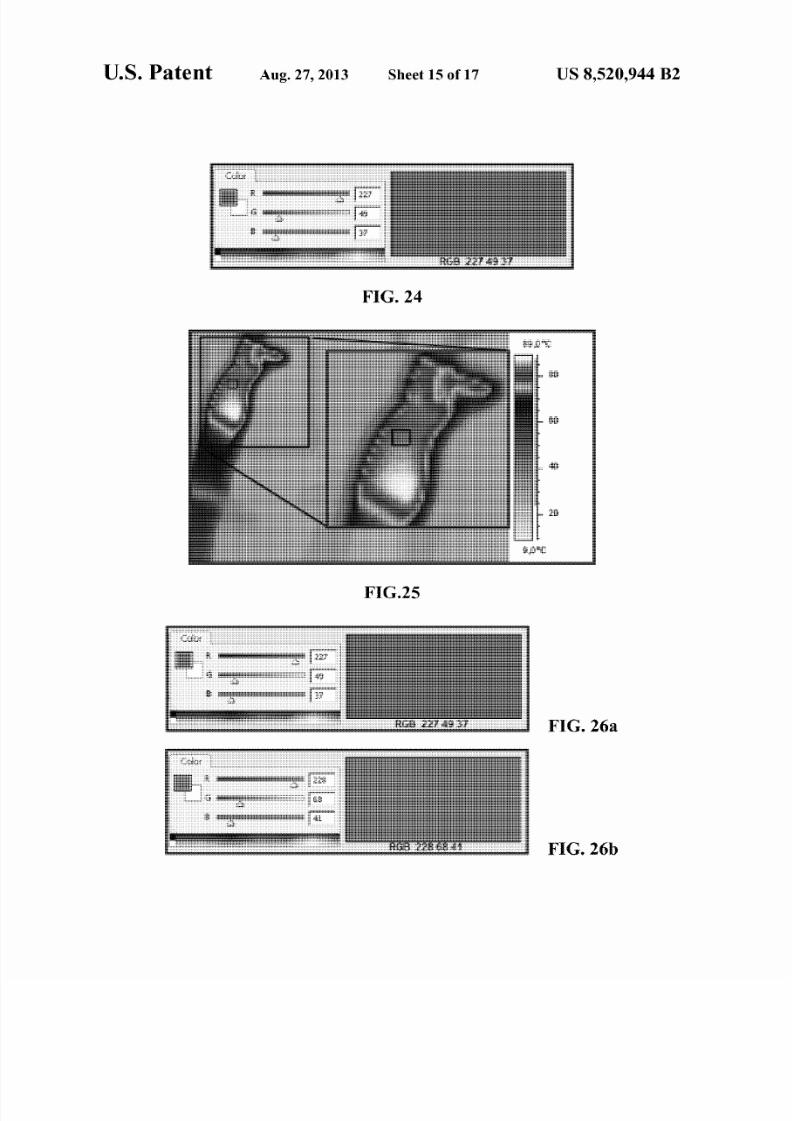
FIG. 24 shows the hotspot RGB color code and correlated
color of the hotspot selected in FIG. 23a;
FIG. 25 shows a zoom of the hotspot area to demonstrate
the color of FIG. 24;
FIGS. 6a and 26b show the consecutive RGB color lines
result from both calculations from the top a nd bottom refer
ence temperatures;
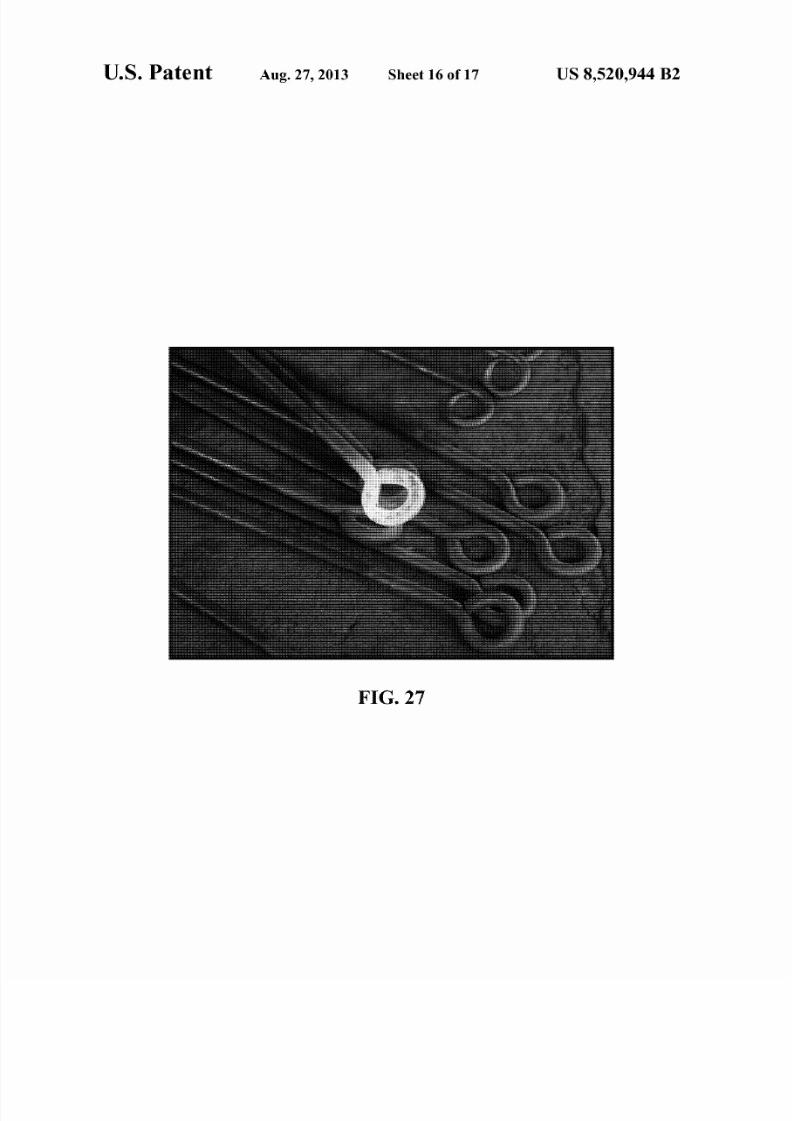
FIG. 27 shows visible light image of metal objects illus
trating the principle that the warmer the temperature of por
tions of the objects, the whiter the light emitted by those
portions; and
15 are coded into a negative black and white pattern with a soft
color split separation whereby producing a large visualization
contrast of parts or sectors of the registered infrared image
object indicating critical or important temperature changes.
The present technical process transforms the basic output
20 visual information produced by the infrared cameras, either
by an analog matrix or digital files, using a specific mixing
with false colors and black and white palettes mixed in such
a way that the final infrared image is presented integratingsmoothly a negative black and white visual image with bal-
25 anced color tones producing a large discrimination effect.
This optimum result is due to the fact that the total color
schemeofthefinal images mimics thehumanretina.Also, the
images processed by this technique mimic the photographic
X-ray effect that provides a standardized way of viewing, is
30 universally and easily recognizable, and includes different
color scales attached to different temperature levels.
There is a large advantage to using the photographic X -ray
effect because it uses the photographically well known black
and white and grey tones to invert images. In this context the35 inverted black and white refers old negative photo
graphic films. In the old films black in the negative chemi
cal film means brighter on the photo (or photographic paper)
and white means darker due the effect this tones produceswhen revealed or turned to photographic paper. As
4 X -rays are still used today and make use of this traditional
inversion effect, it is very easy to unders tand what the content
information of the image is. There is no difference to the
human retina, but to interpret or understand the images con-
45
tent, it is an easy and worldwide-recognized format.
In a particular embodiment, this technique involves the
utilization of a single color scale for all the processed images
that is poorly effective when used to understand the informa
tion contained in the image.
Since the infrared radiation emitted by the subject hits a
50 pixel of the sensor, with a resultant electrical or digital value
of t attributed to every sensor pixel, then being calibrated and
correlated in factory to represent the actual temperature of he
subject, it is feasible to code this values to a color RGB (Red,Green and Blue) arrangement, such that the human eye and
55 brains cognitive processing results in a very clear and under
standable visual image. To split a visible light into its funda
mental components red (R) green (G) and blue (B) is a well
know physical principle, known as visual light decomposing
in its fundamental colors, and is the standard way to manage
60 visual light composing electronic systems. There are several
color arrangements that can be utilized always following the
general rule of mixing specific high contrast colors and an
inverted or not-inverted black white and gray portion of the
entire image. FIG. 6 shows several examples of hese possible
65 schemes. All of them apply the same general principle and
rule of creating an X -ray type image m ixed with false colors
that is the embodiment of this invention. A particular black
8/12/2019 Uspto 8520944 b2 Aug 27 2013 Patent for Scribb
http://slidepdf.com/reader/full/uspto-8520944-b2-aug-27-2013-patent-for-scribb 22/34
US 8 520 944 B2
and white distribution case can be seen in FIG. 6 second line
first scale from the left to right and third line third and fourth
scales from left to right where the black and whit e portion of
the scale is repeated twice. The final result of this particular
arrangement can be seen in FIGS. 28a dwhere the X-ray type
effect is still retained.
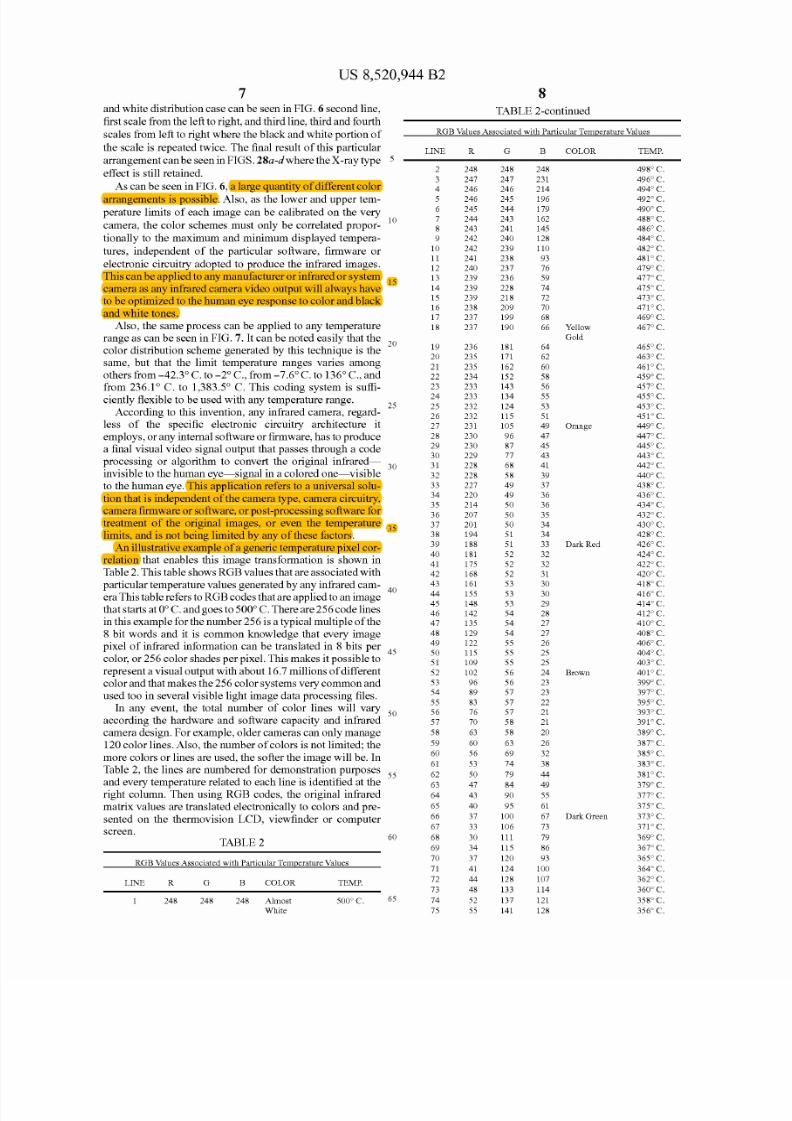
As can be seen in FIG. 6 a large quantity ofdifferent colo rarrangements is possible. Also as the lower and uppe r tem
perature limits of each image can be calibrated on the very
camera the color schemes must only be correlated propor-10
tionally to the maximum and minimum displayed tempera
tures independent of the particular software firmware or
electronic circuitry adopted to produce the infrared images.
This can be applied to any manufacturer or infrared or system15
camera as any infrared camera video output will always have
to be optimized to the human eye response to color and black
and white tones.
Also the same process can be applied to any temperature
range as can be seen in FIG. 7. It can be noted easily that the20
color distribution scheme generated by this technique is the
same but that the limit temperature ranges varies among
others from 42.3° C. to 2° C. from 7.6° C. to 136° C. andfrom 236.1 o C. to 1 383.5° C. This coding system is suffi-
ciently flexible to be used with any temperature range.25
According to this invention any infrared camera regard
less of the specific electronic circuitry architecture it
employs or any internal software or firmware has to produce
a final visual video signal output that passes through a code
processing or algorithm to convert the original infrared30
invisible to the human eye signal in a colored one visible
to the human eye. This application refers to a universal solu
tion that is independent of he camera type camera circuitry
camera firmware or software or post-processing software for
treatment of the original images or even the temperature35
limits and is not being limited by any of these factors.
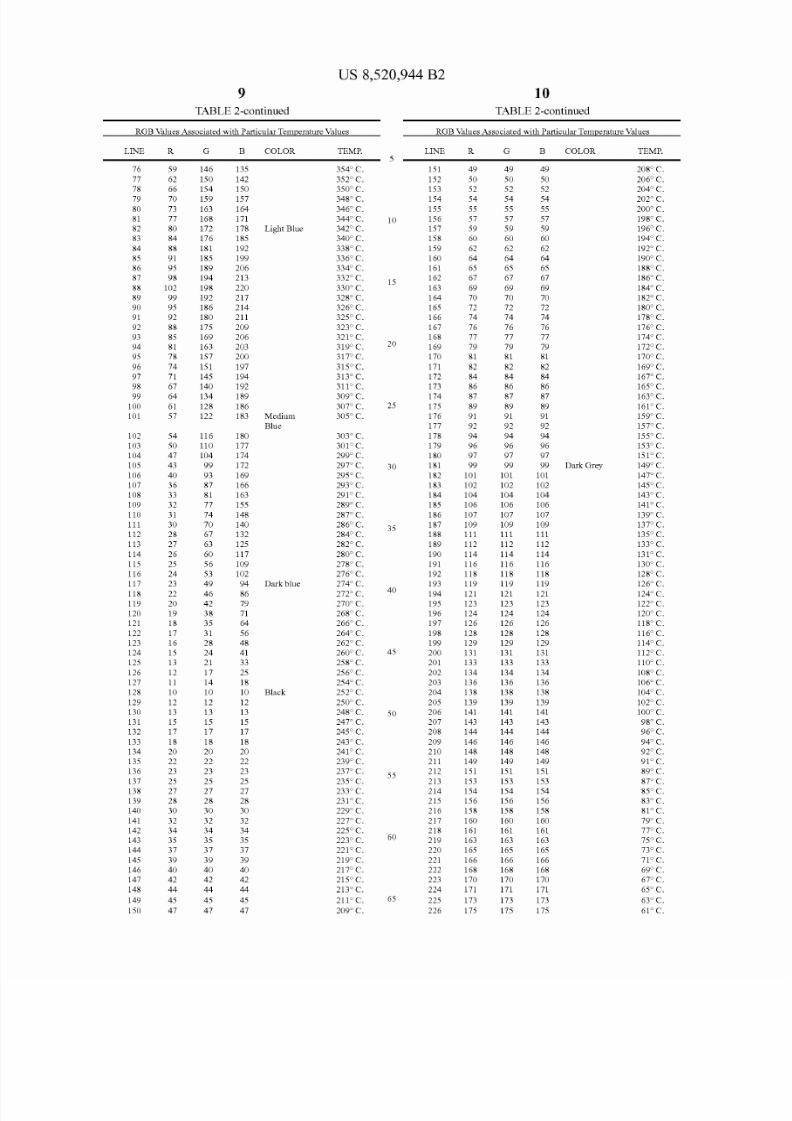
n illustrative example of a generic temperature pixel cor
relation that enables this image transformation is shown in
Table 2 This table shows RGB values that are associated with
particular temperature values generated by any infrared cam-40
era This table refers to RGB codes that are applied to an image
that starts at C. and goes to 500° C. There are256 code lines
in this example for the number 256 is a typical multiple of he
8 bit words and it is common knowledge that every image
pixel of infrared information can be translated in 8 bits per45
color or 256 color shades per pixel. This makes it possible to
represent a visual output with about 16.7 millions of different
color and that makes the 256 color systems very common and
used too in several visible light image data processing files.
In any event the total number of color lines will vary50
according the hardware and software capacity and infrared
camera design. For example older cameras can only manage
120 color lines. Also the number ofcolors is not limited; the
more colors or lines are used the softer the image will be. In
Table 2 the lines are numbered for demonstration purposes55
and every temperature related to each line is identified at the
right column. Then using RGB codes the original infrared
matrix values are translated electronically to colors and pre
sented on the thermovision LCD viewfinder or computer
screen.TABLE2
60
RGB Values Associated w ith Particular Temperature Values
LINE R G COLOR TEMP.
248 248 248 Almost 500° C. 65
White
8
TABLE 2-continued
RGB Values Associated with Particular Temperature Values
LINE
2
4
7
9
10
11
12
13
14
15
16
17
18
19
20
21
2223
24
25
26
27
28
29
30
31
32
33
34
35
36
37
38
39
40
4142
43
4445
46
47
48
49
50
51
52
53
54
55
56
57
58
59
6061
62
63
64
65
66
67
68
69
70
71
72
73
74
75
R248
247
246246
245
244
243
242
242
241
240
239
239
239
238
237
237
236
235
235
234233
233
232
232
231
230
230
229
228
228
227
220
214
207
201
194
188
181
175168
161
155
148
142
135
129
122
115
109
102
96
89
83
76
70
63
60
5653
50
47
43
40
37
33
30
34
37
41
44
48
52
55
G
248
247
246245
244
243
241
240
239
238
237
236
228
218
209
199
190
181
171
162
152143
134
124
115
105
96
87
77
68
58
49
49
50
50
50
51
51
52
5252
53
53
53
54
54
54
55
55
55
56
56
57
57
57
58
58
63
6974
79
84
90
95
100
106
111
115
120
124
128
133
137
141
248
231
214196
179
162
145
128
110
93
76
59
74
72
70
68
COLOR
66 Yellow
64
62
60
5856
55
53
51
Gold
49 Orange
47
45
43
41
39
37
36
36
35
34
34
33 Dark Red
32
3231
30
30
29
28
27
27
26
25
25
24 Brown
23
23
22
21
21
20
26
3238
44
49
55
61
67 Dark Green
73
79
86
93
100
107
114
121
128
TEMP.
498° C.
496° C.
494° C.492° C.
490° C.
488° C.
486° C.
484° C.
482° C.
481° C.
479° C.
477° C.
475° C.
473° C.
471° C.
469° C.
467° C.
465° C.
463° C.
461° C.
459° C.457° C.
455° C.
453° C.
451° C.
449° C.
447° C.
445° C.
443° C.
442° C.
440° C.
438° C.
436° C.
434° C.
432° C.
430° C.
428° C.
426° C.
424° C.
422° C.420° C.
418° C.
416° C.
414°C.
412° C.
410° C.
408° C.
406° C.
404° C.
403° C.
401° C.
399° C.
397° C.
395° C.
393° C.
391° C.
389° C.
387° C.
385° C.383° C.
381° C.
379° C.
377° C.
375° C.
373° C.
371° C.
369° C.
367° C.
365° C.
364° C.
362° C.
360° C.
358° C.
356° C.
8/12/2019 Uspto 8520944 b2 Aug 27 2013 Patent for Scribb
http://slidepdf.com/reader/full/uspto-8520944-b2-aug-27-2013-patent-for-scribb 23/34
US 8 520 944 B2
9 10
TABLE 2-continued TABLE 2-continued
RGB Values Associated with Particular Temperature Values RGB Values Associated with Particular Temperature Values
LINE
76
7879
80
81
82
83
84
85
86
87
88
89
90
91
92
93
94
95
96
9798
99
100
101
102
1 3
104
105
106
107
108
109
110
111
112
113
114
115116
117
118
119
120
121
122
123
124
125
126
127
128
129
130
131
132
133
134135
136
137
138
139
140
141
142
143
144
145
146
147
148
149
150
R59
62
6670
73
80
84
88
91
95
98
102
99
95
92
88
85
81
78
74
7167
64
61
57
54
50
47
43
40
36
33
32
31
30
28
27
26
2524
23
22
20
19
18
17
16
15
13
12
11
10
12
13
15
17
18
2022
23
25
27
28
30
32
34
35
37
39
40
42
44
45
47
G
146
150
154159
163
168
172
176
181
185
189
194
198
192
186
180
175
169
163
157
151
145140
134
128
122
116
110
104
99
93
87
81
74
70
67
63
60
5653
49
46
42
38
35
31
28
24
21
17
14
10
12
13
15
17
18
2022
23
25
27
28
30
32
34
35
37
39
40
42
44
45
47
B135
142
150157
164
171
178
185
192
199
206
213
220
217
214
211
209
206
2 3
200
197
194192
189
186
183
180
177
174
172
169
166
163
155
148
140
132
125
117
109102
COLOR
Light Blue
Medium
Blue
94 Dark blue
86
79
71
64
56
48
41
33
25
18
10
12
13
15
17
18
2022
23
25
27
28
30
32
34
35
37
39
40
42
44
45
47
Black
TEMP
354° C
352° C
350° C348° C
346° C
344° C
342° C
340° C
338° C
336° C
334° C
332° C
330° C
328° C
326° C
325° C
323° C
321° C
319° C
317° C
315° C
313° C311° C
309° C
307° C
305° C
303° C
301° C
299° C
297° C
295° C
293° C
291° C
289° C
287° C
286° C
284° C
282° C
280° C
278° C276° C
274° C
272° C
270° C
268° C
266° C
264° C
262° C
260° C
258° C
256° C
254° C
252° C
250° C
248° C
247° C
245° C
243° C
241° C239° C
237° C
235° C
233° C
231° C
229° C
227° C
225° C
223° C
221° C
219° C
217° C
215° C
213° C
211° C
209° C
10
15
20
25
30
35
40
45
50
55
60
65
LINE
151
152
153154
155
156
157
158
159
160
161
162
163
164
165
166
167
168
169
170
171
172173
174
175
176
177
178
179
180
181
182
183
184
185
186
187
188
189
190
191192
193
194
195
196
197
198
199
200
201
202
2 3
204
205
206
207
208
209
210211
212
213
214
215
216
217
218
219
220
221
222
223
224
225
226
R49
50
5254
55
57
59
6
62
64
65
67
69
70
72
74
76
79
81
82
8486
87
89
91
92
94
96
97
99
101
102
104
106
107
109
111
112
114
116118
119
121
123
124
126
128
129
131
133
134
136
138
139
141
143
144
146
148149
151
153
154
156
158
160
161
163
165
166
168
170
171
173
175
G
49
50
5254
55
57
59
60
62
64
65
67
69
70
72
74
76
79
81
82
8486
87
89
91
92
94
96
97
99
101
102
104
106
107
109
111
112
114
116118
119
121
123
124
126
128
129
131
133
134
136
138
139
141
143
144
146
148149
151
153
154
156
158
160
161
163
165
166
168
170
171
173
175
B49
50
5254
55
57
59
6
62
64
65
67
69
70
72
74
76
79
81
82
8486
87
89
91
92
94
96
97
99
101
102
104
106
107
109
111
112
114
116118
119
121
123
124
126
128
129
131
133
134
136
138
139
141
143
144
146
148149
151
153
154
156
158
160
161
163
165
166
168
170
171
173
175
COLOR
Dark Grey
TEMP
208° C
206° C
204° C202° C
200° C
198° C
196° C
194° C
192° C
190° C
188° C
186° C
184° C
182° C
180° C
178° C
176° C
174° C
172° C
170° C
169° C
167° C165° C
163° C
161° C
159° C
157° C
155° C
153° C
151° C
149° C
147° C
145° C
143° C
141°C
139° C
137° C
135° C
133° C
131° C
130° C128° C
126° C
124° C
122° C
120° C
118° C
116° C
114° C
112° C
110° C
108° C
106° C
104° C
102° C
100° C
98° C
96° C
94° C
92° C91° C
89° C
87° C
85° C
83° C
81° C
79° C
77c C
75° C
73° C
71° C
69° C
67° C
65° C
63° C
61° C
8/12/2019 Uspto 8520944 b2 Aug 27 2013 Patent for Scribb
http://slidepdf.com/reader/full/uspto-8520944-b2-aug-27-2013-patent-for-scribb 24/34
US 8 520 944 B2
11
TABLE 2-continued
RGB Values Associated with Particular Temperature Values
LINE R G B COLOR TEMP.
227 176 176 176 59° C.
228 178 178 178 57° C.
229 180 180 180 55° C.230 181 181 181 53° C.
231 183 183 183 52° C.
232 185 185 185 so C.
233 186 186 186 48° C.
234 188 188 188 46° C.
235 190 190 190 44°C.
236 191 191 191 42° C.
237 193 193 193 40° C.
238 195 195 195 38° C.
239 196 196 196 36° C.
240 198 198 198 34° C.
241 200 200 200 32° C.
242 202 202 202 30° C.
243 203 203 203 28° C.
244 205 205 205 26° C.
245 207 207 207 24° C.
246 208 208 208 22° C.
247 210 210 210 20° C.
248 212 212 212 18° C.249 213 213 213 16° C.
250 215 215 215 14°C.
251 217 217 217 13° C.
252 218 218 218 11° C.
253 220 220 220 o C.
254 220 220 220 7c C.
255 200 200 200 so C.
256 200 200 200 Light Gray 3° C.
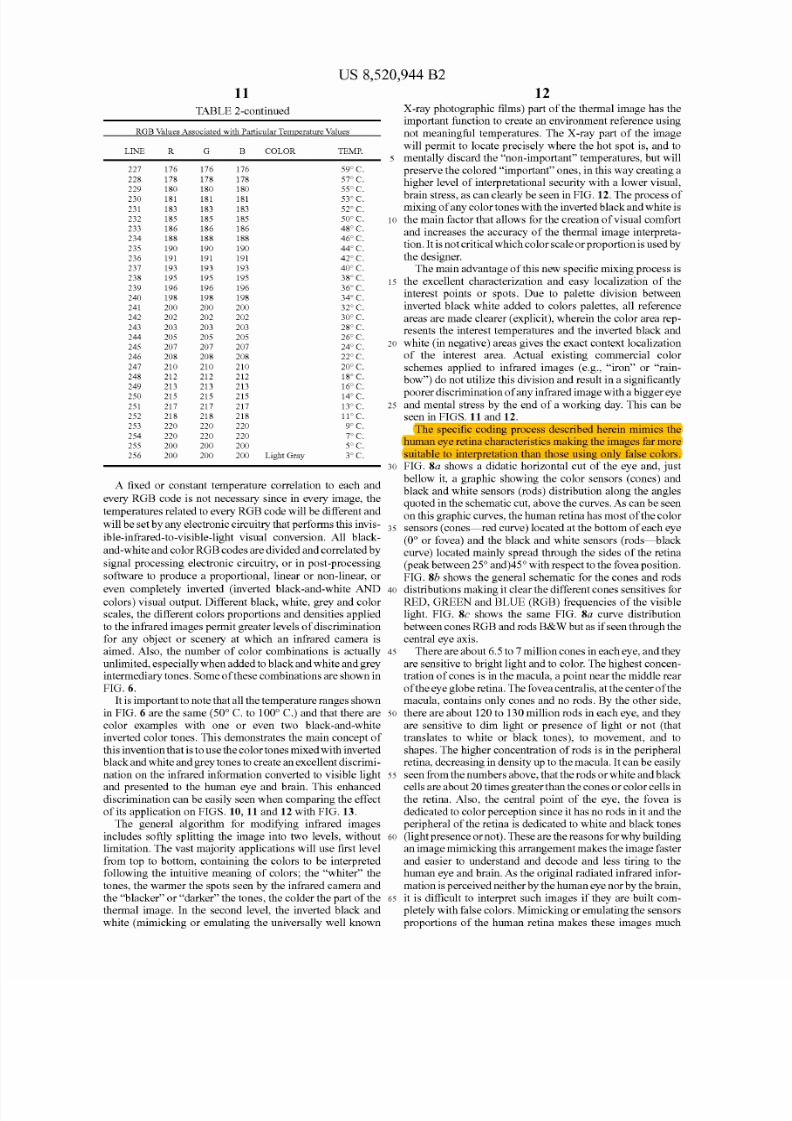
A fixed or constant temperature correlation to each and
every RGB code is not necessary since in every image, the
temperatures related to every RGB code will be different and
will be set by any electronic circuitry that performs this invis-
ible-infrared-to-visible-light visual conversion. All black-
and-white and color RGB codes are divided and correlatedby
signal processing electronic circuitry, or in post-processingsoftware to produce a proportional, linear or non-linear, or
even completely inverted (inverted black-and-white AND
colors) visual output. Different black, white, grey and color
scales, the different colors proportions and densities applied
to the infrared images permit greater levels of discrimination
for any object or scenery at which an infrared camera is
aimed. Also, the number of color combinations is actually
unlimited, especially when added to black and white and grey
intermediary tones. Some of hese combinations are shown in
FIG. 6
t is important to note that all the temperature ranges shown
in FIG. are the same (50° C. to 100° C.) and that there are
color examples with one or even two black-and-white
inverted color tones. This demonstrates the ma in concept of
this invention that is to use the color tones mixed with invertedblack and white and grey tones to create an excellent discrimi-
nation on the infrared information converted to visible light
and presented to the human eye and brain. This enhanced
discrimination can be easily seen when comparing the effect
of its application on FIGS. 10 and 12 with FIG. 13.
The general algorithm for modifYing infrared images
includes softly splitting the image into two levels, without
limitation. The vast majority applications will use first level
from top to bottom, containing the colors to be interpretedfollowing the intuitive meaning of colors; the whiter the
tones, the warmer the spots seen by the infrared camera and
the blacker or darker the tones, the colder the part of the
thermal image. In the second level, the inverted black and
white (mimicking or emulating the universally well known
10
5
20
25
30
35
40
45
50
55
60
65
12X-ray photographic films) part of the thermal image has the
important function to create an environment reference using
not meaningful temperatures. The X-ray part of the image
will permit to locate precisely where the hot spot is, and tomentally discard the non-important temperatures, but will
preserve the colored important ones, in this way creating a
higher level of interpretational security with a lower visual,
brain stress, as can clearly be seen in FIG. 12. The process of
mixing of any color tones with the inverted black and white is
the main factor that allows for the creation of visual comfort
and increases the accuracy of the thermal image interpreta
tion. t is not critical which color scaleor proportion is used by
the designer.
The main advantage of this new specific mixing process is
the excellent characterization and easy localization of the
interest points or spots. Due to palette division between
inverted black white added to colors palettes, all reference
areas are made clearer (explicit), wherein the color area rep
resents the interest temperatures and the inverted black and
white (in negative) areas gives the exact context localization
of the interest area. Actual existing commercial color
schemes applied to infrared images (e.g., iron or rain
bow ) do not utilize this division and result in a significantlypoorer discrimination of any infrared image with a bigger eye
and mental stress by the end of a working day. This can be
seen in FIGS. 11 and 12.
The specific coding process described herein mimics the
human eye retina characteristics making the images far mor e
suitable to interpretation than those using only false colors.
FIG. a shows a didatic horizontal cut of the eye and, just
bellow it, a graphic showing the color sensors (cones) and
black and white sensors (rods) distribution along the angles
quoted in the schematic cut, above the curves. As can be seen
on this graphic curves, the human retina has most of he color
sensors cones-red curve) located at the bottom of each eye
(0° or fovea) and the black and white sensors rods-black
curve) located mainly spread through the sides of the retina
(peak between 25° and)45° with respect to the fovea position.FIG. b shows the general schematic for the cones and rods
distributions making it clear the different cones sensitives for
RED, GREEN and BLUE (RGB) frequencies of the visible
light. FIG. c shows the same FIG. a curve distribution
between cones RGB and rods B&W but as if seen through the
central eye axis.
There are about 6.5 to 7 million cones in each eye, and they
are sensitive to bright light and to color. The highest concen
tration of cones is in the macula, a point near the middle rear
of he eye globe retina. The fovea centralis, at the cente r of he
macula, contains only cones and no rods. By the other side,
there are about 120 to 130 million rods in each eye, and they
are sensitive to dim light or presence of light or not (that
translates to white or black tones), to movement, and to
shapes. The higher concentration of rods is in the peripheralretina, decreasing in density up to the macula. t can be easily
seen from the numbers above, that the rods or white and black
cells are about 20 times greater than the cones or color cells in
the retina. Also, the central point of the eye, the fovea is
dedicated to color perception since it has no rods in it and the
peripheral of the retina is dedicated to white and black tones
(light presence or not). These are the reasons for why building
an image mimicking this arrangement makes the image faster
and easier to understand and decode and less tiring to the
human eye and brain. As the original radiated infrared infor
mation is perceived neither by the human eye nor by the brain,
it is difficult to interpret such images if they are built com
pletely with false colors. Mimicking or emulating the sensors
proportions of the human retina makes these images much
8/12/2019 Uspto 8520944 b2 Aug 27 2013 Patent for Scribb
http://slidepdf.com/reader/full/uspto-8520944-b2-aug-27-2013-patent-for-scribb 25/34
US 8 520 944 B2
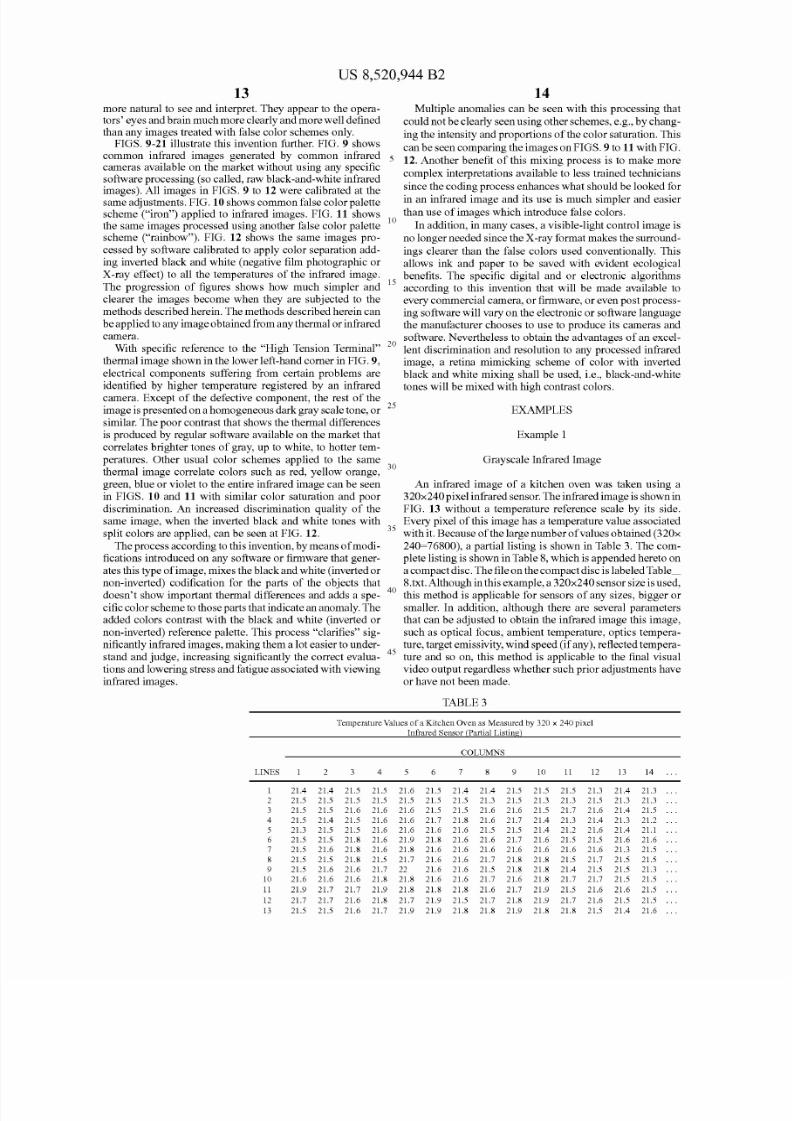
13more natural to see and interpret. They appear to the operators' eyes and brain much more clearly and more well definedthan any images treated with false color schemes only.
14
FIGS. 9-21 illustrate this invention further. FIG. 9 shows
common infrared images generated by common infraredcameras available on the market without us ing any specificsoftware processing (so called, raw black-and-white infrared
images). All images in FIGS. 9 to 12 were calibrated at thesame adjustments. FIG.10 shows common false color palettescheme ( iron ) applied to infrared images. FIG. 11 showsthe same images processed using another false color palettescheme ( rainbow ). FIG. 12 shows the same images pro
cessed by software calibrated to apply color separation add
ing inverted black and white (negative film photographic or
X-ray effect) to all the temperatures of the infrared image.
The progression of figures shows how much simpler and
clearer the images become when they are subjected to the
methods described herein. The methods described herein can
Multiple anomalies can be seen with this processing that
could not be clearly seen using other schemes, e.g., by chang
ing the intensity and proportions of the color saturation. This
can be seen comparing the images on FIGS. 9 to 11 with FIG.
12. Another benefit of this mixing process is to make more
complex interpretations available to less trained technicians
since the coding process enhances what should be looked forin an infrared image and its use is much simpler and easier
than use of images which introduce false colors.10
In addition, in many cases, a visible-light control image is
no longer needed since the X -ray format makes the surround
ings clearer than the false colors used conventionally. This
allows ink and paper to be saved with evident ecological
be applied to any image obtained from any thermal or infrared
camera.
15benefits. The specific digital and or electronic algorithms
according to this invention that will be made available to
every commercial camera, or firmware, or even post process
ing software will vary on the electronic or software language
the manufacturer chooses to use to produce its cameras and
20software. Nevertheless to obtain the advantages of an excel
lent discrimination and resolution to any processed infrared
image, a retina mimicking scheme of color with inverted
black and white mixing shall be used, i.e., black-and-whitetones will be mixed with h igh contrast colors.
With specific reference to the High Tension Terminal
thermal image shown in the lower left-hand comer in FIG. 9
electrical components suffering from certain problems areidentified by higher temperature registered by an infrared
camera. Except of the defective component, the rest of the
image is presented on a homogeneous dark gray scale tone, or25
similar. The poor contrast that shows the thermal differences
is produced by regular software available on the market that
correlates brigh ter tones of gray, up to white, to hotter tem
peratures. Other usual color schemes applied to the same
thermal image correlate colors such as red, yellow orange,30
green, blue or violet to the entire infrared image can be seen
in FIGS. 10 nd 11 with similar color saturation and poor
discrimination. An increased discrimination quality of the
same image, when the inverted black and white tones with
split colors are applied, can be seen at FIG. 12.35
The process according to this invention, by means ofmodi
fications introduced on any software or firmware that gener
ates this type of mage, mixes the black and white (inverted or
non-inverted) codification for the parts of the objects that
doesn 't show important thermal differences and adds a spe-40
cific color scheme to those parts that indicate an anomaly. The
added colors contrast with the black and white (inverted or
non-inverted) reference palette. This process clarifies sig
nificantly infrared images, making them a lot easier to under
stand and judge, increasing significantly the correct evalua-45
tions and lowering stress and fatigue associated with viewing
infrared images.
EXAMPLES
Example 1
Grayscale Infrared Image
An infrared image of a kitchen oven was taken using a
3 20x240 pixel infrared sensor. The infrared image is shown in
FIG. 3 without a temperature reference scale by its side.
Every pixel of this image has a temperature value associated
with it. Because of he large number of values obtained (320x
240=76800), a partial listing is shown in Table 3. The com
plete listing is shown in Table 8 which is appended hereto on
a compact disc. The file on the compact disc is labeledTable_
8.txt. Although in this example, a 320x240 sensor size is used,
this method is applicable for sensors of any sizes, bigger or
smaller. In addition, although there are several parameters
that can be adjusted to obtain the infrared image this image,
such as optical focus, ambient temperature, optics tempera
ture, target emissivity, wind speed ( if any), reflected tempera
ture and so on, this method is applicable to the final visual
video output regardless whether such prior adjustments have
or have not been made.
TABLE
Temperature Values of a Kitchen Oven as Measured by 320 x 240 pixelInfrared Sensor (Partial Listing)
COLUMNS
LINES 2 4 7 9 10 11 12 13 14
21.4 21.4 21.5 21.5 21.6 21.5 21.4 21.4 21.5 21.5 21.5 21.3 21.4 21.3
2 21.5 21.5 21.5 21.5 21.5 21.5 21.5 21.3 21.5 21.3 21.3 21.5 21.3 21.3
21.5 21.5 21.6 21.6 21.6 21.5 21.5 21.6 21.6 21.5 21.7 21.6 21.4 21.5
4 21.5 21.4 21.5 21.6 21.6 21.7 21.8 21.6 21.7 21.4 21.3 21.4 21.3 21.2
21.3 21.5 21.5 21.6 21.6 21.6 21.6 21.5 21.5 21.4 21.2 21.6 21.4 21.1
21.5 21.5 21.8 21.6 21.9 21.8 21.6 21.6 21.7 21.6 21.5 21.5 21.6 21.67 21.5 21.6 21.8 21.6 21.8 21.6 21.6 21.6 21.6 21.6 21.6 21.6 21.3 21.5
21.5 21.5 21.8 21.5 21.7 21.6 21.6 21.7 21.8 21.8 21.5 21.7 21.5 21.5
9 21.5 21.6 21.6 21.7 22 21.6 21.6 21.5 21.8 21.8 21.4 21.5 21.5 21.3
10 21.6 21.6 21.6 21.8 21.8 21.6 21.6 21.7 21.6 21.8 21.7 21.7 21.5 21.5
11 21.9 21.7 21.7 21.9 21.8 21.8 21.8 21.6 21.7 21.9 21.5 21.6 21.6 21.5
12 21.7 21.7 21.6 21.8 21.7 21.9 21.5 21.7 21.8 21.9 21.7 21.6 21.5 21.5
13 21.5 21.5 21.6 21.7 21.9 21.9 21.8 21.8 21.9 21.8 21.8 21.5 21.4 21.6
8/12/2019 Uspto 8520944 b2 Aug 27 2013 Patent for Scribb
http://slidepdf.com/reader/full/uspto-8520944-b2-aug-27-2013-patent-for-scribb 26/34
LINES 2
US 8 520 944 B2
15
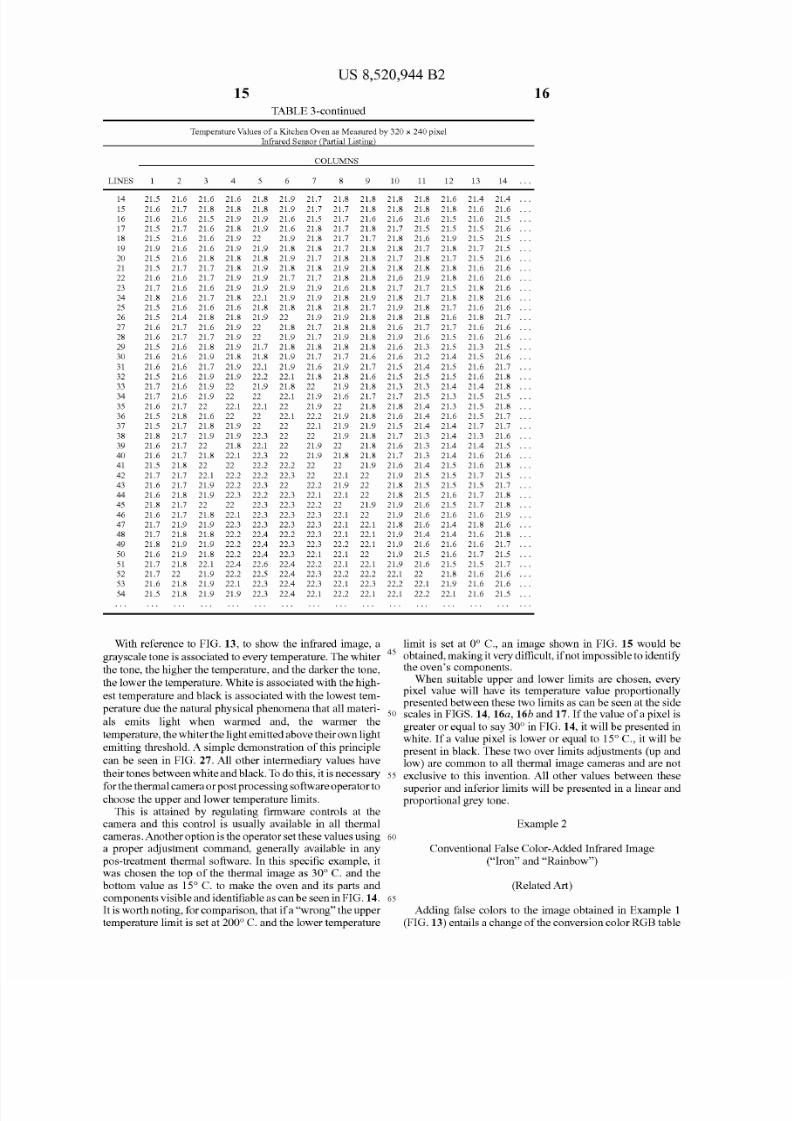
TABLE 3-continued
Temperature Values of a Kitchen Oven as Measured by 320 x 240 pixel
Infrared Sensor (Partial Listing)
OLUMNS
4 7 9 10 12 3 14
14 21.5 21.6 21.6 21.6 21.8 21.9 21.7 21.8 21.8 21.8 21.8 21.6 21.4 21.4
5 21.6 21.7 21.8 21.8 21.8 21.9 21.7 21.7 21.8 21.8 21.8 21.8 21.6 21.6
6 21.6 21.6 21.5 21.9 21.9 21.6 21.5 21.7 21.6 21.6 21.6 21.5 21.6 21.5
7 21.5 21.7 21.6 21.8 21.9 21.6 21.8 21.7 21.8 21.7 21.5 21.5 21.5 21.6
8 21.5 21.6 21.6 21.9 22 21.9 21.8 21.7 21.7 21.8 21.6 21.9 21.5 21.5
9 21.9 21.6 21.6 21.9 21.9 21.8 21.8 21.7 21.8 21.8 21.7 21.8 21.7 21.5
20 21.5 21.6 21.8 21.8 21.8 21.9 21.7 21.8 21.8 21.7 21.8 21.7 21.5 21.6
2 21.5 21.7 21.7 21.8 21.9 21.8 21.8 21.9 21.8 21.8 21.8 21.8 21.6 21.6
22 21.6 21.6 21.7 21.9 21.9 21.7 21.7 21.8 21.8 21.6 21.9 21.8 21.6 21.6
23 21.7 21.6 21.6 21.9 21.9 21.9 21.9 21.6 21.8 21.7 21.7 21.5 21.8 21.6
24 21.8 21.6 21.7 21.8 22.1 21.9 21.9 21.8 21.9 21.8 21.7 21.8 21.8 21.6
25 21.5 21.6 21.6 21.6 21.8 21.8 21.8 21.8 21.7 21.9 21.8 21.7 21.6 21.6
26 21.5 21.4 21.8 21.8 21.9 22 21.9 21.9 21.8 21.8 21.8 21.6 21.8 21.7
7 21.6 21.7 21.6 21.9 22 21.8 21.7 21.8 21.8 21.6 21.7 21.7 21.6 21.6
28 21.6 21.7 21.7 21.9 22 21.9 21.7 21.9 21.8 21.9 21.6 21.5 21.6 21.6
29 21.5 21.6 21.8 21.9 21.7 21.8 21.8 21.8 21.8 21.6 21.3 21.5 21.3 21.5
30 21.6 21.6 21.9 21.8 21.8 21.9 21.7 21.7 21.6 21.6 21.2 21.4 21.5 21.6
3 21.6 21.6 21.7 21.9 22.1 21.9 21.6 21.9 21.7 21.5 21.4 21.5 21.6 21.7
32 21.5 21.6 21.9 21.9 22.2 22.1 21.8 21.8 21.6 21.5 21.5 21.5 21.6 21.833 21.7 21.6 21.9 22 21.9 21.8 22 21.9 21.8 21.3 21.3 21.4 21.4 21.8
34 21.7 21.6 21.9 22 22 22.1 21.9 21.6 21.7 21.7 21.5 21.3 21.5 21.5
35 21.6 21.7 22 22.1 22.1 22 21.9 22 21.8 21.8 21.4 21.3 21.5 21.8
36 21.5 21.8 21.6 22 22 22.1 22.2 21.9 21.8 21.6 21.4 21.6 21.5 21.7
37 21.5 21.7 21.8 21.9 22 22 22.1 21.9 21.9 21.5 21.4 21.4 21.7 21.7
38 21.8 21.7 21.9 21.9 22.3 22 22 21.9 21.8 21.7 21.3 21.4 21.3 21.6
39 21.6 21.7 22 21.8 22.1 22 21.9 22 21.8 21.6 21.3 21.4 21.4 21.5
40 21.6 21.7 21.8 22.1 22.3 22 21.9 21.8 21.8 21.7 21.3 21.4 21.6 21.6
4 21.5 21.8 22 22 22.2 22.2 22 22 21.9 21.6 21.4 21.5 21.6 21.8
42 21.7 21.7 22.1 22.2 22.2 22.3 22 22.1 22 21.9 21.5 21.5 21.7 21.5
43 21.6 21.7 21.9 22.2 22.3 22 22.2 21.9 22 21.8 21.5 21.5 21.5 21.7
44 21.6 21.8 21.9 22.3 22.2 22.3 22.1 22.1 22 21.8 21.5 21.6 21.7 21.8
45 21.8 21.7 22 22 22.3 22.3 22.2 22 21.9 21.9 21.6 21.5 21.7 21.8
46 21.6 21.7 21.8 22.1 22.3 22.3 22.3 22.1 22 21.9 21.6 21.6 21.6 21.9
47 21.7 21.9 21.9 22.3 22.3 22.3 22.3 22.1 22.1 21.8 21.6 21.4 21.8 21.6
48 21.7 21.8 21.8 22.2 22.4 22.2 22.3 22.1 22.1 21.9 21.4 21.4 21.6 21.8
49 21.8 21.9 21.9 22.2 22.4 22.3 22.3 22.2 22.1 21.9 21.6 21.6 21.6 21.7
50 21.6 21.9 21.8 22.2 22.4 22.3 22.1 22.1 22 21.9 21.5 21.6 21.7 21.5
5 21.7 21.8 22.1 22.4 22.6 22.4 22.2 22.1 22.1 21.9 21.6 21.5 21.5 21.752 21.7 22 21.9 22.2 22.5 22.4 22.3 22.2 22.2 22.1 22 21.8 21.6 21.6
53 21.6 21.8 21.9 22.1 22.3 22.4 22.3 22.1 22.3 22.2 22.1 21.9 21.6 21.6
54 21.5 21.8 21.9 21.9 22.3 22.4 22.1 22.2 22.1 22.1 22.2 22.1 21.6 21.5
16
With reference to FIG. 13, to show the infrared image, a
grayscale tone is associated to every temperature. The whiter
the tone, the higher the temperature, and the darker the tone,
the lower the temperature. White is associated with the high-
limit is set at C., an image shown in FIG. 15 would be45 obtained, making it very difficult, if not impossible to identifY
the oven's components.
When suitable upper and lower limits are chosen, everypixel value will have its temperature value proportionallypresented between these two limits as can be seen at the side
st temperature and black is associated with the lowest tem
perature due the natural physical phenomena that all materi
als emits light when warmed and, the warmer the
temperature, the whit er the light emitted above their own light
emitting threshold. A simple demonstration of this principle
can be seen in FIG. 27. All other intermediary values have
their tones between white and black. To do this, it is necessary
for the thermal camera or postproc essing software operator to
choose the upper and lower temperature limits.
50 scales in FIGS. 14 16a 16b nd 17. If the value of a pixel is
greater or equal to say 30° in FIG. 14 it will be presented in
white. f a value pixel is lower or equal to 15° C., it will be
present in black. These two over limits adjustments (up andlow) are common to all thermal image cameras and are not
55 exclusive to this invention. All other values between these
This is attained by regulating firmware controls at the
camera and this control is usually available in all thermal
cameras. Another option is the operator set these values using 60
a proper adjustment command, generally available in any
pas-treatment thermal software. In this specific example, it
was chosen the top of the thermal image as 30° C. and the
bottom value as 15° C. to make the oven and its parts and
components visible and identifiable as can be seen in FIG. 14. 65
It is worth noting, for comparison, that if a wrong the upper
temperature limit is set at 200° C. and the lower temperature
superior and inferior limits will be presented in a linear and
proportional grey tone.
Example 2
Conventional False Color-Added Infrared Image
( Iron and Rainbow )
(Related Art)
Adding false colors to the image obtained in Example 1
(FIG. 13 entails a change of the conversion color RGB table
8/12/2019 Uspto 8520944 b2 Aug 27 2013 Patent for Scribb
http://slidepdf.com/reader/full/uspto-8520944-b2-aug-27-2013-patent-for-scribb 27/34
US 8 520 944 B2
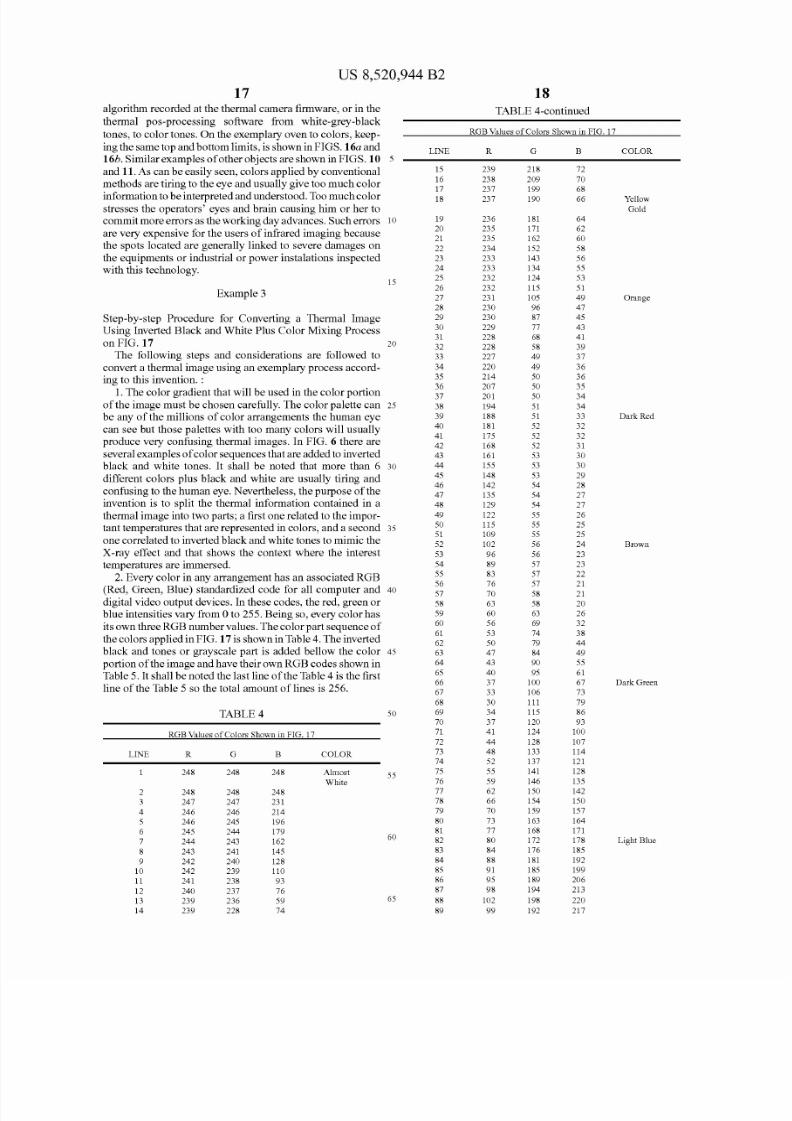
17algorithm recorded at the thermal camera firmware, or in the
thermal pas-processing software from white-grey-black
tones, to color tones. On the exemplary oven to colors, keep
ingthe same top and bottom limits, is showninFIGS 16a and
16b. Similar examples of other objects are shown in FIGS. 1
and 11 As can be easily seen, colors applied by conventional
methods are tiring to the eye and usually give too much colorinformation to be interpreted and understood. Too much color
stresses the operators eyes and brain causing him or her tocommit more errors as the working day advances. Such errors 10
are very expensive for the users of infrared imaging because
the spots located are generally linked to severe damages on
the equipments or industrial or power instalations inspected
with this technology.
Example 3
Step-by-step Procedure for Converting a Thermal Image
Using Inverted Black and White Plus Co lor Mixing Process
15
onFIG 17 20
The following steps and considerations are followed to
convert a thermal image using an exemplary process accord
ing to this invention. :1 The color gradient that will be used in the color portion
of the image must be chosen carefully. The color palette can 25
be any of the millions of color arrangements the human eye
can see but those palettes with too many colors will usually
produce very confusing thermal images. In FIG. 6 there are
several examples of color sequences that are added to inverted
black and white tones. t shall be noted that more than 6 30
different colors plus black and white are usually tiring and
confusing to the human eye. Nevertheless, the purpose of the
invention is to split the thermal information contained in a
thermal image into two parts; a first one related to the impor
tant temperatures that are represented in colors, and a second 35
one correlated to inverted black and white tones to mimic the
X-ray effect and that shows the context where the interest
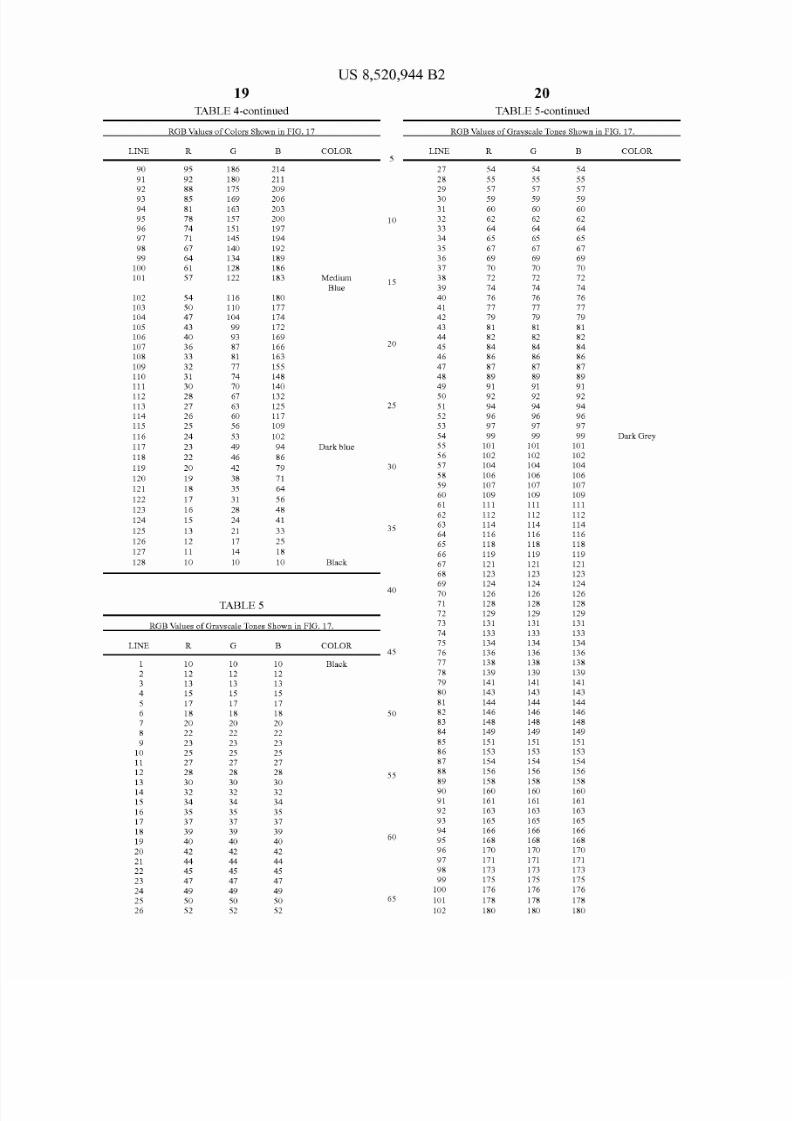
temperatures are immersed.2 Every color in any arrangement has an associated RGB
(Red, Green, Blue) standardized code for all computer and 40
digital video output devices. In these codes, the red, green or
blue intensit ies vary from 0 to 255. Being so, every color has
its own three RGB number values. The color part sequence of
the colors applied in FIG. 17 is shown in Table 4. The inverted
black and tones or grayscale part is added bellow the color 45
portion of he image and have their own RGB codes shown in
Table 5 t shall be noted the last line of he Table 4 is the first
line of the Table 5 so the total amount oflines is 256.
LINE
2
4
7
9
10
11
12
13
14
TABLE4
RGB Values of Colors Shown in FIG. 17
R248
248
247
246
246
245
244
243
242
242
241
240
239
239
G
248
248
247
246
245
244
243
241
240
239
238
237
236
228
B248
248
231
214
196
179
162
145
128
110
93
76
59
74
COLOR
Almost
White
50
55
60
65
LINE
15
16
1718
19
20
21
22
23
24
25
26
728
29
30
31
32
33
34
3536
37
38
39
40
41
42
43
44
45
46
47
48
49
50
51
52
53
5455
56
57
58
59
60
61
62
63
64
65
66
67
68
69
70
71
72
73
74
75
76
77
78
79
80
81
82
83
84
85
86
87
88
89
18
TABLE 4-continued
RGB Values of Colors Shown in FIG. 17
R239
238
237237
236
235
235
234
233
233
232
232
231
230
230
229
228
228
7220
214207
201
194
188
181
175
168
161
155
148
142
135
129
122
115
109
102
96
8983
76
70
63
60
56
53
50
47
43
40
37
33
30
34
37
41
44
4852
55
59
62
66
70
73
77
80
84
88
91
95
98
102
99
G
218
209
199190
181
171
162
152
143
134
124
115
105
96
87
77
68
58
49
49
5050
50
51
51
52
52
52
53
53
53
54
54
54
55
55
55
56
56
5757
57
58
58
63
69
74
79
84
90
95
100
106
111
115
120
124
128
133137
141
146
150
154
159
163
168
172
176
181
185
189
194
198
192
B72
70
6866
64
62
60
58
56
55
53
51
49
47
45
43
41
39
37
36
3635
34
34
33
32
32
31
30
30
29
28
77
26
25
25
24
23
2322
21
21
20
26
32
38
44
49
55
61
67
73
79
86
93
100
107
114121
128
135
142
150
157
164
171
178
185
192
199
206
213
220
217
COLOR
Yellow
Gold
Orange
Dark Red
Brown
Dark Green
Light Blue
8/12/2019 Uspto 8520944 b2 Aug 27 2013 Patent for Scribb
http://slidepdf.com/reader/full/uspto-8520944-b2-aug-27-2013-patent-for-scribb 28/34
LINE
90
91
9293
94
95
96
97
98
99
100
101
102
103
104
105
106
107
108
109
110111
112
113
114
115
116
117
118
119
120
121
122
123
124
125
126
127
128
LINE
2
4
7
9
1011
12
13
14
15
16
17
18
19
20
21
22
23
24
25
26
19
TABLE 4-continued
RGB Values of Colors Shown in FIG 17
R95
92
8885
81
78
74
71
67
64
61
57
54
50
47
43
4
36
33
32
3130
28
27
26
25
24
23
22
20
19
18
17
16
15
13
12
11
10
G
186
180
175169
163
157
151
145
140
134
128
122
116
110
104
99
93
87
81
77
7470
67
63
6
56
53
49
46
42
38
35
31
28
24
21
17
14
10
TABLES
214
211
209206
203
200
197
194
192
189
186
183
180
177
174
172
169
166
163
155
148140
132
125
117
109
102
94
86
79
71
64
56
48
41
33
25
18
10
US 8 520 944 B2
COLOR
Medium
Blue
Dark blue
Black
LINE
10
15
20
25
30
35
4
RGB Values of Grayscal e Tones Shown in FIG 17
27
28
2930
31
32
33
34
35
36
37
38
39
4
41
42
43
44
45
46
47
4849
50
51
52
53
54
55
56
57
58
59
60
61
62
63
64
65
66
6768
69
70
71
72
73
74
75
76
77
78
79
80
81
82
83
84
85
8687
88
89
90
91
92
93
94
95
96
97
98
99
100
R10
12
13
15
17
18
20
22
23
2527
28
30
32
34
35
37
39
4
42
44
45
47
49
50
52
G
10
12
13
15
17
18
20
22
23
2527
28
30
32
34
35
37
39
40
42
44
45
47
49
50
52
10
12
13
15
17
18
20
22
23
2527
28
30
32
34
35
37
39
4
42
4445
47
49
50
52
COLOR
Black
45
50
55
60
65 101
102
20
TABLE 5-continued
RGB Values of Grayscale Tones Shown in FIG 17
R54
55
5759
60
62
64
65
67
69
70
72
74
76
77
79
81
82
84
86
87
8991
92
94
96
97
99
101
102
104
106
107
109
111
112
114
116
118
119
121123
124
126
128
129
131
133
134
136
138
139
141
143
144
146
148
149
151
153154
156
158
160
161
163
165
166
168
170
171
173
175
176
178
180
G
54
55
5759
6
62
64
65
67
69
70
72
74
76
77
79
81
82
84
86
87
8991
92
94
96
97
99
101
102
104
106
107
109
111
112
114
116
118
119
121123
124
126
128
129
131
133
134
136
138
139
141
143
144
146
148
149
151
153154
156
158
160
161
163
165
166
168
170
171
173
175
176
178
180
54
55
5759
60
62
64
65
67
69
70
72
74
76
77
79
81
82
84
86
87
8991
92
94
96
97
99
101
102
104
106
107
109
111
112
114
116
118
119
121123
124
126
128
129
131
133
134
136
138
139
141
143
144
146
148
149
151
153154
156
158
160
161
163
165
166
168
170
171
173
175
176
178
180
COLOR
Dark Grey
8/12/2019 Uspto 8520944 b2 Aug 27 2013 Patent for Scribb
http://slidepdf.com/reader/full/uspto-8520944-b2-aug-27-2013-patent-for-scribb 29/34
US 8 520 944 B2
2 22TABLE 5-continued
RGB Values of Grayscale Tones Shown in FIG. 17.
LINE R G COLOR
103
104
105106
107
108
109
110
111
112
113
114
115
116
117
118
119
120
121
122
123
124125
126
127
128
129
181
183
185186
188
190
191
193
195
196
198
200
202
203
205
207
208
210
212
213
215
217218
220
220
200
200
181
183
185186
188
190
191
193
195
196
198
200
202
203
205
207
208
210
212
213
215
217218
220
220
200
200
181
183
185186
188
190
191
193
195
196
198
200
202
203
205
207
208
210
212
213
215
217218
220
220
200
200
15° will be divided by the total of 256 colors available in this
color arrangement. This will result in 0.0586 degrees per tone
(15° C./256 tones=0.058594o C. per tone). Since 21.4 o C. is
near the lower limit of 15° than from the up limit, let's start
from the bottom temperature of 15° C. in order to obtain the
value of21.4° C. The difference is then 6.4° C. or 109 tone
lines from bottom to top (6.4° C./0.058594° C./tone=109.22tones). Counting the 109 lines from bottom to top in Table 6,
the correspondent color will be the RGB code of 103 10310
103 . This means that the pixel will have the color of FIG. 18
and this can be seen at the left top comer of he FIG. 19 since
the very first pixel at the colunm 1 and line 1 of this thermal
image has this very color.
15
20
25
Light Gray
The grayscale tones are generated the same way the colors
are, choosing almost black color or near (R=10, G=10, 30
B=10 Line 1 in Table 5) to be the next value to be considered
bellow the last color (R=G=B= Line 127 in Table 4, coming
up to down) and the b righter tone, usually a clear gray tone
(R=200, G=200, B=200 Line 129 in Table 5 as being the
last tone on the image. Having chosen this, the intermediary35
tones are simply divided by the exceeding number oflines, to
sum the total amount of desired tons (100, 120, 256, etc)
suitable for the physical characteristics of the camera hard
ware. The final result is a smooth mixing between inverted40
black and white and colors producing images like the ones
presented at FIG. 17.
As a starting point, it is of importance to always correlate
the inverted black and white portion to the lower temperatures
and the color tones to the higher temperatures to produce the 45
optimum result. As can be seen in FIG. 6 there are several
different proportions on colors versus inverted black and
white tones, causing different percent distribution but the
general effect is always kept. But all of hem follow the same
mixing principle. 50
3. Since the upper and lower temperature limits of the
image are set, the total number ofcolors (in this example 256)
is proportionally distributed between the two extreme values.4. The result of his division will then be electronically and
proportionally and sequentially correlated to every one of he 55
value pixels forming the final image. The pixels that have
values higher that the upper temperature limit will be corre
lated to the first (top) line of the final color codes table. The
pixels that have values lower that the lower temperature limit
will be correlated to the last (bottom) line of the final color 60
codes table. The intermediary values will be correlated cor
respondently to the intermediary values of the table.
Using the oven thermal image as an example, the tempera
ture values of which are shown in Table 3, the first pixel
(colunm 1, line 1) will have a value of 21.4o C. Because the 65
chosen span between the upper temperature limit (30° C.) and
the lower temperatu re limit (15° C.) is 15° C., the total span of
TABLE6
RGB Values of Colors and Grayscale Tones Shown in FIG. 17
LINE
UP
2
4
7
9
10
11
12
13
14
15
16
17
18
19
20
2122
23
24
25
26
27
28
29
30
31
32
33
34
35
36
37
38
39
4041
42
43
44
45
46
47
48
49
50
51
52
53
54
55
56
R248
248246
245
243
242
240
238
239
237
236
235
233
232
231
230
228
227
214
201
188175
161
148
135
122
109
96
83
70
56
50
43
37
30
37
4452
59
6673
80
88
95
102
95
88
81
74
67
61
54
47
40
33
31
G
248
248246
244
241
239
237
235
218
199
181
162
143
124
105
87
68
49
50
50
5152
53
53
54
55
55
56
57
58
69
79
90
100
111
120
128
137
146
154163
172
181
189
198
186
175
163
151
140
128
116
104
93
81
74
B COLOR
248 Almost
248214
179
145
110
White
76 Yellow
42
72
68
64
60
56
53
49
45
41
37 Almost Red
36
34
3332
30
29
27
26
25 Orange
23
22
21
32
4455
67
79
93
107
121
135
149164
178
192
206
220
214
209
203
197
192
186
180
174
169
163
148
LINE
DOWN TEMP
256
255254
253
252
251
250
249
248
247
246
245
244
243
242
241
240
239
238
237
236235
234
233
232
231
230
229
228
227
226
225
224
223
222
221
220
219
218
217216
215
214
213
212
211
210
209
208
207
206
205
204
203
202
201
30.0° c
29.9° c29.9° c
29.8° c
29.8° c
29.7° c
29.6° c
29.6° c
29.5° c
29.5° c
29.4° c
29.4° c
29.3° c
29.2° c
29.2° c
29.1° c
29.1° c
29.0° c
28.9° c
28.9° c
28.8° c28.8° c
28.7° c
28.7° c
28.6° c
28.5° c
28.5° c
28.4° c
28.4° c
28.3° c
28.2° c
28.2° c
28.1° c
28.1° c
28.0° c
27.90 c
27.90 c
27.8° c
27.8° c
27.7°c
27.7° c
27.6° c
27.5° c
27.5° c
27.40 c
27.40 c
27.30 c
27.2° c
27.2° c
27.1° c
27.1° c
27.0° c
27.0° c
26.9° c
26.8° c
26.8° c
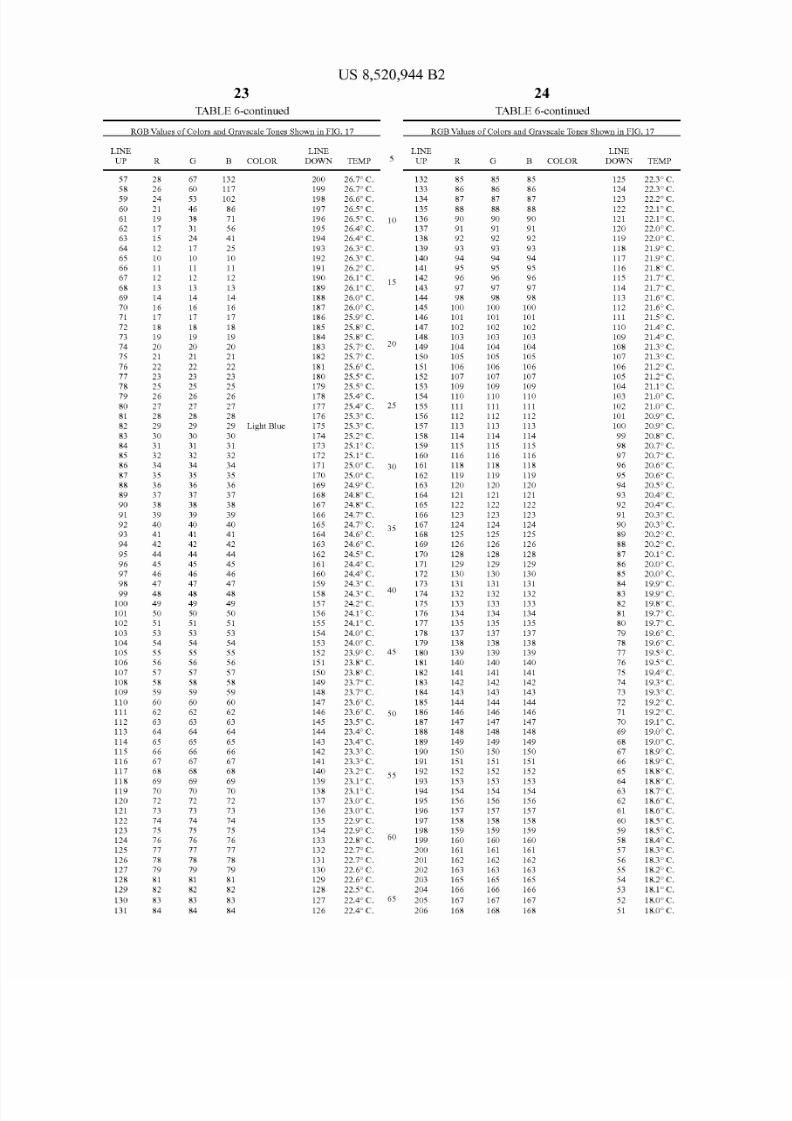
8/12/2019 Uspto 8520944 b2 Aug 27 2013 Patent for Scribb
http://slidepdf.com/reader/full/uspto-8520944-b2-aug-27-2013-patent-for-scribb 30/34
US 8 520 944 B2
23
TABLE 6-continued
RGB Values of Colors and Grayscale Tones Shown in FIG 17
LINE
UP
57
5859
60
61
62
63
64
65
66
67
68
69
70
71
72
73
74
75
76
7778
79
80
81
82
83
84
85
86
87
88
89
90
91
92
93
94
95
9697
98
99
100
101
102
103
104
105
106
107
108
109
110
111
112
113
114
115116
117
118
119
120
121
122
123
124
125
126
127
128
129
130
131
28
2624
21
19
17
15
12
10
11
12
13
14
16
17
18
19
20
21
22
2325
26
27
28
29
30
31
32
34
35
36
37
38
39
40
41
42
44
4546
47
48
49
50
51
53
54
55
56
57
58
59
60
62
63
64
65
6667
68
69
70
72
73
74
75
76
77
78
79
81
82
83
84
G
67
60
53
46
38
31
24
17
10
11
12
13
14
16
17
18
19
20
21
22
2325
26
27
28
29
30
31
32
34
35
36
37
38
39
40
41
42
44
4546
47
48
49
50
51
53
54
55
56
57
58
59
60
62
63
64
65
66
67
68
69
70
72
73
74
75
76
77
78
79
81
82
83
84
B COLOR
132
117102
86
71
56
41
25
10
11
12
13
14
16
17
18
19
20
21
22
2325
26
27
28
29 Light Blue
30
31
32
34
35
36
37
38
39
40
41
42
44
4546
47
48
49
50
51
53
54
55
56
57
58
59
60
62
63
64
65
6667
68
69
70
72
73
74
75
76
77
78
79
81
82
83
84
LINE
DOWN TEMP
200
199198
197
196
195
194
193
192
191
190
189
188
187
186
185
184
183
182
181
180179
178
177
176
175
174
173
172
171
170
169
168
167
166
165
164
163
162
161160
159
158
157
156
155
154
153
152
151
150
149
148
147
146
145
144
143
142141
140
139
138
137
136
135
134
133
132
131
130
129
128
127
126
26 7° C
26 7° C26 6° C
26 SC C
26 SC C 10
26 4° C
26 4° C
26 3° C
26 3° C
26 2° C
26 1° C
26 1° C
26 0° C
26 0° C
25 9° C
25 8° C
25 8° C
25 7° C
25 7° C
25 6° C
25 SC C25 SC C
25 4° C
15
20
25 4° C 25
25 3° C
25 3° C
25 2° C
25 1° C
25 1° C
25 0° C 30
25 0° C
24 9° C
24 8° C
24 8° C
24 7° C
24 7° C
24 6° C
24 6° C
24 SC C
24 4° C24 4° C
24 3° C
24 3° C
24 2° C
24 1° C
24 1° C
24 0° C
24 0° C
35
40
23 9° C 45
23 8° C
23 8° C
23 7° C
23 7° C
23 6° C
23 6° C 50
23 SC C
23 4° C
23 4° C
23 3° C23 3° C
23 2° C
23 1° C
23 1° C
23 0° C
23 0° C
22 9° C
22 9° C
22 8° C
22 7° C
22 7° C
22 6° C
22 6° C
22 SC C
55
60
22 4° C 65
24
TABLE 6-continued
RGB Values of Colors and Grayscal e Tones Shown in FIG 17
LINE
UP
132
133134
135
136
137
138
139
140
141
142
143
144
145
146
147
148
149
150
151
152153
154
155
156
157
158
159
160
161
162
163
164
165
166
167
168
169
170
171172
173
174
175
176
177
178
179
180
181
182
183
184
185
186
187
188
189
190191
192
193
194
195
196
197
198
199
200
201
202
203
204
205
206
85
8687
88
90
91
92
93
94
95
96
97
98
100
101
102
103
104
105
106
107109
110
111
112
113
114
115
116
118
119
120
121
122
123
124
125
126
128
129130
131
132
133
134
135
137
138
139
140
141
142
143
144
146
147
148
149
150151
152
153
154
156
157
158
159
160
161
162
163
165
166
167
168
G
85
8687
88
90
91
92
93
94
95
96
97
98
100
101
102
103
104
105
106
107109
110
111
112
113
114
115
116
118
119
120
121
122
123
124
125
126
128
129130
131
132
133
134
135
137
138
139
140
141
142
143
144
146
147
148
149
150151
152
153
154
156
157
158
159
160
161
162
163
165
166
167
168
B COLOR
85
8687
88
90
91
92
93
94
95
96
97
98
100
101
102
103
104
105
106
107109
110
111
112
113
114
115
116
118
119
120
121
122
123
124
125
126
128
129130
131
132
133
134
135
137
138
139
140
141
142
143
144
146
147
148
149
150151
152
153
154
156
157
158
159
160
161
162
163
165
166
167
168
LINE
DOWN TEMP
125
124123
122
121
120
119
118
117
116
115
114
113
112
111
110
109
108
107
106
105104
103
102
101
100
99
98
97
96
95
94
93
92
91
90
89
88
87
8685
84
83
82
81
80
79
78
77
76
75
74
73
72
71
70
69
68
6766
65
64
63
62
61
60
59
58
57
56
55
54
53
52
51
22 3° c
22 3° c22 2° c
22 10 c
22 10 c
22 0° c
22 0° c
21 9° c
21 9° c
21 8° c
21 70 c
21 70 c
21 6° c
21 6° c
21 5° c
21 4° c
21 4° c
21 30 c
21 30 c
21 2° c
21 2° c21 1oC
21 0° c
21 0° c
20 9° c
20 9° c
20 8° c
20 7° c
20 7° c
20 6° c
20 6° c
20 5° c
20 4° c
20 4° c
20 3° c
20 3° c
20 2° c
20 2° c
20 1° c
20 0° c20 0° c
19 9° c
19 9° c
19 8° c
19 7° c
19 7° c
19 6° c
19 6° c
19 5° c
19 5° c
19 4° c
19 3° c
19 3° c
19 2° c
19 2° c
19 1° c
19 0° c
19 0° c
18 9°c
18 9° c
18 8° c
18 8° c
18 7° c
18 6° c
18 6° c
18 5° c
18 5° c
18 4°C
18 3°C
18 3°C
18 2° c
18 2° c
18 1° c
18 0° c
18 0° c
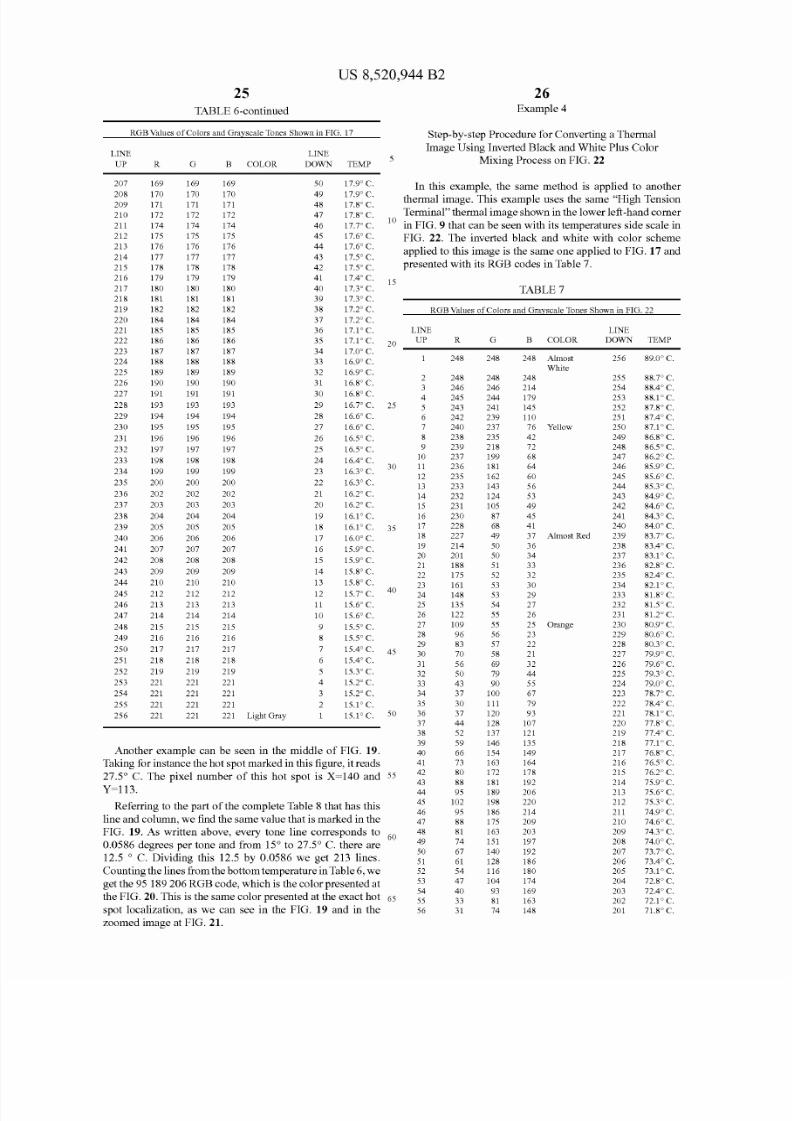
8/12/2019 Uspto 8520944 b2 Aug 27 2013 Patent for Scribb
http://slidepdf.com/reader/full/uspto-8520944-b2-aug-27-2013-patent-for-scribb 31/34
US 8 520 944 B2
5
TABLE 6-continued
RGB Values of Colors and Grayscale Tones Shown in FIG. 17
LINE
UP R G B COLOR
LINE
DOWN TEMP
17.9° C.
17.9° C.
17.8° C.
26Example 4
Step-by-step Procedure for Converting a Thermal
Image Using Inverted Black and White Plus Colo r
Mixing Process on FIG. 22
207
208
209
210
211
212
213
214
215
216
217
218
219
220
221
222
223
224
225
226
227
228
229
230
231
232
233
234
235
236
237
238
239
240
241
242
243
244
245
246
247
248
249
250
251
252
253
254
255
256
169
170
171
172
174
175
176
177
178
179
180
181
182
184
185
186
187
188
189
190
191
193
194
195
196
197
198
199
200
202
203
204
205
206
207
208
209
210
212
213
214
215
216
217
218
219
221
221
221
221
169
170
171
172
174
175
176
177
178
179
180
181
182
184
185
186
187
188
189
190
191
193
194
195
196
197
198
199
200
202
203
204
205
206
207
208
209
210
212
213
214
215
216
217
218
219
221
221
221
221
169
170
171
172
174
175
176
177
178
179
180
181
182
184
185
186
187
188
189
190
191
193
194
195
196
197
198
199
200
202
203
204
205
206
207
208
209
210
212
213
214
215
216
217
218
219
221
221
221
50
49
48
47
46
45
44
43
42
41
40
39
38
37
36
35
34
33
32
31
30
29
28
27
26
25
24
23
22
21
20
19
18
17
16
15
14
13
12
11
10
17.8° C.
17.7° C.
17.6° C.
17.6° C.
17.SC C.
17.SC C.
In this example, the same method is applied to anotherthermal image. This example uses the same High Tension
Terminal thermal image shown in the lower left-hand comer10
in FIG. 9 that can be seen with its temperatures side scale in
FIG. 22 The inverted black and white with color scheme
applied to this image is the same one applied to FIG. 17 and
presented with its RGB codes in Table 7.
9
7
2
221 Light Gray
17.4° C.
17.3° C.
17.3° C.
17.2° C.
17.2° C.
17.1° C.
17.1° C.
17.0° C.
16.9° C.
16.9° C.
16.8° C.
16.8° C.
16.7° C.
16.6° C.
16.6° C.
16.SC C.
16.SC C.
16.4° C.
16.3° C.
16.3° C.
16.2° C.
16.2° C.
16.1° C.
15
20
25
30
16.1° C. 35
16.0° C.
15.9° C.
15.9° C.
15.8° C.
15.8° C.
15.7° C.
15.6° C.
15.6° C.
15.SC C.
15.SC C.
40
15.4o C. 45
15.3° C.
15.2° C.
15.2° C.
15.1° C.
15.1° C. 50
Another example can be seen in the middle of FIG. 19.Taking for instance the hot spot marked in this figure, it reads
27.5° C. The pixel number of this hot spot is X=140 and 55
Y=113.
Referring to the part of the complete Table 8 that has this
line and column, we find the same value that is marked in the
FIG. 19. As written above, every tone line corresponds to60
0.0586 degrees per tone and from 15° to 27.5° C. there are
12.5 o C. Dividing this 12.5 by 0.0586 we get 213 lines.
Counting the lines from the bottom temperature in Table6 we
get the 95 189 206 RGB code, whic h is the color presented at
the FIG. 20 This is the same color presented at the exact hot 65
spot localization, as we can see in the FIG. 19 and in the
zoomed image at FIG. 21
TABLE 7
RGB Values of Colors and Grayscale Tones Shown in FIG. 22
LINE
UP
2
4
7
9
10
11
12
13
14
15
16
17
18
19
20
2122
23
24
25
26
27
28
29
30
31
32
33
34
35
36
37
38
39
4041
42
43
44
45
46
47
48
49
50
51
52
53
54
55
56
R248
248246
245
243
242
240
238
239
237
236
235
233
232
231
230
228
227
214
201
188175
161
148
135
122
109
96
83
70
56
50
43
37
30
37
4452
59
6673
80
88
95
102
95
88
81
74
67
61
54
47
40
33
31
G
248
248246
244
241
239
237
235
218
199
181
162
143
124
105
87
68
49
50
50
5152
53
53
54
55
55
56
57
58
69
79
90
100
111
120
128
137
146
154163
172
181
189
198
186
175
163
151
140
128
116
104
93
81
74
B COLOR
248 Almost
248214
179
145
110
White
76 Yellow
42
72
68
64
60
56
53
49
45
41
37 Almost Red
36
34
3332
30
29
27
26
25 Orange
23
22
21
32
4455
67
79
93
107
121
135
149164
178
192
206
220
214
209
203
197
192
186
180
174
169
163
148
LINE
DOWN
256
255254
253
252
251
250
249
248
247
246
245
244
243
242
241
240
239
238
237
236235
234
233
232
231
230
229
228
227
226
225
224
223
222
221
220
219
218
217216
215
214
213
212
211
210
209
208
207
206
205
204
203
202
201
TEMP
89.0° c
88.7° c88.4° c
88.1° c
87.8° c
87.4° c
87.1° c
86.8° c
86.5° c
86.2° c
85.9° c
85.6° c
85.3° c
84.9° c
84.6° c
84.3° c
84.0° c
83.7° c
83.4° c
83.10 c
82.8° c82.4° c
82.1° c
81.80 c
81.50 c
81.20 c
80.9° c
80.6° c
80.3° c
79.9° c
79.6° c
79.3° c
79.0° c
78.7° c
78.40 c
78.10 c
77.80 c
77.40 c
77.10 c
76.8°c
76.5° c
76.2° c
75.9° c
75.6° c
75.3° c
74.9° c
74.6° c
74.3° c
74.0° c
73.7° c
73.4° c
73.1° c
72.80 c
72.40 c
72.10 c
71.8° c
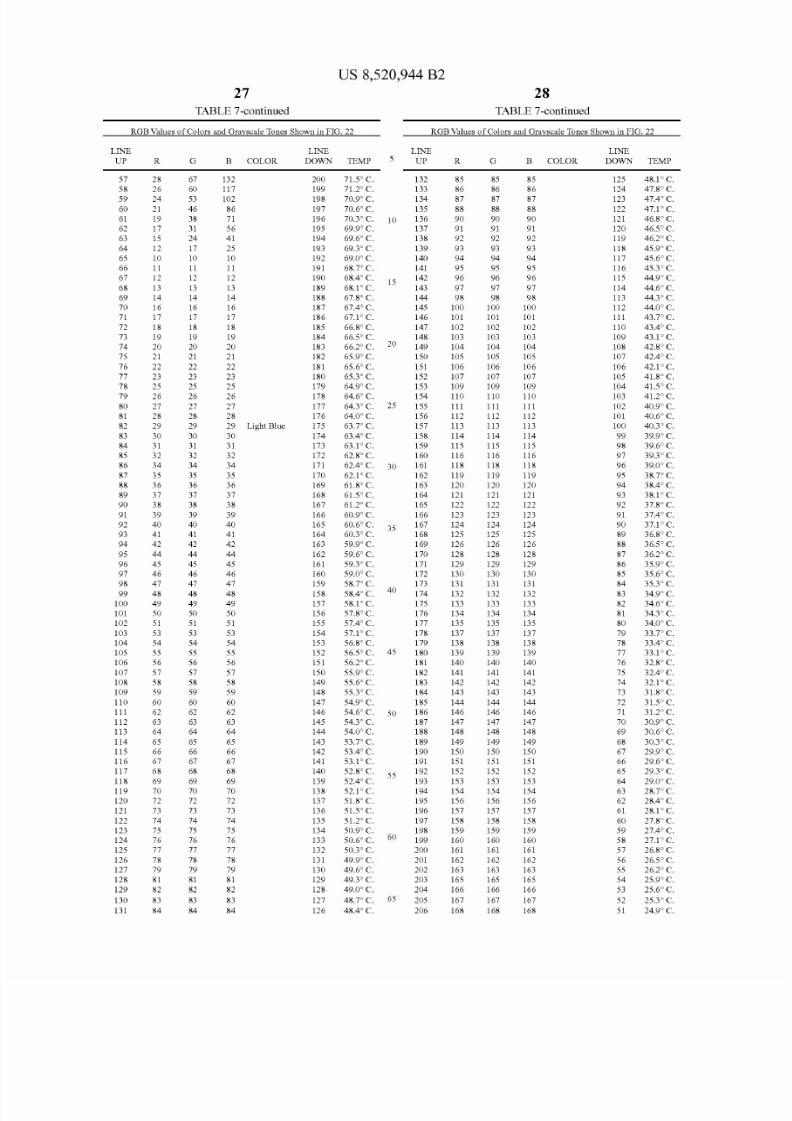
8/12/2019 Uspto 8520944 b2 Aug 27 2013 Patent for Scribb
http://slidepdf.com/reader/full/uspto-8520944-b2-aug-27-2013-patent-for-scribb 32/34
US 8 520 944 B2
27
T BLE 7 -continued
RGB Values of Colors and Grayscale Tones Shown in FIG 22
LINE
UP
57
5859
60
61
62
63
64
65
66
67
68
69
70
71
72
73
74
75
76
7778
79
80
81
82
83
84
85
86
87
88
89
90
91
92
93
94
95
9697
98
99
100
101
102
103
1 4
105
106
107
108
109
110
111
112
113
114
115116
117
118
119
120
121
122
123
124
125
126
127
128
129
130
131
28
2624
21
19
17
15
12
10
11
12
13
14
16
17
18
19
20
21
22
2325
26
27
28
29
30
31
32
34
35
36
37
38
39
4
41
42
44
4546
47
48
49
50
51
53
54
55
56
57
58
59
60
62
63
64
65
6667
68
69
70
72
73
74
75
76
77
78
79
81
82
83
84
G
67
60
53
46
38
31
24
17
10
11
12
13
14
16
17
18
19
20
21
22
2325
26
27
28
29
30
31
32
34
35
36
37
38
39
40
41
42
44
4546
47
48
49
50
51
53
54
55
56
57
58
59
60
62
63
64
65
66
67
68
69
70
72
73
74
75
76
77
78
79
81
82
83
84
B COLOR
132
117102
86
71
56
41
25
10
11
12
13
14
16
17
18
19
20
21
22
2325
26
27
28
29 Light Blue
30
31
32
34
35
36
37
38
39
4
41
42
44
4546
47
48
49
50
51
53
54
55
56
57
58
59
60
62
63
64
65
6667
68
69
70
72
73
74
75
76
77
78
79
81
82
83
84
LINE
DOWN TEMP
200
199198
197
196
195
194
193
192
191
190
189
188
187
186
185
184
183
182
181
180179
178
177
176
175
174
173
172
171
170
169
168
167
166
165
164
163
162
161160
159
158
157
156
155
154
153
152
151
150
149
148
147
146
145
144
143
142141
140
139
138
137
136
135
134
133
132
131
130
129
128
127
126
71 SC C
71 2° C70 9° C
70 6° C
70 3° C 10
69 9° C
69 6° C
69 3° C
69 0° C
68 7° C
68 4° C
68 1° C
67 8° C
67 4° C
67 1° C
66 8° C
66 SC C
66 2° C
65 9° C
65 6° C
65 3° C64 9° C
64 6° C
15
20
64 3° C 25
64 0° C
63 7° C
63 4° C
63 1° C
62 8° C
62 4o C 30
62 1° C
61 8° C
61 SC C
61 2° C
60 9° C
60 6° C
60 3° C
59 9° C
59 6° C
59 3° C59 0° C
58 7° C
58 4° C
58 1° C
57 8° C
57 4° C
57 1 o C
56 8° C
35
4
56 SC C 45
56 2° C
55 9° C
55 6° C
55 3° C
54 9° C
54 6° C 50
54 3° C
54 0° C
53 7° C
53 4° C53 1° C
52 8° C
52 4° C
52 1° C
51 8° C
51 SCC
51 2° C
50 9° C
50 6° C
50 3° C
49 9° C
49 6° C
49 3° C
49 0° C
55
60
48 7° C 65
8
TABLE 7 -continued
RGB Values of Colors and Grayscal e Tones Shown in FIG 22
LINE
UP
132
133134
135
136
137
138
139
140
141
142
143
144
145
146
147
148
149
150
151
152153
154
155
156
157
158
159
160
161
162
163
164
165
166
167
168
169
170
171172
173
174
175
176
177
178
179
180
181
182
183
184
185
186
187
188
189
190191
192
193
194
195
196
197
198
199
200
201
202
203
204
205
206
85
8687
88
90
91
92
93
94
95
96
97
98
100
101
102
103
104
105
106
107109
110
111
112
113
114
115
116
118
119
120
121
122
123
124
125
126
128
129130
131
132
133
134
135
137
138
139
140
141
142
143
144
146
147
148
149
150151
152
153
154
156
157
158
159
160
161
162
163
165
166
167
168
G
85
8687
88
90
91
92
93
94
95
96
97
98
100
101
102
103
104
105
106
107109
110
111
112
113
114
115
116
118
119
120
121
122
123
124
125
126
128
129130
131
132
133
134
135
137
138
139
140
141
142
143
144
146
147
148
149
150151
152
153
154
156
157
158
159
160
161
162
163
165
166
167
168
B COLOR
85
8687
88
90
91
92
93
94
95
96
97
98
100
101
102
103
104
105
106
107109
110
111
112
113
114
115
116
118
119
120
121
122
123
124
125
126
128
129130
131
132
133
134
135
137
138
139
140
141
142
143
144
146
147
148
149
150151
152
153
154
156
157
158
159
160
161
162
163
165
166
167
168
LINE
DOWN TEMP
125
124123
122
121
120
119
118
117
116
115
114
113
112
111
110
109
108
107
106
105104
103
102
101
100
99
98
97
96
95
94
93
92
91
90
89
88
87
8685
84
83
82
81
80
79
78
77
76
75
74
73
72
71
70
69
68
6766
65
64
63
62
61
60
59
58
57
56
55
54
53
52
51
48 1° c
47 8° c
47 4° c
47 1° c
46 8° c
46 5° c
46 2° c
45 9° c
45 6° c
45 3° c
44 9° c
44 6° c
44 3° c
44 0° c
43 7° c
43 4° c
43 1° c
42 8° c
42 4° c
42 1° c
41 8° c41 5° c
41 2° c
40 9° c
40 6° c
40 3° c
39 9° c
39 6° c
39 3° c
39 0° c
38 7° c
38 4° c
38 1° c
37 8° c
37 4° c
37 1° c
36 8° c
36 5° c
36 2° c
35 9° c35 6° c
35 3° c
34 9° c
34 6° c
34 3° c
34 0° c
33 7° c
33 4° c
33 1° c
32 8° c
32 4° c
32 1° c
31 8° c
31 5° c
31 2° c
30 9° c
30 6° c
30 3° c
29 9°c
29 6° c
29 3° c
29 0° c
28 7° c
28 4° c
28 1° c
27 8° c
27 40 c
27 1° c
26 8° c
26 5° c
26 2° c
25 9° c
25 6° c
25 3° c
24 9° c
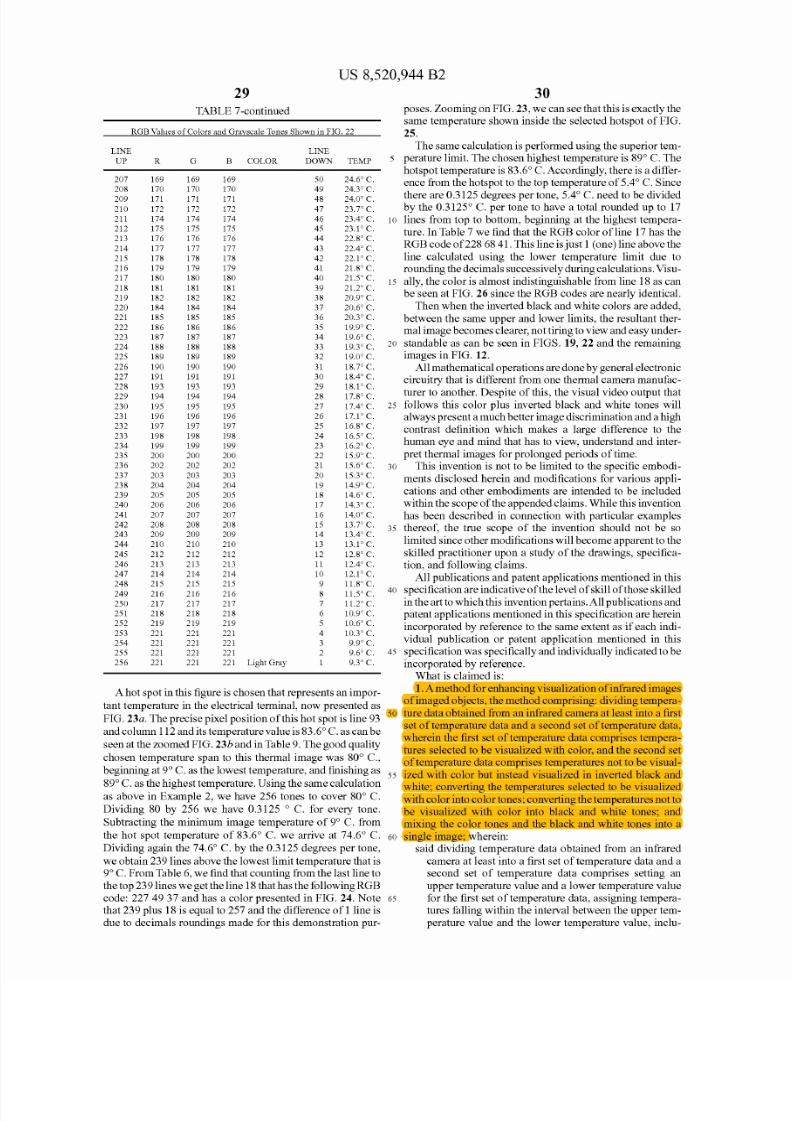
8/12/2019 Uspto 8520944 b2 Aug 27 2013 Patent for Scribb
http://slidepdf.com/reader/full/uspto-8520944-b2-aug-27-2013-patent-for-scribb 33/34
US 8,520,944 B2
29
TABLE 7 -continued
RGB Values of Colors and Grayscale Tones Shown in FIG. 22
LINE
UP
207
208209
210
211
212
213
214
215
216
217
218
219
220
221
222
223
224
225
226
227228
229
230
231
232
233
234
235
236
237
238
239
240
241
242
243
244
245
246247
248
249
250
251
252
253
254
255
256
169
170171
172
174
175
176
177
178
179
180
181
182
184
185
186
187
188
189
190
191193
194
195
196
197
198
199
200
202
203
204
205
206
207
208
209
210
212
213214
215
216
217
218
219
221
221
221
221
G
169
170171
172
174
175
176
177
178
179
180
181
182
184
185
186
187
188
189
190
191193
194
195
196
197
198
199
200
202
203
204
205
206
207
208
209
210
212
213214
215
216
217
218
219
221
221
221
221
B COLOR
169
170171
172
174
175
176
177
178
179
180
181
182
184
185
186
187
188
189
190
191193
194
195
196
197
198
199
200
202
203
204
205
206
207
208
209
210
212
213214
215
216
217
218
219
221
221
221
221 Light Gray
LINE
DOWN TEMP
50 24.6° C.
49 24.3° C.48 24.0° C.
47 23 7°C
46 23.4° C.
45 23.1 o C.
44 22.8° C.
43 22.4° C.
42 22.1 o C.
41 21.8° C.
40 21.SC C.
39 21.2° C.
38 20.9° C.
37 20.6° C.
36 20.3° C.
35 19.9° C.
34 19.6° C.
33 19.3° C.
32 19.0° C.
31 18.7° C.
30 18 4°C29 18.1° C.
28 17.8° C.
27 17.4° C.
26 17.1° C.
25 16 8°C
24 16.SC C.
23 16.2° C.
22 15.9° C.
21 15.6° C.
20 15.3° C.
19 14.9° C.
18 14.6° C.
17 14.3° C.
16 14.0° C.
15 13.7° C.
14 13.4° C.
13 13 1°C
12 12.8° C.
11 12.4° C.10 12.1° C.
9 11.8° C.
11.SC C.
10.9° C.
10.6° C.
4 10.3° C.
9.9° C.
30poses. Zooming on FIG. 23, we can see that this is exactly the
same temperature shown inside the selected hotspot of FIG.
25.
The same calculation is performed using the superior tem
perature limit. The chosen highest temperature is 89° C. The
hotspot temperature is 83.6° C. Accordingly, there is a differ
ence from the hotspot to the top temperature of 5.4° C. Since
there are 0.3125 degrees per tone, 5.4° C. need to be divided
by the 0.3125° C. per tone to have a total rounded up to 17
10 lines from top to bottom, beginning at the highest tempera
ture. In Table 7 we find that the RGB color of line 17 has the
RGB code of228 68 41. This line is just 1 one) line above the
line calculated using the lower temperature limit due to
rounding the decimals successively during calculations. Visu-
15 ally, the color is almost indistinguishable from line 18 as can
be seen at FIG. 26 since the RGB codes are nearly identical.
Then when the inverted black and white colors are added,
between the same upper and lower limits, the resultant ther
mal image becomes clearer, not tiring to view and easy under-
20 standable as can be seen in FIGS. 19 22 and the remaining
images in FIG. 12.
All mathematical operations are done by general electronic
circuitry that is different from one thermal camera manufacturer to another. Despite of this, the visual video output that
25 follows this color plus inverted black and white tones will
always present a much better image discrimination and a high
contrast definition which makes a large difference to the
human eye and mind that has to view, understand and inter
pret thermal images for prolonged periods of time.
30 This invention is not to be limited to the specific embodi-
ments disclosed herein and modifications for various appli
cations and other embodiments are intended to be included
within the scope of he appended claims. While this invention
has been described in connection with particular examples
35 thereof, the true scope of the invention should not be so
limited since other modifications will become apparent to the
skilled practitioner upon a study of the drawings, specifica
tion, and following claims.All publications and patent applications mentioned in this
40 specification are indicative of he level of skill of hose skilled
in the art to wh ich this invention pertains. All publications and
patent applications mentioned in this specification are herein
incorporated by reference to the same extent as if each indi
vidual publication or patent application mentioned in this
45 specification was specifically and individually indicated to be
incorporated by reference.
What is cl aimed is:
1 A method for enhancing visualization of nfrared images
of maged objects, the method comprising: dividing tempera-
50 ture data obtained from an infrared camera at least into a first
A hot spot in this figure is chosen that represents an impor
tant temperature in the electrical terminal, now presented as
FIG. 23a. The precise pixel position of his hot spot is line 93
and column 112 and its temperature value is 83.6° C. as can be
seen at the zoomed FIG. 23b and in Table 9. The good quality
chosen temperature span to this thermal image was 80° C.,beginning at 9° C. as the lowest temperature, and finishing as
5589° C. as the highest temperature. Using the same calculation
set of temperature data and a second set of temperature data,
wherein the first set of temperature data comprises tempera
tures selected tobe
visualized with color, and the second setof emperature data comprises temperatures not to be visual
ized with color but instead visualized in inverted black and
white; converting the temperatures selected to be visualized
with color into color tones; converting the temperatures not to
be visualized with color into black and white tones; and
mixing the color tones and the black and white tones into a
single image; wherein:
as above in Example 2, we have 256 tones to cover 80° C.
Dividing 80 by 256 we have 0.3125 o C. for every tone.
Subtracting the minimum image temperature of 9° C. from
the hot spot temperature of 83.6° C. we arrive at 74.6° C. 60
Dividing again the 74.6° C. by the 0.3125 degrees per tone,
we obtain 239l ines above the lowest limit temperature that is
9° C. From Table 6 we find that counting from the last line to
the top 239lines we get the line 18 that has the following RGB
code: 227 49 37 and has a color presented in FIG. 24 Note 65
that 239 plus 18 is equal to 257 and the difference of 1 line is
due to decimals roundings made for this demonstration pur-
said dividing temperature data obtained from an infrared
camera at least into a first set of temperature data and a
second set of temperature data comprises setting an
upper temperature value and a lower temperature value
for the first set of temperature data, assigning tempera
tures falling within the interval between the upper tem
perature value and the lower temperature value, inclu-
8/12/2019 Uspto 8520944 b2 Aug 27 2013 Patent for Scribb
http://slidepdf.com/reader/full/uspto-8520944-b2-aug-27-2013-patent-for-scribb 34/34