using student achievement data to support …...using student achievement data to support...
TRANSCRIPT

Using Student Achievement Data to
Support Instructional Decision Making
Using Student Achievement Data to
Support Instructional Decision Making
NCEE 2009-4067U.S. DEPARTMENT OF EDUCATION
IES PRACTICE GUIDE WHAT WORKS CLEARINGHOUSE
The Institute of Education Sciences (IES) publishes practice guides in education to bring the best available evidence and expertise to bear on the types of challenges that cannot currently be addressed by a single intervention or program. Authors of practice guides seldom conduct the types of systematic literature searches that are the backbone of a meta-analysis, although they take advantage of such work when it is already published. Instead, authors use their expertise to identify the most im-portant research with respect to their recommendations and conduct a search of recent publications to ensure that the research supporting the recommendations is up-to-date.
Unique to IES-sponsored practice guides is that they are subjected to rigorous exter-nal peer review through the same office that is responsible for independent reviews of other IES publications. A critical task for peer reviewers of a practice guide is to determine whether the evidence cited in support of particular recommendations is up-to-date and that studies of similar or better quality that point in a different di-rection have not been ignored. Because practice guides depend on the expertise of their authors and their group decision making, the content of a practice guide is not and should not be viewed as a set of recommendations that in every case depends on and flows inevitably from scientific research.
The goal of this practice guide is to formulate specific and coherent evidence-based recommendations for use by educators and education administrators to create the organizational conditions necessary to make decisions using student achievement data in classrooms, schools, and districts. The guide provides practical, clear in-formation on critical topics related to data-based decision making and is based on the best available evidence as judged by the panel. Recommendations presented in this guide should not be construed to imply that no further research is warranted on the effectiveness of particular strategies for data-based decision making.

Using Student Achievement Data to Support Instructional Decision Making
September 2009
PanelLaura Hamilton (Chair)RAND CoRpoRAtioN
Richard HalversonUNiveRsity of WisCoNsiN–MADisoN
Sharnell S. JacksonChiCAgo pUbliC sChools
Ellen MandinachCNA eDUCAtioN
Jonathan A. SupovitzUNiveRsity of peNNsylvANiA
Jeffrey C. Waymanthe UNiveRsity of texAs At AUstiN
StaffCassandra PickensEmily Sama MartinMAtheMAtiCA poliCy ReseARCh
Jennifer L. SteeleRAND CoRpoRAtioN
NCEE 2009-4067U.S. DEPARTMENT OF EDUCATION
IES PRACTICE GUIDE

This report was prepared for the National Center for Education Evaluation and Re-gional Assistance, Institute of Education Sciences, under Contract ED-07-CO-0062 by the What Works Clearinghouse, operated by Mathematica Policy Research.
Disclaimer The opinions and positions expressed in this practice guide are the authors’ and do not necessarily represent the opinions and positions of the Institute of Education Sci-ences or the U.S. Department of Education. This practice guide should be reviewed and applied according to the specific needs of the educators and education agency using it, and with the full realization that it represents the judgments of the review panel regarding what constitutes sensible practice, based on the research available at the time of publication. This practice guide should be used as a tool to assist in decision making rather than as a “cookbook.” Any references within the document to specific education products are illustrative and do not imply endorsement of these products to the exclusion of other products that are not referenced.
U.S. Department of Education Arne Duncan Secretary
Institute of Education Sciences John Q. EastonDirector
National Center for Education Evaluation and Regional Assistance John Q. EastonActing Commissioner
September 2009
This report is in the public domain. While permission to reprint this publication is not necessary, the citation should be:
Hamilton, L., Halverson, R., Jackson, S., Mandinach, E., Supovitz, J., & Wayman, J. (2009). Using student achievement data to support instructional decision making (NCEE 2009-4067). Washington, DC: National Center for Education Evaluation and Regional Assistance, Institute of Education Sciences, U.S. Department of Education. Retrieved from http://ies.ed.gov/ncee/wwc/publications/practiceguides/.
What Works Clearinghouse Practice Guide citations begin with the panel chair, followed by the names of the panelists listed in alphabetical order.
This report is available on the IES website at http://ies.ed.gov/ncee and http://ies.ed.gov/ncee/wwc/publications/practiceguides/.
Alternative formats On request, this publication can be made available in alternative formats, such as Braille, large print, audiotape, or computer diskette. For more information, call the Alternative Format Center at 202–205–8113.
( iii )
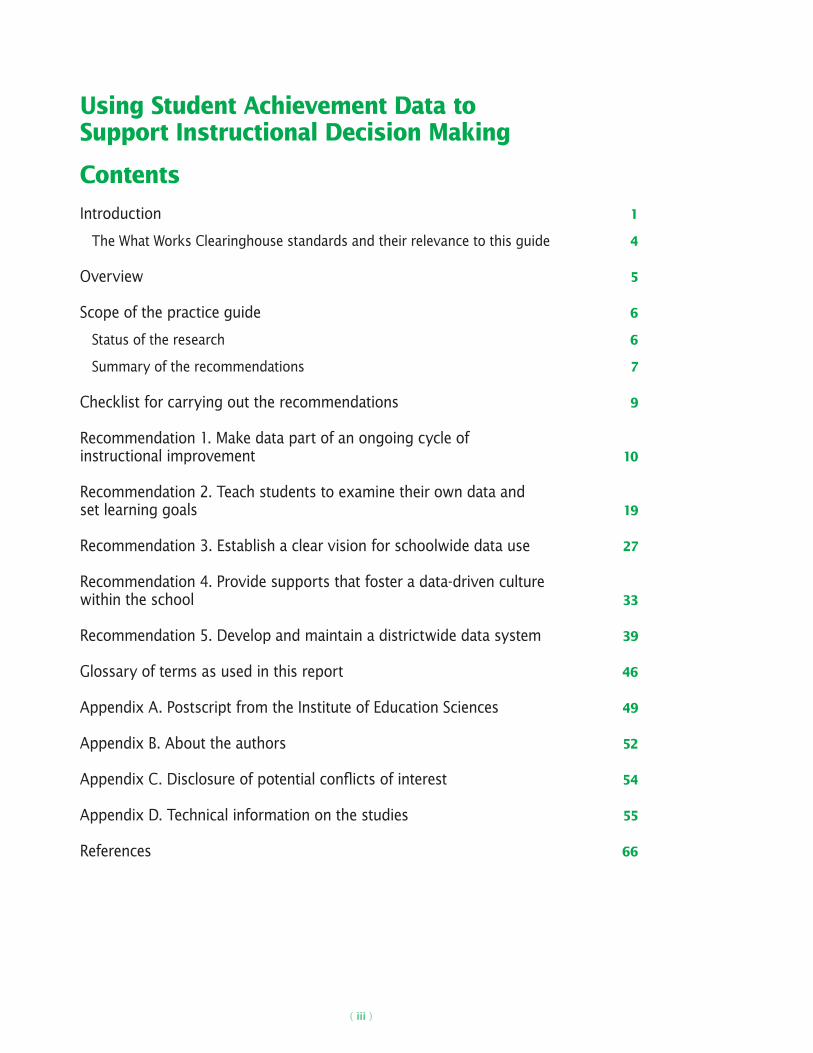
Using Student Achievement Data to Support Instructional Decision Making
Contents
Introduction 1
The What Works Clearinghouse standards and their relevance to this guide 4
Overview 5
Scope of the practice guide 6
Status of the research 6
Summary of the recommendations 7
Checklist for carrying out the recommendations 9
Recommendation 1. Make data part of an ongoing cycle of instructional improvement 10
Recommendation 2. Teach students to examine their own data and set learning goals 19
Recommendation 3. Establish a clear vision for schoolwide data use 27
Recommendation 4. Provide supports that foster a data-driven culture within the school 33
Recommendation 5. Develop and maintain a districtwide data system 39
Glossary of terms as used in this report 46
Appendix A. Postscript from the Institute of Education Sciences 49
Appendix B. About the authors 52
Appendix C. Disclosure of potential conflicts of interest 54
Appendix D. Technical information on the studies 55
References 66
( iv )
USING STUDENT ACHIEVEMENT DATA TO SUPPORT INSTRUCTIONAL DECISION MAKING
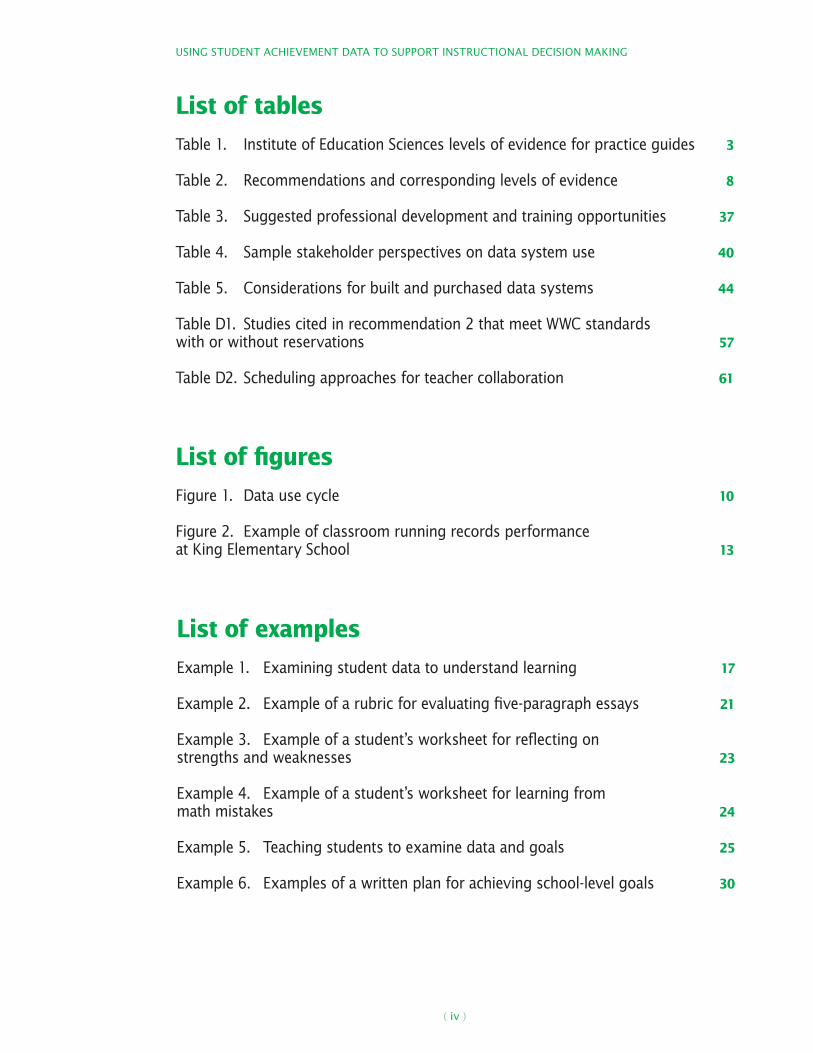
List of tables
Table 1. Institute of Education Sciences levels of evidence for practice guides 3
Table 2. Recommendations and corresponding levels of evidence 8
Table 3. Suggested professional development and training opportunities 37
Table 4. Sample stakeholder perspectives on data system use 40
Table 5. Considerations for built and purchased data systems 44
Table D1. Studies cited in recommendation 2 that meet WWC standards with or without reservations 57
Table D2. Scheduling approaches for teacher collaboration 61
List of figures
Figure 1. Data use cycle 10
Figure 2. Example of classroom running records performance at King Elementary School 13
List of examples
Example 1. Examining student data to understand learning 17
Example 2. Example of a rubric for evaluating five-paragraph essays 21
Example 3. Example of a student’s worksheet for reflecting on strengths and weaknesses 23
Example 4. Example of a student’s worksheet for learning from math mistakes 24
Example 5. Teaching students to examine data and goals 25
Example 6. Examples of a written plan for achieving school-level goals 30
( 1 )
Introduction
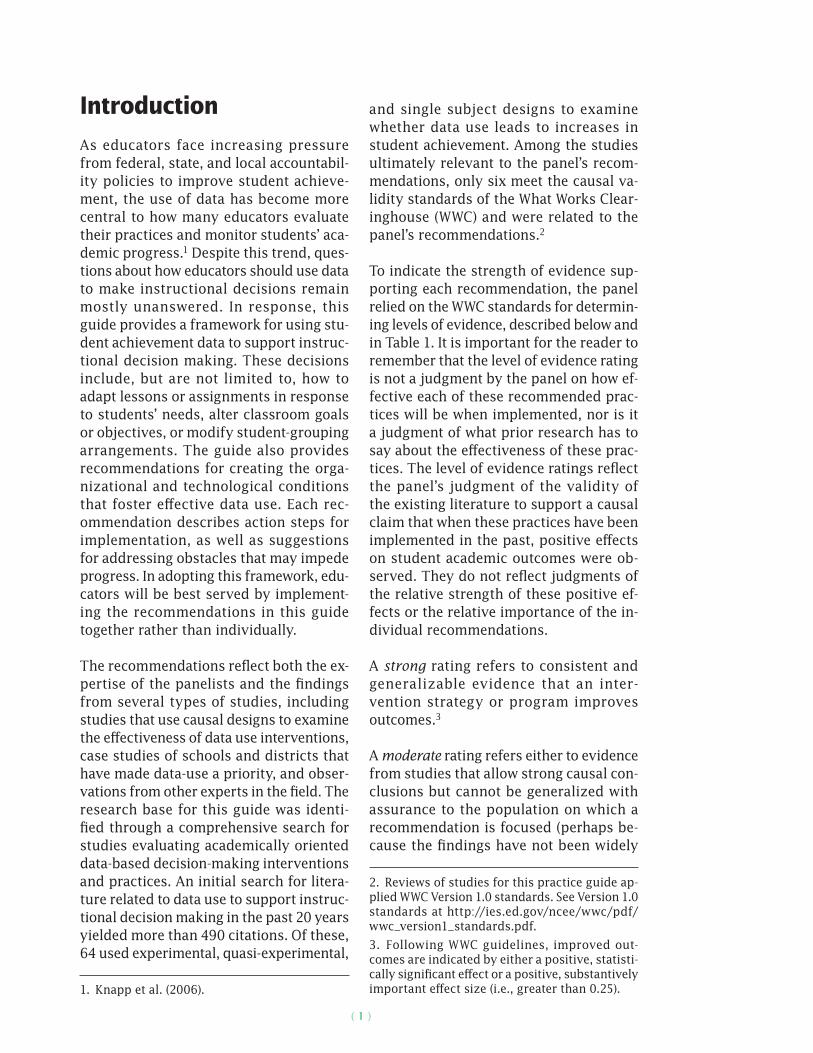
As educators face increasing pressure from federal, state, and local accountabil-ity policies to improve student achieve-ment, the use of data has become more central to how many educators evaluate their practices and monitor students’ aca-demic progress.1 Despite this trend, ques-tions about how educators should use data to make instructional decisions remain mostly unanswered. In response, this guide provides a framework for using stu-dent achievement data to support instruc-tional decision making. These decisions include, but are not limited to, how to adapt lessons or assignments in response to students’ needs, alter classroom goals or objectives, or modify student-grouping arrangements. The guide also provides recommendations for creating the orga-nizational and technological conditions that foster effective data use. Each rec-ommendation describes action steps for implementation, as well as suggestions for addressing obstacles that may impede progress. In adopting this framework, edu-cators will be best served by implement-ing the recommendations in this guide together rather than individually.
The recommendations reflect both the ex-pertise of the panelists and the findings from several types of studies, including studies that use causal designs to examine the effectiveness of data use interventions, case studies of schools and districts that have made data-use a priority, and obser-vations from other experts in the field. The research base for this guide was identi-fied through a comprehensive search for studies evaluating academically oriented data-based decision-making interventions and practices. An initial search for litera-ture related to data use to support instruc-tional decision making in the past 20 years yielded more than 490 citations. Of these, 64 used experimental, quasi-experimental,
1. Knapp et al. (2006).
and single subject designs to examine whether data use leads to increases in student achievement. Among the studies ultimately relevant to the panel’s recom-mendations, only six meet the causal va-lidity standards of the What Works Clear-inghouse (WWC) and were related to the panel’s recommendations.2
To indicate the strength of evidence sup-porting each recommendation, the panel relied on the WWC standards for determin-ing levels of evidence, described below and in Table 1. It is important for the reader to remember that the level of evidence rating is not a judgment by the panel on how ef-fective each of these recommended prac-tices will be when implemented, nor is it a judgment of what prior research has to say about the effectiveness of these prac-tices. The level of evidence ratings reflect the panel’s judgment of the validity of the existing literature to support a causal claim that when these practices have been implemented in the past, positive effects on student academic outcomes were ob-served. They do not reflect judgments of the relative strength of these positive ef-fects or the relative importance of the in-dividual recommendations.
A strong rating refers to consistent and generalizable evidence that an inter-vention strategy or program improves outcomes.3
A moderate rating refers either to evidence from studies that allow strong causal con-clusions but cannot be generalized with assurance to the population on which a recommendation is focused (perhaps be-cause the findings have not been widely
2. Reviews of studies for this practice guide ap-plied WWC Version 1.0 standards. See Version 1.0 standards at http://ies.ed.gov/ncee/wwc/pdf/wwc_version1_standards.pdf.
3. Following WWC guidelines, improved out-comes are indicated by either a positive, statisti-cally significant effect or a positive, substantively important effect size (i.e., greater than 0.25).

INTRODUCTION
( 2 )
replicated) or to evidence from studies that are generalizable but have more causal ambiguity than that offered by experi-mental designs (e.g., statistical models of correlational data or group comparison de-signs for which equivalence of the groups at pretest is uncertain).
A low rating refers to evidence either from studies such as case studies and descrip-tive studies that do not meet the stan-dards for moderate or strong evidence or from expert opinion based on reasonable extrapolations from research and theory. A low level of evidence rating indicates that the panel did not identify a body of research demonstrating effects of imple-menting the recommended practice on student achievement. The lack of a body of valid evidence may simply mean that the recommended practices are not feasible or are difficult to study in a rigorous, experi-mental fashion.4 In other cases, it means
4. For more information, see the WWC Frequently Asked Questions page for practice guides, http://ies.ed.gov/ncee/wwc/references/idocviewer/doc.aspx?docid=15&tocid=3.
that researchers have not yet studied a practice or that there is weak or conflicting evidence of effectiveness. Policy interest in topics of current study thus can arise be-fore a research base has accumulated on which recommendations can be based.
Under these circumstances, the panel ex-amined the research it identified on the topic and combined findings from that research with its professional expertise and judgments to arrive at recommenda-tions. However, that a recommendation has a low level of evidence should not be interpreted as indicating that the panel believes the recommendation is unimport-ant. The panel has decided that all five rec-ommendations are important and, in fact, encourages educators to implement all of them to the extent that state and district resources and capacity allow.
INTRODUCTION
( 3 )
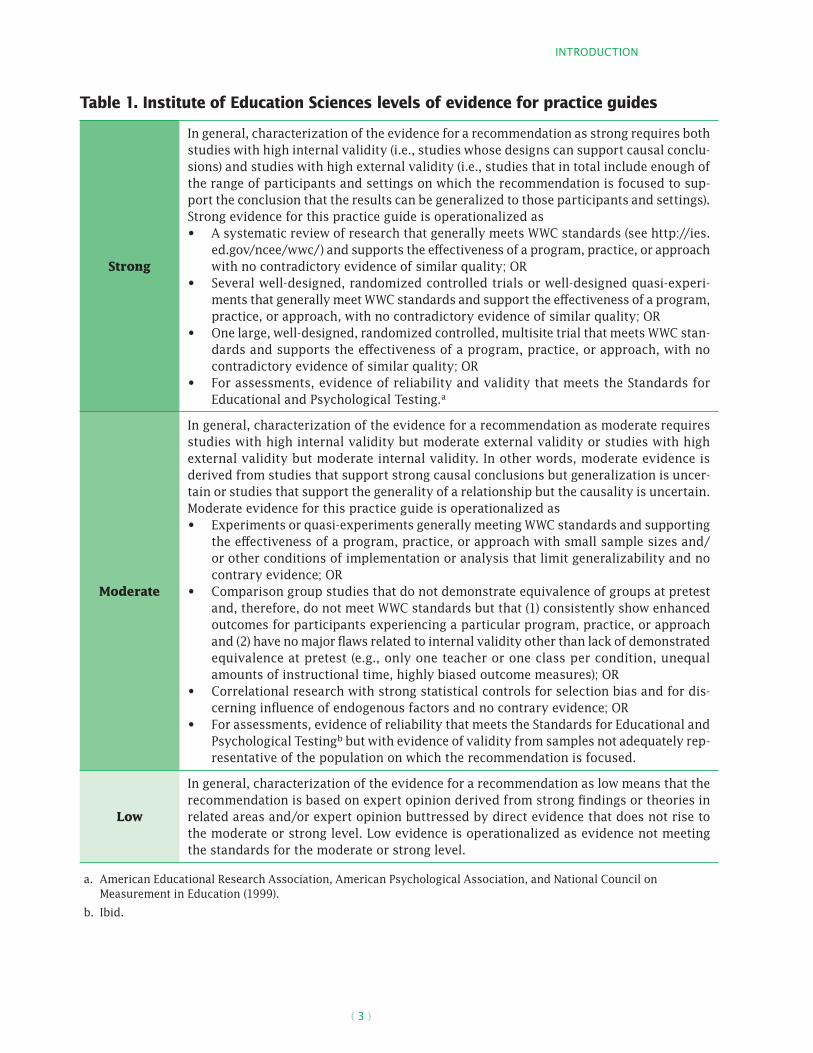
Table 1. Institute of Education Sciences levels of evidence for practice guides
Strong
In general, characterization of the evidence for a recommendation as strong requires both studies with high internal validity (i.e., studies whose designs can support causal conclu-sions) and studies with high external validity (i.e., studies that in total include enough of the range of participants and settings on which the recommendation is focused to sup-port the conclusion that the results can be generalized to those participants and settings). Strong evidence for this practice guide is operationalized as• A systematic review of research that generally meets WWC standards (see http://ies.
ed.gov/ncee/wwc/) and supports the effectiveness of a program, practice, or approach with no contradictory evidence of similar quality; OR
• Several well-designed, randomized controlled trials or well-designed quasi-experi-ments that generally meet WWC standards and support the effectiveness of a program, practice, or approach, with no contradictory evidence of similar quality; OR
• One large, well-designed, randomized controlled, multisite trial that meets WWC stan-dards and supports the effectiveness of a program, practice, or approach, with no contradictory evidence of similar quality; OR
• For assessments, evidence of reliability and validity that meets the Standards for Educational and Psychological Testing.a
Moderate
In general, characterization of the evidence for a recommendation as moderate requires studies with high internal validity but moderate external validity or studies with high external validity but moderate internal validity. In other words, moderate evidence is derived from studies that support strong causal conclusions but generalization is uncer-tain or studies that support the generality of a relationship but the causality is uncertain. Moderate evidence for this practice guide is operationalized as• Experiments or quasi-experiments generally meeting WWC standards and supporting
the effectiveness of a program, practice, or approach with small sample sizes and/or other conditions of implementation or analysis that limit generalizability and no contrary evidence; OR
• Comparison group studies that do not demonstrate equivalence of groups at pretest and, therefore, do not meet WWC standards but that (1) consistently show enhanced outcomes for participants experiencing a particular program, practice, or approach and (2) have no major flaws related to internal validity other than lack of demonstrated equivalence at pretest (e.g., only one teacher or one class per condition, unequal amounts of instructional time, highly biased outcome measures); OR
• Correlational research with strong statistical controls for selection bias and for dis-cerning influence of endogenous factors and no contrary evidence; OR
• For assessments, evidence of reliability that meets the Standards for Educational and Psychological Testingb but with evidence of validity from samples not adequately rep-resentative of the population on which the recommendation is focused.
Low
In general, characterization of the evidence for a recommendation as low means that the recommendation is based on expert opinion derived from strong findings or theories in related areas and/or expert opinion buttressed by direct evidence that does not rise to the moderate or strong level. Low evidence is operationalized as evidence not meeting the standards for the moderate or strong level.
a. American Educational Research Association, American Psychological Association, and National Council on Measurement in Education (1999).
b. Ibid.
INTRODUCTION
( 4 )
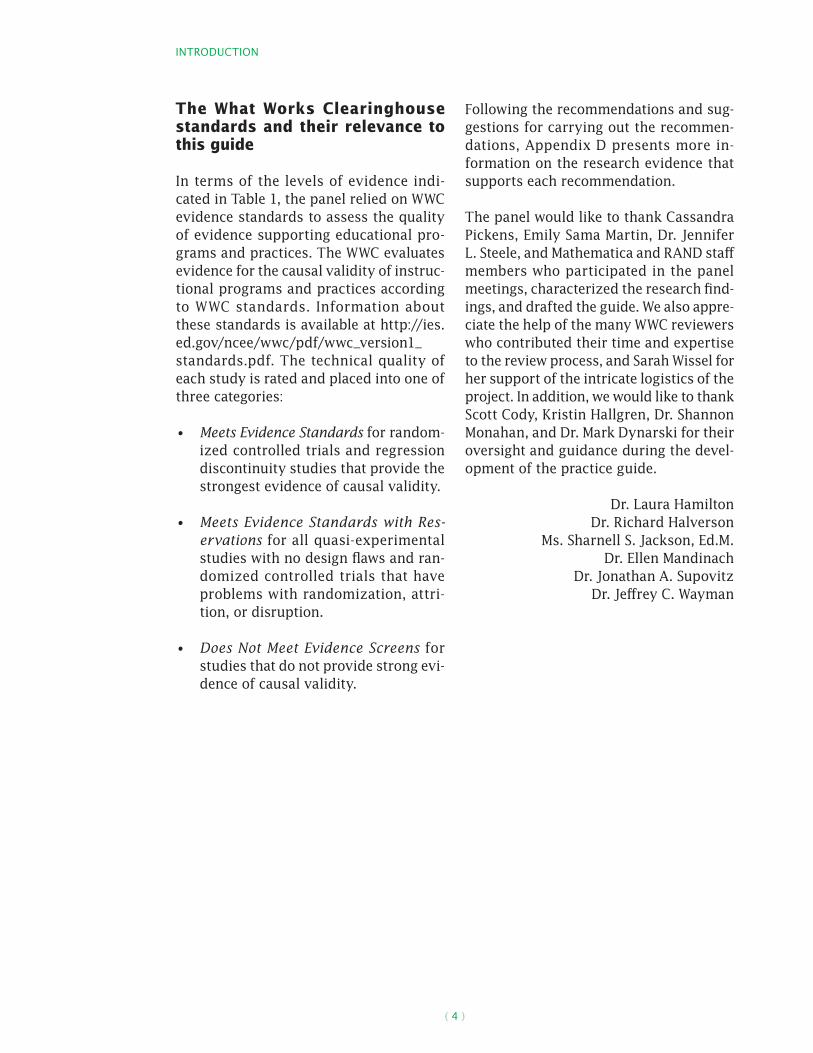
The What Works Clearinghouse standards and their relevance to this guide
In terms of the levels of evidence indi-cated in Table 1, the panel relied on WWC evidence standards to assess the quality of evidence supporting educational pro-grams and practices. The WWC evaluates evidence for the causal validity of instruc-tional programs and practices according to WWC standards. Information about these standards is available at http://ies.ed.gov/ncee/wwc/pdf/wwc_version1_standards.pdf. The technical quality of each study is rated and placed into one of three categories:
• Meets Evidence Standards for random-ized controlled trials and regression discontinuity studies that provide the strongest evidence of causal validity.
• Meets Evidence Standards with Res-ervations for all quasi-experimental studies with no design flaws and ran-domized controlled trials that have problems with randomization, attri-tion, or disruption.
• Does Not Meet Evidence Screens for studies that do not provide strong evi-dence of causal validity.
Following the recommendations and sug-gestions for carrying out the recommen-dations, Appendix D presents more in-formation on the research evidence that supports each recommendation.
The panel would like to thank Cassandra Pickens, Emily Sama Martin, Dr. Jennifer L. Steele, and Mathematica and RAND staff members who participated in the panel meetings, characterized the research find-ings, and drafted the guide. We also appre-ciate the help of the many WWC reviewers who contributed their time and expertise to the review process, and Sarah Wissel for her support of the intricate logistics of the project. In addition, we would like to thank Scott Cody, Kristin Hallgren, Dr. Shannon Monahan, and Dr. Mark Dynarski for their oversight and guidance during the devel-opment of the practice guide.
Dr. Laura HamiltonDr. Richard Halverson
Ms. Sharnell S. Jackson, Ed.M.Dr. Ellen Mandinach
Dr. Jonathan A. SupovitzDr. Jeffrey C. Wayman
( 5 )
Using Student Achievement Data to Support Instructional Decision Making
Overview
Recent changes in accountability and test-ing policies have provided educators with access to an abundance of student-level data, and the availability of such data has led many to want to strengthen the role of data for guiding instruction and improving student learning. The U.S. Department of Education recently echoed this desire, call-ing upon schools to use assessment data to respond to students’ academic strengths and needs.5 In addition, spurred in part by federal legislation and funding, states and districts are increasingly focused on building longitudinal data systems.6
Although accountability trends explain why more data are available in schools, the question of what to do with the data re-mains primarily unanswered. Data provide a way to assess what students are learn-ing and the extent to which students are making progress toward goals. However, making sense of data requires concepts, theories, and interpretative frames of ref-erence.7 Using data systematically to ask questions and obtain insight about student
5. American Recovery and Reinvestment Act of 2009; U.S. Department of Education (2009); Obama (2009).
6. Aarons (2009).
7. Knapp et al. (2006).
progress is a logical way to monitor con-tinuous improvement and tailor instruc-tion to the needs of each student. Armed with data and the means to harness the information data can provide, educators can make instructional changes aimed at improving student achievement, such as:
• prioritizing instructional time;8
• targeting additional individual instruc-tion for students who are struggling with particular topics;9
• more easily identifying individual stu-dents’ strengths and instructional in-terventions that can help students continue to progress;10
• gauging the instructional effectiveness of classroom lessons;11
• refining instructional methods;12 and
• examining schoolwide data to consider whether and how to adapt the curricu-lum based on information about stu-dents’ strengths and weaknesses.13
8. Brunner et al. (2005).
9. Brunner et al. (2005); Supovitz and Klein (2003); Wayman and Stringfield (2006).
10. Brunner et al. (2005); Forman (2007); Wayman and Stringfield (2006).
11. Halverson, Prichett, and Watson (2007); Supovitz and Klein (2003).
12. Halverson, Prichett, and Watson (2007); Fiarman (2007).
13. Marsh, Pane, and Hamilton (2006); Kerr et al. (2006).

( 6 )
Scope of the practice guide
The purpose of this practice guide is to help K–12 teachers and administrators use student achievement data to make instruc-tional decisions intended to raise student achievement. The panel believes that the responsibility for effective data use lies with district leaders, school administrators, and classroom teachers and has crafted the recommendations accordingly.
This guide focuses on how schools can make use of common assessment data to improve teaching and learning. For the purpose of this guide, the panel defined common as-sessments as those that are administered in a routine, consistent manner by a state, district, or school to measure students’ aca-demic achievement.14 These include
• annual statewide accountability tests such as those required by No Child Left Behind;
• commercially produced tests—includ-ing interim assessments, benchmark assessments, or early-grade reading assessments—administered at mul-tiple points throughout the school year to provide feedback on student learning;
• end-of-course tests administered across schools or districts; and
• interim tests developed by districts or schools, such as quarterly writing or mathematics prompts, as long as
14. The panel recognizes that some schools do not fall under a district umbrella or are not part of a district. For the purposes of this guide, dis-trict is used to describe schools in partnership, which could be either a school district or a collab-orative organization of schools. Technical terms related to assessments, data, and data-based de-cision making are defined in a glossary at the end of the recommendations.
these are administered consistently and routinely to provide information that can be compared across class-rooms or schools.
Annual and interim assessments vary con-siderably in their reliability and level of detail, and no single assessment can tell educators all they need to know to make well-informed instructional decisions. For this reason, the guide emphasizes the use of multiple data sources and suggests ways to use different types of common assessment data to support and inform decision mak-ing. The panel recognizes the value of class-room-specific data sources, such as tests or other student work, and the guide provides suggestions for how these data can be used to inform instructional decisions.
The use of data for school management purposes, rewarding teacher performance, and determining appropriate ways to schedule the school day is beyond the scope of this guide. Schools typically col-lect data on students’ attendance, behav-ior, activities, coursework, and grades, as well as a range of administrative data con-cerning staffing, scheduling, and financ-ing. Some schools even collect perceptual data, such as information from surveys or focus groups with students, teachers, par-ents, or community members. Although many of these data have been used to help inform instructional decision making, there is a growing interest among educa-tors and policy advocates in drawing on these data sources to increase operational efficiency inside and outside of the class-room. This guide does not suggest how districts should use these data sources to implement data-informed management practices, but this omission should not be construed as a suggestion that such data are not valuable for decision making.
Status of the research
Overall, the panel believes that the ex-isting research on using data to make

SCOPE OF THE PRACTICE GUIDE
( 7 )
instructional decisions does not yet pro-vide conclusive evidence of what works to improve student achievement. There are a number of reasons for the lack of compel-ling evidence. First, rigorous experimental studies of some data-use practices are dif-ficult or infeasible to carry out. For exam-ple, it would be impractical to structure a rigorous study investigating the effects of implementing a districtwide data system (recommendation 5) because it is difficult to establish an appropriate comparison that reflects what would have happened in the absence of that system. Second, data-based decision making is closely tied to educational technology. As new technolo-gies are developed, there is often a lag before rigorous research can identify the impacts of those technologies. As a result, there is limited evidence on the effective-ness of the state-of-the-art in data-based decision making. Finally, studies of data- use practices generally look at a bundle of elements, including training teachers on data use, data interpretation, and utiliz-ing the software programs associated with data analysis and storage. Studies typi-cally do not look at individual elements, making it difficult to isolate a specific ele-ment’s contribution to effective use of data to make instructional decisions designed to improve student achievement.
This guide includes five recommendations that the panel believes are a priority to im-plement. However, given the status of the research, the panel does not have compel-ling evidence that these recommendations lead to improved student outcomes. As a result, all of the recommendations are sup-ported by low levels of evidence. While the evidence is low, the recommendations re-flect the panel’s best advice—informed by experience and research—on how teachers and administrators can use data to make instructional decisions that raise student achievement. In other words, while this panel of experts believes these practices will lead to improved student achieve-ment, the panel cannot point to rigorous
research that proves the practices do im-prove student achievement.
Summary of the recommendations
The recommendations in this guide create a framework for effectively using data to make instructional decisions. This frame-work should include a data system that incorporates data from various sources, a data team in schools to encourage the use and interpretation of data, collabora-tive discussion sessions among teachers about data use and student achievement, and instruction for students about how to use their own achievement data to set and monitor educational goals. A central mes-sage of this practice guide is that effective data practices are interdependent among the classroom, school, and district levels. Educators should become familiar with all five recommendations and collaborate with other school and district staff to implement the recommendations concurrently, to the extent that state and district resources and capacity allow. However, readers who are interested in implementing data-driven recommendations in the classroom should focus on recommendations 1 and 2. Read-ers who wish to implement data-driven decision making at the school level should focus on recommendations 3 and 4. Read-ers who wish to bolster district data sys-tems to support data-driven decision mak-ing should focus on recommendation 5. Finally, readers interested in technical in-formation about studies that the panel used to support its recommendations will find such information in Appendix D.
To account for the context of each school and district, this guide offers recommen-dations that can be adjusted to fit their unique circumstances. Examples in this guide are intended to offer suggestions based on the experiences of schools and the expert opinion of the panel, but they should not be construed as the best or only ways to implement the guide’s recommen-dations. The recommendations, described
SCOPE OF THE PRACTICE GUIDE
( 8 )
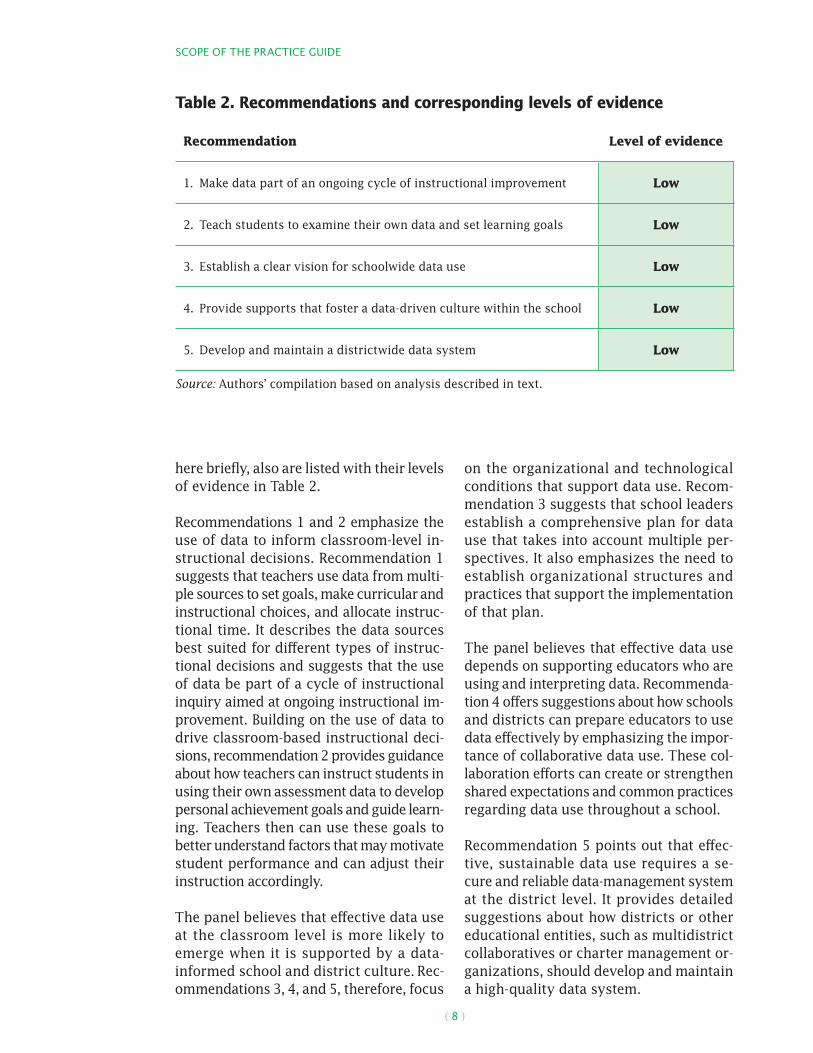
here briefly, also are listed with their levels of evidence in Table 2.
Recommendations 1 and 2 emphasize the use of data to inform classroom-level in-structional decisions. Recommendation 1 suggests that teachers use data from multi-ple sources to set goals, make curricular and instructional choices, and allocate instruc-tional time. It describes the data sources best suited for different types of instruc-tional decisions and suggests that the use of data be part of a cycle of instructional inquiry aimed at ongoing instructional im-provement. Building on the use of data to drive classroom-based instructional deci-sions, recommendation 2 provides guidance about how teachers can instruct students in using their own assessment data to develop personal achievement goals and guide learn-ing. Teachers then can use these goals to better understand factors that may motivate student performance and can adjust their instruction accordingly.
The panel believes that effective data use at the classroom level is more likely to emerge when it is supported by a data-informed school and district culture. Rec-ommendations 3, 4, and 5, therefore, focus
on the organizational and technological conditions that support data use. Recom-mendation 3 suggests that school leaders establish a comprehensive plan for data use that takes into account multiple per-spectives. It also emphasizes the need to establish organizational structures and practices that support the implementation of that plan.
The panel believes that effective data use depends on supporting educators who are using and interpreting data. Recommenda-tion 4 offers suggestions about how schools and districts can prepare educators to use data effectively by emphasizing the impor-tance of collaborative data use. These col-laboration efforts can create or strengthen shared expectations and common practices regarding data use throughout a school.
Recommendation 5 points out that effec-tive, sustainable data use requires a se-cure and reliable data-management system at the district level. It provides detailed suggestions about how districts or other educational entities, such as multidistrict collaboratives or charter management or-ganizations, should develop and maintain a high-quality data system.
Table 2. Recommendations and corresponding levels of evidence
Recommendation Level of evidence
1. Make data part of an ongoing cycle of instructional improvement Low
2. Teach students to examine their own data and set learning goals Low
3. Establish a clear vision for schoolwide data use Low
4. Provide supports that foster a data-driven culture within the school Low
5. Develop and maintain a districtwide data system Low
Source: Authors’ compilation based on analysis described in text.
( 9 )
Checklist for carrying out the recommendations
Recommendation 1. Make data part of an ongoing cycle of instructional improvement
Collect and prepare a variety of data about student learning.
Interpret data and develop hypotheses about how to improve student learning.
Modify instruction to test hypotheses and increase student learning.
Recommendation 2. Teach students to examine their own data and set learning goals
Explain expectations and assessment criteria.
Provide feedback to students that is timely, specific, well formatted, and constructive.
Provide tools that help students learn from feedback.
Use students’ data analyses to guide instructional changes.
Recommendation 3. Establish a clear vision for schoolwide data use
Establish a schoolwide data team that sets the tone for ongoing data use.
Define critical teaching and learning concepts.
Develop a written plan that articulates activities, roles, and responsibilities.
Provide ongoing data leadership.
Recommendation 4. Provide supports that foster a data-driven culture within the school
Designate a school-based facilitator who meets with teacher teams to discuss data.
Dedicate structured time for staff collaboration.
Provide targeted professional devel-opment regularly.
Recommendation 5. Develop and maintain a districtwide data system
Involve a variety of stakeholders in selecting a data system.
Clearly articulate system require-ments relative to user needs.
Determine whether to build or buy the data system.
Plan and stage the implementation of the data system.
( 10 )
Recommendation 1. Make data part of an ongoing cycle of instructional improvement
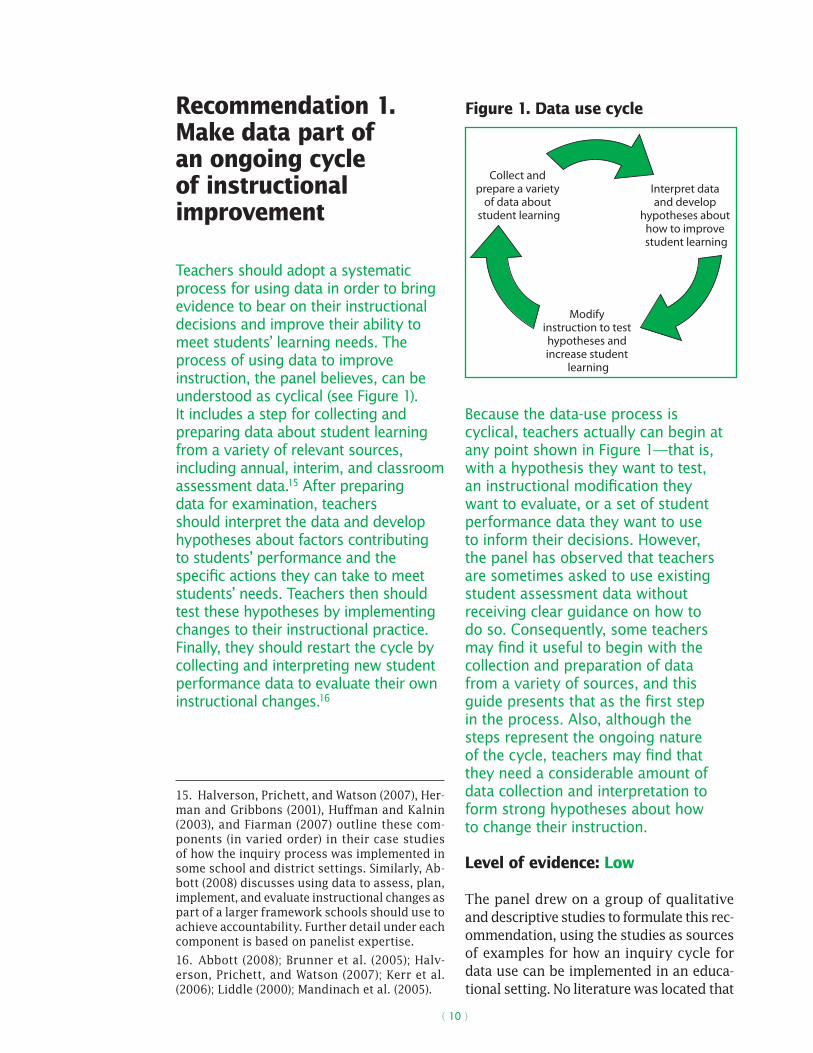
Teachers should adopt a systematic process for using data in order to bring evidence to bear on their instructional decisions and improve their ability to meet students’ learning needs. The process of using data to improve instruction, the panel believes, can be understood as cyclical (see Figure 1). It includes a step for collecting and preparing data about student learning from a variety of relevant sources, including annual, interim, and classroom assessment data.15 After preparing data for examination, teachers should interpret the data and develop hypotheses about factors contributing to students’ performance and the specific actions they can take to meet students’ needs. Teachers then should test these hypotheses by implementing changes to their instructional practice. Finally, they should restart the cycle by collecting and interpreting new student performance data to evaluate their own instructional changes.16
15. Halverson, Prichett, and Watson (2007), Her-man and Gribbons (2001), Huffman and Kalnin (2003), and Fiarman (2007) outline these com-ponents (in varied order) in their case studies of how the inquiry process was implemented in some school and district settings. Similarly, Ab-bott (2008) discusses using data to assess, plan, implement, and evaluate instructional changes as part of a larger framework schools should use to achieve accountability. Further detail under each component is based on panelist expertise.
16. Abbott (2008); Brunner et al. (2005); Halv-erson, Prichett, and Watson (2007); Kerr et al. (2006); Liddle (2000); Mandinach et al. (2005).
Because the data-use process is cyclical, teachers actually can begin at any point shown in Figure 1—that is, with a hypothesis they want to test, an instructional modification they want to evaluate, or a set of student performance data they want to use to inform their decisions. However, the panel has observed that teachers are sometimes asked to use existing student assessment data without receiving clear guidance on how to do so. Consequently, some teachers may find it useful to begin with the collection and preparation of data from a variety of sources, and this guide presents that as the first step in the process. Also, although the steps represent the ongoing nature of the cycle, teachers may find that they need a considerable amount of data collection and interpretation to form strong hypotheses about how to change their instruction.
Level of evidence: Low
The panel drew on a group of qualitative and descriptive studies to formulate this rec-ommendation, using the studies as sources of examples for how an inquiry cycle for data use can be implemented in an educa-tional setting. No literature was located that
Interpret data and develop
hypotheses about how to improve student learning
Collect and prepare a variety
of data about student learning
Modify instruction to test hypotheses and increase student
learning
Figure 1. Data use cycle

RECOMMENDATION 1. MAKE DATA PART OF AN ONGOING CyCLE OF INSTRUCTIONAL IMPROVEMENT
( 11 )
assesses the impact on student achievement of using an inquiry cycle, or individual steps within that cycle, as a framework for data analysis, however, and the panel determined that the level of evidence to support this recommendation is low.
Brief summary of evidence to support the recommendation
The panel considers the inquiry cycle of gathering data, developing and testing hy-potheses, and modifying instruction to be fundamental when using assessment data to guide instruction. Although no causal evidence is available to support the effective-ness of this cycle, the panel draws on studies that did not use rigorous designs for exam-ples of the three-point cycle of inquiry—the underlying principle of this recommenda-tion—and provides some detail on the con-text for those examples in Appendix D.
How to carry out this recommendation
1. Collect and prepare a variety of data about student learning.
To gain a robust understanding of stu-dents’ learning needs, teachers need to collect data from a variety of sources. Such sources include but are not limited to annual state assessments, district and school assessments, curriculum-based as-sessments, chapter tests, and classroom projects. In most cases, teachers and their schools already are gathering these kinds of data, so carrying out data collection de-pends on considering the strengths, limita-tions, and timing of each data type and on preparing data in a format that can reveal patterns in student achievement. More-over, by focusing on specific questions about student achievement, educators can prioritize which types of data to gather to inform their instructional decisions.17
17. Bigger (2006); Cromey and Hanson (2000); Herman and Gribbons (2001); Huffman and
Each assessment type has advantages and limitations (e.g., high-stakes accountability tests may be subject to score inflation and may lead to perverse incentives).18 There-fore, the panel believes that multiple data sources are important because no single assessment provides all the information teachers need to make informed instruc-tional decisions. For instance, as teachers begin the data-use process for the first time or begin a new school year, the accessibil-ity and high-stakes importance of students’ statewide, annual assessment results pro-vide a rationale for looking closely at these data. Moreover, these annual assessment data can be useful for understanding broad areas of relative strengths and weaknesses among students, for identifying students or groups of students who may need particu-lar support,19 and for setting schoolwide,20 classroom, grade-level, or department-level goals for students’ annual performance.
However, teachers also should recognize that significant time may have passed between the administration of these an-nual assessments and the beginning of the school year, and students’ knowledge and skills may have changed during that time. It is important to gather additional information at the beginning of the year to supplement statewide test results. In addi-tion, the panel cautions that overreliance on a single data source, such as a high-stakes accountability test, can lead to the overalignment of instructional practices with that test (sometimes called “teaching to the test”), resulting in false gains that are not reflected on other assessments of the same content.21
Kalnin (2003); Lachat and Smith (2005); Supo-vitz (2006).
18. Koretz (2003); Koretz and Barron (1998).
19. Halverson, Prichett, and Watson (2007); Her-man and Gribbons (2001); Lachat and Smith (2005); Supovitz and Klein (2003); Wayman and Stringfield (2006).
20. Halverson, Prichett, and Watson (2007).
21. Hamilton (2003); Koretz and Barron (1998).

RECOMMENDATION 1. MAKE DATA PART OF AN ONGOING CyCLE OF INSTRUCTIONAL IMPROVEMENT
( 12 )
To gain deeper insight into students’ needs and to measure changes in students’ skills during the academic year, teachers also can collect and prepare data from interim assessments that are administered consis-tently across a district or school at regular intervals throughout the year (see the box below).22 As with annual assessments, in-terim assessment results generally have the advantage of being comparable across classrooms, but the frequency of their ad-ministration means that teachers can use the data to evaluate their own instructional strategies and to track the progress of their current students in a single school year. For instance, data from a districtwide interim assessment could help illuminate whether the students who were struggling to con-vert fractions to decimals improved after receiving targeted small group instruction, or whether students’ expository essays
22. Standards for testing in educational envi-ronments are discussed in more detail in Amer-ican Educational Research Association (AERA), American Psychological Association (APA), and National Council on Measurement in Education (NCME) (1999).
improved after a unit spent reading and analyzing expository writing.
Finally, it is important to collect and prepare classroom performance data for examina-tion, including examples and grades from students’ unit tests, projects, classwork, and homework. The panel recommends using these classroom-level data sources, in con-junction with widely accessible nonachieve-ment data such as attendance records and cumulative files,23 to interpret annual and interim assessment results (see the box on page 13). An important advantage of these data sources is that in most cases, they can be gathered quickly to provide teachers with immediate feedback about student learning. Depending on the assignment in question, they also can provide rich, detailed exam-ples of students’ academic performance, thereby complementing the results of an-nual or interim tests. For example, if state and interim assessments show that students have difficulty writing about literature, then examination of students’ analytic essays, book reports, or reading-response journals can illuminate how students are accustomed to writing about what they read and can sug-gest areas in which students need additional guidance.24 An important disadvantage of classroom-level data is that the assignments, conditions, and scores are not generally comparable across classrooms. However, when teachers come together to examine students’ work, this variability also can be an advantage, since it can reveal discrepan-cies in expectations and content coverage that teachers can take steps to remedy.
As teachers prepare annual, interim, and classroom-level data for analysis, they should represent the information in
23. The following studies provide examples of available data sources: Owings and Follo (1992); Halverson, Prichett, and Watson (2007); Jones and Krouse (1988); Supovitz and Klein (2003); Supovitz and Weathers (2004); Wayman and Stringfield (2006).
24. This example is drawn and adapted from a case study by Fiarman (2007).
Characteristics of interim assessments
• Administered routinely (e.g., each semester, quarter, or month) throughout a school year
• Administered in a consistent manner across a particular grade level and/or content area within a school or district
• May be commercial or developed in-house
• May be administered on paper or on a computer
• May be scored by a computer or a person

RECOMMENDATION 1. MAKE DATA PART OF AN ONGOING CyCLE OF INSTRUCTIONAL IMPROVEMENT
( 13 )
Examples of classroom and other data
• Curriculum-based unit tests
• Class projects
• Classwork and homework
• Attendance records
• Records from parent meetings and phone calls
• Classroom behavior charts
• Individualized educational plans (IEPs)
• Prior data from students’ cumula-tive folders
aggregate forms that address their own questions and highlight patterns of in-terest. For instance, if a teacher wanted to use four waves of interim test data to learn whether students who started the year with weaker mathematics skills were narrowing the gap with their peers, she could make a line graph tracking students’
progress on the interim math assessments throughout the year. On the graph, she might create separate lines for students from each performance quartile on the previous year’s state mathematics assess-ment (see Figure 2). Such a graph would allow her to compare the growth trajec-tories for each group, although she would need to be certain that each quartile group contained numerous students, thereby en-suring that results were not driven by one or two outliers. (Some data systems will include features that make graphing easier and more automatic. See recommendation 5 for more information on data systems.)
In general, preparing state and district data for analysis will be easier for teachers who have access to the kind of districtwide data systems described in recommendation 5, although these teachers still will need to maintain useful records of classroom-level data. Online gradebooks that allow teach-ers to prepare aggregate statistics by class-room, content area, or assignment type can be useful for identifying patterns in stu-dents’ classroom-level performance and for identifying students whose classwork per-formance is inconsistent with their perfor-mance on annual or interim assessments.
Figure 2. Example of classroom running records performance at King Elementary School
Source: Supovitz and Klein (2003).
RECOMMENDATION 1. MAKE DATA PART OF AN ONGOING CyCLE OF INSTRUCTIONAL IMPROVEMENT
( 14 )
2. Interpret data and develop hypotheses about how to improve student learning.
Working independently or in teams, teach-ers should interpret the data they have collected and prepared. In interpreting the data, one generally useful objective is to identify each class’s overall areas of relative strengths and weaknesses so that teachers can allocate instructional time and resources to the content that is most pressing. Another useful objective is to identify students’ individual strengths and weaknesses so that teachers can adapt their assignments, instructional methods, and feedback in ways that address those individual needs. For instance, teachers may wish to adapt students’ class project assignments in ways that draw on stu-dents’ individual strengths while encour-aging them to work on areas for growth.
To gain deeper insight into students’ learn-ing needs, teachers should examine evi-dence from the multiple data sources they prepared in action step 1.25 “Triangulation” is the process of using multiple data sources to address a particular question or problem and using evidence from each source to illuminate or temper evidence from the other sources. It also can be thought of as using each data source to test and confirm evidence from the other sources in order to arrive at well-justified conclusions about students’ learning needs. When multiple data sources (e.g., results from the annual state assessment and district interim as-sessment) show similar areas of student strength and weakness (as in Example 1), teachers can be more confident in their decisions about which skills to focus on. In contrast, when one test shows students struggling in a particular skill and another test shows them performing well in that skill, teachers need to look closely at the items on both tests to try to identify the
25. Halverson, Prichett, and Watson (2007); Her-man and Gribbons (2001); Lachat and Smith (2005); Wayman and Stringfield (2006).
source of the discrepancy. In all cases, they should use classroom and other data to shed light on the particular aspects of the skill with which students need extra help.
As they triangulate data from multiple sources, teachers should develop hypoth-eses about ways to improve the achieve-ment patterns they see in the data. As the box on page 15 explains, good hypoth-eses emerge from existing data, identify instructional or curricular changes likely to improve student learning, and can be tested using future assessment data. For example, existing data can reveal places in which the school’s curriculum is not well aligned with state standards. In those situ-ations, teachers might reasonably hypoth-esize that reorganizing the curriculum to address previously neglected material will improve students’ mastery of the standards. In other cases, teachers may hypothesize that they need to teach the same content in different ways. Taking into account how they and their colleagues have previously taught particular skills can help teachers choose among plausible hypotheses. For instance, teachers may find that students have diffi-culty identifying the main idea of texts they read. This weak student performance may lead teachers to hypothesize that the skill should be taught differently. In talking to other teachers, they might choose a differ-ent teaching strategy, such as a discussion format in which students not only identify the main idea of a text but also debate its evidence and merits.
To foster such sharing of effective practices among teachers, the panel recommends that teachers interpret data collaboratively in grade-level or department-specific teams. In this way, teachers can begin to adopt some common instructional and assess-ment practices as well as common expec-tations for student performance.26 Col-laboration also allows teachers to develop
26. Fiarman (2007); Halverson, Prichett, and Wat-son (2007); Halverson et al. (2007).
RECOMMENDATION 1. MAKE DATA PART OF AN ONGOING CyCLE OF INSTRUCTIONAL IMPROVEMENT
( 15 )
a collective understanding of the needs of individual students in their school, so that they can work as an organization to provide support for all students.
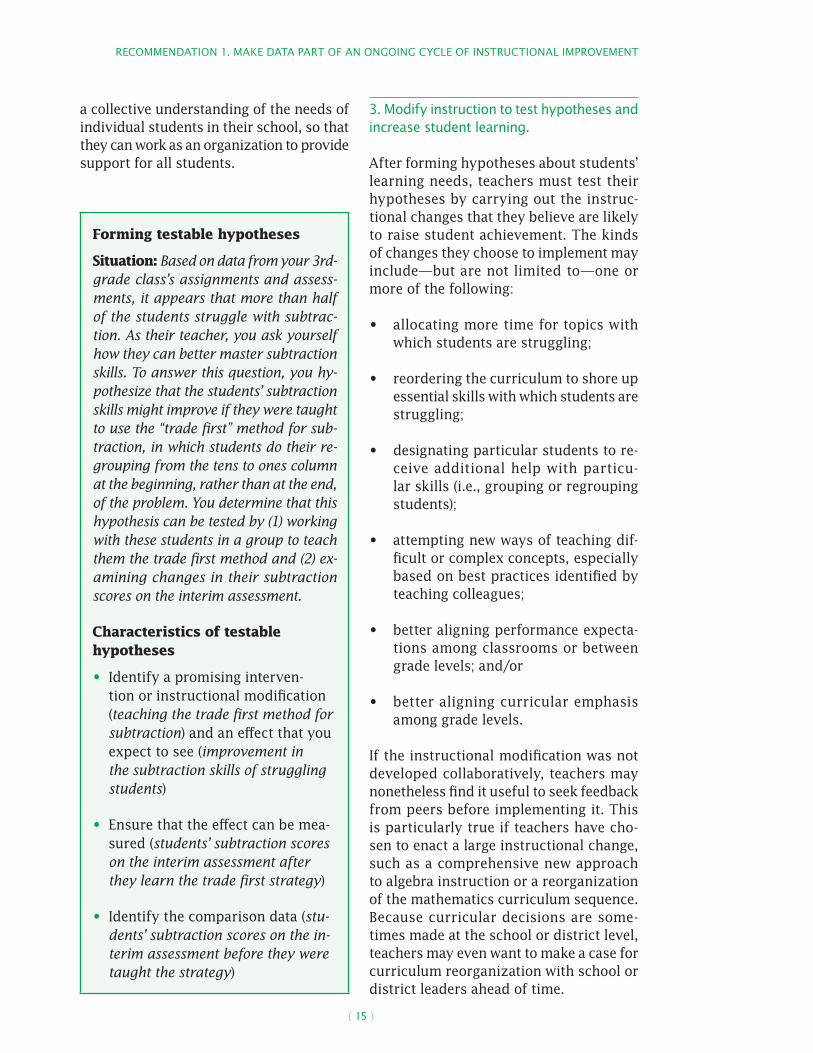
3. Modify instruction to test hypotheses and increase student learning.
After forming hypotheses about students’ learning needs, teachers must test their hypotheses by carrying out the instruc-tional changes that they believe are likely to raise student achievement. The kinds of changes they choose to implement may include—but are not limited to—one or more of the following:
• allocating more time for topics with which students are struggling;
• reordering the curriculum to shore up essential skills with which students are struggling;
• designating particular students to re-ceive additional help with particu-lar skills (i.e., grouping or regrouping students);
• attempting new ways of teaching dif-ficult or complex concepts, especially based on best practices identified by teaching colleagues;
• better aligning performance expecta-tions among classrooms or between grade levels; and/or
• better aligning curricular emphasis among grade levels.
If the instructional modification was not developed collaboratively, teachers may nonetheless find it useful to seek feedback from peers before implementing it. This is particularly true if teachers have cho-sen to enact a large instructional change, such as a comprehensive new approach to algebra instruction or a reorganization of the mathematics curriculum sequence. Because curricular decisions are some-times made at the school or district level, teachers may even want to make a case for curriculum reorganization with school or district leaders ahead of time.
Forming testable hypotheses
Situation: Based on data from your 3rd-grade class’s assignments and assess-ments, it appears that more than half of the students struggle with subtrac-tion. As their teacher, you ask yourself how they can better master subtraction skills. To answer this question, you hy-pothesize that the students’ subtraction skills might improve if they were taught to use the “trade first” method for sub-traction, in which students do their re-grouping from the tens to ones column at the beginning, rather than at the end, of the problem. You determine that this hypothesis can be tested by (1) working with these students in a group to teach them the trade first method and (2) ex-amining changes in their subtraction scores on the interim assessment.
Characteristics of testable hypotheses
• Identify a promising interven-tion or instructional modification (teaching the trade first method for subtraction) and an effect that you expect to see (improvement in the subtraction skills of struggling students)
• Ensure that the effect can be mea-sured (students’ subtraction scores on the interim assessment after they learn the trade first strategy)
• Identify the comparison data (stu-dents’ subtraction scores on the in-terim assessment before they were taught the strategy)

RECOMMENDATION 1. MAKE DATA PART OF AN ONGOING CyCLE OF INSTRUCTIONAL IMPROVEMENT
( 16 )
The time it takes teachers to carry out their instructional changes will depend in part on the complexity of the changes. If teach-ers are delivering a discrete lesson plan or a series of lessons, then the change usually can be carried out quickly. Larger interven-tions take longer to roll out than smaller ones. For instance, a teacher whose inter-vention involves introducing more collab-orative learning into the classroom may need time to teach her students to work efficiently in small group settings.
During or shortly after carrying out an in-structional intervention, teachers should take notes on how students responded and how they as teachers might modify deliv-ery of the intervention in future classes. These notes may not only help teachers reflect on their own practice but also pre-pare them to share their experiences and insights with other teachers.
To evaluate the effectiveness of the in-structional intervention, teachers should return to action step 1 by collecting and preparing a variety of data about student learning. For instance, they can gather classroom-level data, such as students’ classwork and homework, to quickly eval-uate student performance after the inter-vention.27 Teachers can use data from later interim assessments, such as a quarterly district test, to confirm or challenge their immediate, classroom-level evidence.
Finally, after triangulating data and con-sidering the extent to which student learn-ing did or did not improve in response to the intervention, teachers can decide whether to keep pursuing the approach in its current form, modify or extend the approach, or try a different approach alto-gether. It is important to bear in mind that not all instructional changes bear fruit im-mediately, so before discarding an instruc-tional intervention as ineffective, teachers
27. Forman (2007).
should give themselves and their students time to adapt to it.28
Potential roadblocks and solutions
Roadblock 1.1. Teachers have so much data that they are not sure where they should focus their attention in order to raise student achievement.
Suggested Approach. Teachers can nar-row the range of data needed to solve a particular problem by asking specific ques-tions and concretely identifying the data that will answer those questions. In ad-dition, administrators can guide this pro-cess by setting schoolwide goals that help clarify the kinds of data teachers should be examining and by asking questions about how classroom practices are advancing those goals. For instance, if administrators have asked teachers to devote particular effort to raising students’ reading achieve-ment, teachers may decide to focus atten-tion on evidence from state, interim, and classroom assessments about students’ reading needs. Teachers should then tri-angulate data from multiple sources (as described earlier) to develop hypotheses about instructional changes likely to raise student achievement. Note that recommen-dation 3 describes how administrators, data facilitators, and other staff can help teach-ers use data in ways that are clearly aligned with the school’s medium- and long-term student achievement goals. Also, recom-mendation 4 describes how professional development and peer collaboration can help teachers become more adept at data preparation and triangulation.
Roadblock 1.2. Some teachers work in a grade level or subject area (such as early elementary and advanced high school grades) or teach certain subjects (such as social studies, music, science, or physical education) for which student achievement data are not readily available.
28. Elmore (2003).
RECOMMENDATION 1. MAKE DATA PART OF AN ONGOING CyCLE OF INSTRUCTIONAL IMPROVEMENT
( 17 )
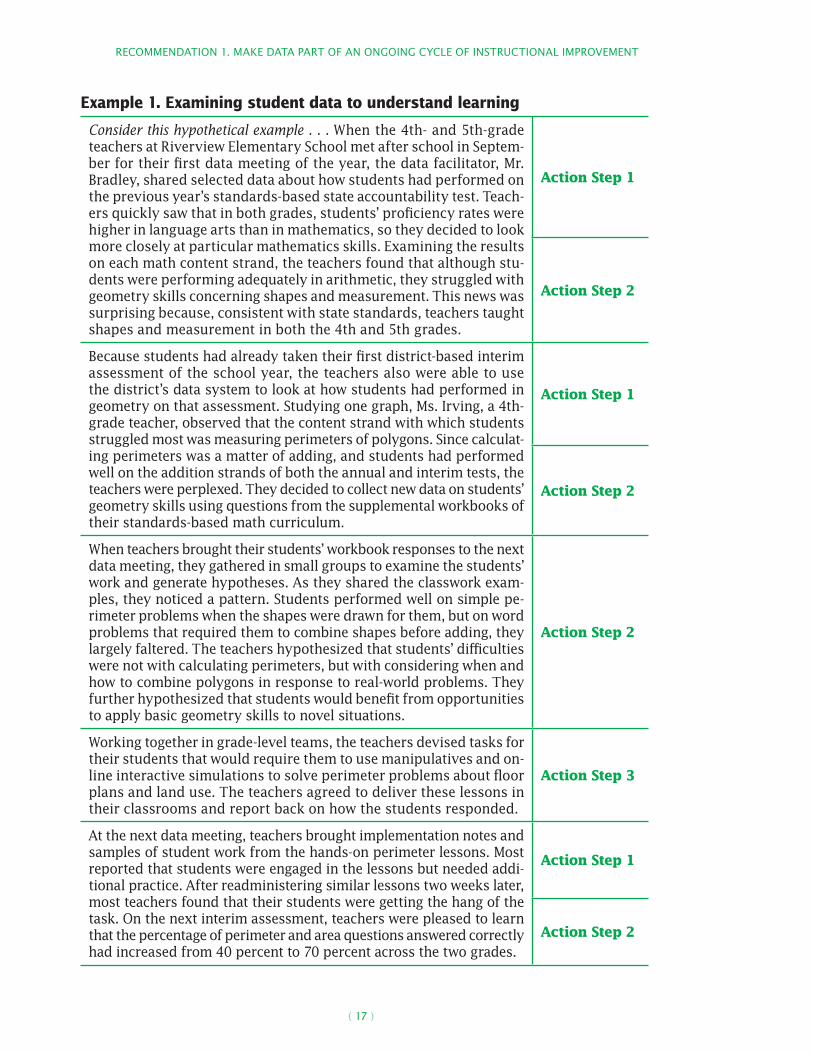
Example 1. Examining student data to understand learning
Consider this hypothetical example . . . When the 4th- and 5th-grade teachers at Riverview Elementary School met after school in Septem-ber for their first data meeting of the year, the data facilitator, Mr. Bradley, shared selected data about how students had performed on the previous year’s standards-based state accountability test. Teach-ers quickly saw that in both grades, students’ proficiency rates were higher in language arts than in mathematics, so they decided to look more closely at particular mathematics skills. Examining the results on each math content strand, the teachers found that although stu-dents were performing adequately in arithmetic, they struggled with geometry skills concerning shapes and measurement. This news was surprising because, consistent with state standards, teachers taught shapes and measurement in both the 4th and 5th grades.
Action Step 1
Action Step 2
Because students had already taken their first district-based interim assessment of the school year, the teachers also were able to use the district’s data system to look at how students had performed in geometry on that assessment. Studying one graph, Ms. Irving, a 4th-grade teacher, observed that the content strand with which students struggled most was measuring perimeters of polygons. Since calculat-ing perimeters was a matter of adding, and students had performed well on the addition strands of both the annual and interim tests, the teachers were perplexed. They decided to collect new data on students’ geometry skills using questions from the supplemental workbooks of their standards-based math curriculum.
Action Step 1
Action Step 2
When teachers brought their students’ workbook responses to the next data meeting, they gathered in small groups to examine the students’ work and generate hypotheses. As they shared the classwork exam-ples, they noticed a pattern. Students performed well on simple pe-rimeter problems when the shapes were drawn for them, but on word problems that required them to combine shapes before adding, they largely faltered. The teachers hypothesized that students’ difficulties were not with calculating perimeters, but with considering when and how to combine polygons in response to real-world problems. They further hypothesized that students would benefit from opportunities to apply basic geometry skills to novel situations.
Action Step 2
Working together in grade-level teams, the teachers devised tasks for their students that would require them to use manipulatives and on-line interactive simulations to solve perimeter problems about floor plans and land use. The teachers agreed to deliver these lessons in their classrooms and report back on how the students responded.
Action Step 3
At the next data meeting, teachers brought implementation notes and samples of student work from the hands-on perimeter lessons. Most reported that students were engaged in the lessons but needed addi-tional practice. After readministering similar lessons two weeks later, most teachers found that their students were getting the hang of the task. On the next interim assessment, teachers were pleased to learn that the percentage of perimeter and area questions answered correctly had increased from 40 percent to 70 percent across the two grades.
Action Step 1
Action Step 2
RECOMMENDATION 1. MAKE DATA PART OF AN ONGOING CyCLE OF INSTRUCTIONAL IMPROVEMENT
( 18 )
Suggested Approach. Part of the work of collaborative data use involves estab-lishing shared learning goals and expec-tations across classrooms.29 District or school administrators can help this effort by providing an interim, schoolwide assess-ment, ideally linked to state standards, that allows the comparison of results across classrooms.30 Alternatively, teachers can collaborate to develop their own interim assessments. Some schools, for instance, develop interim writing prompts or other assessments that are administered through-out the school and scored using a common rubric.31 (Example 5 in recommendation 2 illustrates this approach.) Although in-house assessments may lack the validity of commercially developed tests, they never-theless provide common metrics by which teachers can assess their students and share results with colleagues.32 Similarly, teachers of supplemental subjects such as art, music, and physical education can de-velop performance assessments linked to schoolwide student goals.33
Roadblock 1.3. Some schools or districts encourage staff to use data to identify stu-dents scoring just below proficiency on state tests and to focus disproportionate effort on helping them reach proficiency.
Suggested Approach. Teachers and princi-pals in some schools have reported focusing extra resources on “bubble kids,” or students scoring immediately below a proficiency cut-off on a high-stakes assessment.34 The panel cautions against this practice because results from any single test are imprecise
29. Datnow, Park, and Wohlstetter (2007); Wil-liams Rose (2006); Rossmiller and Holcomb (1993); Togneri (2003); Wayman, Cho, and John-ston (2007).
30. Wayman, Midgley, and Stringfield (2006).
31. See, for example, Fiarman (2007).
32. Shepard et al. (1996).
33. See, for example, Forman (2007).
34. Booher-Jennings (2005); Brunner et al. (2005); Hamilton et al. (2007); Long et al. (2008).
and always should be considered in con-junction with other data. Also, undue focus on students scoring near proficiency may lead schools to distribute instructional re-sources inappropriately.35 For instance, stu-dents scoring further from the cut score (in either direction) may have just as many—if not more—distinctive instructional needs as those scoring near the cut score. Instead of focusing mainly on students scoring just below proficiency on a particular assess-ment, educators should use data from mul-tiple sources to identify and serve the needs of all students. When possible, additional re-sources and support should be directed to-ward students whose needs are the greatest. (See the What Works Clearinghouse guides on Response to Intervention for more sug-gestions on tiered student support.)
Roadblock 1.4. Some district leaders sug-gest that schools assign students to courses based solely on proficiency levels on the state accountability test.
Suggested Approach. Tests should be used for the purposes for which they have been validated; most existing assessments have not been validated for the purpose of making decisions about course place-ment. In addition, the professional stan-dards for appropriate use of test scores in educational settings state that a single test score should not be used to make high-stakes decisions about individuals; instead, educators and administrators should consider multiple sources of in-formation when assigning students to courses or programs.36 Proficiency on a state accountability test can provide one indicator of a student’s readiness or need for a specific instructional program, but other information, such as prior perfor-mance in similar courses, should be taken into account. Finally, educators should re-consider decisions about placement when new data become available.
35. Booher-Jennings (2005).
36. AERA, APA, and NCME (1999).

( 19 )
Recommendation 2. Teach students to examine their own data and set learning goals
Teachers should provide students with explicit instruction on using achievement data regularly to monitor their own performance and establish their own goals for learning. This data analysis process—similar to the data use cycle for teachers described in recommendation 1—can motivate both elementary and secondary students by mapping out accomplishments that are attainable, revealing actual achievement gains and providing students with a sense of control over their own outcomes. Teachers can then use these goals to better understand factors that may motivate student performance and adjust their instructional practices accordingly.
Students are best prepared to learn from their own achievement data when they understand the learning objectives and when they receive data in a user-friendly format. Tools such as rubrics provide students with a clear sense of learning objectives, and data presented in an accessible and descriptive format can illuminate students’ strengths and weaknesses (see recommendation 5 for more information on reporting formats).37 Many practices around data rely on the assumption38 of a relationship between formative assessment and feedback
37. Black et al. (2003).
38. Black and Wiliam (1998) and Kluger and De-Nisi (1996) examine the relationship between as-sessment and student learning in their respective meta-analyses on the topic. However, the studies included in those meta-analyses were outside the date range or otherwise outside the scope of the literature review for this guide, or they
use and student achievement. When combined with clear data, instructional strategies such as having students rework incorrect problems can enhance student learning.39
Level of evidence: Low
The panel judged the level of evidence supporting this recommendation to be low, based on two studies with causal designs that met WWC standards and drawing on additional examples of practices from qualitative and descriptive studies and on their own expertise. One randomized controlled trial that met WWC standards with reservations found positive effects of interventions that combined student analysis of data with other practices, such as teacher coaching, teacher professional development, and/or classroom manage-ment interventions; therefore, the panel could not attribute impacts to student data analysis alone.40 A second random-ized controlled trial met WWC standards and reported positive effects of a web-based data tool for students, but the size and statistical significance of these ef-fects could not be confirmed by the WWC; therefore, it does not provide the panel with strong causal evidence that having students examine their own data is an ef-fective intervention.41
Brief summary of evidence to support the recommendation
Two randomized controlled trials that met WWC standards (one with and one without reservations) found positive effects of in-terventions in which students used their own assessment data. One study found that curriculum-based measurement inter-ventions combined with student analysis
used noncausal designs that did not meet WWC evidence standards.
39. Clymer and Wiliam (2007).
40. Phillips et al. (1993).
41. May and Robinson (2007).

RECOMMENDATION 2. TEACH STUDENTS TO ExAMINE THEIR OWN DATA AND SET LEARNING GOALS
( 20 )
of their own assessment data and feedback from their teachers led to statistically sig-nificant gains in student achievement.42 A second study reported statistically sig-nificant gains in achievement for students given access to an interactive website re-porting student test scores and providing advice for improving those scores. How-ever, the WWC could not confirm the statis-tical significance of these gains.43 To add detail and specificity to this recommenda-tion, and to supplement the information available in these two studies, the panel relied upon its own expertise and referred to several case studies and descriptive analyses of examples of feedback and to provide information needed to construct sample feedback tools.
How to carry out this recommendation
1. Explain expectations and assessment criteria.
To interpret their own achievement data, students need to understand how their performance fits within the context of classroom-level or schoolwide expecta-tions. Teachers should articulate the con-tent knowledge or skills that they expect students to achieve throughout the school year, conveying goals for individual les-sons and assignments, as well as goals for the unit and end-of-year performance. Teachers should explicitly describe the criteria that will be used to assess perfor-mance toward those goals.
For example, when teachers use a rubric to provide feedback (an example is provided in Example 2), teachers should introduce the rubric at the beginning of the assign-ment so that students know which criteria are important before they begin working on a task or assignment.44 Rubrics can provide
42. Phillips et al. (1993).
43. May and Robinson (2007).
44. Lane et al. (1997).
useful feedback on complex skills such as writing an effective essay or term paper, delivering a persuasive speech, or execut-ing a science experiment. Teachers also can have students assess a sample assignment using the rubric to help them better under-stand the criteria. Once the students’ actual assignments are completed and evaluated, students should receive the completed ru-bric from the teacher.
Because public school students in many grades are required to take annual stan-dards-based accountability tests in se-lected subjects, teachers should help stu-dents understand the state standards they are expected to meet by regularly revisit-ing the standards throughout the year. For example, a 5th-grade teacher could spend a few minutes at the beginning of an in-structional unit explaining that certain essential concepts in the lesson (e.g., lit-erary devices such as similes) may appear on the annual test. Students could keep a running list of these standards-based concepts throughout the year, using the list as a basis for review before the annual test. Note that making students familiar with content standards is not the same as engaging in extensive practice using problems or tasks designed to mirror the format of a specific test. The latter may result in spurious test-score gains and is not recommended by the panel.45
2. Provide feedback to students that is timely, specific, well formatted, and constructive.
Providing students with thoughtful and con-structive feedback on their progress may improve academic achievement.46 Feedback should be designed to help students under-stand their own strengths and weaknesses, explaining why they received the grades and scores they did and identifying the specific content areas the student should focus on
45. Hamilton (2003).
46. May and Robinson (2007); Phillips et al. (1993).

RECOMMENDATION 2. TEACH STUDENTS TO ExAMINE THEIR OWN DATA AND SET LEARNING GOALS
( 21 )
Example 2. Example of a rubric for evaluating five-paragraph essays
1 Beginning 2 Developing 3 Accomplished 4 Exemplary
Organization and Content
Introduction paragraph
•Centralargumentis unclear
•Centralargument is vaguely indicated
•Centralargumentis clearly stated
•Centralargument is clearly stated in a way that commands attention
Body paragraphs •Nonehaveclearmain ideas
•Providelittle to no evidence to support the central argument
•Somehaveclearmain ideas
•Provideweak or unconvincing evidence to support the central argument
•Allhaveclearmain ideas
•Providemostlyconvincing evidence to support the central argument
•Allhaveclearmain ideas that are smoothly connected to other ideas in the essay
•Provideinsightful and compelling evidence to support the central argument
Concluding paragraph
•Doesnotsumma-rize main points of the essay
•Doesnotrestatecentral argument
•Summarizes some main points of the essay
•Restatescentralargument in a repetitive way
•Summarizesmainpoints of the essay accurately
•Restatescentralargument in a new way
•Summarizesmainpoints in a way that commands attention
•Restatescentralargument in a new and thought-provoking way
Overall organization
•Paragraphtran-sitions are sudden and not smooth
•Organizationofideas is not clear
•Paragraphtran-sitions are some-times awkward
•Ideasshowsomeorganization
•Paragraphtransi-tions are present
•Ideasare organized in a logical way
•Paragraphtransi-tions are seamless
•Ideasareorga-nized in a logical and engaging way
Overall content •Ideasseem unoriginal and/ or unconvincing
•Ideasseemsome-what reasonable
•Ideasseemlogicaland convincing
•Ideasseem unusually insightful or illuminating
Grammar and Usage
Paragraphing •Doesnotuseparagraph breaks and indentations to separate important ideas
•Usesparagraphbreaks and indenta-tions inconsistently or in illogical places
•Usesparagraphbreaks and indenta-tions consistently
•Usesparagraphbreaks consistently and very accurately
Capitalization •Includesmanycapitalization errors
•Includesseveral capitalization errors
•Includesafewcapitalization errors
•Freeofcapitaliza-tion errors
Sentence structure
•Includesnumerousfragments and/or run-on sentences
•Includesoccasionalfragments and/or run-on sentences
•Freeoffragmentsand run-on sentences
•Freeoffragmentsand run-on sen-tences, and uses varied sentence structures
Punctuation •Includesmanypunctuation errors
•Includesseveralpunctuation errors
•Includesafewpunctuation errors
•Freeofpunctua-tion errors

RECOMMENDATION 2. TEACH STUDENTS TO ExAMINE THEIR OWN DATA AND SET LEARNING GOALS
( 22 )
to improve their scores. Such feedback often has the following characteristics:
• Timely. Feedback should be rapid so that students still remember the task and the skills on which they were being assessed.47 The panel recom-mends that assessment data be re-turned to students within a week of collecting the assignment, and sooner when possible.
• Appropriately formatted. When pro-viding feedback, teachers should se-lect a mode of delivery (e.g., rubric based, handwritten, or typed) that best meets students’ needs based on their grade level, the subject area, and the assignment. Typed feedback, for ex-ample, may be appropriate in response to students’ larger projects, whereas handwritten feedback may suffice on short assignments and student jour-nals or as supplemental feedback at the end of a rubric-based evaluation. Additionally, teachers’ feedback should be based on a shared understanding of expectations and scoring criteria.
• Specific and constructive. Regard-less of the format, feedback should provide concrete information and sug-gestions for improvement.48 Feedback in the form of explanations, exam-ples, and suggestions for additional practice is more concrete and easier for students to act on than a score or letter grade alone, and it may in-crease students’ confidence and mo-tivate better performance.49 For this reason, teachers should avoid pro-viding feedback that is exclusively focused on what should have been done or delivers vague praise without
47. Black and Wiliam (1998); Stiggins (2007).
48. Black and Wiliam (1998); Brunner et al. (2005).
49. Clymer and Wiliam (2007); Schunk and Swartz (1992).
specifying why a particular piece of work is praiseworthy.50
3. Provide tools that help students learn from feedback.
Simply giving students assessment data that are accessible and constructive does not guarantee that they will know what to do with the data. Students need the time and tools to analyze the feedback; other-wise, they may simply glance at the over-all score without considering why they achieved that score and what they could do to improve.
When providing feedback, teachers should set aside 10 to 15 minutes of classroom instructional time to allow students to in-terpret and learn from the data. It is im-portant to undertake this reflection dur-ing class time, when the teacher can help students interpret feedback and strategize ways to improve their performance. Dur-ing this time, teachers should have stu-dents individually review written feedback and ask questions about that feedback.
Teachers also can provide students with paper- or computer-based tools for inter-preting feedback, such as the following:
• a template for listing strengths, weak-nesses, and areas to focus on for a given task (see Example 3);51
• a list of questions for students to consider and respond to (e.g., “Can I beat my highest score in the next two weeks?” and “Which skills can I work harder on in the next two weeks?”);52
• worksheets to facilitate reflection about incorrect items (see Example 4);53
50. Black et al. (2003); Black and Wiliam (1998); Shepard (1995).
51. Stiggins (2007).
52. Phillips et al. (1993).
53. Stiggins (2007).

RECOMMENDATION 2. TEACH STUDENTS TO ExAMINE THEIR OWN DATA AND SET LEARNING GOALS
( 23 )
• teacher-generated graphs that track student progress over time;54 and/or
• grids on which students can re-cord baseline and interim scores to track gains over time in specific dimensions.55
For example, after returning test results to students at the beginning of the school year, a teacher might ask all students to identify specific strengths and weaknesses by analyzing their responses to specific questions on the test. She could then guide the students to submit in writing realis-tic improvement goals for two particular skills with weak scores. Students with no demonstrated weaknesses could be invited to select a topic for which enrichment could be provided. By helping students make data-based decisions about their own learning goals, the teacher would be emphasizing their responsibility for im-proving their own learning.
54. Clymer and Wiliam (2007); Stecker (1993).
55. Lane et al. (1997).
It also is possible to use reflective data tools in subjects such as math, for which rubrics are less common. For instance, Ex-ample 4 illustrates a worksheet students might use for understanding the errors they made on a mathematics test. The pur-pose of such a tool is for students to learn to diagnose their own errors, distinguish-ing careless mistakes from concepts that they still need to master.
4. Use students’ data analyses to guide in-structional changes.
Although data analysis tools help students learn from teacher feedback, they also pro-vide valuable information that teachers can use to inform instruction. Teachers should collect and review students’ goals and analyses to identify content areas and skills that need to be reinforced and fac-tors that may motivate student learning. For example, teachers can
• review error worksheets (see Example 4) to identify concepts that need to be retaught;
Example 3. Example of a student’s worksheet for reflecting on strengths and weaknesses
Areas of Strength and Areas for Growth
Topic: Writing a Five-Paragraph Essay
Based on: Rubric-based feedback from my last two essays
Name: Jane B. Student
Areas of Strength Areas for Growth
Organization and Content• Stating main idea in first paragraph• Restating main idea in conclusion• Choosing a topic I know well
Organization and Content• Need to state main idea of each
body paragraph• Need to provide examples in each
body paragraph
Grammar and Usage• Indenting paragraphs• Correctly capitalizing sentences and
proper nouns
Grammar and Usage• Using quotations correctly• Avoiding sentence fragments
(example: “Because he wanted to.”)
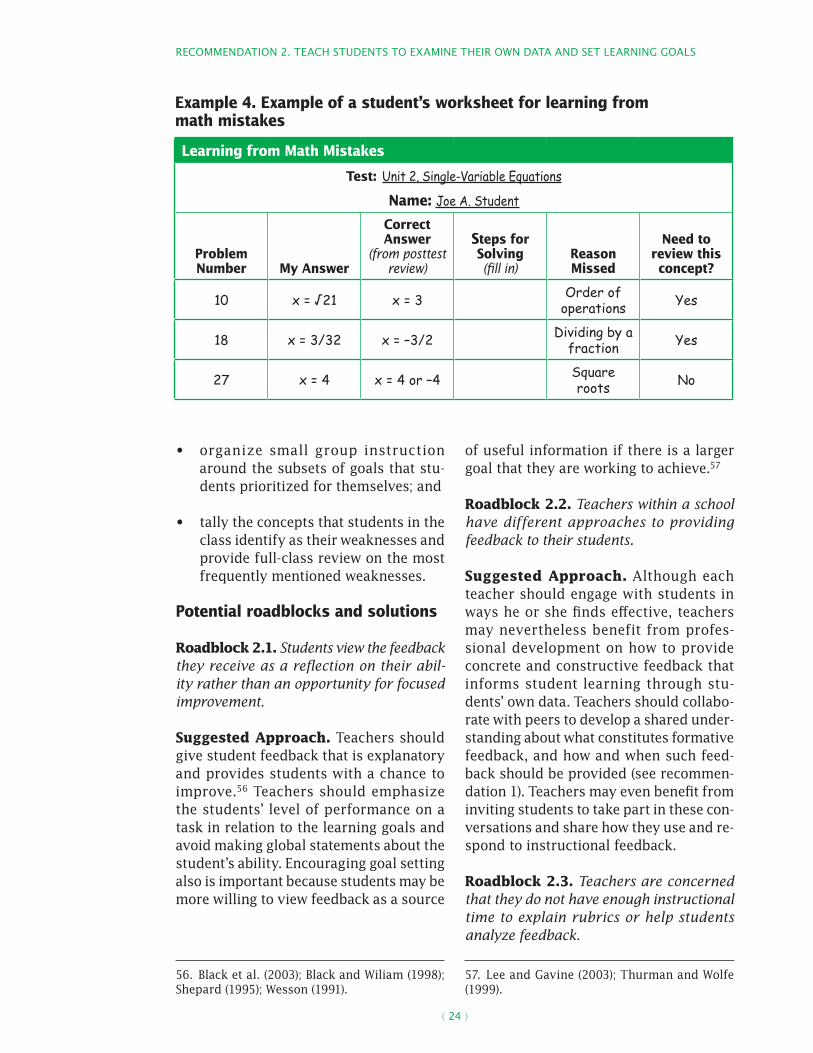
RECOMMENDATION 2. TEACH STUDENTS TO ExAMINE THEIR OWN DATA AND SET LEARNING GOALS
( 24 )
• organize small group instruction around the subsets of goals that stu-dents prioritized for themselves; and
• tally the concepts that students in the class identify as their weaknesses and provide full-class review on the most frequently mentioned weaknesses.
Potential roadblocks and solutions
Roadblock 2.1. Students view the feedback they receive as a reflection on their abil-ity rather than an opportunity for focused improvement.
Suggested Approach. Teachers should give student feedback that is explanatory and provides students with a chance to improve.56 Teachers should emphasize the students’ level of performance on a task in relation to the learning goals and avoid making global statements about the student’s ability. Encouraging goal setting also is important because students may be more willing to view feedback as a source
56. Black et al. (2003); Black and Wiliam (1998); Shepard (1995); Wesson (1991).
of useful information if there is a larger goal that they are working to achieve.57
Roadblock 2.2. Teachers within a school have different approaches to providing feedback to their students.
Suggested Approach. Although each teacher should engage with students in ways he or she finds effective, teachers may nevertheless benefit from profes-sional development on how to provide concrete and constructive feedback that informs student learning through stu-dents’ own data. Teachers should collabo-rate with peers to develop a shared under-standing about what constitutes formative feedback, and how and when such feed-back should be provided (see recommen-dation 1). Teachers may even benefit from inviting students to take part in these con-versations and share how they use and re-spond to instructional feedback.
Roadblock 2.3. Teachers are concerned that they do not have enough instructional time to explain rubrics or help students analyze feedback.
57. Lee and Gavine (2003); Thurman and Wolfe (1999).
Example 4. Example of a student’s worksheet for learning from math mistakes
Learning from Math Mistakes
Test: Unit 2, Single-Variable Equations
Name: Joe A. Student
Problem Number My Answer
Correct Answer
(from posttest review)
Steps for Solving (fill in)
Reason Missed
Need to review this concept?
10 x = √21 x = 3 Order of operations Yes
18 x = 3/32 x = –3/2 Dividing by a fraction Yes
27 x = 4 x = 4 or –4 Square roots No
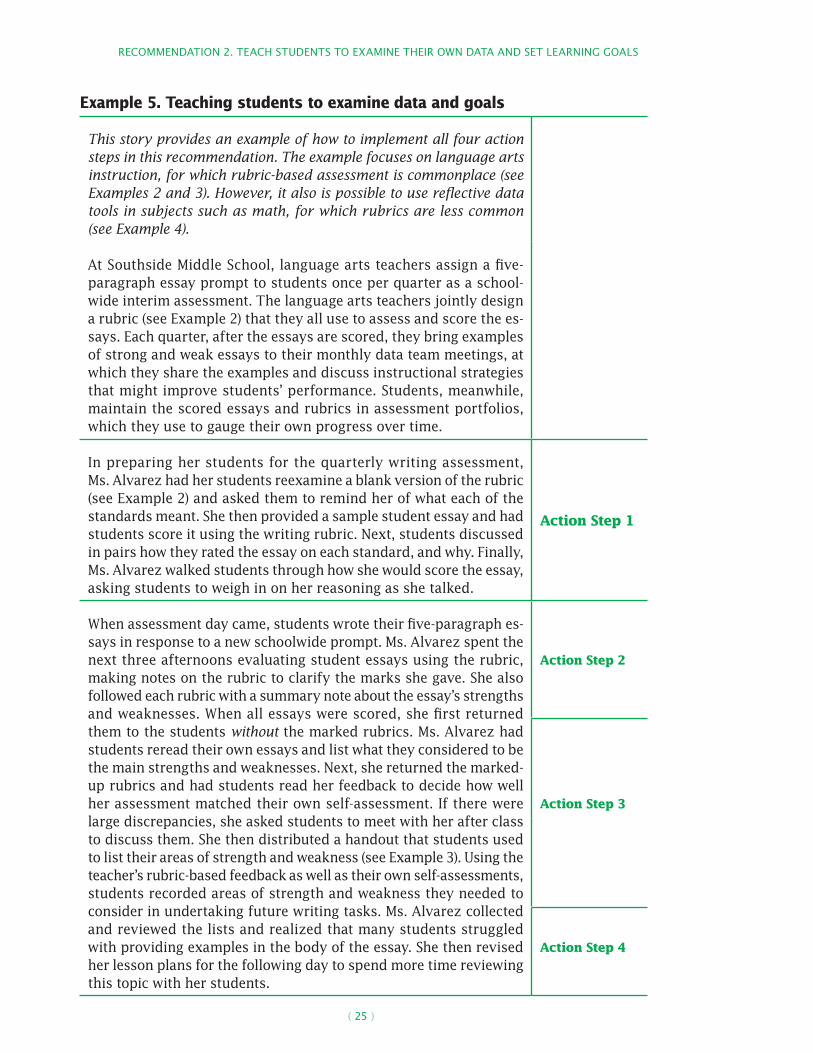
RECOMMENDATION 2. TEACH STUDENTS TO ExAMINE THEIR OWN DATA AND SET LEARNING GOALS
( 25 )
Example 5. Teaching students to examine data and goals
This story provides an example of how to implement all four action steps in this recommendation. The example focuses on language arts instruction, for which rubric-based assessment is commonplace (see Examples 2 and 3). However, it also is possible to use reflective data tools in subjects such as math, for which rubrics are less common (see Example 4).
At Southside Middle School, language arts teachers assign a five-paragraph essay prompt to students once per quarter as a school-wide interim assessment. The language arts teachers jointly design a rubric (see Example 2) that they all use to assess and score the es-says. Each quarter, after the essays are scored, they bring examples of strong and weak essays to their monthly data team meetings, at which they share the examples and discuss instructional strategies that might improve students’ performance. Students, meanwhile, maintain the scored essays and rubrics in assessment portfolios, which they use to gauge their own progress over time.
In preparing her students for the quarterly writing assessment, Ms. Alvarez had her students reexamine a blank version of the rubric (see Example 2) and asked them to remind her of what each of the standards meant. She then provided a sample student essay and had students score it using the writing rubric. Next, students discussed in pairs how they rated the essay on each standard, and why. Finally, Ms. Alvarez walked students through how she would score the essay, asking students to weigh in on her reasoning as she talked.
Action Step 1
When assessment day came, students wrote their five-paragraph es-says in response to a new schoolwide prompt. Ms. Alvarez spent the next three afternoons evaluating student essays using the rubric, making notes on the rubric to clarify the marks she gave. She also followed each rubric with a summary note about the essay’s strengths and weaknesses. When all essays were scored, she first returned them to the students without the marked rubrics. Ms. Alvarez had students reread their own essays and list what they considered to be the main strengths and weaknesses. Next, she returned the marked-up rubrics and had students read her feedback to decide how well her assessment matched their own self-assessment. If there were large discrepancies, she asked students to meet with her after class to discuss them. She then distributed a handout that students used to list their areas of strength and weakness (see Example 3). Using the teacher’s rubric-based feedback as well as their own self-assessments, students recorded areas of strength and weakness they needed to consider in undertaking future writing tasks. Ms. Alvarez collected and reviewed the lists and realized that many students struggled with providing examples in the body of the essay. She then revised her lesson plans for the following day to spend more time reviewing this topic with her students.
Action Step 2
Action Step 3
Action Step 4
RECOMMENDATION 2. TEACH STUDENTS TO ExAMINE THEIR OWN DATA AND SET LEARNING GOALS
( 26 )
Suggested Approach. The panel rec-ognizes that instruction time is limited. However, time spent explaining assess-ment tools and strategies for analyzing feedback is essential to helping students understand their own achievement. Thus, it should be a natural, integral part of the teaching process—not an add-on activity. Incorporating time for students’ analysis
of their own data into routine classroom activities may help students develop a habit of learning from feedback, mak-ing them more independent as the year progresses. Helping students understand assessment tools and analyze feedback also puts students at the vanguard of the school’s culture of data use.

( 27 )
Recommendation 3. Establish a clear vision for schoolwide data use
Schools must establish a strong culture of data use to ensure that data-based decisions are made frequently, consistently, and appropriately.58 This data culture should emphasize collaboration across and within grade levels and subject areas59 to diagnose problems and refine educational practices.60 Several factors (e.g., planning, leadership, implementation, and attitude) affect the success schools will have with developing and maintaining a data culture. Here, the panel suggests steps schools should take toward establishing their vision, while recognizing that following the suggestions does not guarantee that a strong culture will emerge.
A clear plan for schoolwide data use is essential to developing such a culture. Schools should establish a representative data team to help ensure that data activities are not imposed on educators, but rather are shaped by them.61 This team should develop a written data-use plan that is consistent with broader school and district goals, supports a common language related to data use and teaching and learning concepts, and establishes data use as
58. Datnow, Park, and Wohlstetter (2007); Wil-liams Rose (2006).
59. Armstrong and Anthes (2001); Datnow, Park, and Wohlstetter (2007); Knapp et al. (2006).
60. Datnow, Park, and Wohlstetter (2007); Gen-try (2005).
61. Anderson et al. (2006); Feldman and Tung (2001); Wayman, Cho, and Johnston (2007).
one of the key responsibilities of an education professional.62
Level of evidence: Low
Believing that a clear vision for data use is essential to educators wishing to improve instruction through interpreting data, the panel drew from its own knowledge and the findings and examples in case studies and descriptive analyses to inform the develop-ment of this recommendation. No studies were identified that examine the effects of establishing a data team or creating a data- use plan on student achievement, so the panel judged the level of evidence support-ing this recommendation as low.
Brief summary of evidence to support the recommendation
A strong culture of data use, conveyed through a clear schoolwide vision, is criti-cal to ensure that data-based decisions are made routinely, consistently, and effec-tively. This point is conveyed in a number of studies that use qualitative designs to examine how schools and districts have implemented data use. Appendix D con-tains two examples of case studies the panel referenced when developing the ac-tion steps in this recommendation. One de-scribes how a set of districts and schools has worked to develop achievement goals and to use student data to support prog-ress toward those goals,63 whereas the other describes an example of how one school has its staff share responsibility for data use to avoid burnout.64 However, the panel identified no causal evidence linking the creation of a schoolwide culture or vi-sion to improved student performance.
62. Datnow, Park, and Wohlstetter (2007); Wil-liams Rose (2006); Rossmiller and Holcomb (1993); Wayman, Cho, and Johnston (2007).
63. Datnow, Park, and Wohlstetter (2007).
64. Copland (2003).
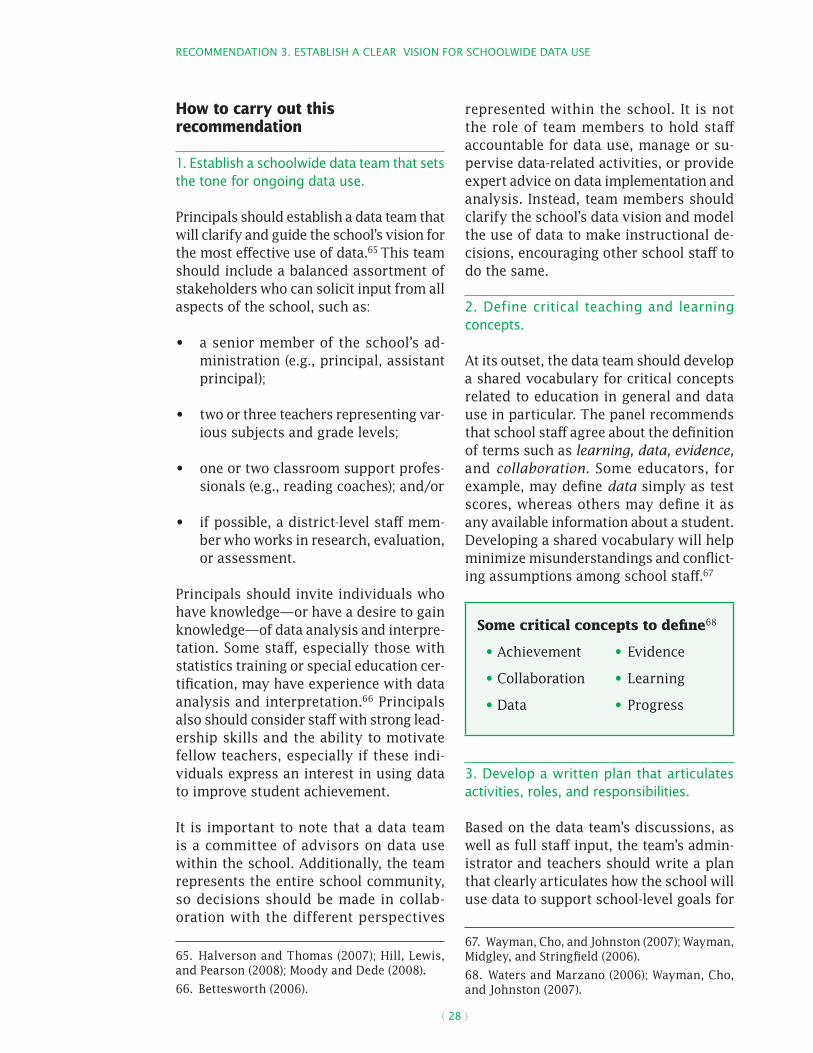
RECOMMENDATION 3. ESTABLISH A CLEAR VISION FOR SCHOOLWIDE DATA USE
( 28 )
How to carry out this recommendation
1. Establish a schoolwide data team that sets the tone for ongoing data use.
Principals should establish a data team that will clarify and guide the school’s vision for the most effective use of data.65 This team should include a balanced assortment of stakeholders who can solicit input from all aspects of the school, such as:
• a senior member of the school’s ad-ministration (e.g., principal, assistant principal);
• two or three teachers representing var-ious subjects and grade levels;
• one or two classroom support profes-sionals (e.g., reading coaches); and/or
• if possible, a district-level staff mem-ber who works in research, evaluation, or assessment.
Principals should invite individuals who have knowledge—or have a desire to gain knowledge—of data analysis and interpre-tation. Some staff, especially those with statistics training or special education cer-tification, may have experience with data analysis and interpretation.66 Principals also should consider staff with strong lead-ership skills and the ability to motivate fellow teachers, especially if these indi-viduals express an interest in using data to improve student achievement.
It is important to note that a data team is a committee of advisors on data use within the school. Additionally, the team represents the entire school community, so decisions should be made in collab-oration with the different perspectives
65. Halverson and Thomas (2007); Hill, Lewis, and Pearson (2008); Moody and Dede (2008).
66. Bettesworth (2006).
represented within the school. It is not the role of team members to hold staff accountable for data use, manage or su-pervise data-related activities, or provide expert advice on data implementation and analysis. Instead, team members should clarify the school’s data vision and model the use of data to make instructional de-cisions, encouraging other school staff to do the same.
2. Define critical teaching and learning concepts.
At its outset, the data team should develop a shared vocabulary for critical concepts related to education in general and data use in particular. The panel recommends that school staff agree about the definition of terms such as learning, data, evidence, and collaboration. Some educators, for example, may define data simply as test scores, whereas others may define it as any available information about a student. Developing a shared vocabulary will help minimize misunderstandings and conflict-ing assumptions among school staff.67
68
Some critical concepts to define68
• Achievement • Evidence
• Collaboration • Learning
• Data • Progress
3. Develop a written plan that articulates activities, roles, and responsibilities.
Based on the data team’s discussions, as well as full staff input, the team’s admin-istrator and teachers should write a plan that clearly articulates how the school will use data to support school-level goals for
67. Wayman, Cho, and Johnston (2007); Wayman, Midgley, and Stringfield (2006).
68. Waters and Marzano (2006); Wayman, Cho, and Johnston (2007).
RECOMMENDATION 3. ESTABLISH A CLEAR VISION FOR SCHOOLWIDE DATA USE
( 29 )
improving student achievement.69 These goals, developed by school and district leadership, already exist in most schools. To create conditions for effective data use, the data team should briefly revisit the school’s goals to ensure that they are
• attainable, in that they are realistic given existing performance levels;
• measurable, in that they clearly ex-press the parameters of achievement and can be supported by data70; and
• relevant, in that they take into account the specific culture and constraints of the school.71
For example, a school in which half the students can read at grade level may de-cide to set a long-term goal of having 75 percent of students reading on grade level within five years. It then would seem rea-sonable for the school to set ambitious but achievable annual goals to increase the share of students reading at grade level by 5 percentage points per year. If the data team determines that the goals do not meet the criteria of seeming attainable, measurable, and relevant, it may wish to establish short- and medium-term goals that do meet these criteria.
With the school’s goals identified and clari-fied, the data team should prepare a writ-ten plan specifying72
• specific actions for using data to make instructional decisions;
• staff and team members responsible for carrying out those actions;
69. Armstrong and Anthes (2001); Mason (2002); Togneri (2003).
70. Datnow, Park, and Wohlstetter (2007); Feld-man and Tung (2001); Young (2006).
71. Halverson et al. (2007); Leithwood et al. (2007).
72. Datnow, Park, and Wohlstetter (2007).
• timelines for executing the actions; and
• how each action helps the school reach its long-term goals.
Example 6 provides a hypothetical plan for tying data use to school goals. The exam-ple illustrates how a data team might map a clear rationale from each action to the school’s larger goal of improved reading proficiency, and how each data team mem-ber might take responsibility for executing a portion of the larger plan. The panel encour-ages schools to develop other similar plans, including detailed lists of data-use responsi-bilities by staff role and timelines for using data, but provides this table as a sample of how an actionable plan might look.
The team should revisit the plan annually,73 using data to determine appropriate changes to meet the needs and goals of the school and its students. Revising the plan in this way mirrors the cycle of in-structional improvement, further estab-lishing a culture of data-based decision making throughout the school.
4. Provide ongoing data leadership.
Once the plan is developed, the data team should provide guidance on using data to support the school’s vision, with the ultimate aim of developing the ca-pacity of all school staff to use data. At the outset, members of the data team should regularly interact with school staff about data and its uses, often-times serving as data facilitators (see recommendation 4). For example, team members can educate school staff, dis-trict representatives, or parents about the school’s vision for data use by hav-ing individual or small group meetings
73. Wayman, Cho, and Johnston (2007) recom-mend revisiting the plan frequently. The panel recommends doing so on at least an annual basis.
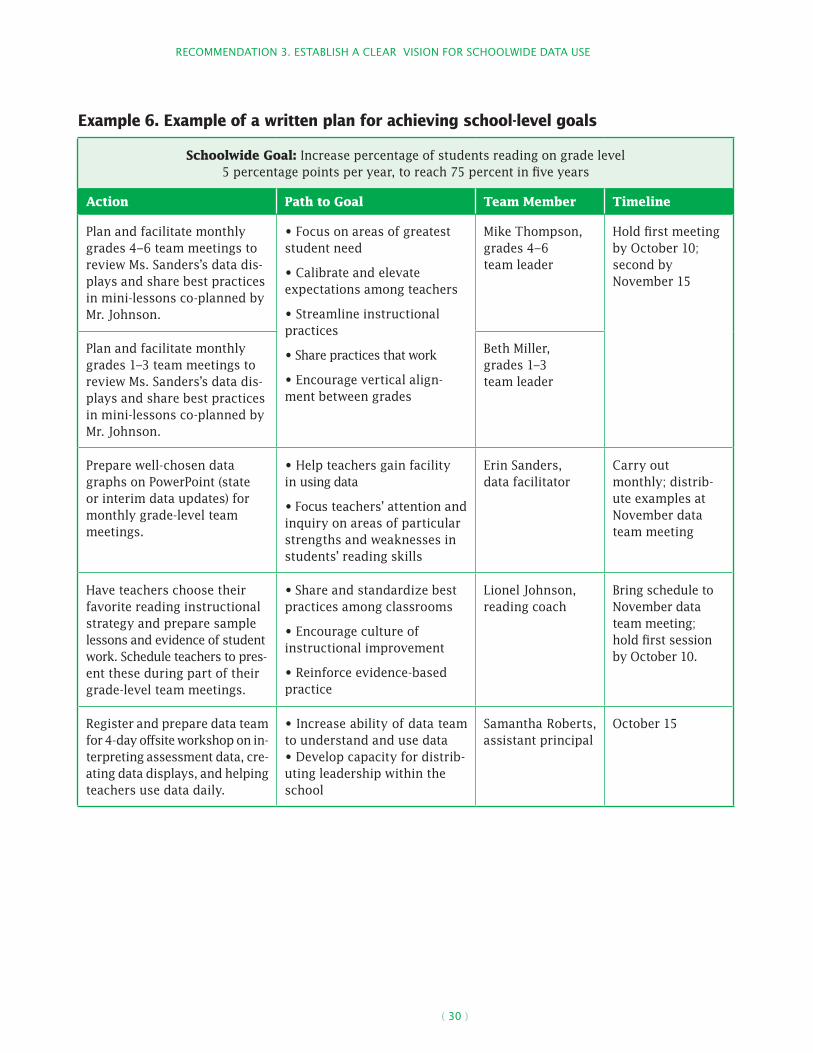
RECOMMENDATION 3. ESTABLISH A CLEAR VISION FOR SCHOOLWIDE DATA USE
( 30 )
Example 6. Example of a written plan for achieving school-level goals
Schoolwide Goal: Increase percentage of students reading on grade level 5 percentage points per year, to reach 75 percent in five years
Action Path to Goal Team Member Timeline
Plan and facilitate monthly grades 4–6 team meetings to review Ms. Sanders’s data dis-plays and share best practices in mini-lessons co-planned by Mr. Johnson.
•Focusonareasofgreateststudent need
•Calibrateandelevate expectations among teachers
•Streamlineinstructionalpractices
•Sharepracticesthatwork
•Encourageverticalalign-ment between grades
Mike Thompson, grades 4–6 team leader
Hold first meeting by October 10; second by November 15
Plan and facilitate monthly grades 1–3 team meetings to review Ms. Sanders’s data dis-plays and share best practices in mini-lessons co-planned by Mr. Johnson.
Beth Miller, grades 1–3 team leader
Prepare well-chosen data graphs on PowerPoint (state or interim data updates) for monthly grade-level team meetings.
•Helpteachersgainfacility in using data
•Focusteachers’attentionandinquiry on areas of particular strengths and weaknesses in students’ reading skills
Erin Sanders, data facilitator
Carry out monthly; distrib-ute examples at November data team meeting
Have teachers choose their favorite reading instructional strategy and prepare sample lessons and evidence of student work. Schedule teachers to pres-ent these during part of their grade-level team meetings.
•Shareandstandardizebestpractices among classrooms
•Encouragecultureof instructional improvement
•Reinforceevidence-basedpractice
Lionel Johnson, reading coach
Bring schedule to November data team meeting; hold first session by October 10.
Register and prepare data team for 4-day offsite workshop on in-terpreting assessment data, cre-ating data displays, and helping teachers use data daily.
•Increaseabilityofdatateam to understand and use data•Developcapacityfordistrib-uting leadership within the school
Samantha Roberts, assistant principal
October 15

RECOMMENDATION 3. ESTABLISH A CLEAR VISION FOR SCHOOLWIDE DATA USE
( 31 )
focused on these topics. Team members also can
• provide resources and support for data analysis and interpretation, such as in-formation about professional develop-ment sessions and access to necessary technologies;
• encourage educators to use data in their daily work by modeling data use strategies;
• create incentives to motivate staff to analyze data (e.g., “Staff Member of the Month” award for excellent data-use, recognition in the school news-letter); and
• participate in grade- and subject-level meetings to ensure that structured col-laboration time is used effectively (see recommendation 4).
Once staff members become comfortable with data use, team members will not need to provide the same level of guidance and support as indicated earlier.
The data team should meet monthly to monitor the school’s progress in executing plan components and adhering to timelines. The meetings also can be used to share successes and challenges in integrating the school’s vision for data use. Each month, one team member should be designated to set the agenda for the next meeting.
Maintaining a data team, or building data responsibilities into an existing team, may be a positive contribution to the school’s data culture. Team members encourage and guide school staff in developing their capacity to use data effectively to trans-form student performance data into in-formation to inform instruction. Both the team and associated capacity-building efforts help ensure that no one individ-ual—such as a principal or a data-savvy grade-level team leader—is left to help all
staff use data in ways that advance school goals.74 “Distributed leadership,” a practice often hypothesized as an important char-acteristic of effective schools, is one way to accomplish this task.75
Potential roadblocks and solutions
Roadblock 3.1. School staff do not have time to develop an additional plan for how to use data.
Suggested Approach. To alleviate the pressure of creating a new plan, the plan for data use could be incorporated into an existing school improvement plan.76 Research also has described schools that viewed this effort as ultimately time effi-cient, describing their efforts as “making time to save time.” 77
Roadblock 3.2. No one is qualified (or wants) to be on the data team.
Suggested Approach. Consider the strengths and leadership skills of indi-viduals in your school; many have related training and skills that will make them strong team members. For example, new teachers, or those who recently completed continuing education programs, may have applicable data knowledge if their pro-grams provided training on the use of data to make instructional decisions. Similarly, some teachers and staff may be able to provide enthusiasm and leadership that inspire others to support the data-use process. Once qualified and interested staff are identified, consider encouraging participation in the data team by offering a small stipend from the principal’s dis-cretionary funds.
74. Copland (2003); Wayman, Cho, and Johnston (2007); Wayman and Stringfield (2006).
75. Halverson et al. (2007); Spillane, Halverson, and Diamond (2004).
76. Mason (2002); Rossmiller and Holcomb (1993).
77. Wayman, Brewer, and Stringfield (2009).
RECOMMENDATION 3. ESTABLISH A CLEAR VISION FOR SCHOOLWIDE DATA USE
( 32 )
Roadblock 3.3. The few data-savvy staff at the school are overwhelmed by questions and requests for assistance.78
Suggested Approach. It is important for principals and district leaders to protect people’s time by clearly defining roles and responsibilities in enforceable job descrip-tions.79 Principals also can encourage all members of the data team to train other educators to use and interpret data. Phas-ing data use into the entire school can help prevent staff burnout, deepen staff data literacy, and encourage schoolwide support and implementation of the data-based decision-making process.80
78. Halverson and Thomas (2007).
79. Young (2006).
80. Means et al. (2009).
Roadblock 3.4. The district does not have research and development staff to partici-pate in the school-level data team.
Suggested Approach. The size of a dis-trict may determine if research and devel-opment staff are present, or if there are enough research and development staff to participate in school-level data teams. If district staff cannot participate in school-level teams, however, the principal should ensure that any district-level message about data use is accurately presented to data team members.

( 33 )
Recommendation 4. Provide supports that foster a data-driven culture within the school
Schools and districts can make concrete changes that encourage data use within schools.81 These changes need to ensure that teachers, principals, and school and district staff have a thorough understanding of their roles in using data, and that they possess the knowledge and skills to use data appropriately. Schools and districts should invest in leadership, professional development, and structured time for collaboration.82 They also may need to invest in additional resources, including relevant technologies83 and specialized staff.84
Level of evidence: Low
Two studies that met WWC standards or that met WWC standards with reserva-tions tested interventions that included coaching and feedback to help teachers interpret and make changes based on as-sessment data (the interventions included other practices as well).85 These interven-tions had no discernible effects on student achievement. Although one study also
81. Knapp et al. (2006); Lachat and Smith (2005); Supovitz (2006); Supovitz and Klein (2003); Way-man, Cho, and Johnston (2007); Wayman and Stringfield (2006).
82. Datnow, Park, and Wohlstetter (2007); Lachat and Smith (2005); Supovitz and Klein (2003); Way-man, Cho, and Johnston (2007); Wayman and Stringfield (2006); Young (2006).
83. Wayman, Stringfield, and Yakimowski (2004).
84. Armstrong and Anthes (2001); Datnow, Park, and Wohlstetter (2007); Supovitz and Klein (2003); Wayman, Cho, and Johnston (2007).
85. Jones and Krouse (1988); Wesson (1991).
reported that teachers in the coaching group more frequently used pupil obser-vations to modify lessons,86 this outcome was not measured in a way that allowed the authors or the WWC to compute the magnitude or statistical significance of any effect of this change on instructional practice. The panel also identified one cor-relational study that found a significant positive association between coaching and reading achievement (however the study design does not permit causal inferences about the effect of coaching).87 Although these studies, supplemented by findings from qualitative analyses and their own expertise, helped the panel develop the steps under this recommendation, the level of evidence supporting this recom-mendation is low.
Brief summary of evidence to support the recommendation
Although the panel believes that the steps under this recommendation are essential and findings of numerous qualitative anal-yses report that supporting staff in data use is important, limited rigorous evidence exists to demonstrate that schoolwide supports for data use lead to achievement gains. Two studies tested interventions that included coaching and feedback to help teachers interpret and make changes based on assessment data.88 In both cases, the coaching was only one component of the intervention, and the intervention was compared with a competing intervention (as opposed to business as usual). One study compared the students of teachers who received coaching to use data to track student progress and make instructional changes with the students of teachers who received coaching on behavioral manage-ment.89 Another compared students of
86. Jones and Krouse (1988).
87. Marsh et al. (2008).
88. Jones and Krouse (1988); Wesson (1991).
89. Jones and Krouse (1988).
RECOMMENDATION 4. PROVIDE SUPPORTS THAT FOSTER A DATA-DRIVEN CULTURE WITHIN THE SCHOOL
( 34 )
teachers who received individual mentor-ing with students of teachers who received group mentoring.90 The studies found no discernible effects of the interventions that included a coaching component. The panel identified no rigorous studies iden-tifying the effects on student achievement of other schoolwide supports for data use. To shape this recommendation, panelists relied on their own expertise as well as examples of data leadership and profes-sional development opportunities drawn from noncausal studies and implementa-tion guides.
How to carry out this recommendation
1. Designate a school-based facilitator who meets with teacher teams to discuss data.
Principals should provide data facilitators who encourage staff to use data systemati-cally.91 Depending on the size and avail-able resources of the school and district, data facilitators may be full-time teachers who provide coaching to other staff, dis-trict staff members who support multiple schools in data use, or a dedicated school-level staff person supporting all teachers in the building.
The data facilitator’s role is complex, re-quiring not only expertise with data analy-sis but also an ability to train and encour-age other staff in the data use process. Regardless of her or his role in the school or district, the data facilitator’s respon-sibilities should be integrated into the regular work of the school’s data team (see recommendation 3). It is important to recognize, however, that facilitators should not bear the sole responsibility for data interpretation and analysis. Instead, data facilitators can help staff obtain the knowledge and skills they need to use data
90. Wesson (1991).
91. Wayman, Cho, and Johnston (2007); Wesson (1991).
appropriately so that staff do not become too dependent on facilitators.
Data facilitators should meet at least monthly with grade- and subject-level teacher teams, although teacher teams should meet independently more fre-quently (see recommendation 1). During these meetings, data facilitators should
• model data use and interpretation, tying examples to the school’s vision for data use and its learning goals;
• model how to transform daily class-room practices based on data-driven diagnoses of student learning issues;
• assist staff with data interpretation by preparing data reports and related materials;92 and
• train and support staff on using data to improve instructional practices and student achievement.93
Learning from the expertise of a colleague may help teachers adjust their instruc-tional approaches in ways that improve student achievement.94 However, data facilitators need to complement existing data-literacy capacity and encourage edu-cators to increase their data literacy. Data literacy is necessary to develop and sup-port a data culture,95 and overreliance on data facilitators can result in educators failing to develop the necessary knowl-edge and skills, which could lead them to misunderstand or misuse data. Once staff become comfortable with data use, how-ever, it is likely that facilitators will not
92. Wayman, Cho, and Johnston (2007).
93. Chrismer and DiBara (2006); Knapp et al. (2006); Mid-Continent Research for Education and Learning (McREL) (2003); Wayman, Cho, and Johnston (2007).
94. Jones and Krouse (1988); Wesson (1991).
95. Knapp et al. (2006).
RECOMMENDATION 4. PROVIDE SUPPORTS THAT FOSTER A DATA-DRIVEN CULTURE WITHIN THE SCHOOL
( 35 )
need to provide the same level of guidance and support as indicated earlier.
2. Dedicate structured time for staff collaboration.
Encouraging teachers to work collabora-tively with data helps make data use an established part of a school’s culture.96 Collaborative data analysis can highlight achievement patterns across grade levels, departments, or schools97 and can engen-der the kind of consistency of instructional practices and expectations that often char-acterizes high-performing schools.98
Structured time should be set aside for teachers and school staff to collabora-tively analyze and interpret their students’ achievement data, and to identify instruc-tional changes.99 This time also can be used for professional development on data use. Ideally, this structured time should occur a few times each week, depending on the individual school’s needs. It is im-portant that schools make these collabora-tive meetings a priority.
Collaborative meeting participants can vary from school to school. Most fre-quently, data meetings occur among small groups of teachers in the same grade level or subject area. Other times, these meet-ings include some combination of teach-ers in the same grade level or subject area, a data facilitator, and/or other data team members.
Because school schedule constraints vary, principals can explore different options
96. Feldman and Tung (2001).
97. Cromey and Hanson (2000).
98. Bigger (2006); Herman and Gribbons (2001); Huffman and Kalnin (2003); Lachat and Smith (2005); Wayman, Cho, and Johnston (2007).
99. Anderegg (2007); Bigger (2006); Cromey and Hanson (2000); Gentry (2005); Herman and Grib-bons (2001); Huffman and Kalnin (2003); Ingram, Louis, and Schroeder (2004); Supovitz and Klein (2003); Wayman and Stringfield (2006).
for scheduling collaborative time. For ex-ample, one school has dedicated biweekly two-hour meetings for staff to examine student data and identify next instruc-tional steps.100 Another school adjusted weekly class schedules to have a com-mon break for teachers to examine data collaboratively.101
The collaborative team meetings should include the following components:
• Preparation. Prior to these meetings, educators should set an agenda that focuses on using the most updated data relative to a specific, timely topic. It is too overwhelming to attempt to address all student achievement con-cerns at once; targeted discussions are key to successful data meetings.
• Analysis. During these meetings, teachers should follow the cycle of in-quiry, using data to state hypotheses about their teaching and learning prac-tices and then testing those hypoth-eses (see recommendation 1).102
• Action agenda. At the end of each meeting, educators should be prepared to enact a data-based action plan that examines and modifies their instruc-tion to increase student achievement in the area of focus for the meeting.
3. Provide targeted professional develop-ment regularly.
The skills that educators need in order to use data to identify achievement prob-lems and develop instructional solutions are complex. To enhance data-literacy and data-use skills in a way that is consis-tent with school goals, it is essential that schools and districts provide ongoing pro-fessional development opportunities for
100. Knapp et al. (2006).
101. Mandinach et al. (2005).
102. Armstrong and Anthes (2001).
RECOMMENDATION 4. PROVIDE SUPPORTS THAT FOSTER A DATA-DRIVEN CULTURE WITHIN THE SCHOOL
( 36 )
administrators, principals, teachers,103 and classroom support specialists.104 Without school- and district-level support for these opportunities, analysis of data may be in-consistent and potentially ineffective.
The skills needed for effective data use range from data entry to data analysis to leadership; they also vary depending on professional roles (i.e., teacher, adminis-trator, or technology support staff), con-tent area and curriculum, experience with data analysis, and level of comfort with technology.105 For most staff, professional development should focus on how users will apply the data to their daily work and instructional planning, rather than on the functionality of the system.106 Staff with the specific role of maintaining the sys-tem, however, should receive specialized training that prepares them to maintain the system for all users.
Ideally, all staff, particularly principals, should be familiar with components of the data system, data culture, and data use. Table 3 highlights some potential profes-sional development opportunities to pri-oritize for staff based on their roles with the data system and data use.
Training for data use often is synchronous with technology training. Creating staff confidence in, and comfort with, avail-able data systems should increase the chance that data will be used regularly and well.107 Related technology training should be implemented in small doses, however, and occur close to implementation of the data system or related system enhance-
103. Wayman, Cho, and Johnston (2007).
104. Feldman and Tung (2001).
105. Bigger (2006); Cromey and Hanson (2000); Herman and Gribbons (2001); Huffman and Kal-nin (2003); Knapp et al. (2006); Lachat and Smith (2005); Wayman, Cho, and Johnston (2007).
106. Wayman and Cho (2008).
107. Supovitz and Klein (2003).
ments.108 In this way, staff can more easily connect their training to daily activities109 and not become overwhelmed by training sessions. (See recommendation 5 for more details on preparing for implementation of technology systems.)
It is important to recognize that profes-sional development responsibility does not end after the initial training of staff and deployment of the district’s data system. Users also may require ongoing technical assistance, and additional trainings will be needed when introducing system enhance-ments. Professional development oppor-tunities, therefore, should be continuous, offered at least monthly throughout the school year by staff experienced with as-sessment and data-literacy skills, technol-ogy use, and the development of cultures of effective data use. Professional develop-ment staff should consider offering online learning modules as refresher courses or self-paced, independent training opportu-nities after initial in-person training ses-sions to moderate costs and offer flexibil-ity in handling scheduling challenges and varying levels of technology use.
Potential roadblocks and solutions
Roadblock 4.1. It is difficult to locate pro-fessional development that is specific to the needs of the school.
Suggested Approach. With the assis-tance of the data team and data facilitators, schools should determine their needs and discuss these with their professional de-velopment provider. In this way, schools can ensure that the provider teaches skills that meet the needs of school staff. If a session cannot be tailored to the needs of the school or district, schools should
108. Arnold (2007); Cromey and Hanson (2000); Gentry (2005).
109. Anderegg (2007); Ingram, Louis, and Schroeder (2004); Wayman, Cho, and Johnston (2007).
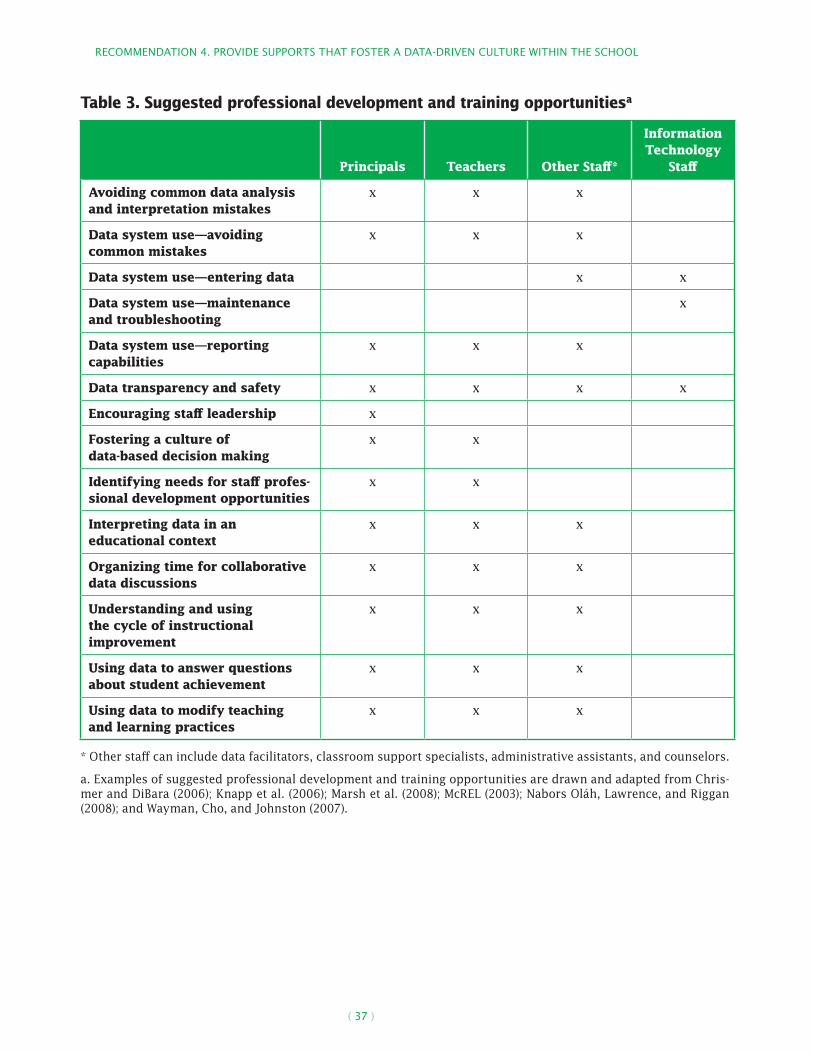
RECOMMENDATION 4. PROVIDE SUPPORTS THAT FOSTER A DATA-DRIVEN CULTURE WITHIN THE SCHOOL
( 37 )
Table 3. Suggested professional development and training opportunitiesa
Principals Teachers Other Staff*
Information Technology
Staff
Avoiding common data analysis and interpretation mistakes
x x x
Data system use—avoiding common mistakes
x x x
Data system use—entering data x x
Data system use—maintenance and troubleshooting
x
Data system use—reporting capabilities
x x x
Data transparency and safety x x x x
Encouraging staff leadership x
Fostering a culture of data-based decision making
x x
Identifying needs for staff profes-sional development opportunities
x x
Interpreting data in an educational context
x x x
Organizing time for collaborative data discussions
x x x
Understanding and using the cycle of instructional improvement
x x x
Using data to answer questions about student achievement
x x x
Using data to modify teaching and learning practices
x x x
* Other staff can include data facilitators, classroom support specialists, administrative assistants, and counselors.
a. Examples of suggested professional development and training opportunities are drawn and adapted from Chris-mer and DiBara (2006); Knapp et al. (2006); Marsh et al. (2008); McREL (2003); Nabors Oláh, Lawrence, and Riggan (2008); and Wayman, Cho, and Johnston (2007).
RECOMMENDATION 4. PROVIDE SUPPORTS THAT FOSTER A DATA-DRIVEN CULTURE WITHIN THE SCHOOL
( 38 )
consider using a “train-the-trainers” mod-el.110 Schools should identify trainers, such as professional development staff within the district office, who can receive broad training on a particular product or issue re-lated to data-based decision making for the school’s data system. These staff can then adapt the training to fit the needs of the school or district and train other educators and staff members as necessary.111
Roadblock 4.2. Resources dedicated to creating staff capacity to use data often are shifted to other school priorities.
110. Wayman and Conoly (2006).
111. Datnow, Park, and Wohlstetter (2007).
Suggested Approach. Data-based deci-sion making is not an isolated topic within education, but rather one that benefits all subject areas and grades. Principals and district-level administrators should secure and distribute the financial resources nec-essary to match educators’ needs for inter-preting and interacting with data. When observing the structured collaboration meetings, school leaders should identify whether teachers and other school staff need additional professional development opportunities or materials, supplemental support services, or access to support per-sonnel. Dedicating resources to data liter-acy will help support and enforce a culture of data use, enabling educators to better help their students meet defined learning goals across all content areas.

( 39 )
Recommendation 5. Develop and maintain a districtwide data system
Districts should develop and maintain high-quality data systems that enable all decision makers to access the necessary data in a timely fashion. A high-quality data system is comprehensive and integrated, linking disparate forms of data for reporting and analysis to a range of audiences.112 To help ensure that the relevant staff in a school district will rely on the data system to inform their decisions, district administrators should involve a variety of stakeholders when determining which functions the system should provide. Districts and schools need to secure financial and human resources to develop safeguards that ensure data are timely, relevant, and useful to educators.
Level of evidence: Low
Recognizing that it is difficult if not impos-sible to test the impacts of data systems on student achievement empirically, the panel based this recommendation on a combination of its expertise and its review of descriptive studies and case studies. The studies did not use a causal design that would provide evidence directly link-ing the use of an integrated data system with improved academic outcomes; hence, the level of evidence to support this rec-ommendation is low.
Brief summary of evidence to support the recommendation
A high-quality, districtwide data system is necessary to provide teachers with the in-formation they need to modify instruction
112. Mieles and Foley (2005); Wayman, String-field, and Yakimowski (2004).
and improve student achievement. To guide this recommendation, the panel ref-erenced descriptive and other noncausal studies that (1) discussed how schools or districts collaboratively created and used data systems,113 (2) described the impor-tance or provided examples of selecting a system that meets varied users’ needs,114 (3) explained the successes and challenges schools and districts experienced when implementing their data systems,115 and (4) advocated the importance or gave ex-amples of system maintenance and secu-rity relative to data quality.116 Appendix D provides details on the characteristics of data systems described in these studies.
How to carry out this recommendation
1. Involve a variety of stakeholders in select-ing a data system.
Districts should establish a data-system advisory council that includes represen-tatives from key stakeholder groups (see Table 4). These representatives should understand the importance of data use to make instructional decisions, possess leadership and time-management skills, and be able to effectively communicate
113. Choppin (2002); Lachat and Smith (2005); Mieles and Foley (2005); Thorn (2001); Wayman, Cho, and Johnston (2007); Wayman and Conoly (2006); Wayman and Stringfield (2006); Wayman, Stringfield, and Yakimowski (2004).
114. Breiter and Light (2006); Brunner et al. (2005); Choppin (2002); Datnow, Park, and Wohl-stetter (2007); Kerr et al. (2006); Long et al. (2008); Mieles and Foley (2005); Thorn (2001); Wayman and Cho (2008); Wayman, Cho, and Johnston (2007); Wayman, Stringfield, and Yakimowski (2004).
115. Long et al. (2008); Wayman, Cho, and John-ston (2007); Wayman, Stringfield, and Yakimo-wski (2004).
116. Long et al. (2008); Mason (2003); Mieles and Foley (2005); Wayman and Cho (2008); Wayman, Cho, and Johnston (2007).
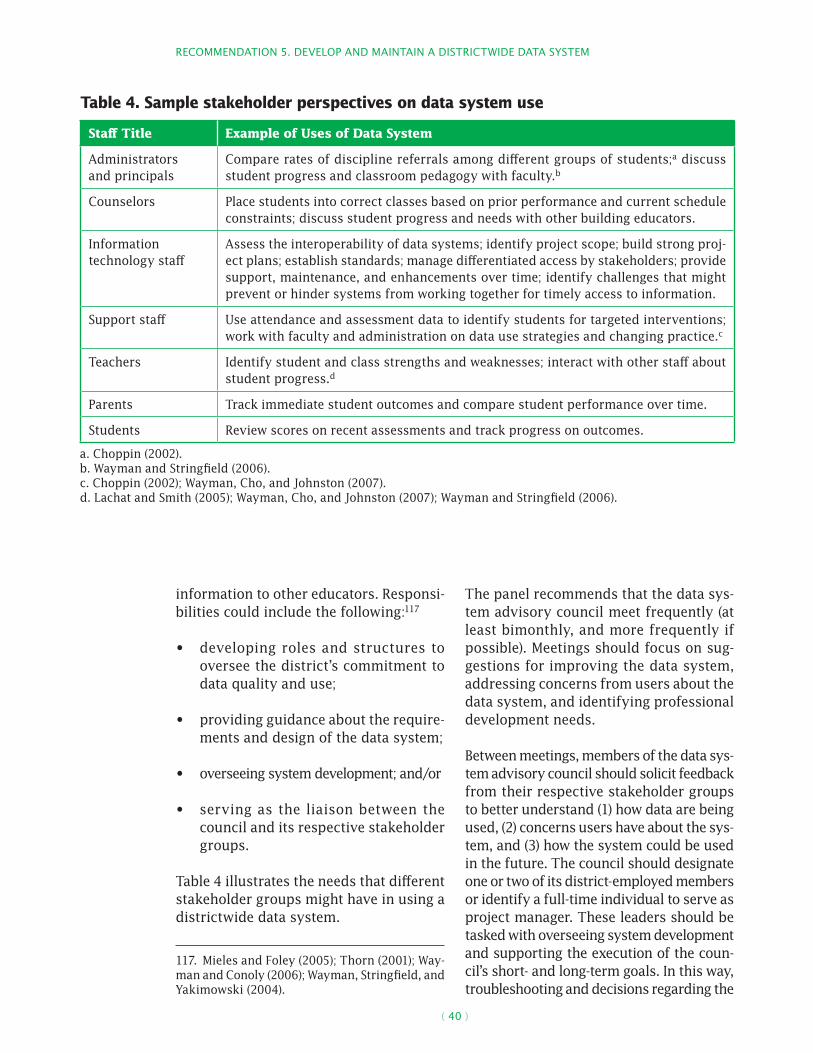
RECOMMENDATION 5. DEVELOP AND MAINTAIN A DISTRICTWIDE DATA SySTEM
( 40 )
information to other educators. Responsi-bilities could include the following:117
• developing roles and structures to oversee the district’s commitment to data quality and use;
• providing guidance about the require-ments and design of the data system;
• overseeing system development; and/or
• serving as the liaison between the council and its respective stakeholder groups.
Table 4 illustrates the needs that different stakeholder groups might have in using a districtwide data system.
117. Mieles and Foley (2005); Thorn (2001); Way-man and Conoly (2006); Wayman, Stringfield, and Yakimowski (2004).
The panel recommends that the data sys-tem advisory council meet frequently (at least bimonthly, and more frequently if possible). Meetings should focus on sug-gestions for improving the data system, addressing concerns from users about the data system, and identifying professional development needs.
Between meetings, members of the data sys-tem advisory council should solicit feedback from their respective stakeholder groups to better understand (1) how data are being used, (2) concerns users have about the sys-tem, and (3) how the system could be used in the future. The council should designate one or two of its district-employed members or identify a full-time individual to serve as project manager. These leaders should be tasked with overseeing system development and supporting the execution of the coun-cil’s short- and long-term goals. In this way, troubleshooting and decisions regarding the
Table 4. Sample stakeholder perspectives on data system use
Staff Title Example of Uses of Data System
Administrators and principals
Compare rates of discipline referrals among different groups of students;a discuss student progress and classroom pedagogy with faculty.b
Counselors Place students into correct classes based on prior performance and current schedule constraints; discuss student progress and needs with other building educators.
Information technology staff
Assess the interoperability of data systems; identify project scope; build strong proj-ect plans; establish standards; manage differentiated access by stakeholders; provide support, maintenance, and enhancements over time; identify challenges that might prevent or hinder systems from working together for timely access to information.
Support staff Use attendance and assessment data to identify students for targeted interventions; work with faculty and administration on data use strategies and changing practice.c
Teachers Identify student and class strengths and weaknesses; interact with other staff about student progress.d
Parents Track immediate student outcomes and compare student performance over time.
Students Review scores on recent assessments and track progress on outcomes.
a. Choppin (2002). b. Wayman and Stringfield (2006).c. Choppin (2002); Wayman, Cho, and Johnston (2007). d. Lachat and Smith (2005); Wayman, Cho, and Johnston (2007); Wayman and Stringfield (2006).

RECOMMENDATION 5. DEVELOP AND MAINTAIN A DISTRICTWIDE DATA SySTEM
( 41 )
data system can be addressed in a timely, ef-ficient manner outside of council meetings. Recognizing that these designated staff may have other responsibilities, administrators should adjust staff responsibilities to allow for sufficient time to execute project man-agement tasks.
2. Clearly articulate system requirements relative to user needs.
It is critical for the council to work closely with a representative of each school’s data team (described in recommendation 3), bas-ing its suggestions for the system’s require-ments in the vision articulated by the data team. User needs should dictate system-requirement decisions in support of educa-tional achievement, not vice versa.118
The council should consider how the sys-tem requirements would account for the following:
• Access to system and data security. Staff in different roles will use data for different purposes and may, therefore, require varied levels of access. Coun-cil members should consider whether users need to have access to the sys-tem during nonschool hours or from outside the building.119
• Bandwidth requirements. Information technology staff should confirm that the quantity of data that can be carried from one point to another in a given time pe-riod (bandwidth) is sufficient for relevant and timely data use.120 Also, staff should consider the infrastructure they need to connect hardware, software, and users.
118. Abbott (2008); Breiter and Light (2006). Long et al. (2008) provide an example of one district successfully using a data system that was devel-oped after assessing user needs. McREL (2003) advises that purposeful data collection begins by identifying user needs.
119. Wayman, Stringfield, and Yakimowski (2004).
120. Wayman, Cho, and Johnston (2007); Way-man, Stringfield, and Yakimowski (2004).
121
Sample existing and new data elements to consider121
• State assessment data
• Interim or benchmark assessment data
• Locally developed formative assessment data
• Attendance records
• Finance and scheduling information
• Student and teacher demographic data
• Consistent student and teacher IDs. To enable users to access a complete picture of a student, an effective data system should include a consistent stu-dent ID that allows users to follow stu-dents over time and between schools, identify links between students and teachers for courses and curricula, and identify special programs in which the student participates.
• Consolidation of legacy systems. Most schools and districts have data systems that are already in use (legacy systems). As system requirements are articulated, the council should make decisions about which functions from legacy systems can be maintained by these systems, and which functions should be replaced by a new system.
• Cost (initial and maintenance). The council needs to carefully analyze available resources, including skills necessary to develop and maintain a customized data system, financial and time limitations, staffing needs, initial and ongoing maintenance of data, pro-fessional development and training
121. Choppin (2002); Datnow, Park, and Wohl-stetter (2007); Wayman, Stringfield, and Yaki-mowski (2004).

RECOMMENDATION 5. DEVELOP AND MAINTAIN A DISTRICTWIDE DATA SySTEM
( 42 )
sessions, and system upgrades.122 The council also needs to discuss the human and financial resources avail-able to purchase or build a system (see action step 3).123
• Data storage. Any data system should be flexible enough to incorporate mul-tiple types of data.124 The council should consider the existing data that will need to be incorporated into the new system,125 as well as the new data that may be collected and stored in the same system. The data system must provide seamless access to a broad variety of data typically stored in dis-parate systems, such as disciplinary data, assessment data, student demo-graphics, and grades. This access must be seamless to the user, offering the ability to examine varied types of data concurrently.126
• Data quality/accuracy and timeli-ness. Data that are inaccurate, un-timely, or not specific will greatly inhibit educators’ ability to make data-based decisions about teaching and learning practices.127 Common assess-ment data, for example, should be en-tered in the system immediately. At the outset, leaders should take seriously the need to clean existing data.128 Data errors can cause mistrust, and a good
122. Wayman, Stringfield, and Yakimowski (2004).
123. Long et al. (2008).
124. Mandinach et al. (2005); Wayman, Cho, and Johnston (2007); Wayman, Stringfield, and Yaki-mowski (2004).
125. McREL (2003); Wayman, Stringfield, and Ya-kimowski (2004).
126. Wayman (2005); Wayman, Stringfield, and Yakimowski (2004).
127. Choppin (2002); Wayman, Stringfield, and Yakimowski (2004).
128. Knapp et al. (2006); Wayman, Stringfield, and Yakimowski (2004).
data inventory process can prevent major data quality problems.129
• Hosting. Servers that house data may be located either within a school dis-trict’s data center or at an off-site host-ing service, depending on the district’s capacity to maintain the quality and speed of the connection through tech-nological and human support.
• Interoperability. The capacity of a system to communicate and exchange data seamlessly with other systems (in-teroperability) is defined by a standard format for shared data, a set of nam-ing conventions, and a set of rules for interaction among applications. Coun-cil members should consider existing data systems to avoid buying future add-ons to facilitate interaction be-tween new and existing systems.130 In order to fit the new data system with other data-collection tools, it is impor-tant to select systems that are able to share data across databases. Flexibil-ity will allow the district and schools to better adapt existing data to a new system and will facilitate shaping the data system as new needs emerge.
• Professional development for both end users and information technol-ogy (IT) staff. See action step 4 for more information.
• Reporting. The presentation and re-porting features of the system should be user-friendly and seamless, producing results that draw on data elements from
129. Choppin (2002); Kerr et al. (2006); Light, Wexler, and Heinze (2005); Mieles and Foley (2005); Wayman, Cho, and Johnston (2007). Way-man, Stringfield, and Yakimowski (2004) also dis-cuss the importance of data quality.
130. Ramnarine (2004); Thorn (2001); Wayman, Cho, and Johnston (2007); Wayman, Stringfield, and Yakimowski (2004).
RECOMMENDATION 5. DEVELOP AND MAINTAIN A DISTRICTWIDE DATA SySTEM
( 43 )
multiple systems.131 Staff in different roles will use data for different purposes and may, therefore, require different re-porting features and layouts. Some staff may be initially satisfied with a sum-mary report in HTML or PDF formats but will likely require a flexible query tool that allows them to browse the data and manipulate the output.132 Additionally, system components should be flexible to account for changes in presentation requirements as staff confront new data or new questions.
• Routines and safeguards. Data quality can be compromised when too many people enter data into the system.133 To safeguard data, districts could limit data-entry permission to a small, specified number of people who are district certified for data entry.134 Alternatively, districts could consider providing varying levels of access for reading and entering data by role (e.g., enable teachers to access their stu-dents’ data, but not that of other stu-dents, or permit principals to access data on all students from their build-ing and enter data when appropriate). Most users—such as teachers, admin-istrators, and support staff—should be granted access to viewing data or creating reports, but only trained or certified users—typically an IT per-son or designated district-level data administrator—should be allowed to enter and edit data.
The data-system advisory council lead-ers should develop a publically avail-able written document that specifies
131. Breiter and Light (2006); Mieles and Foley (2005); Wayman, Stringfield, and Yakimowski (2004).
132. Ramnarine (2004); Wayman, Cho, and John-ston (2007); Wayman, Stringfield, and Yakimo-wski (2004).
133. Long et al. (2008); Mieles and Foley (2005).
134. Wayman, Cho, and Johnston (2007).
recommendations for system capabili-ties. The data needs of teachers, schools, and districts will likely evolve over time,135 so the panel recommends that system requirements be reviewed and revised frequently (at least annually) to ensure that the system continues to meet user needs.
3. Determine whether to build or buy the data system.
Considering the needs of stakeholders and district resource limitations (human and fi-nancial), the advisory council needs to rec-ommend whether the district should pur-chase a data system from a vendor (buy) or develop the system internally (build) (see Table 5).136 Either approach may have hid-den costs, such as additional time to build a personalized system or the need to buy add-ons so that an off-the-shelf purchase will better meet the articulated system requirements.
4. Plan and stage the implementation of the data system.
The council’s written plan should address aspects critical to the system’s success, such as maintenance and enhancement needs. Other critical implementation as-pects include staged implementation, pro-fessional development sessions, and strat-egies to identify and solve problems.137 The implementation process should be guided by the council leaders, who should track the implementation process closely to identify areas for improvement.
During early implementation, the council should arrange staged rollouts or pilot tests to mediate the problem of overwhelming
135. McREL (2003); Rossmiller and Holcomb (1993); Wayman, Cho, and Johnston (2007).
136. Long et al. (2008); Wayman, Cho, and John-ston (2007); Wayman, Stringfield, and Yakimo-wski (2004).
137. Wayman, Cho, and Johnston (2007).

RECOMMENDATION 5. DEVELOP AND MAINTAIN A DISTRICTWIDE DATA SySTEM
( 44 )
staff with new technology. This approach allows time for staff to adjust to the system, as well as flexibility to modify the system in response to user feedback. The rollout plan should be long range (e.g., spread out over the course of one academic year) and include specific plans (with activities and timelines) for maintenance, training, and end-user support.138 Further, these oppor-tunities should be tightly linked with spe-cific tasks that are immediately expected of the user, as per the district plan.139 It is easy to underestimate the time needed to prepare existing data and roll out the
138. Ibid.
139. Wayman and Cho (2008).
system, however, and the implementation plan would benefit from an inflated esti-mate of the rollout timeline.140
The plan also should include professional development and training opportunities tailored to staff needs by considering their technological skills, roles, responsibili-ties, and the content areas in which they work.141 Professional development about
140. Mieles and Foley (2005).
141. Long et al. (2008); Mason (2003); McREL (2003); Wayman and Cho (2008). Wayman, Cho, and Johnston (2007) conclude that training should be tailored to staff roles (but do not dis-cuss developing a formal training plan).
Table 5. Considerations for built and purchased data systems
Consideration Built Systems Bought Systems
Level of control Building a data system allows districts to have more control over how they cus-tomize software and make repairs. Dis-tricts should be sure they have staff to fill the roles of technical project man-ager, business analyst, database admin-istrator, quality assurance manager, and developer.
Prepackaged data system software can be challenging to customize and repair. However, vendors typically provide skilled technical consultants to create solutions and deploy modifications.
Cost An internally developed system may pres-ent lower initial costs. However, districts should take into account long-range costs, including the longer time it takes to de-velop, test, and implement a built system than to purchase one. Built systems may, therefore, be more costly.
Purchased systems typically involve an up-front cost that may not be recouped if the district changes systems or needs to purchase additional add-ons for cus-tomization. However, vendors often host the data externally, which could be a cost savings.
Hardware and software needs
Internally hosted data systems require hardware and software to be purchased, maintained, and continuously supported by skilled technical staff.
Vendors of prepackaged systems typi-cally offer options of additional hard-ware and software, as well as around-the-clock maintenance and support.
Training Internal staff can develop and deliver training and technical assistance about the data system that is targeted to the district’s context and needs.
Professional development and related technology trainings for organization staff often are provided by the vendor; sometimes a train-the-trainer approach is implemented.
Efficiency District personnel often “reinvent the wheel,” learning lessons that have al-ready been addressed by other districts or commercial vendors.
Vendors bring an economy of scale, hav-ing worked with numerous other dis-tricts on similar problems.
RECOMMENDATION 5. DEVELOP AND MAINTAIN A DISTRICTWIDE DATA SySTEM
( 45 )
the data system should discuss data trans-parency and safety, system uses and ca-pabilities, and ongoing opportunities for integrating data into instructional practice. (See recommendation 4 for more informa-tion about professional development.) The plan also should recognize that implemen-tation responsibility does not end after ini-tial training of staff and deployment of the system. Users may require ongoing tech-nical assistance, and additional trainings will be needed when introducing system refinements and enhancements.
Potential roadblocks and solutions
Roadblock 5.1. The data system’s tech-nological components are challenging for staff who do not consider themselves tech-nologically savvy or are skeptical of using new technologies.
Suggested Approach. The data system should not be implemented and used with-out accompanying training and support services. When the district is preparing to roll out its data system, the council should ensure that appropriate professional devel-opment and technology training sessions are available for a variety of skill levels (see recommendation 4 for more details).142 In this way, all stakeholders have the oppor-tunity to learn about the data system and develop the skills necessary to utilize the system. District resources should be al-located to ensure that principals and data facilitators can support teachers’ use of data within the school building,143 and a mechanism for providing assistance on an
142. Wayman and Cho (2008).
143. Kerr et al. (2006).
as-needed basis (e.g., a technology help desk) should be in place as soon as educa-tors start using the system.
Roadblock 5.2. The implementation plan contains many technological requirements, but little information on how the system will be used.
Suggested Approach. Before purchasing or developing a data system, ensure that the implementation plan addresses system requirements as they relate to the teach-ing and learning goals of the district.144 Be very careful that educational goals are front and center in this plan—the district advisory council should never put techno-logical requirements and considerations for a system before the educational goals the system supports. If the plan clearly ar-ticulates how the system relates to learn-ing goals, users will better understand how the system will be used and why that use will support student achievement.145
Roadblock 5.3. A data system seems like a financial luxury to many individuals in the district.
Suggested Approach. For districts that prioritize, and indicate as a priority, the use of student data to meet educational improvement goals, a data system must equally be a priority. Ensure that the dis-trict’s plan describes how a data system supports these goals in a way that clearly explains and illustrates the necessity of the system, in order to foster support for it.
144. Wayman and Cho (2008); Wayman, Cho, and Johnston (2007); Wayman and Conoly (2006).
145. Breiter and Light (2006); Wayman and Cho (2008); Wayman, Cho, and Johnston (2007).
( 46 )
Glossary of terms as used in this report
Common assessments are those assess-ments administered in a routine, consistent manner across a state, district, or school. Under this definition, common assessments include annual statewide accountability tests and commercially produced tests, interim assessments, benchmark assess-ments, and end-of-course tests, as long as they are administered consistently and rou-tinely to provide information that can be compared across classrooms and schools.
Correlational studies look for relation-ships among variables. Although correla-tional studies can suggest that a relation-ship between two variables exists, they do not support an inference that one variable causes a change in another.146
The cycle of inquiry is a process in which educators analyze data—such as demo-graphic, perceptual, school process, and student achievement data—in order to understand how these elements are inter-related and what they suggest about stu-dents’ learning needs. As a multistep pro-cess, the cycle of inquiry often involves analyzing data to better understand stu-dent needs, developing hypotheses about instructional practice, formulating and implementing action plans to improve stu-dent learning and achievement, and then once again analyzing data to evaluate stu-dent progress and inform next steps.147
Data are empirical pieces of information that educators can draw upon to make a variety of instructional and organizational decisions. By themselves, data are not ev-idence—it takes concepts, theories, and interpretive frames of references to make
146. Van Wagner (n.d.).
147. Halverson, Prichett, and Watson (2007); Her-man and Gribbons (2001); Huffman and Kalnin (2003; Fiarman (2007).
sense of data.148 Education-related data may be student focused (e.g., demograph-ics, attendance and behavior, performance on standardized tests) or administrative (e.g., financial and staffing information) in nature but are not limited to these types. Data are typically maintained by state and local education agencies, districts, schools, or teachers (see data warehouse).
Data-based decision making in educa-tion refers to teachers, principals, and administrators systematically collecting and analyzing various types of data, in-cluding demographic, administrative, pro-cess, perceptual, and achievement data, to guide a range of decisions to help improve the success of students and schools. Other common terms include data-driven deci-sion making, data-informed decision mak-ing, and evidence-based decision making.
The data culture is a learning environ-ment within a school or district that in-cludes attitudes, values, goals, norms of behavior, and practices, accompanied by an explicit vision for data use by leader-ship, that characterize a group’s apprecia-tion for the importance and power that data can bring to the decision-making process. It also includes the recognition that data collection is a necessary part of an educator’s responsibilities and that the use of data to influence and inform prac-tice is an essential tool that will be used frequently.
The variables that make up a data sys-tem are known as data elements or data indicators.
A data facilitator is an individual charged with helping schools or districts use data effectively to make decisions. Often, data facilitators organize school-based data teams, lead practitioners in a collab-orative inquiry process, help interpret data, or educate staff on using data to
148. Knapp et al. (2006).

GLOSSARy OF TERMS AS USED IN THIS REPORT
( 47 )
improve instructional practices and stu-dent achievement.
The ability to ask and answer questions about collecting, analyzing, and making sense of data is known as data literacy. Widespread data literacy among teachers, ad-ministrators, and students is a salient char-acteristic of a data-driven school culture.
Data quality refers to the reliability and validity of collected data.
As school-based groups of educators who come together to analyze data and help one another use data effectively, data teams often include a school’s principal, instructional leader(s), and several teach-ers. Such teams may lead teachers in using achievement data to identify and respond to students’ learning needs through in-structional modifications.
A data warehouse is a computer system that stores educational information from several sources and integrates it into a single electronic source. Data warehouses are designed to allow the manipulation, updating, and control of multiple data-bases that are connected to one another via individual student identification num-bers. Capabilities of data warehouses often extend beyond data storage, however, and may include data management and report-ing systems used for retrieving and ana-lyzing data.149
Distributed leadership articulates how leadership work and tasks are shared and supported by individuals and structures across an organization.150 The social dis-tribution of leadership reflects how work is shared, assigned, or taken up by formal or informal leaders; the situational dis-tribution of leadership explains how or-ganizational structures such as policies,
149. Mieles and Foley (2005); Wayman, String-field, and Yakimowski (2004).
150. Spillane, Halverson, and Diamond (2004).
programs, and other materials shape the context in which work is completed.
Formative assessment is a process that is intended to provide feedback to teach-ers and students at regular intervals dur-ing the course of instruction. The purpose of formative assessment is to influence the teaching and learning process so as to close the gap between current learn-ing and a desired goal. Assessments used for formative purposes—often called for-mative assessments—are those that are “given in the classroom by the teacher for the explicit purpose of diagnosing where students are in their learning, where gaps in knowledge and understanding exist, and how to help teachers and students improve student learning. The assessment is embedded within the learning activity and linked directly to the current unit of instruction.”151 However, because most as-sessments can be used in both formative and summative ways, the term formative refers less to a particular type of assess-ment than to the purposes for which the assessment is used.
A hypothesis is a “tentative assumption made in order to draw out and test its logi-cal or empirical consequences.”152 Within the cycle of inquiry, it is an evidence-based assumption about students’ learning needs that teachers can test using instructional modifications and follow-up data about student performance.
Interim assessments are typically ad-ministered on a school- or districtwide scale at regular intervals during a single school year. Although the results from interim assessments may be used at the teacher or student level, the assessment is typically designed to be aggregated at a level beyond the classroom, such as the school or district level.153 Interim
151. Perie, Marion, and Gong (2007), p. 3.
152. Merriam-Webster Online Dictionary (2009).
153. Perie, Marion, and Gong (2007).
GLOSSARy OF TERMS AS USED IN THIS REPORT
( 48 )
assessments may be used in both forma-tive and summative ways.
Interoperability refers to the capacity of a system to communicate and exchange data seamlessly with other systems, de-fined by a standard format for shared data, a set of naming conventions, and a set of rules for interaction among applications. For the purposes of this guide, the term is used in a technical-systems context.
Summative assessment is a process that establishes what students have and have not accomplished at the culmination of a specific unit of instruction, such as a cur-riculum unit, grading period, or school year. Rather than specifically informing the learning process as it takes place, summa-tive assessment is intended to evaluate the knowledge and skills of the test taker at a given point in time. Assessments used for summative purposes—often called sum-mative assessments—also may be used to evaluate the effectiveness of programs, school improvement goals, or curriculum
alignment processes. However, because most assessments can be used in both formative and summative ways, the term summative refers less to a particular type of assessment than to the purposes for which the assessment is used. Assess-ments that often are used in summative ways include state assessments, district benchmark or interim assessments, end-of-unit or end-of-chapter tests, end-of-term exams, and scores that are used for ac-countability of schools (AYP) and students (report card grades).154
Triangulation is the process of using multiple data sources to address a par-ticular question or problem and using evidence from each source to illuminate or temper evidence from other sources. It also can be thought of as using each data source to test and confirm evidence from other sources in order to arrive at a well-justified decision.
154. Garrison and Ehringhaus (2009).

( 49 )
Appendix A. Postscript from the Institute of Education Sciences
What is a practice guide?
The health care professions have em-braced a mechanism for assembling and communicating evidence-based advice to practitioners about care for specific clini-cal conditions. Variously called practice guidelines, treatment protocols, critical pathways, best practice guides, or simply practice guides, these documents are sys-tematically developed recommendations about the course of care for frequently en-countered problems, ranging from physi-cal conditions, such as foot ulcers, to psy-chosocial conditions, such as adolescent development.155
Practice guides are similar to the prod-ucts of typical expert consensus panels in reflecting the views of those serving on the panel and the social decisions that come into play as the positions of individ-ual panel members are forged into state-ments that all panel members are willing to endorse. Practice guides, however, are generated under three constraints that do not typically apply to consensus panels. The first is that a practice guide consists of a list of discrete recommendations that are actionable. The second is that those recommendations taken together are in-tended to be a coherent approach to a multifaceted problem. The third, which is most important, is that each recommen-dation is explicitly connected to the level of evidence supporting it, with the level represented by a grade (strong, moder-ate, or low).
The levels of evidence, or grades, are usually constructed around the value of
155. Field and Lohr (1990).
particular types of studies for drawing causal conclusions about what works. Thus, one typically finds that a strong level of evidence is drawn from a body of randomized controlled trials, the moder-ate level from well-designed studies that do not involve randomization, and the low level from the opinions of respected au-thorities (see Table 1). Levels of evidence also can be constructed around the value of particular types of studies for other goals, such as the reliability and validity of assessments.
Practice guides also can be distinguished from systematic reviews or meta-analyses such as What Works Clearinghouse (WWC) intervention reviews or statistical meta-analyses, which employ statistical meth-ods to summarize the results of studies obtained from a rule-based search of the literature. Authors of practice guides sel-dom conduct the types of systematic lit-erature searches that are the backbone of a meta-analysis, although they take advan-tage of such work when it is already pub-lished. Instead, authors use their expertise to identify the most important research with respect to their recommendations, augmented by a search of recent publica-tions to ensure that the research citations are up-to-date. Furthermore, the character-ization of the quality and direction of the evidence underlying a recommendation in a practice guide relies less on a tight set of rules and statistical algorithms and more on the judgment of the authors than would be the case in a quality meta-analysis. An-other distinction is that a practice guide, because it aims for a comprehensive and coherent approach, operates with more numerous and more contextualized state-ments of what works than does a typical meta-analysis.
Thus, practice guides sit somewhere be-tween consensus reports and meta-anal-yses in the degree to which systematic processes are used for locating relevant research and characterizing its meaning.

APPENDIx A. POSTSCRIPT FROM THE INSTITUTE OF EDUCATION SCIENCES
( 50 )
Practice guides are more like consensus panel reports than meta-analyses in the breadth and complexity of the topic that is addressed. Practice guides are different from both consensus reports and meta-analyses in providing advice at the level of specific action steps along a pathway that represents a more-or-less coherent and comprehensive approach to a multi-faceted problem.
Practice guides in education at the Institute of Education Sciences
IES publishes practice guides in educa-tion to bring the best available evidence and expertise to bear on the types of sys-temic challenges that cannot currently be addressed by single interventions or pro-grams. Although IES has taken advantage of the history of practice guides in health care to provide models of how to proceed in education, education is different from health care in ways that may require that practice guides in education have some-what different designs. Even within health care, where practice guides now number in the thousands, there is no single tem-plate in use. Rather, one finds descriptions of general design features that permit substantial variation in the realization of practice guides across subspecialties and panels of experts.156 Accordingly, the templates for IES practice guides may vary across practice guides and change over time and with experience.
The steps involved in producing an IES-sponsored practice guide are first to select a topic, which is informed by formal sur-veys of practitioners and requests. Next, a panel chair is recruited who has a national reputation and up-to-date expertise in the topic. Third, the chair, working in collabo-ration with IES, selects a small number of panelists to coauthor the practice guide. These are people the chair believes can work well together and have the requisite
156. American Psychological Association (2002).
expertise to be a convincing source of rec-ommendations. IES recommends that at one least one of the panelists be a prac-titioner with experience relevant to the topic being addressed. The chair and the panelists are provided a general template for a practice guide along the lines of the information provided in this appendix. They also are provided with examples of practice guides. The practice guide panel works under a short deadline of six to nine months to produce a draft document. The expert panel members interact with and re-ceive feedback from staff at IES during the development of the practice guide, but they understand that they are the authors and, thus, responsible for the final product.
One unique feature of IES-sponsored prac-tice guides is that they are subjected to rigorous external peer review through the same office that is responsible for inde-pendent review of other IES publications. A critical task of the peer reviewers of a practice guide is to determine whether the evidence cited in support of particular recommendations is up-to-date and that studies of similar or better quality that point in a different direction have not been ignored. Peer reviewers also are asked to evaluate whether the evidence grade as-signed to particular recommendations by the practice guide authors is appropriate. A practice guide is revised as necessary to meet the concerns of external peer reviews and gain the approval of the standards and review staff at IES. The process of external peer review is carried out independent of the office and staff within IES that insti-gated the practice guide.
Because practice guides depend on the expertise of their authors and their group decision making, the content of a practice guide is not and should not be viewed as a set of recommendations that in every case depends on and flows inevitably from sci-entific research. It is not only possible but also likely that two teams of recognized experts working independently to produce
APPENDIx A. POSTSCRIPT FROM THE INSTITUTE OF EDUCATION SCIENCES
( 51 )
a practice guide on the same topic would generate products that differ in important respects. Thus, consumers of practice guides need to understand that they are, in effect, getting the advice of consultants. These consultants should, on average, pro-vide substantially better advice than an individual school district might obtain on
its own because the authors are national authorities who have to reach agreement among themselves, justify their recom-mendations in terms of supporting evi-dence, and undergo rigorous independent peer review of their product.
Institute of Education Sciences

( 52 )
Appendix B. About the authors
Panel
Laura Hamilton, Ph.D., (Chair) is a se-nior behavioral scientist at RAND Corpo-ration and an adjunct associate professor in the University of Pittsburgh’s Learning Sciences and Policy program. Her research focuses on assessment, accountability, and the measurement of instructional and leadership practices. She has directed several large projects including a study of teachers’ and principals’ responses to state standards–based accountability poli-cies. Dr. Hamilton has served on several national panels, including the Center on Education Policy’s Panel on High School Exit Examinations and its Panel on Student Achievement Under NCLB, the Brookings National Commission on Choice in K–12 Education, and the American Psychologi-cal Association/ American Educational Research Association/National Council on Measurement in Education Joint Com-mittee to Revise the Standards for Educa-tional and Psychological Testing. She has a strong background in psychometrics and quantitative analysis, as well as extensive experience studying systemic reform and data-driven decision making in schools.
Richard Halverson, Ph.D., is associate professor of educational leadership and policy analysis at the University of Wis-consin School of Education, where he di-rects the Data-Driven Instruction Systems (DDIS) project. DDIS is a National Science Foundation–funded project that examines how school leaders build local capacity for teachers to use data to inform teaching and to improve student learning. The project is examining how school leaders collect and distribute a wide range of achievement and behavioral data, provide organized oppor-tunities for reflection and design, and build formative feedback systems to measure the success of internal program design.
Dr. Halverson is a former high school teacher, school technology specialist, curriculum di-rector, and school administrator.
Sharnell S. Jackson, Ed.M., is the retired chief e-learning officer; state e-learning director; and former K–9 literacy, math-ematics, science, and technology educator for the Chicago Public Schools. In these positions, she was responsible for train-ing teachers and administrators in data analysis and using student achievement data for school improvement purposes. She also worked to identify and manage innovative curriculum instruction solu-tions, digital media content, collaborative communication tools, instructional assess-ment management systems to support the data-inquiry processes, data-driven leader-ship skills, and customized online learning for students. Through her current work, Ms. Jackson aims to minimize the data-re-porting burden on schools while maximiz-ing data quality, data use, collaboration, and 21st-century skills. She encourages districts to organize for structured, col-laborative work, using data systematically to inform instructional and schoolwide im-provement, measure progress, understand individual learning needs, and motivate and improve student-centered teaching and learning.
Ellen Mandinach, Ph.D., is senior project director at CNA Education and the deputy and research director for the Regional Education Laboratory (REL) Appalachia. She has served as the interim director of REL Appalachia and director for research for REL Northeast and Islands. Dr. Man-dinach has spent the past several years examining various aspects of data-driven decision making and is the lead investiga-tor on a set of projects being conducted across all the RELs to address pressing is-sues around data-driven decision making. She is the author of Data-Driven School Im-provement: Linking Data and Learning and is a member of the assessment planning committee for the National Assessment of
APPENDIx B. ABOUT THE AUTHORS
( 53 )
Educational Progress Technology Literacy and the working group on the Assessment and Teaching of 21st Century Skills for the Cisco/Intel/Microsoft Project.
Jonathan A. Supovitz, Ed.D., is an associ-ate professor at the Graduate School of Edu-cation at the University of Pennsylvania and a senior researcher at the Consortium for Policy Research in Education. He is a mixed-method researcher and has conducted a number of studies on the relationship be-tween data use and professional develop-ment, teacher and leadership practice, and student achievement. His current research focuses on how schools and districts use different forms of data to support the im-provement of teaching and learning. Addi-tionally, Dr. Supovitz directs the evidence-based leadership strand of the University of Pennsylvania’s mid-career doctoral pro-gram in educational leadership. He teaches courses on the policy and instructional uses of assessment, evidence-based leader-ship, and organizational learning.
Jeffrey C. Wayman, Ph.D., is an assistant professor at The University of Texas at Austin. His research on data-based deci-sion making includes efficient structures for creating data-informed school dis-tricts, effective leadership for data use, software that delivers student data to edu-cators, and systemic supports that enable widespread teacher use of student data. Dr. Wayman has edited two special journal issues focused on data use (for the Ameri-can Journal of Education and the Journal of Education for Students Placed At Risk) and is currently directing a project funded by the Spencer Foundation—The Data-In-formed District: Implementation and Ef-fects of a Districtwide Data Initiative. Prior to joining The University of Texas faculty, Dr. Wayman worked at The Johns Hopkins University with the Center for Social Orga-nization of Schools, at Colorado State Uni-versity in the area of prevention research, and as a junior high math teacher in Kan-sas City and Salt Lake City.
Staff
Cassandra Pickens, M.S.Ed., is a project analyst for the What Works Clearinghouse (WWC) at Mathematica Policy Research. She has served as coordinator in several areas of the WWC, including practice guides and outreach and development. Ms. Pick-ens supported the panel in translating re-search findings into practitioner-friendly text. Prior to joining the WWC, Ms. Pickens worked in higher-education student devel-opment and programming.
Emily Sama Martin, M.P.P., is a human services researcher at Mathematica Policy Research. She has served as both reviewer and coordinator in several areas of the WWC, including the Beginning Reading topic area. Ms. Sama Martin used her back-ground in education-related research to support the panel in analyzing evidence and applying evidence to recommenda-tions. Before joining the WWC, Ms. Sama Martin worked on a wide range of quanti-tative and qualitative program evaluations in the areas of early childhood, education, welfare, nutrition, and disabilities.
Jennifer L. Steele, Ed.D., an associate policy researcher at the RAND Corporation, received her Ed.D. from Harvard Univer-sity. Her research focuses on teacher labor markets, school reform, and data-driven decision making in schools. Dr. Steele is coeditor of Data Wise in Action: Stories of Schools Using Data to Improve Teaching and Learning (2007) and the Harvard Edu-cational Review Special Issue on Adolescent Literacy (2008). Previously, she worked as a teacher at the elementary, high school, and community college levels and man-aged teacher recruitment and training for a private education company.
( 54 )
Appendix C. Disclosure of potential conflicts of interest
Practice guide panels are composed of in-dividuals who are nationally recognized experts on the topics about which they are rendering recommendations. The In-stitute of Education Sciences expects that such experts will be involved profession-ally in a variety of matters that relate to their work on the panel. Panel members are asked to disclose their professional involvements and to institute deliberative processes that encourage critical exami-nation of the views of panel members as they relate to the content of the practice guide. The potential influence of panel members’ professional engagements is further muted by the requirement that they ground their recommendations in
evidence that is documented in the prac-tice guide. In addition, the practice guide undergoes independent external peer re-view prior to publication, with particular focus on whether the evidence related to the recommendations in the practice guide has been appropriately presented.
The professional engagements reported by each panel member that appear most closely associated with the panel recom-mendations are noted here.
Jeffrey C. Wayman has no financial stake in any program or practice that is men-tioned in the practice guide. He is con-ducting an efficacy study of the Acuity formative assessment system, funded by CTB/McGraw-Hill. No specific discussion of the Acuity system took place in panel deliberations, and it is not referenced in this practice guide.

( 55 )
Appendix D. Technical information on the studies
The body of research on how educators use data to make instructional decisions consists mainly of studies that do not use a causal design (such as qualitative and descriptive studies), as well as secondary analyses (such as literature reviews, meta-analyses, and implementation guides). Most of the literature consulted provides context for and examples of the recommended steps. In drawing from this research to formulate this guide, the panel developed recommendations that are accompanied by low evidence ratings, because few studies used causal designs testing the effective-ness of these recommendations. Of those studies that used causal designs, four met WWC standards with or without reserva-tions.157 None of those four directly tested the effectiveness of the discrete practices recommended by the panel (i.e., the experi-mental condition in the studies combined a recommended practice with other aspects, which means that the panel cannot attri-bute effects observed in the studies to the practices they advise).
This appendix describes the content and findings of some of the studies the panel used to inform its recommendations. It highlights how schools have implemented and are using processes for making in-structional changes based on student data and also discusses the findings of causal studies as they relate to the panel’s recom-mendations. For each recommendation, this appendix also presents a summary of one or more key studies both to illus-trate how the study supports the panel’s recommendation and to provide further examples for the reader.
157. Jones and Krouse (1988); May and Robinson (2007); Phillips et al. (1993); Wesson (1991).
Recommendation 1. Make data part of an ongoing cycle of instructional improvement
Level of evidence: Low
For this recommendation, the panel drew on its own expertise as well as examples within studies that used qualitative designs to describe how educators have imple-mented an inquiry cycle for data use. These resources provided needed details about the inquiry cycle, especially when, examin-ing the available evidence, the panel deter-mined that no studies rigorously tested the effect of using an inquiry cycle as a frame-work for data use on student achievement. One study, summarized below, illustrates how such a cycle can be implemented and indicates the types of data that teachers and administrators wish to use as they ex-amine performance, develop hypotheses, and modify instruction.
Example of a study that describes districts that make data part of an ongoing cycle of instructional improvement.
In a combined case study of two groups of schools, Herman and Gribbons (2001) de-scribe how the districts implemented an inquiry process, detailing the processes for assessing student performance, un-derstanding areas of curriculum strengths and weaknesses, and making curricular changes to address those strengths and weaknesses. The researchers coached the schools through implementing an inquiry process designed to raise student achieve-ment. Although the panel recognizes that coaching of this type will not be available to all schools or districts that implement an inquiry cycle for data use, this exam-ple illustrates one way that schools could implement such a cycle in the absence of coaching.
The researchers had the districts begin by assembling data from a variety of sources
APPENDIx D. TECHNICAL INFORMATION ON THE STUDIES
( 56 )
(recommendation 1, action step 1). Avail-able data were categorized as follows:
• achievement on state- and district-re-quired tests;
• language proficiency;
• demographics;
• program participation (e.g., Title I, gifted, special education); and
• attendance and course history (in sec-ondary schools).
To encourage study schools to initiate their inquiry processes and assist them with measuring student progress (recom-mendation 1, action step 2), the research-ers asked schools to begin their data anal-ysis by reflecting on three descriptive questions: (1) How are we doing? (2) Are we serving all students well? and (3) What are our relative strengths and weaknesses? Schools were given a report card, which summarized existing data in the categories listed above, as a tool for school admin-istrators to communicate about the pro-cess and initiate discussions about needs and goals with staff and parents. Based on these initial measures, the schools developed hypotheses (recommendation 1, action step 2) about student achieve-ment. For example, one secondary school noticed that most of the students had not come from the typical feeder school and had concerns about whether a discontinu-ity of curriculum for students not coming via the typical route might cause achieve-ment problems. The school hypothesized that students who had attended the local middle school might have higher achieve-ment on some measures than would stu-dents from a different background. The school then engaged in a comparison of the achievement of students who fed into the school from different locations.
After testing this hypothesis, the sec-ondary school discovered that students being bused from more remote locations had particular problems in 10th-grade math achievement. Upon further discus-sion and analysis of this lesson from the data (recommendation 1, action step 3), the school discovered a potential curricu-lum problem. The school conducting the analysis used a nontraditional math se-quence, which was aligned to the curricu-lum from the local middle school because it offered the first course in that sequence before sending students to high school, but students from other areas took a dif-ferent course, resulting in a discontinuity of curriculum for those students. In fact, similarly bussed students who attended the last year of middle school at the tradi-tional feeder school did not have problems in 10th-grade math that were as severe as those of their bussed peers who came from a different middle school. Therefore, the school decided to modify instruction (recommendation 1, action step 3) by pro-viding a spring and summer course for stu-dents from nontraditional feeder schools who failed the first semester of math. The school also provided additional curricu-lum supports to help bring the students up to speed with their peers.
Finally, in keeping with the cyclical na-ture of the inquiry process, school staff assessed the effectiveness of the instruc-tional modification by examining data from students who took the new course.
Recommendation 2. Teach students to examine their own data and set learning goals
Level of evidence: Low
The panel identified two randomized ex-periments that met WWC standards (one of these with reservations) while testing the effectiveness of instructional practices

APPEN
DIx
D. T
ECH
NIC
AL IN
FOR
MAT
ION
ON
TH
E STU
DIES
( 57 )
Table D1. Studies cited in recommendation 2 that meet WWC standards with or without reservations
Brief Citation Population Grade Intervention Comparison Outcome Results
Phillips et al. (1993)
General education class-rooms in a southeastern, urban school district
2–5 (1) Curriculum-based mea-surement (CBM) combined with instructional recom-mendations and peer tu-toring assignments. CBM consisted of biweekly as-sessments that provided information about trend scores and students to watch.
(2) CBM alone. (Both CBM conditions in-cluded student feedback.)
(3) Control group with which teachers used their conventional prac-tices for planning and monitoring.
Number dig-its correct on Math Operations Test–Revised.
(1) vs. (2): +41, ns(1) vs. (3): +107, sig(2) vs. (3): +51, ns
May and Robinson (2007)a
Randomly selected districts in Ohio
High school students and teachers
Personalized Assessment Reporting System (PARS), a report of the Ohio gradua-tion test (OGT) for teachers, parents, and students with colorful and graphic summa-ries of student performance, and an interactive website with advice for students to improve their scores.
Standard OGT reports for teachers, parents, and students with less color and graphics. All districts (including treatment) could access website of practice tests.
(1) OGT scaled scores
(2) OGT retake scores (among students failing at least one sub-test on first try)
(1) Authors report no significant difference between students in treatment and com-parison districts.
(2) PARS students were more likely than control students to retake the test and to score higher in math, science, and social studies.
ns=not significantsig=statistically significant
a. May and Robinson (2007) did not report the means and standard deviations needed for the WWC to calculate effect sizes or confirm the statistical significance of the authors’ claims.

APPENDIx D. TECHNICAL INFORMATION ON THE STUDIES
( 58 )
that included student self-examination of assessment data among other elements.158 However, neither study tested the sole ef-fect of student data use; rather, students’ involvement with their own data was part of multifaceted interventions in which teachers and specialized staff also were using student data (Table D1). In the first study, there were large effects on student achievement, one of which was statisti-cally significant. Authors of the second study also reported significant achieve-ment effects, but the WWC could not con-firm that finding because the study did not report the means and standard deviations used to calculate the effects.
In the first study, Phillips et al. (1993) com-pared two curriculum-based measure-ment (CBM) interventions, both of which included a student feedback component, to a non-CBM condition. The study re-ported large positive effects of both CBM interventions, but only the comparison of CBM combined with teacher feedback on instructional recommendations versus the non-CBM condition was statistically sig-nificant.159 Students analyzing their own performance in this study were reportedly reflecting on data using questions such as “Can I beat my highest score in the next two weeks?” and “Which skills can I work harder on in the next two weeks?” Teacher feedback included instructing students on how they can interpret their progress graphs and skills profiles as well as coach-ing students to ask questions about their data to diagnose areas for improvement.
The second experiment compared two school districts in Ohio, both of which re-leased reports about student performance on an annual state test to teachers, parents, and students. An interactive website used by these districts also allowed students in the treatment condition to access directions
158. May and Robinson (2007); Phillips et al. (1993).
159. Phillips et al. (1993).
on how to improve their scores and skills through online tutorials and question-and-answer sessions.160 Although the authors reported that students in the treatment condition were more likely than other stu-dents to retake the test after failing at least one subtest—and to have higher scores in math, science, and social studies when they did retake the test—the study did not re-port the means and standard deviations of the outcome measures, so the WWC was not able to verify statistical significance.
To provide readers with a sense of how students use data and teachers provide feedback, the panel offers the following example from a study that used a less rig-orous design.
Example of a study that describes how a teacher can explain expectations, provide timely and constructive feedback, and help students learn from that feedback.
Clymer and Wiliam’s (2007) pilot study of a standards-based grading system at a sub-urban Pennsylvania 8th-grade classroom is closely related to the panel’s first two suggested action steps in recommenda-tion 2. The teacher in the study mapped 10 content standards to five marking peri-ods and identified tasks and skills for stu-dents to improve their proficiency on each standard. The teacher then developed a performance-rating system using a colored “stoplight” to reflect beginning knowledge (red), developing knowledge (yellow), or mastery (green) of these standards. The colored categories translated into numeric scores at the end of each marking period and were aggregated to generate a stu-dent’s overall grade in the course.
The teacher explained expectations (recom-mendation 2, action step 1) by sharing the content standards and corresponding rat-ings with the students and explaining that grades would be based on understanding
160. May and Robinson (2007).
APPENDIx D. TECHNICAL INFORMATION ON THE STUDIES
( 59 )
of the material at the end of each marking period. Rather than assigning grades, the teacher provided feedback (recommen-dation 2, action step 2) to students with weekly reports on their progress toward each standard (using the colored stoplight) and helped students learn from that feed-back (recommendation 2, action step 3) by encouraging them to revise their work or complete additional assignments to dem-onstrate better mastery in red and yellow areas. The panel considers this type of feedback to be both timely and construc-tive. The study also suggested that the teacher provide tools to help students learn from this feedback, but did not describe the tools or feedback process in detail.
The authors reported that the class in the pilot study showed greater achievement gains in science over the course of a school year than did a similar class not participat-ing in the pilot, although they caution that the design of the study means that these results may not be generalizable to other classrooms. When surveyed, students par-ticipating in the study also reported that receiving teacher feedback about how to correct their performance, as well as their accuracy, was helpful.
Recommendation 3. Establish a clear vision for schoolwide data use
Level of evidence: Low
The panel used several studies with quali-tative designs as resources for information on how some schools have implemented practices similar to those they recom-mend, and for concrete examples to clarify its suggested action steps. This section provides brief overviews of specific quali-tative studies that showcase examples of how the recommended action steps have been implemented. No studies examined by the panel used a causal design to ex-amine how establishing a vision for data use affects student achievement.
Examples of establishing and depending on schoolwide leadership for continuous data use.
A case study by Halverson et al. (2007) examined the practices of four schools recognized for their strong leadership in using data to make instructional decisions (while also recording student achievement gains). The researchers gathered data through structured interviews with prin-cipals and other school leaders as well as through observations of staff meetings and events relevant to data use.
In these four schools, principals and teach-ers met regularly to reflect on assessment results and to discuss how to modify prac-tice. Administrators provided activities for teachers and principals to work together to discern patterns in the data and to de-velop hypotheses and courses of action to address perceived needs for instructional change. At several school-level faculty meetings throughout the year, staff revis-ited the goals. Faculty meetings around data occurred at least quarterly in study schools, and one school had weekly meet-ings focused on students’ behavioral data. Staff involved in school-level data exami-nation and instructional change decisions included principals, classroom teachers, special education teachers, and school psychologists. Some examples of meth-ods that principals used to encourage their staff to take leadership for data use included scheduling small team meetings for all teachers in a given grade; inviting all staff to beginning and end-of-year meet-ings at which the school used achievement data to assess progress; and asking teach-ers to use annual assessment data to iden-tify areas in which the current curriculum had too much, or too little, emphasis on required concepts.
Example of how schools could approach defining teaching and learning concepts.

APPENDIx D. TECHNICAL INFORMATION ON THE STUDIES
( 60 )
Wayman, Cho, and Johnston (2007) con-ducted a case study of how a school district uses, and could more efficiently use, data for instructional decisions. The authors in-dicated that districts or systems in which staff do not have a shared definition of teaching and learning will experience bar-riers and challenges to agreeing on learn-ing goals, and they specifically advocated that the educators should begin by answer-ing four questions about data and instruc-tion: “(1) What do we mean by learning and achievement? (2) How will we conduct and support teaching and learning? (3) How will we know teaching and learning when we see it? (4) What action will we take based on our results?” (p. 42). The panel provides these questions as examples but recognizes that the answers to these questions will vary widely as schools and districts re-spond in ways that account for their local circumstances.
Example of districts that develop a written plan to use data in support of articulated goals.
Datnow, Park, and Wohlstetter (2007) con-ducted case studies of eight urban schools from two public school districts and two charter school systems. The study districts were selected from a pool of 25 districts that were recommended by researchers and experts in the field as being at the forefront of using performance results for instructional decision making. The researchers selected two schools per dis-trict/system after receiving recommenda-tions from district-level staff about which schools were most engaged in the process of using data to inform instruction. In each district, researchers interviewed staff from the central office, building-level staff at each school, and at least five teachers per school, for a total of 70 staff interviews over the course of three months in 2006. The
researchers also conducted informal school and classroom observations and reviewed relevant documents.
In synthesizing the results from the eight schools, researchers identified that one practice the schools shared was their use of assessment data to set measurable goals for student, classroom, school, and system progress. The authors noted that setting goals for students is a “precondition for ef-fective data-driven decisionmaking” (p. 20). Schools found the most success in defining goals that were focused and specific. For example, in one district, the goals for the year were (1) all students will score a 3 and at least two-thirds of students will score a 4 on the schoolwide writing assignment; (2) all students will be at grade level for reading in the spring, or at least two levels above where they were in the fall; and (3) all students will be at the proficient level on the math benchmark test by the spring. Staff and administrators from all levels (classroom, building, and system) were in-volved in goal-setting decisions.
The authors concluded that the eight schools used the goal-setting process as a starting point for developing a system-wide plan for data use, forming the foun-dation for a data culture that had buy-in from staff at all levels. Leaders at the sys-tem level across the study schools re-ported that explicitly stating their expec-tations for when and how educators would use assessment data was instrumental in encouraging staff to use data rather than intuition to shape instructional decisions. At the schools in public districts, system leaders experienced more challenges fos-tering staff buy-in than did leaders in charter systems; researchers and staff at-tributed this to the need to overcome in-stitutional practices in the public districts that did not exist in charter schools.

APPENDIx D. TECHNICAL INFORMATION ON THE STUDIES
( 61 )
Table D2. Scheduling approaches for teacher collaboration
Time and Planning Strategies Activities
School A 1. Once every month, the school day begins two hours later—teachers meet during this time to engage in the activities de-scribed in the column to the right. School makes up this accumulated time by ex-tending the school year.
a. School staff review district standards and realign the assessments they use accordingly.
b. School staff continuously reevaluate this work and discuss and plan changes as needed.
School B 1. School staff is released early from school once per week for at least 45 minutes. This time is added to other days through-out the week.
2. The entire staff meets weekly for one hour before school. Staff decreased the “nuts and bolts” of the meetings and pri-oritized work related to assessment.
a. Schools use allotted time to align curric-ulum across grades with the state stan-dards. This process is driven by student assessment data.
b. School staff continuously reevaluate this work and discuss and plan changes as needed.
School C 1. Same-grade teachers meet informally during weekly planning periods and for-mally every six weeks. To accommodate these planning periods, students in entire grades are sent to “specials” (e.g., gym, art classes). Time also is allotted at regu-larly scheduled staff meetings.
2. Teachers are released from teaching du-ties several days each year and are re-placed by substitute teachers.
3. Teachers meet with the principal up to three times each year.
a. Staff discuss students’ progress according to the “developmental continuums” writ-ten by school staff.
b. Teachers administer individual assess-ments to students.
c. Staff discuss reports on assessment data from district research department.
School D 1. Teachers request time to meet with each other during school hours; substitutes are hired to support this. In addition, teach-ers meet after school.
2. Teachers meet in “within-grade” and “sub-ject area” teams during their planning hours once per week.
a. Staff members share knowledge gained from professional development activities that addressed curriculum and assess-ment. They also discuss student mastery of standards and other outcomes and possible intervention strategies.
Source: Cromey and Hanson (2000), p. 18.
APPENDIx D. TECHNICAL INFORMATION ON THE STUDIES
( 62 )
Recommendation 4. Provide supports that foster a data-driven culture within the school
Level of evidence: Low
The panel identified no causal studies meeting WWC standards that specifically examined the effectiveness of staff sup-ports with respect to student outcomes. Two randomized trials of interventions that included coaching for teachers around data use along with other treatment condition aspects met WWC standards (one with and one without reservations). In both cases, however, the treatment condition incor-porated many elements of which teacher support was just one, and neither reported a discernible effect on student achieve-ment.161 The panel examined other studies, which did not use designs rigorous enough to meet WWC standards, and noted specific examples of how the recommended action steps have been implemented.
In a randomized trial that met WWC stan-dards with reservations, Jones and Krouse (1988) randomly assigned student teachers to one of two groups that received coaching. One group received coaching on classroom management; the other received coaching on classroom management and data use for making instructional changes. The data-use intervention included individualized coach-ing by supervisors on how the teachers could use assessment and behavioral data to track student progress and make changes in the classroom. Teachers in the data-use group re-ported more frequently using pupil observa-tions to make instructional decisions, but the study authors make no claims about whether this difference was statistically significant, nor does the study include information the WWC would need to calculate statistical sig-nificance. There was also no statistically sig-nificant difference in the reading and math outcomes of the students assigned to these two groups of teachers.
161. Jones and Krouse (1988); Wesson (1991).
Another randomized trial, which met WWC standards, compared the reading achieve-ment of elementary school students with disabilities whose teachers used two types of progress monitoring (curriculum based versus teacher developed) and received two types of consultation from mentors (group and individual), for a total of four groups.162 Related to this recommendation was the au-thor’s finding that students whose teachers had group consultation did not perform as well as those whose teachers had individual coaching, but the effect was not statistically significant, failing to provide the panel with strong causal support for recommending that teachers receive individual versus group consultation.
To provide readers with a sense for how other schools designate structured time for data use and provide professional de-velopment to support staff data use, the panel offers the following examples from studies that used less rigorous designs.
Example of a school/district study that designates structured time for data use.
Cromey and Hanson (2000) conducted a qualitative study of how schools use as-sessment data from multiple sources, aim-ing to identify characteristics of schools that make valuable use of their data. After interviewing district administrators, prin-cipals, teachers, and other building staff from nine schools about how they collect and use student assessment data, the re-searchers identified six characteristics of schools with well-developed assessment systems. The characteristic most applicable to recommendation 4, action step 2, is that these schools specifically allocate time for their staff to reflect collaboratively on how they will use student assessment data to guide their instructional decisions. Table D2, drawn from this study, describes the approaches four schools used to schedule collaboration time. Although the panel did
162. Wesson (1991).
APPENDIx D. TECHNICAL INFORMATION ON THE STUDIES
( 63 )
not have evidence that these approaches are effective for increasing student achieve-ment, they reproduce this table here to pro-vide an array of examples to readers.
Example of how school/district provided targeted and regular professional development opportunities.
Anderegg’s (2007) case study of data use in several Alaska school districts has find-ings relevant to the panel’s third suggested action step for recommendation 4. The author explored several aspects of data use, including professional development around data use and analysis for teachers, school administrators, and district super-intendents. A mixed-method approach was used to collect and analyze data. The au-thor implemented a written survey in 53 districts, conducted follow-up telephone surveys, and studied paper records de-scribing data use and school in-service plans at select sites.
Survey questions focused on professional development targeted toward “the use of data analysis methods and skills, such as finding patterns and/or systemic relation-ships between variables” (p. 171), although respondents also were given the opportu-nity to respond to open-ended questions on existing and desired professional de-velopment. The majority of respondents reported receiving some kind of data train-ing, with 12 percent of administrators and four percent of teachers receiving training at least monthly. More than one-third of re-spondents reported never receiving such training. The study found that regular professional development (recommenda-tion 4, action step 3) around data use and analysis is not widespread.
The study’s findings suggest that teachers would be interested in receiving more fre-quent professional development around data use and analysis. All of the teachers receiving data training at least monthly reported that such training was sufficient,
compared to only three percent of respon-dents who never received training. Adminis-trators were less likely than teachers to show interest in more frequent training—only 14 percent of administrators reporting no train-ing thought that this was insufficient.
Teachers, administrators, and superinten-dents proposed ways to improve profes-sional development around data use and analysis. A majority of all respondents suggested that data training be focused on analysis to inform teachers’ day-to-day implementation of “standards, curriculum, and instruction” and provide resources for doing so (p. 114). All three groups also ad-dressed the frequency of data training—the majority of superintendents and ad-ministrators cited the need to engage in “ongoing discussions and analysis,” and more than one-quarter of teachers sug-gested that they needed more time to ana-lyze and discuss data and plan accordingly (p. 116). Sixty-three percent of superinten-dents cited the need for access to disag-gregated data or training on “specific data analysis tools” (p. 89).
Given that this study was conducted in mostly rural Alaska school districts, the author cautions that these findings may not be representative of more urban dis-tricts or those in other states. Further-more, this study does not present any evidence suggesting that frequent and targeted professional development leads to increased data use and analysis and will support the overall goal of creating a data-driven culture within a school.
Recommendation 5. Develop and maintain a districtwide data system
Level of evidence: Low
The panel identified no studies that used a rigorous design to test how developing and maintaining a data system impact stu-dent achievement. To assist districts with

APPENDIx D. TECHNICAL INFORMATION ON THE STUDIES
( 64 )
thinking through the process of obtaining, launching, and maintaining a system, the panel drew examples from qualitative and descriptive studies of how other districts have approached the challenge of identi-fying the correct data system.
Example of how one school district involved stakeholders in the decision to build a data system, articulated requirements, and then implemented the new system.
Long et al. (2008) conducted an implemen-tation study of a data warehouse in one school district by conducting interviews with staff at all levels. When this school district determined it should build (rec-ommendation 5, action step 3) its own data warehouse to meet rising state and federal data needs, the district’s account-ability and research department led the team that developed the new system. To involve stakeholders (recommendation 5, action step 1) in selecting the system and to articulate system requirements (recom-mendation 5, action step 2), that depart-ment began by assessing the needs of data users. Then, the team planned and staged implementation (recommendation 5, ac-tion step 4) of the system by building one system module at a time, a process that the developers reported “kept [the project] alive by not trying to design every part of the system at once” (p. 216). Some features of the final system include
• combining data from multiple sources, including assessment, demographic, school profile, and special program data;
• providing access to handouts, a sta-tistics chat, and frequently asked questions;
• creating a graphing tool that enables users to examine assessment and de-mographic data from different peri-ods of time and at different levels of
aggregation. Users access the report-ing features using predesigned queries and web-based reports; and
• providing access to instructional sug-gestions based on a student’s perfor-mance that teachers can link to from the area on students’ assessment data.
Example of how a group of districts involved stakeholders, articulated system requirements, and implemented new data systems (both built and bought).
Mieles and Foley (2005) conducted a case study focused on the implementation pro-cesses, successes, and challenges of data-warehouse technology. The study was based on interview data from educators and ed-ucation-technology experts in eight urban school districts that were at different points in the process of implementing data ware-houses. The eight districts involved stake-holders (recommendation 5, action step 1) in systems decisions by engaging staff from multiple levels. These stakeholders included superintendents, principals, school board members, experts at neighboring school districts, staff with expertise in instruc-tion and assessment, and external vendors with technical expertise. Six of the districts convened planning committees staffed by stakeholders with different roles.
These committees articulated systems re-quirements (recommendation 5, action step 2) by developing needs assessments and planned for staged rollouts by coming to agreement on what data the system would collect and use, who would use it, and what systems would be replaced by the new ap-proach. In the final product, the staff inter-viewed for the study had a range of formats and levels of access to reports that drew on the warehouse data. Particularly useful to these staff was the ability to “drill down” and explore the demographic and admin-istrative data in the warehouse to look for patterns of how they might be associated with achievement. In some districts, the

APPENDIx D. TECHNICAL INFORMATION ON THE STUDIES
( 65 )
capability to do so was limited by staff roles for security and confidentiality reasons. To address security concerns, some districts introduced or planned to introduce differ-entiated access to their data warehouse by staff role in order to protect privacy and provide security.
When planning and staging implementa-tion (recommendation 5, action step 4), some districts participating in the study requested demonstrations or pilots and got feedback from users about system features before full implementation of a data warehouse. Most districts had imple-mented a data warehouse within a year of beginning their inquiry process, and all districts experienced ongoing modifica-tions and expansions to the system after it was implemented based on increased ca-pacity and growing demands from users. Districts not using external vendors found that cross-departmental communication and onsite support from internal staff for those using the data warehouse were es-sential to implementation. Some districts faced unexpectedly onerous challenges with cleaning and integrating data that originated from multiple sources and in-dicated that data dictionaries defining the values of variables were a successful long-term solution for some districts that began with data quality difficulties. After launching a data warehouse, all study dis-tricts discovered that they needed more time and resources than expected for data quality assurance, but they also found that high-quality data were essential to con-vincing staff to use the new system.
Example of a study advising a school district on how to proceed with its data-system decisions, including issues of which staff to involve in choosing system requirements and implementing the system.
Wayman, Cho, and Johnston (2007), after being commissioned to conduct an in-depth case study of one district’s data use
capacities and needs, advised the district to involve stakeholders (recommendation 5, action step 1) from “every level of the district” (p. 11), in a conversation about what data mean and why they are impor-tant and useful to staff. Then, the authors advised the district to acquire an integrated computer data system, beginning with a clearly articulated understanding of sys-tem requirements (recommendation 5, ac-tion step 2). The authors advised that the final system should be intuitive, easy to use, and flexible to pull data from or export data to other systems or programs. This in-teroperability of systems and ease of use, when available together, could allow staff to overcome barriers that had previously pre-vented them from optimal use of student data to inform their decisions. The authors further recommended that the district care-fully consider security needs for their data system as their data-based decision-making process evolved. Specific suggestions in-cluded development of policies to govern which staff should have access to which types of data, how and when staff should access data, and how the system would be encrypted or otherwise protected. In this study, the authors specifically advised the district to buy a data warehouse (recom-mendation 5, action step 3) to hold all of these data from multiple sources, based on their evaluation of the district, which showed that it needed a system immedi-ately and did not have the technical capac-ity to build one.
Finally, they advised the district to plan an implementation (recommendation 5, ac-tion step 4) that consisted of a gradual roll-out of new system pieces, beginning with those that “will provide the most value and immediate impact” (p. 52) in order to keep the implementation process moving while simultaneously gaining user buy-in.

( 66 )
References
Aarons, D. I. (2009). Enthusiasm builds for data systems. Education Week, 28(34), 18–19.
Abbott, D. V. (2008). A functionality frame-work for educational organizations: Achieving accountability at scale. In E. Mandinach & M. Honey (Eds.), Data driven school improvement: Linking data and learning (pp. 257–276). New York: Teachers College Press.
American Educational Research Associa-tion, American Psychological Associa-tion, & National Council on Measurement in Education. (1999). The standards for educational and psychological testing. Washington, DC: American Educational Research Association Publications.
American Psychological Association. (2002). Criteria for practice guideline development and evaluation. American Psychologist, 57(12), 1048–1051.
American Recovery and Reinvestment Act of 2009, S. 1, 111th Congress, 1st Ses-sion (2009).
Anderegg, C. C. (2007). Classrooms and schools analyzing student data: A study of educational practice (Doctoral dis-sertation, Pepperdine University, 2007). Dissertation Abstracts International, 68(02A), 184–538.
Anderson, J., Goertz, M. E., Goldwasser, M., Hovde, K., Massell, D., Mueller, J. A., et al. (2006). SchoolNet: A case study of imple-mentation in three schools. Philadelphia, PA: Consortium for Policy Research in Education.
Armstrong, J., & Anthes, K. (2001). How data can help: Putting information to work to raise student achievement. American School Board Journal, 188(11), 38–41.
Arnold, J. G. (2007). School capacity for data-driven decision making and stu-dent achievement. Unpublished doc-toral dissertation, University of South Carolina, Columbia, SC.
Bettesworth, L. R. (2006). Administrators’ use of data to guide decision-making.
Unpublished doctoral dissertation, Uni-versity of Oregon, Eugene, OR.
Bigger, S. L. (2006). Data-driven decision-making within a professional learning community: Assessing the predictive quali-ties of curriculum-based measurements to a high-stakes, state test of reading achievement at the elementary level. Un-published doctoral dissertation, Univer-sity of Pennsylvania, Philadelphia, PA.
Black, P., Harrison, C., Lee, C., Marshall, B., & Wiliam, D. (2003). Assessment for learning: Putting it into practice. Maid-enhead, UK: Open University Press.
Black, P., & Wiliam, D. (1998). Assessment and classroom learning. Assessment in Education, 5(1), 7–74.
Booher-Jennings, J. (2005). Below the bubble: “Educational triage” and the Texas Accountability System. American Educational Research Journal, 42(2), 231–268.
Breiter, A., & Light, D. (2006). Data for school improvement: Factors for de-signing effective information systems to support decision-making in schools. Educational Technology and Society, 9(3), 206–217.
Brunner, C., Fasca, C., Heinze, J., Honey, M., Light, D., Mandinach, E., et al. (2005). Linking data and learning: The Grow Net-work study. Journal of Education for Stu-dents Placed At Risk, 10(3), 241–267.
Choppin, J. (2002, April). Data use in prac-tice: Examples from the school level. Paper presented at the annual meeting of the American Educational Research Association, New Orleans, LA.
Chrismer, S. S., & DiBara, J. (2006). Formative Assessment of Student Thinking in Read-ing (FAST-R): An evaluation of the use of FAST-R in the Boston public schools. Cam-bridge, MA: Education Matters, Inc.
Clymer, J. B., & Wiliam, D. (2007). Improv-ing the way we grade science. Educa-tional Leadership, 64, 36–42.
Copland, M. A. (2003). Leadership of inquiry: Building and sustaining capacity for school improvement. Educational Evalu-ation and Policy Analysis, 25(4), 375–395.

REFERENCES
( 67 )
Cromey, A., & Hanson, M. (2000). An ex-ploratory analysis of school-based stu-dent assessment systems. Oak Brook, IL: North Central Regional Educational Laboratory (NCREL).
Datnow, A., Park, V., & Wohlstetter, P. (2007). Achieving with data: How high-performing school systems use data to improve instruction for elementary stu-dents. Los Angeles, CA: University of Southern California, Center on Educa-tional Governance.
Elmore, R. F. (2003). Doing the right thing, knowing the right thing to do: School im-provement and performance-based ac-countability. Washington, DC: National Governors Association Center for Best Practices.
Feldman, J., & Tung, R. (2001). Using data-based inquiry and decision making to improve instruction. ERS Spectrum: Journal of School Research and Informa-tion, 19(3), 10–19.
Fiarman, S. E. (2007). Planning to assess prog-ress: Mason Elementary School refines an instructional strategy. In K. P. Boudett & J. L. Steele (Eds.), Data wise in action: Stories of schools using data to improve teaching and learning (pp. 125–148). Cambridge, MA: Harvard Education Press.
Field, M. J., & Lohr, K. N. (Eds.). (1990). Clini-cal practice guidelines: Directions for a new program. Washington, DC: National Academy Press.
Forman, M. L. (2007). Developing an action plan: Two Rivers Public Charter School fo-cuses on instruction. In K. P. Boudett & J. L. Steele (Eds.), Data wise in action: Stories of schools using data to improve teaching and learning (pp. 107–124). Cambridge, MA: Harvard Education Press.
Garrison, C., & Ehringhaus, M. (2009). For-mative and summative assessment in the classroom. National Middle School Asso-ciation. Retrieved April 15, 2009, from http://www.nmsa.org/Publications/WebExclusive/Assessment/tabid/1120/Default.aspx.
Gentry, D. R. (2005). Technology supported data-driven decision-making in an
Oklahoma elementary school. Unpub-lished doctoral dissertation, University of Oklahoma, Norman, OK.
Halverson, R., Grigg, J., Prichett, R., & Thomas, C. (2007). The new instruc-tional leadership: Creating data-driven instructional systems in schools. Journal of School Leadership, 17(2), 158–193.
Halverson, R., Prichett, R. B., & Watson, J. G. (2007). Formative feedback systems and the new instructional leadership. Madison, WI: University of Wisconsin.
Halverson, R., & Thomas, C. N. (2007). The roles and practices of student services staff as data-driven instructional leaders. In M. Mangin & S. Stoelinga (Eds.), Instruc-tional teachers leadership roles: Using re-search to inform and reform (pp. 163–200). New York: Teachers College Press.
Hamilton, L. (2003). Assessment as a policy tool. Review of Research in Education, 27, 25–68.
Hamilton, L. S., Stecher, B. M., Marsh, J. A., McCombs, J. S., Robyn, A., Russell, J. L., et al. (2007). Standards-based account-ability under No Child Left Behind: Expe-riences of teachers and administrators in three states. Santa Monica, CA: RAND Corporation.
Herman, J., & Gribbons, B. (2001). Lessons learned in using data to support school in-quiry and continuous improvement: Final report to the Stuart Foundation. Los Ange-les, CA: University of California, Center for the Study of Evaluation (CSE).
Hill, D., Lewis, J., & Pearson, J. (2008). Metro Nashville Public Schools student assessment staff development model. Nashville, TN: Vanderbilt University, Peabody College.
Huffman, D., & Kalnin, J. (2003). Collabora-tive inquiry to make data-based deci-sions in schools. Teaching and Teacher Education, 19(6), 569–580.
Ingram, D., Louis, K. S., & Schroeder, R. G. (2004). Accountability policies and teacher decision making: Barriers to the use of data to improve practice. Teach-ers College Record, 106(6), 1258–1287.
Jones, E. D., & Krouse, J. P. (1988). The ef-fectiveness of data-based instruction
REFERENCES
( 68 )
by student teachers in classrooms for pupils with mild learning handicaps. Teacher Education and Special Educa-tion, 11(1), 9–19.
Kerr, K. A., Marsh, J. A., Ikemoto, G. S., Darilek, H., & Barney, H. (2006). Strat-egies to promote data use for instruc-tional improvement: Actions, outcomes, and lessons from three urban districts. American Journal of Education, 112(4), 496–520.
Kluger, A. N., & DeNisi, A. (1996). The ef-fects of feedback interventions on per-formance: A historical review, a meta-analysis, and a preliminary feedback intervention theory. Psychological Bul-letin, 119(2), 254.
Knapp, M. S., Swinnerton, J. A., Copland, M. A., & Monpas-Huber, J. (2006). Data-in-formed leadership in education. Seattle, WA: University of Washington, Center for the Study of Teaching and Policy.
Koretz, D. (2003). Using multiple measures to address perverse incentives and score inflation. Educational Measure-ment: Issues and Practice, 22(2), 18–26.
Koretz, D. M., & Barron, S. I. (1998). The validity of gains in scores on the Ken-tucky Instructional Results Information System (KIRIS). Santa Monica, CA: RAND Corporation.
Lachat, M. A., & Smith, S. (2005). Practices that support data use in urban high schools. Journal of Education for Stu-dents Placed At Risk, 10(3), 333–349.
Lane, C., Marquardt, J., Meyer, M. A., & Murray, W. (1997). Addressing the lack of motivation in the middle school set-ting. Chicago, IL: St. Xavier University, Master’s action research project.
Lee, D., & Gavine, D. (2003). Goal-setting and self-assessment in Year 7 students. Educational Research, 45(1), 49–59.
Leithwood, K., Louis, K. S., Anderson, S., & Wahlstrom, K. (2007). Review of research: How leadership influences student learn-ing. Minneapolis, MN: University of Min-nesota, Center for Applied Research and Educational Improvement.
Liddle, K. (2000). Data-driven success: How one elementary school mined assess-ment data to improve instruction. Amer-ican School Board Journal. Retrieved April 19, 2009, from http://www.asbj.com/MainMenuCategory/Archive.aspx.
Light, D., Wexler, D. H., & Heinze, J. (2005). Keeping teachers in the center: A frame-work for data-driven decision-making. Technology and Teacher Education An-nual, 1, 128.
Long, L., Rivas, L. M., Light, D., & Mandi-nach, E. B. (2008). The evolution of a homegrown data warehouse: TUSDStats. In E. B. Mandinach & M. Honey (Eds.), Data-driven school improvement: Link-ing data and learning (pp. 209–232). New York: Teachers College Press.
Mandinach, E. B., Honey, M., Light, D., Heinze, C., & Rivas, L. (2005, June). Creating an evaluation framework for data-driven decision-making. Paper pre-sented at the National Educational Com-puting Conference, Philadelphia, PA.
Marsh, J. A., Pane, J. F., & Hamilton, L. S. (2006). Making sense of data-driven de-cision making in education: Evidence from recent RAND research (OP-170). Santa Monica, CA: RAND Corporation.
Marsh, J. A., McCombs, J. S., Lockwood, J. R., Martorell, F., Gershwin, D., Naftel, S., et al. (2008). Supporting literacy across the sunshine state: A study of Florida middle school reading coaches. Santa Monica, CA: RAND Corporation.
Mason, S. (2002). Turning data into knowl-edge: Lessons from six Milwaukee public schools. Madison, WI: Wisconsin Center for Education Research.
Mason, S. A. (2003, April). Learning from data: The role of professional learning communities. Paper presented at the an-nual meeting of the American Educational Research Association, Chicago, IL.
May, H., & Robinson, M. A. (2007). A ran-domized evaluation of Ohio’s Person-alized Assessment Reporting System (PARS). Philadelphia, PA: Consortium for Policy Research in Education.
REFERENCES
( 69 )
Means, B., Padilla, C., DeBarger, A., & Bakia, M. (2009). Implementing data-informed decision making in schools—teacher ac-cess, supports and use. Washington, DC: U.S. Department of Education.
Merriam-Webster Online Dictionary. (2009). Hypothesis. Retrieved April 22, 2009, from http://www.merriam-webster.com/dictionary/hypothesis.
Mid-Continent Research for Education and Learning (McREL). (2003). Sustaining school improvement: Data-driven deci-sion making. Aurora, CO: Author.
Mieles, T., & Foley, E. (2005). Data ware-housing: Preliminary findings from a study of implementing districts. Prov-idence, RI: Annenberg Institute for School Reform.
Moody, L., & Dede, C. (2008). Models of data-based decision-making: A case study of the Milwaukee Public Schools. In E. B. Mandinach & M. Honey (Eds.), Data-driven school improvement: Link-ing data and learning (pp. 233–254). New York: Teachers College Press.
Nabors Oláh, L., Lawrence, N., & Riggan, M. (2008, March). Learning to learn from benchmark assessment data: How teach-ers analyze results. Paper presented at the annual meeting of the American Educa-tional Research Association, New York.
Obama, B. (2009, March 10). Remarks by the president to the Hispanic Chamber of Commerce on a complete and competi-tive American education. Retrieved April 20, 2009, from http://www.whitehouse.gov/the_press_office/Remarks-of-the-President-to-the-United-States-Hispanic-Chamber-of-Commerce/.
Owings, C. A., & Follo, E. (1992). Effects of portfolio assessment on students’ attitudes and goal setting abilities in mathematics. Rochester, MI: Oakland University.
Perie, M., Marion, S., & Gong, B. (2007). A framework for considering interim as-sessments. Dover, NH: National Center for the Improvement of Educational Assessment.
Phillips, N. B., Hamlett, C. L., Fuchs, L. S., & Fuchs, D. (1993). Combining classwide
curriculum-based measurement and peer tutoring to help general educators provide adaptive education. Learning Disabilities Research & Practice, 8(3), 148–156.
Ramnarine, S. (2004). Impacting student achievement through data-driven de-cision-making. MultiMedia & Internet @Schools, 11(4), 33–35.
Rossmiller, R. A., & Holcomb, E. L. (1993, April). The Effective Schools process for continuous school improvement. Paper presented at the annual meeting of the American Educational Research Asso-ciation, Atlanta, GA.
Schunk, D. H., & Swartz, C. W. (1992, April). Goals and feedback during writing strat-egy instruction with gifted students. Paper presented at the annual meeting of the American Educational Research Association, San Francisco, CA.
Shepard, L. A. (1995). Using assessment to improve learning. Educational Leader-ship, 52(5), 38–43.
Shepard, L. A., Flexer, R. J., Hiebert, E. H., Marion, S. F., Mayfield, V., & Weston, T. J. (1996). Effects of introducing classroom performance assessments on student learning. Educational Measurement: Is-sues and Practice, 15(3), 7–18.
Spillane, J. P., Halverson, R., & Diamond, J. B. (2004). Towards a theory of leadership practice: A distributed perspective. Jour-nal of Curriculum Studies, 36(1), 3–34.
Stecker, P. M. (1993). Effects of instructional modifications with and without curric-ulum-based measurement on the math-ematics achievement of students with mild disabilities (Doctoral dissertation, Vanderbilt University, 1993). Disserta-tion Abstracts International, 55 (01A).
Stiggins, R. (2007). Assessment through the student’s eyes. Educational Leader-ship, 64(8), 22–26.
Supovitz, J. A. (2006). The case for district-based reform: Leading, building, and sustaining school improvement. Cam-bridge, MA: Harvard Education Press.
Supovitz, J. A., & Klein, V. (2003). Mapping a course for improved student learning: How innovative schools systematically
REFERENCES
( 70 )
use student performance data to guide improvement. Philadelphia, PA: Univer-sity of Pennsylvania, Consortium for Policy Research in Education.
Supovitz, J. A., & Weathers, J. (2004). Dash-board lights: Monitoring implementation of district instructional reform strate-gies. Philadelphia, PA: University of Pennsylvania, Consortium for Policy Research in Education.
Thorn, C. A. (2001). Knowledge management for educational information systems: What is the state of the field? Education Policy Analysis Archives, 9(47), 17–36.
Thurman, R., & Wolfe, K. (1999). Improving academic achievement of underachiev-ing students in a heterogeneous class-room. Chicago, IL: St. Xavier University, Master’s action research project.
Togneri, W. (2003). Beyond islands of ex-cellence: What districts can do to im-prove instruction and achievement in all schools—A leadership brief. Washing-ton, DC: Learning First Alliance.
U.S. Department of Education. (2009). Using ARRA funds to drive school re-form and improvement. Retrieved April 24, 2009, from www.ed.gov/policy/gen/leg/recovery/guidance/uses.doc.
Van Wagner, K. (n.d.). About.com/psychol-ogy/correlational studies. Retrieved April 11, 2009, from http://psychology.about.com/od/researchmethods/a/cor-relational.htm.
Waters, J. T., & Marzano, R. J. (2006). School district leadership that works: The ef-fect of superintendent leadership on student achievement. Denver, CO: Mid-Continent Research for Education and Learning (McREL).
Wayman, J. C. (2005). Involving teach-ers in data-driven decision making: Using computer data systems to sup-port teacher inquiry and reflection. Journal of Education for Students Placed At Risk, 10(3), 295–308.
Wayman, J. C., Brewer, C., & Stringfield, S. (2009, April). Leadership for effective data use. Paper presented at the annual
meeting of the American Educational Research Association, San Diego, CA.
Wayman, J. C., & Cho, V. (2008). Preparing educators to effectively use student data systems. In T. J. Kowalski & T. J. Lasley (Eds.), Handbook on data-based decision-making in education (pp. 89–104). New York: Routledge.
Wayman, J. C., Cho, V., & Johnston, M. T. (2007). The data-informed district: A dis-trict-wide evaluation of data use in the Natrona County School District. Austin, TX: The University of Texas.
Wayman, J. C., & Conoly, K. (2006). Manag-ing curriculum: Rapid implementation and sustainability of a districtwide data initiative. ERS Spectrum, 24(2), 4–8.
Wayman, J. C., Midgley, S., & Stringfield, S. (2006). Leadership for data-based de-cision-making: Collaborative educator teams. In A. B. Danzig, K. M. Borman, B. A. Jones, & W. F. Wright (Eds.), Learner-centered leadership: Research, policy, and practice (pp. 189–206). Mahwah, NJ: Lawrence Erlbaum Associates.
Wayman, J. C., & Stringfield, S. (2006). Tech-nology-supported involvement of entire faculties in examination of student data for instructional improvement. American Journal of Education, 112(4), 549–571.
Wayman, J. C., Stringfield, S., & Yakimowski, M. (2004). Software enabling school im-provement through analysis of student data (Rep. No. 67). Baltimore, MD: Cen-ter for Research on the Education of Stu-dents Placed at Risk (CRESPAR).
Wesson, C. L. (1991). Curriculum-based measurement and two models of follow-up consultation. Exceptional Children, 57(3), 246–256
Williams Rose, L. (2006). Middle Start schools striving for excellence: Steadily improving high-poverty schools in the Mid South Delta. New York: Academy for Educational Development.
Young, V. M. (2006). Teachers’ use of data: Loose coupling, agenda setting, and team norms. American Journal of Edu-cation, 112(4), 521–548.