using structured events to predict stock price movement ... · using structured events to predict...
TRANSCRIPT
Proceedings of the 2014 Conference on Empirical Methods in Natural Language Processing (EMNLP), pages 1415–1425,October 25-29, 2014, Doha, Qatar. c©2014 Association for Computational Linguistics
Using Structured Events to Predict Stock Price Movement:An Empirical Investigation
Xiao Ding†∗, Yue Zhang‡, Ting Liu†, Junwen Duan††Research Center for Social Computing and Information Retrieval
Harbin Institute of Technology, China{xding, tliu, jwduan}@ir.hit.edu.cn‡Singapore University of Technology and Design
Abstract
It has been shown that news events influ-ence the trends of stock price movements.However, previous work on news-drivenstock market prediction rely on shallowfeatures (such as bags-of-words, namedentities and noun phrases), which do notcapture structured entity-relation informa-tion, and hence cannot represent completeand exact events. Recent advances inOpen Information Extraction (Open IE)techniques enable the extraction of struc-tured events from web-scale data. Wepropose to adapt Open IE technology forevent-based stock price movement pre-diction, extracting structured events fromlarge-scale public news without manualefforts. Both linear and nonlinear mod-els are employed to empirically investigatethe hidden and complex relationships be-tween events and the stock market. Large-scale experiments show that the accuracyof S&P 500 index prediction is 60%, andthat of individual stock prediction can beover 70%. Our event-based system out-performs bags-of-words-based baselines,and previously reported systems trained onS&P 500 stock historical data.
1 Introduction
Predicting stock price movements is of clear in-terest to investors, public companies and govern-ments. There has been a debate on whether themarket can be predicted. The Random Walk The-ory (Malkiel, 1973) hypothesizes that prices aredetermined randomly and hence it is impossible tooutperform the market. However, with advancesof AI, it has been shown empirically that stock
∗This work was done while the first author was visitingSingapore University of Technology and Design
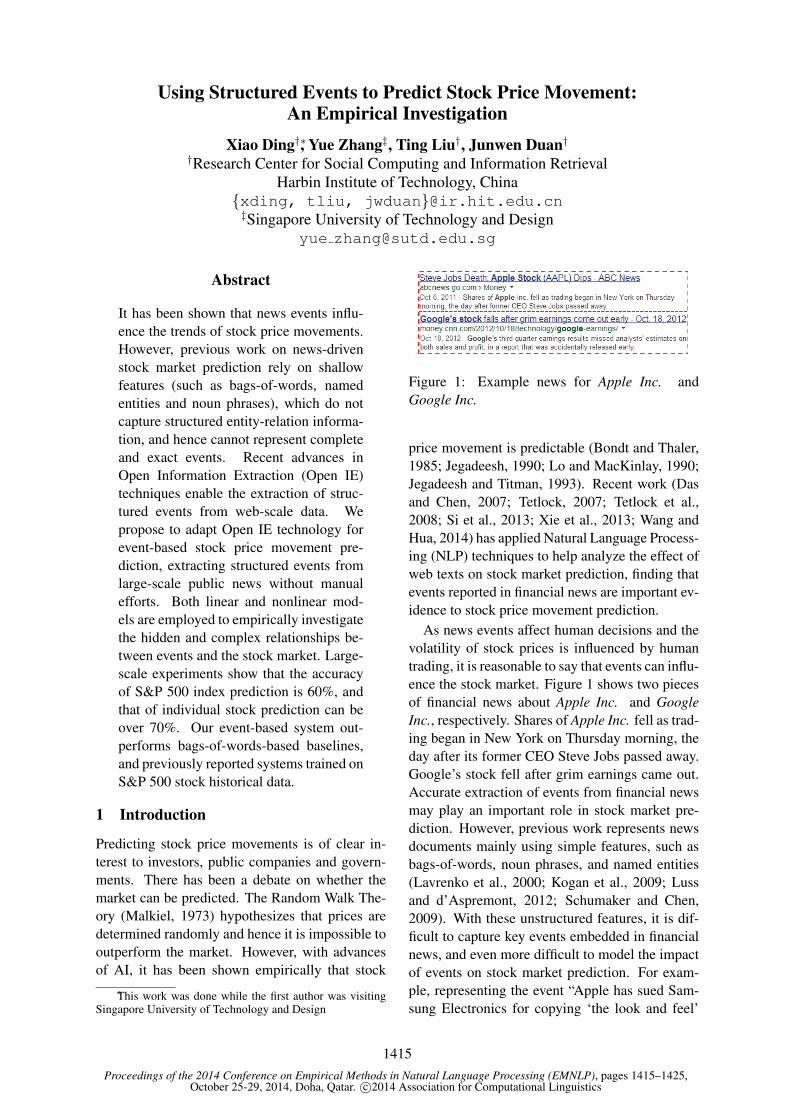
Figure 1: Example news for Apple Inc. andGoogle Inc.
price movement is predictable (Bondt and Thaler,1985; Jegadeesh, 1990; Lo and MacKinlay, 1990;Jegadeesh and Titman, 1993). Recent work (Dasand Chen, 2007; Tetlock, 2007; Tetlock et al.,2008; Si et al., 2013; Xie et al., 2013; Wang andHua, 2014) has applied Natural Language Process-ing (NLP) techniques to help analyze the effect ofweb texts on stock market prediction, finding thatevents reported in financial news are important ev-idence to stock price movement prediction.
As news events affect human decisions and thevolatility of stock prices is influenced by humantrading, it is reasonable to say that events can influ-ence the stock market. Figure 1 shows two piecesof financial news about Apple Inc. and GoogleInc., respectively. Shares of Apple Inc. fell as trad-ing began in New York on Thursday morning, theday after its former CEO Steve Jobs passed away.Google’s stock fell after grim earnings came out.Accurate extraction of events from financial newsmay play an important role in stock market pre-diction. However, previous work represents newsdocuments mainly using simple features, such asbags-of-words, noun phrases, and named entities(Lavrenko et al., 2000; Kogan et al., 2009; Lussand d’Aspremont, 2012; Schumaker and Chen,2009). With these unstructured features, it is dif-ficult to capture key events embedded in financialnews, and even more difficult to model the impactof events on stock market prediction. For exam-ple, representing the event “Apple has sued Sam-sung Electronics for copying ‘the look and feel’
1415
of its iPad tablet and iPhone smartphone.” usingterm-level features {“Apple”, “sued”, “Samsung”,“Electronics”, “copying”, ...} alone, it can be dif-ficult to accurately predict the stock price move-ments of Apple Inc. and Samsung Inc., respec-tively, as the unstructured terms cannot indicatethe actor and object of the event.
In this paper, we propose using structured in-formation to represent events, and develop a pre-diction model to analyze the relationship betweenevents and the stock market. The problem is im-portant because it provides insights into under-standing the underlying mechanisms of the influ-ence of events on the stock market. There are twomain challenges to this method. On the one hand,how to obtain structured event information fromlarge-scale news streams is a challenging problem.We propose to apply Open Information Extractiontechniques (Open IE; Banko et al. (2007); Et-zioni et al. (2011); Fader et al. (2011)), whichdo not require predefined event types or manu-ally labeled corpora. Subsequently, two ontolo-gies (i.e. VerbNet and WordNet) are used to gen-eralize structured event features in order to reducetheir sparseness. On the other hand, the problemof accurately predicting stock price movement us-ing structured events is challenging, since eventsand the stock market can have complex relations,which can be influenced by hidden factors. In ad-dition to the commonly used linear models, webuild a deep neural network model, which takesstructured events as input and learn the potentialrelationships between events and the stock market.
Experiments on large-scale financial newsdatasets from Reuters1 (106,521 documents)and Bloomberg2 (447,145 documents) show thatevents are better features for stock market predic-tion than bags-of-words. In addition, deep neu-ral networks achieve better performance than lin-ear models. The accuracy of S&P 500 index pre-diction by our approach outperforms previous sys-tems, and the accuracy of individual stock predic-tion can be over 70% on the large-scale data.
Our system can be regarded as one step towardsbuilding an expert system that exploits rich knowl-edge for stock market prediction. Our results arehelpful for automatically mining stock price re-lated news events, and for improving the accuracyof algorithm trading systems.
1http://www.reuters.com/2http://www.bloomberg.com/
2 Method
2.1 Event RepresentationWe follow the work of Kim (1993) and design astructured representation scheme that allows us toextract events and generalize them. Kim definesan event as a tuple (Oi, P , T ), where Oi ⊆ O isa set of objects, P is a relation over the objectsand T is a time interval. We propose a representa-tion that further structures the event to have rolesin addition to relations. Each event is composedof an action P , an actor O1 that conducted theaction, and an object O2 on which the action wasperformed. Formally, an event is represented asE = (O1, P, O2, T ), where P is the action, O1
is the actor, O2 is the object and T is the timestamp(T is mainly used for aligning stock data withnews data). For example, the event “Sep 3, 2013- Microsoft agrees to buy Nokia’s mobile phonebusiness for $7.2 billion.” is modeled as: (Actor =Microsoft, Action = buy, Object = Nokia’s mobilephone business, Time = Sep 3, 2013).
Previous work on stock market prediction rep-resents events as a set of individual terms (Funget al., 2002; Fung et al., 2003; Hayo and Ku-tan, 2004; Feldman et al., 2011). For example,“Microsoft agrees to buy Nokia’s mobile phonebusiness for $7.2 billion.” can be represented by{“Microsoft”, “agrees”, “buy”, “Nokia’s”, “mo-bile”, ...} and “Oracle has filed suit against Googleover its ever-more-popular mobile operating sys-tem, Android.” can be represented by {“Oracle”,“has”, “filed”, “suit”, “against”, “Google”, ...}.However, terms alone might fail to accurately pre-dict the stock price movement of Microsoft, Nokia,Oracle and Google, because they cannot indicatethe actor and object of the event. To our knowl-edge, no effort has been reported in the literatureto empirically investigate structured event repre-sentations for stock market prediction.
2.2 Event ExtractionA main contribution of our work is to extract anduse structured events instead of bags-of-words inprediction models. However, structured event ex-traction can be a costly task, requiring predefinedevent types and manual event templates (Ji and Gr-ishman, 2008; Li et al., 2013). Partly due to this,the bags-of-words-based document representationhas been the mainstream method for a long time.To tackle this issue, we resort to Open IE, extract-ing event tuples from wide-coverage data with-
1416
out requiring any human input (e.g. templates).Our system is based on the system of Fader et al.(2011) and the work of Ding et al. (2013); it doesnot require predefined target event types and la-beled training examples. Given a natural languagesentence obtained from news texts, the followingprocedure is used to extract structured events:
1. Event Phrase Extraction. We extract thepredicate verb P of a sentence based onthe dependency parser of Zhang and Clark(2011), and then find the longest sequence ofwords Pv, such that Pv starts at P and satis-fies the syntactic and lexical constraints pro-posed by Fader et al. (2011). The content ofthese two constraints are as follows:
• Syntactic constraint: every multi-wordevent phrase must begin with a verb, endwith a preposition, and be a contiguoussequence of words in the sentence.
• Lexical constraint: an event phraseshould appear with at least a minimalnumber of distinct argument pairs in alarge corpus.
2. Argument Extraction. For each eventphrase Pv identified in the step above, we findthe nearest noun phrase O1 to the left of Pv
in the sentence, and O1 should contain thesubject of the sentence (if it does not containthe subject of Pv, we find the second near-est noun phrase). Analogously, we find thenearest noun phrase O2 to the right of Pv inthe sentence, and O2 should contain the ob-ject of the sentence (if it does not contain theobject of Pv, we find the second nearest nounphrase).
An example of the extraction algorithm is as fol-lows. Consider the sentence,
Instant view: Private sector adds 114,000 jobsin July: ADP.
The predicate verb is identified as “adds”, andits subject and object “sector” and “jobs”, respec-tively. The structured event is extracted as (Privatesector, adds, 114,000 jobs).
2.3 Event Generalization
Our goal is to train a model that is able to makepredictions based on various expressions of thesame event. For example, “Microsoft swallows
Nokia’s phone business for $7.2 billion” and “Mi-crosoft purchases Nokia’s phone business” reportthe same event. To improve the accuracy of ourprediction model, we should endow the event ex-traction algorithm with generalization capacity.To this end, we leverage knowledge from twowell-known ontologies, WordNet (Miller, 1995)and VerbNet (Kipper et al., 2006). The pro-cess of event generalization consists of two steps.First, we construct a morphological analysis toolbased on the WordNet stemmer to extract lemmaforms of inflected words. For example, in “In-stant view: Private sector adds 114,000 jobs inJuly.”, the words “adds” and “jobs” are trans-formed to “add” and “job”, respectively. Second,we generalize each verb to its class name in Verb-Net. For example, “add” belongs to the multi-ply class. After generalization, the event (Privatesector, adds, 114,000 jobs) becomes (private sec-tor, multiply class, 114,000 job). Similar methodson event generalization have been investigated inOpen IE based event causal prediction (Radinskyand Horvitz, 2013).
2.4 Prediction Models
1. Linear model. Most previous work uses linearmodels to predict the stock market (Fung et al.,2002; Luss and d’Aspremont, 2012; Schumakerand Chen, 2009; Kogan et al., 2009; Das andChen, 2007; Xie et al., 2013). To make direct com-parisons, this paper constructs a linear predictionmodel by using Support Vector Machines (SVMs),a state-of-the-art classification model. Given atraining set (d1, y1), (d2, y2), ..., (dN , yN ),where n ∈ [1, N ], dn is a news document andyi ∈ {+1, −1} is the output class. dn can benews titles, news contents or both. The outputClass +1 represents that the stock price will in-crease the next day/week/month, and the outputClass -1 represents that the stock price will de-crease the next day/week/month. The featurescan be bag-of-words features or structured eventfeatures. By SVMs, y = arg max{Class +1, Class − 1} is determined by the linear func-tion w ·Φ(dn, yn), where w is the feature weightvector, and Φ(dn, yn) is a function that maps dn
into a M-dimensional feature space. Feature tem-plates will be discussed in the next subsection.2. Nonlinear model. Intuitively, the relationshipbetween events and the stock market may be morecomplex than linear, due to hidden and indirect
1417
…
News documents
1
Class +1 The polarity of the stock
price movement is
positive
Class -1 The polarity of the stock
price movement is
negative
Input
Layer
Output
Layer
Hidden
Layers
…
…
2 3 M
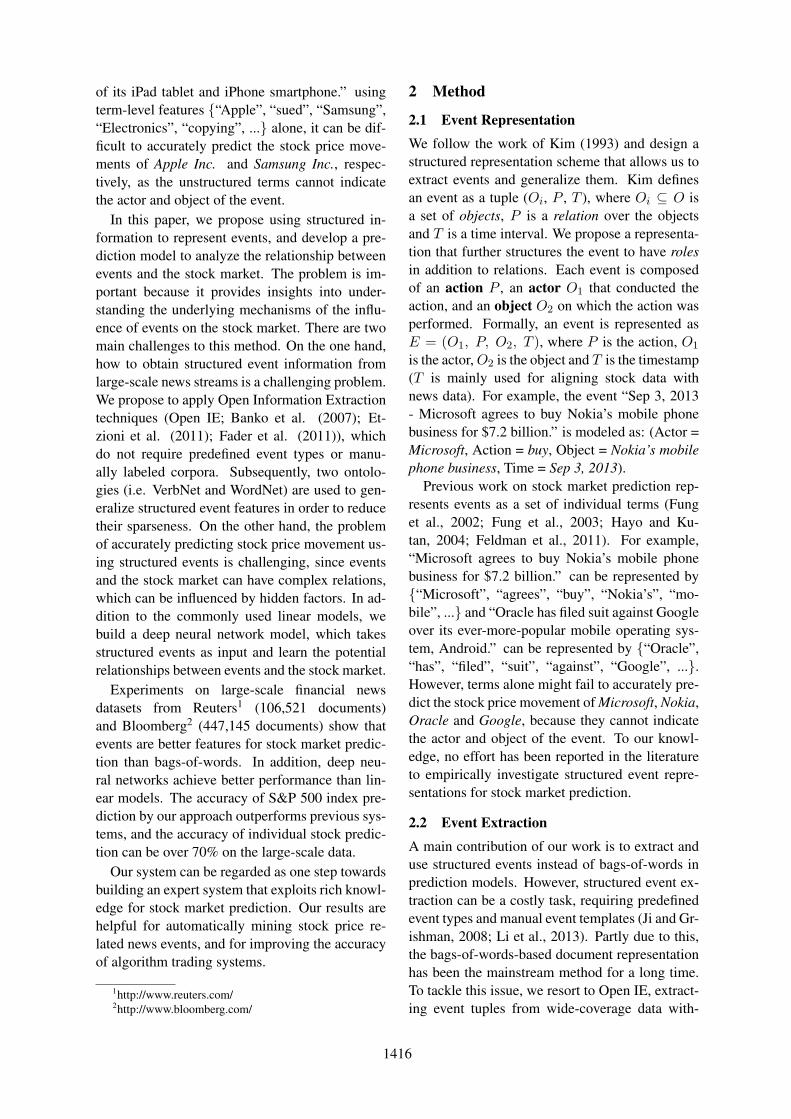
Figure 2: Structure of the deep neural networkmodel
relationships. We exploit a deep neural networkmodel, the hidden layers of which is useful forlearning such hidden relationships. The structureof the model with two hidden layers is illustratedin Figure 2. In all layers, the sigmoid activationfunction σ is used.
Let the values of the neurons of the output layerbe ycls (cls ∈ {+1,−1}), its input be netcls, andy2 be the value vector of the neurons of the lasthidden layer; then:
ycls = f(netcls) = σ(wcls · y2) (1)
where wcls is the weight vector between the neu-ron cls of the output layer and the neurons of thelast hidden layer. In addition,
y2k = σ(w2k · y1) (k ∈ [1, |y2|])y1j = σ(w1j ·Φ(dn)) (j ∈ [1, |y1|])
(2)
Here y1 is the value vector of the neu-rons of the first hidden layer, w2k =(w2k1, w2k2, ..., w2k|y1|), k ∈ [1, |y2|] andw1j = (w1j1, w1j2, ..., w1jM ), j ∈ [1, |y1|].w2kj is the weight between the kth neuron ofthe last hidden layer and the jth neuron of thefirst hidden layer; w1jm is the weight betweenthe jth neuron of the first hidden layer and themth neuron of the input layer m ∈ [1, M ]; dn
is a news document and Φ(dn) maps dn into aM-dimensional features space. News documentsand features used in the nonlinear model are thesame as those in the linear model, which will beintroduced in details in the next subsection. Thestandard back-propagation algorithm (Rumelhartet al., 1985) is used for supervised training of theneural network.
train dev testnumber ofinstances
1425 178 179
number ofevents
54776 6457 6593
time inter-val
02/10/2006-18/16/2012
19/06/2012-21/02/2013
22/02/2013-21/11/2013
Table 1: Dataset splitting
2.5 Feature Representation
In this paper, we use the same features (i.e. docu-ment representations) in the linear and nonlinearprediction models, including bags-of-words andstructured events.
(1) Bag-of-words features. We use the clas-sic “TFIDF” score for bag-of-words features. LetL be the vocabulary size derived from the train-ing data (introduced in the next section), andfreq(tl ) denote the number of occurrences ofthe lth word in the vocabulary in document d.TFl = 1
|d| freq(tl ), ∀l ∈ [1 , L], where |d| isthe number of words in the document d (stopwords are removed). TFIDFl = 1
|d| freq(tl ) ×log( N
|{d :freq(tl )>0}|), where N is the number ofdocuments in the training set. The feature vectorΦ can be represented as Φ = (ϕ1, ϕ2, ..., ϕM ) =(TFIDF1 , TFIDF2 , ..., TFIDFM ). The TFIDFfeature representation has been used by most pre-vious studies on stock market prediction (Kogan etal., 2009; Luss and d’Aspremont, 2012).
(2) Event features. We represent an eventtuple (O1, P, O2, T ) by the combination ofelements (except for T) (O1, P , O2, O1 + P ,P + O2, O1 + P + O2). For example, theevent tuple (Microsoft, buy, Nokia’s mobile phonebusiness) can be represented as (#arg1=Microsoft,#action=get class, #arg2=Nokia’s mobile phonebusiness, #arg1 action=Microsoft get class,#action arg2=get class Nokia’s mobile phonebusiness, #arg1 action arg2=Microsoft get classNokia’s mobile phone business). Structuredevents are more sparse than words, and we reducesparseness by two means. First, verb classes(Section 2.3) are used instead of verbs for P. Forexample, “get class” is used instead of the verb“buy”. Second, we use back-off features, suchas O1 + P (“Microsoft get class”) and P + O2
(“get class Nokia’s mobile phone business”), toaddress the sparseness of O1 and O2. Note that theorder of O1 and O2 is important for our task sincethey indicate the actor and object, respectively.
1418
0.52
0.53
0.54
0.55
0.56
0.57
0.58
0.59
0.6
1day 1week 1month
Acc
urac
y
Time span
bow+svmbow+deep neural networkevent+svmevent+deep neural network
(a) Accuarcy
0
0.02
0.04
0.06
0.08
0.1
0.12
0.14
1day 1week 1month
MC
C
Time span
bow+svmbow+deep neural networkevent+svmevent+deep neural network
(b) MCC
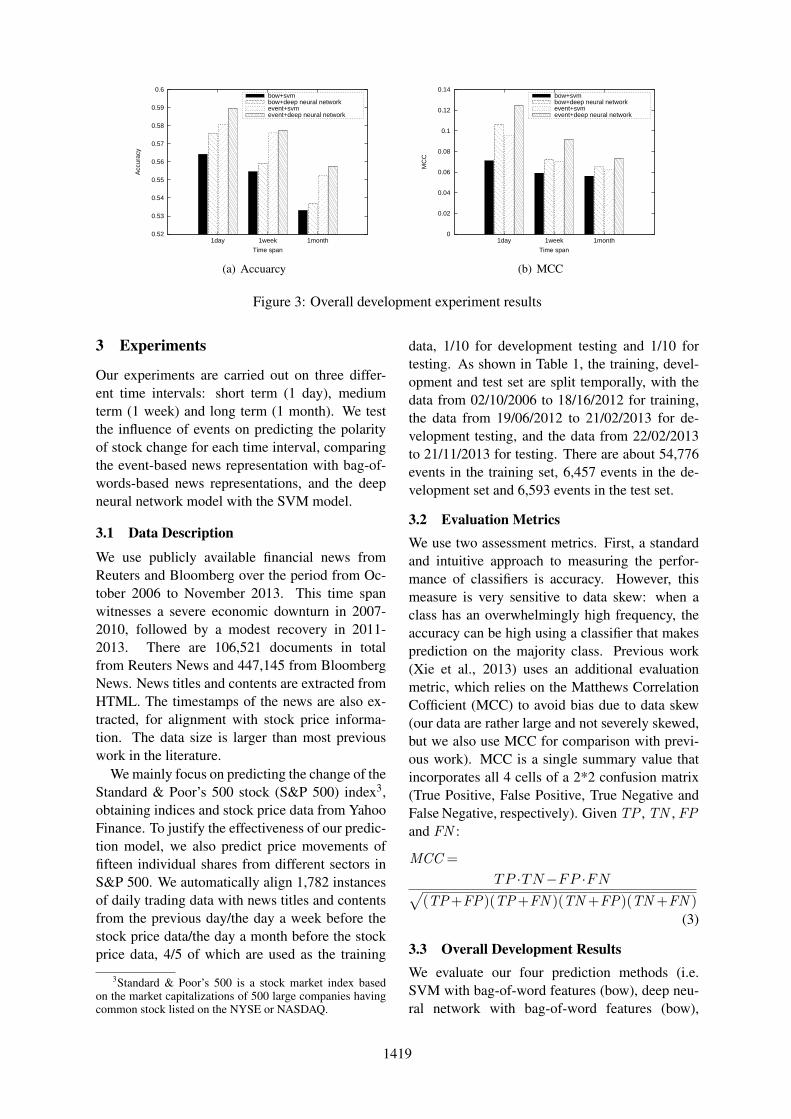
Figure 3: Overall development experiment results
3 Experiments
Our experiments are carried out on three differ-ent time intervals: short term (1 day), mediumterm (1 week) and long term (1 month). We testthe influence of events on predicting the polarityof stock change for each time interval, comparingthe event-based news representation with bag-of-words-based news representations, and the deepneural network model with the SVM model.
3.1 Data Description
We use publicly available financial news fromReuters and Bloomberg over the period from Oc-tober 2006 to November 2013. This time spanwitnesses a severe economic downturn in 2007-2010, followed by a modest recovery in 2011-2013. There are 106,521 documents in totalfrom Reuters News and 447,145 from BloombergNews. News titles and contents are extracted fromHTML. The timestamps of the news are also ex-tracted, for alignment with stock price informa-tion. The data size is larger than most previouswork in the literature.
We mainly focus on predicting the change of theStandard & Poor’s 500 stock (S&P 500) index3,obtaining indices and stock price data from YahooFinance. To justify the effectiveness of our predic-tion model, we also predict price movements offifteen individual shares from different sectors inS&P 500. We automatically align 1,782 instancesof daily trading data with news titles and contentsfrom the previous day/the day a week before thestock price data/the day a month before the stockprice data, 4/5 of which are used as the training
3Standard & Poor’s 500 is a stock market index basedon the market capitalizations of 500 large companies havingcommon stock listed on the NYSE or NASDAQ.
data, 1/10 for development testing and 1/10 fortesting. As shown in Table 1, the training, devel-opment and test set are split temporally, with thedata from 02/10/2006 to 18/16/2012 for training,the data from 19/06/2012 to 21/02/2013 for de-velopment testing, and the data from 22/02/2013to 21/11/2013 for testing. There are about 54,776events in the training set, 6,457 events in the de-velopment set and 6,593 events in the test set.
3.2 Evaluation MetricsWe use two assessment metrics. First, a standardand intuitive approach to measuring the perfor-mance of classifiers is accuracy. However, thismeasure is very sensitive to data skew: when aclass has an overwhelmingly high frequency, theaccuracy can be high using a classifier that makesprediction on the majority class. Previous work(Xie et al., 2013) uses an additional evaluationmetric, which relies on the Matthews CorrelationCofficient (MCC) to avoid bias due to data skew(our data are rather large and not severely skewed,but we also use MCC for comparison with previ-ous work). MCC is a single summary value thatincorporates all 4 cells of a 2*2 confusion matrix(True Positive, False Positive, True Negative andFalse Negative, respectively). Given TP , TN , FPand FN :
MCC =TP ·TN−FP ·FN√
(TP+FP)(TP+FN )(TN +FP)(TN +FN )(3)
3.3 Overall Development ResultsWe evaluate our four prediction methods (i.e.SVM with bag-of-word features (bow), deep neu-ral network with bag-of-word features (bow),
1419
1 day 1 week 1 month
1 layer Accuracy 58.94% 57.73% 55.76%MCC 0.1249 0.0916 0.0731
2 layers Accuracy 59.60% 57.73% 56.19%MCC 0.1683 0.1215 0.0875
Table 2: Different numbers of hidden layers
title content content +title
bloombergtitle + title
Acc 59.60% 54.65% 56.83% 59.64%MCC 0.1683 0.0627 0.0852 0.1758
Table 3: Different amounts of data
SVM with event features and deep neural networkwith event features) on three time intervals (i.e.1 day, 1 week and 1 month, respectively) on thedevelopment dataset, and show the results in Fig-ure 3. We find that:
(1) Structured event is a better choice for rep-resenting news documents. Given the same pre-diction model (SVM or deep neural network), theevent-based method achieves consistently betterperformance than the bag-of-words-based methodover all three time intervals. This is likely dueto the following two reasons. First, being an ex-traction of predicate-argument structures, eventscarry the most essential information of the docu-ment. In contrast, bag-of-words can contain moreirrelevant information. Second, structured eventscan directly give the actor and object of the action,which is important for predicting stock market.
(2) The deep neural network model achievesbetter performance than the SVM model, partly bylearning hidden relationships between structuredevents and stock prices. We give analysis to theserelationships in the next section.
(3) Event information is a good indicator forshort-term volatility of stock prices. As shown inFigure 3, the performance of daily prediction isbetter than weekly and monthly prediction. Ourexperimental results confirm the conclusion ofTetlock, Saar-Tsechansky, and Macskassy (2008)that there is a one-day delay between the priceresponse and the information embedded in thenews. In addition, we find that some events maycause immediate changes of stock prices. For ex-ample, former Microsoft CEO Steve Ballmer an-nounced he would step down within 12 monthson 23/08/2013. Within an hour, Microsoft sharesjumped as much as 9 percent. This fact indicatesthat it may be possible to predict stock price move-ment on a shorter time interval than one day. How-
Google Inc.Company News Sector News All NewsAcc MCC Acc MCC Acc MCC
67.86% 0.4642 61.17% 0.2301 55.70% 0.1135Boeing Company
Company News Sector News All NewsAcc MCC Acc MCC Acc MCC
68.75% 0.4339 57.14% 0.1585 56.04% 0.1605Wal-Mart Stores
Company News Sector News All NewsAcc MCC Acc MCC Acc MCC
70.45% 0.4679 62.03% 0.2703 56.04% 0.1605
Table 4: Individual stock prediction results
ever, we cannot access fine-grained stock pricehistorical data, and this investigation will be leftas future work.
3.4 Experiments with Different Numbers ofHidden Layers of the Deep NeuralNetwork Model
Cybenko (1989) states that when every processingelement utilizes the sigmoid activation function,one hidden layer is enough to solve any discrim-inant classification problem, and two hidden lay-ers are capable to parse arbitrary output functionsof input pattern. Here we conduct a developmentexperiment by different number of hidden layersfor the deep neural network model. As shown inTable 2, the performance of two hidden layers isbetter than one hidden layer, which is consistentwith the experimental results of Sharda and De-len (2006) on the task of movie box-office predic-tion. It indicates that more hidden layers can ex-plain more complex relations (Bengio, 2009). In-tuitively, three or more hidden layers may achievebetter performance. However, three hidden lay-ers mean that we construct a five-layer deep neu-ral network, which is difficult to train (Bengio etal., 1994). We did not obtain improved accuraciesusing three hidden layers, due to diminishing gra-dients. A deep investigation of this problem is outof the scope of this paper.
3.5 Experiments with Different Amounts ofData
We conduct a development experiment by extract-ing news titles and contents from Reuters andBloomberg, respectively. While titles can give thecentral information about the news, contents mayprovide some background knowledge or details.Radinsky et al. (2012) argued that news titles aremore helpful for prediction compared to news con-
1420
0.5
0.55
0.6
0.65
0.7
0.75
0 100 200 300 400 500
Acc
urac
y
Company Ranking
Wal-Mart
GoogleBoeing
Nike
Qualcomm
Apache
Starbucks
Avon
Visa
Symantec
Hershey
Mattel
ActavisGannett
SanDisk
individual stock
(a) Accuarcy
0.1
0.15
0.2
0.25
0.3
0.35
0.4
0.45
0.5
0 100 200 300 400 500
MC
C
Company Ranking
Wal-MartGoogle
Boeing
NikeQualcomm
Apache
Starbucks
AvonVisa
Symantec
HersheyMattel
Actavis Gannett
SanDisk
individual stock
(b) MCC
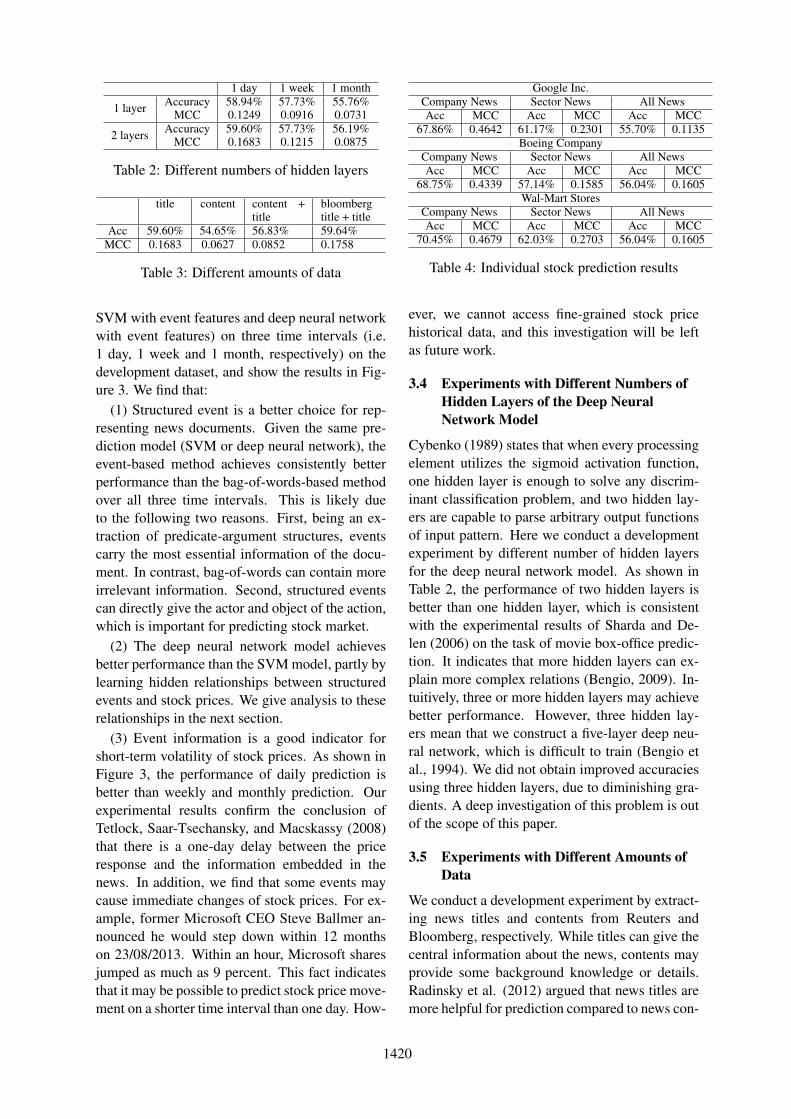
Figure 4: Individual stock prediction experiment results
tents, and this paper mainly uses titles. Here wedesign a comparative experiment to analyze the ef-fectiveness of news titles and contents. First, weuse Reuters news to compare the effectiveness ofnews titles and contents, and then add Bloombergnews titles to investigate whether the amounts ofdata matters. Table 3 shows that using only newstitles achieves the best performance. A likely rea-son is that we may extract some irrelevant eventsfrom news contents.
With the additional Bloomberg data, the resultsare not dramatically improved. This is intuitivelybecause most events are reported by both Reutersnews and Bloomberg news. We randomly se-lect about 9,000 pieces of news documents fromReuters and Bloomberg and check the daily over-lap manually, finding that about 60% of the newsare reported by both Reuters and Bloomberg. Theoverlap of important news (news related to S&P500 companies) is 80% and the overlap of unim-portant news is 40%.
3.6 Individual Stock Prediction
In addition to predicting the S&P 500 index, wealso investigate the effectiveness of our approachon the problem of individual stock prediction us-ing the development dataset. We select three well-known companies, Google Inc., Boeing Companyand Wal-Mart Stores from three different sec-tors (i.e. Information Technology, Industrials andConsumer Staples, respectively) classified by theGlobal Industry Classification Standard (GICS).We use company news, sector news and all news topredict individual stock price movement, respec-tively. The experimental results are listed in Ta-ble 4.
The result of individual stock prediction by us-
ing only company news dramatically outperformsthe result of S&P 500 index prediction. The mainreason is that company-related events can directlyaffect the volatility of company shares. There isa strong correlation between company events andcompany shares. Table 4 also shows that the resultof individual stock prediction by using sector newsor all news does not achieve a good performance,probably because there are many irrelevant eventsin all news, which would reduce the performanceof our prediction model.
The fact that the accuracy of these well-knownstocks are higher than the index may be becausethere is relatively more news events dedicated tothe relevant companies. To gain a better under-standing of the behavior of the model on moreindividual stocks, we randomly select 15 compa-nies (i.e. Google Inc., Boeing Company, Wal-MartStores, Nike Inc., QUALCOMM Inc., Apache Cor-poration, Starbucks Corp., Avon Products, VisaInc., Symantec Corp., The Hershey Company,Mattel Inc., Actavis plc, Gannett Co. and SanDiskCorporation) from S&P 500 companies. Morespecifically, according to the Fortune ranking ofS&P 500 companies4, we divide the ranked listinto five parts, and randomly select three compa-nies from each part. The experimental results areshown in Figure 4. We find that:
(1) All 15 individual stocks can be predictedwith accuracies above 50%, while 60% of thestocks can be predicted with accuracies above60%. It shows that the amount of company-relatedevents has strong relationship with the volatility of
4http://money.cnn.com/magazines/fortune/fortune500/.The amount of company-related news is correlated to thefortune ranking of companies. However, we find that thetrade volume does not have such a correlation with theranking.
1421
S&P 500 Index Prediction Individual Stock PredictionGoogle Inc. Boeing Company Wal-Mart Stores
Accuracy MCC Accuracy MCC Accuracy MCC Accuracy MCCdev 59.60% 0.1683 67.86% 0.4642 68.75% 0.4339 70.45% 0.4679test 58.94% 0.1649 66.97% 0.4435 68.03% 0.4018 69.87% 0.4456
Table 5: Final experimental results on the test dataset
company shares.(2) With decreasing company fortune rankings,
the accuracy and MCC decrease. This is mainlybecause there is not as much daily news about low-ranking companies, and hence one cannot extractenough structured events to predict the volatilityof these individual stocks.
3.7 Final Results
The final experimental results on the test datasetare shown in Table 5 (as space is limited, we showthe results on the time interval of one day only).The experimental results on the development andtest datasets are consistent, which indicate that ourapproach has good robustness. The following con-clusions obtained from development experimentsalso hold on the test dataset:
(1) Structured events are more useful represen-tations compared to bags-of-words for the task ofstock market prediction.
(2) A deep neural network model can be moreaccurate on predicting the stock market comparedto the linear model.
(3) Our approach can achieve stable experimentresults on S&P 500 index prediction and individ-ual stock prediction over a large amount of data(eight years of stock prices and more than 550,000pieces of news).
(4) The quality of information is more impor-tant than the quantity of information on the taskof stock market prediction. That is to say that themost relevant information (i.e. news title vs newscontent, individual company news vs all news) isbetter than more, but less relevant information.
3.8 Analysis and Discussion
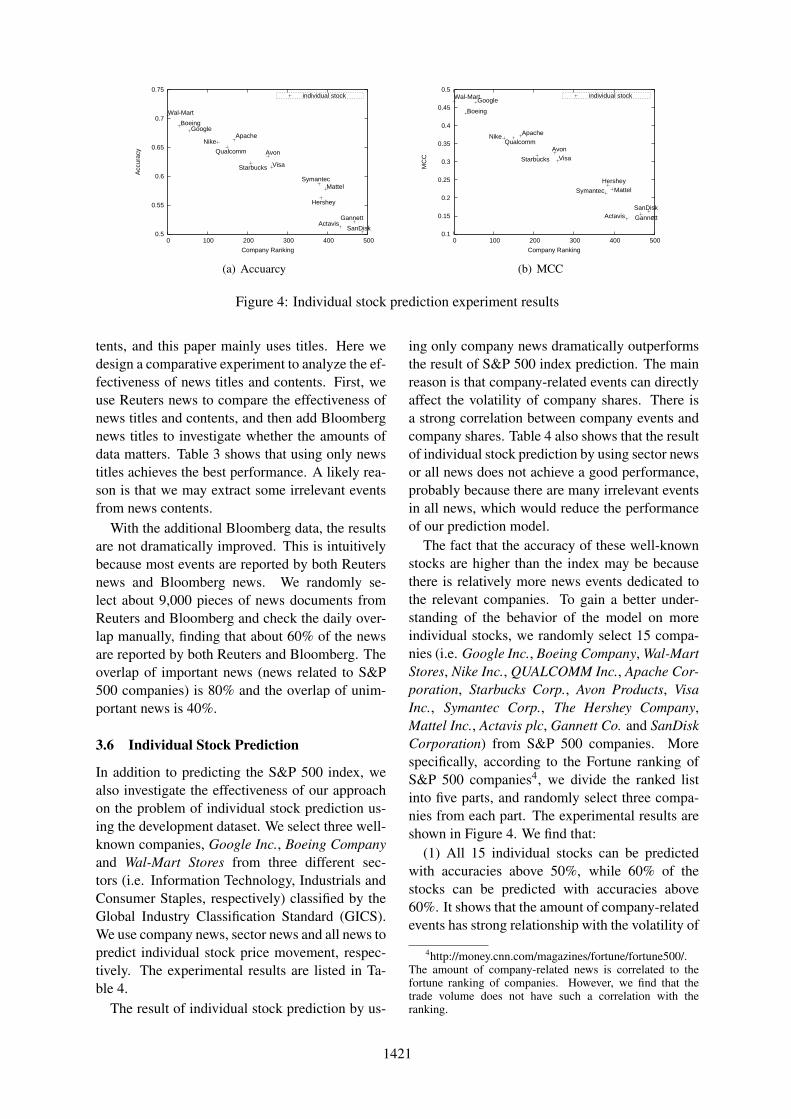
We use Figure 5 to demonstrate our analysis tothe development experimental result of GoogleInc. stock prediction, which directly shows therelationship between structured events and thestock market. The links between each layer showthe magnitudes of feature weights in the modellearned using the training set.
Three events, (Google, says bought stake in,China’s XunLei), (Google, reveals stake in, Chi-
1 2 3 4 5 6 7 8 M
1: (Google, says bought stake in, China’s XunLei)
4: (Google, reveals stake in, Chinese social website)
6: (Capgemini, partners, Google apps software)
2: (Oracle, sues, Google)
5: (Google map, break, privacy law)
8: (Google, may pull out of, China)
…
…
Figure 5: Prediction of Google Inc. (we only showstructured event features since backoff features areless informative)
nese social website) and (Capgemini, partners,Google apps software), have the highest linkweights to the first hidden node (from the left).These three events indicate that Google constantlymakes new partners and expands its business area.The first hidden node has high-weight links toClass +1, showing that Google’s positive coopera-tion can lead to the rise of its stock price.
Three other events, (Oracle, sues, Google),(Google map, break, privacy law) and (Google,may pull out of, China), have high-weight linksto the second hidden node. These three eventsshow that Google was suffering questions andchallenges, which could affect its reputation andfurther pull down its earnings. Correspondingly,the second hidden node has high-weight links toClass -1. These suggest that our method can au-tomatically and directly reveal complex relation-ships between structured events and the stock mar-ket, which is very useful for investors, and can fa-cilitate the research of stock market prediction.
Note that the event features used in our predic-tion model are generalized based on the algorithmintroduced in Section 2.5. Therefore, though aspecific event in the development test set mighthave never happened, its generalized form can befound in the training set. For example, “Googleacquired social marketing company Wildfire In-
1422
teractive” is not in the training data, but “Googleget class” (“get” is the class name of “acquire”and “buy” in VerbNet) can indeed be found in thetraining set, such as “Google bought stake in Xun-Lei” on 04/01/2007. Hence although the full spe-cific event feature does not fire, its back-offs firefor a correct prediction. For simplicity of showingthe event, we did not include back-off features inFigure 5.
4 Related Work
Stock market prediction has attracted a great dealof attention across the fields of finance, computerscience and other research communities in thepast. The literature of stock market predictionwas initiated by economists (Keynes, 1937). Sub-sequently, the influential theory of Efficient Mar-ket Hypothesis (EMH) (Fama, 1965) was estab-lished, which states that the price of a security re-flects all of the information available and that ev-eryone has a certain degree of access to the infor-mation. EMH had a significant impact on securityinvestment, and can serve as the theoretical basisof event-based stock price movement prediction.
Various studies have found that financial newscan dramatically affect the share price of a se-curity (Chan, 2003; Tetlock et al., 2008). Cul-ter et al. (1998) was one of the first to investi-gate the relationship between news coverage andstock prices, since which empirical text analysistechnology has been widely used across numerousdisciplines (Lavrenko et al., 2000; Kogan et al.,2009; Luss and d’Aspremont, 2012). These stud-ies primarily use bags-of-words to represent finan-cial news documents. However, as Schumaker andChen (2009) and Xie et al. (2013) point out, bag-of-words features are not the best choice for pre-dicting stock prices. Schumaker and Chen (2009)extract noun phrases and named entities to aug-ment bags-of-words. Xie et al. (2013) explore arich feature space that relies on frame semanticparsing. Wang et al. (2014) use the same fea-tures as Xie et al. (2013), but they perform non-parametric kernel density estimation to smooth outthe distribution of features. These can be regardedas extensions to the bag-of-word method. Thedrawback of these approaches, as discussed in theintroduction, is that they do not directly modelevents, which have structured information.
There has been efforts to model events more di-rectly (Fung et al., 2002; Hayo and Kutan, 2005;
Feldman et al., 2011). Fung, Yu, and Lam (2002)use a normalized word vector-space to modelevent. Feldman et al. (2011) extract 9 prede-fined categories of events based on heuristic rules.There are two main problems with these efforts.First, they cannot extract structured event (e.g. theactor of the event and the object of the event). Sec-ond, Feldman et al. (2011) can obtain only lim-ited categories of events, and hence the scalabil-ity of their work is not strong. In contrast, weextract structured events by leveraging Open In-formation Extraction technology (Open IE; Yateset al. (2007); Etzioni et al. (2011); Faber et al.(2011)) without predefined event types, which caneffectively solve the two problems above.
Apart from events, sentiment analysis is anotherperspective to the problem of stock prediction(Das and Chen, 2007; Tetlock, 2007; Tetlock etal., 2008; Bollen et al., 2011; Si et al., 2013). Tet-lock (2007) examines how qualitative information(i.e. the fraction of negative words in a particularnews column) is incorporated in aggregate marketvaluations. Tetlock, Saar-Tsechansky, and Mac-skassy (2008) extend that analysis to address theimpact of negative words in all Wall Street Joural(WSJ) and Dow Jones News Services (DJNS) sto-ries about individual S&P500 firms from 1980 to2004. Bollen and Zeng (2011) study whether thelarge-scale collective emotion on Twitter is cor-related with the volatility of Dow Jones Indus-trial Average (DJIA). From the experimental re-sults, they find that changes of the public moodmatch shifts in the DJIA values that occur 3 to 4days later. Sentiment-analysis-based stock mar-ket prediction focuses on investigating the influ-ence of subjective emotion. However, this paperputs emphasis on the relationship between objec-tive events and the stock price movement, and isorthogonal to the study of subjectivity. As a result,our model can be combined with the sentiment-analysis-based method.
5 Conclusion
In this paper, we have presented a framework forevent-based stock price movement prediction. Weextracted structured events from large-scale newsbased on Open IE technology and employed bothlinear and nonlinear models to empirically investi-gate the complex relationships between events andthe stock market. Experimental results showedthat events-based document representations are
1423
better than bags-of-words-based methods, anddeep neural networks can model the hidden and in-directed relationship between events and the stockmarket. For further comparisons, we freely releaseour data at http://ir.hit.edu.cn/∼xding/data.
Acknowledgments
We thank the anonymous reviewers for theirconstructive comments, and gratefully acknowl-edge the support of the National Basic Re-search Program (973 Program) of China via Grant2014CB340503, the National Natural ScienceFoundation of China (NSFC) via Grant 61133012and 61202277, the Singapore Ministry of Educa-tion (MOE) AcRF Tier 2 grant T2MOE201301and SRG ISTD 2012 038 from Singapore Univer-sity of Technology and Design. We are very grate-ful to Ji Ma for providing an implementation of theneural network algorithm.
ReferencesMichele Banko, Michael J Cafarella, Stephen Soder-
land, Matthew Broadhead, and Oren Etzioni. 2007.Open information extraction for the web. In IJCAI,volume 7, pages 2670–2676.
Yoshua Bengio, Patrice Simard, and Paolo Frasconi.1994. Learning long-term dependencies with gra-dient descent is difficult. Neural Networks, IEEETransactions on, 5(2):157–166.
Yoshua Bengio. 2009. Learning deep architectures forai. Foundations and trends R⃝ in Machine Learning,2(1):1–127.
Johan Bollen, Huina Mao, and Xiaojun Zeng. 2011.Twitter mood predicts the stock market. Journal ofComputational Science, 2(1):1–8.
Werner FM Bondt and Richard Thaler. 1985. Doesthe stock market overreact? The Journal of finance,40(3):793–805.
Wesley S Chan. 2003. Stock price reaction to news andno-news: Drift and reversal after headlines. Journalof Financial Economics, 70(2):223–260.
David M Cutler, James M Poterba, and Lawrence HSummers. 1998. What moves stock prices? Bern-stein, Peter L. and Frank L. Fabozzi, pages 56–63.
George Cybenko. 1989. Approximation by superposi-tions of a sigmoidal function. Mathematics of con-trol, signals and systems, 2(4):303–314.
Sanjiv R Das and Mike Y Chen. 2007. Yahoo! foramazon: Sentiment extraction from small talk on theweb. Management Science, 53(9):1375–1388.
Xiao Ding, Bing Qin, and Ting Liu. 2013. Buildingchinese event type paradigm based on trigger clus-tering. In Proc. of IJCNLP, pages 311–319, Octo-ber.
Oren Etzioni, Anthony Fader, Janara Christensen,Stephen Soderland, and Mausam Mausam. 2011.Open information extraction: The second genera-tion. In Proceedings of the Twenty-Second inter-national joint conference on Artificial Intelligence-Volume Volume One, pages 3–10. AAAI Press.
Anthony Fader, Stephen Soderland, and Oren Etzioni.2011. Identifying relations for open information ex-traction. In Proceedings of the Conference on Em-pirical Methods in Natural Language Processing,pages 1535–1545. Association for ComputationalLinguistics.
Eugene F Fama. 1965. The behavior of stock-marketprices. The journal of Business, 38(1):34–105.
Ronen Feldman, Benjamin Rosenfeld, Roy Bar-Haim,and Moshe Fresko. 2011. The stock sonarsentimentanalysis of stocks based on a hybrid approach. InTwenty-Third IAAI Conference.
Gabriel Pui Cheong Fung, Jeffrey Xu Yu, and WaiLam. 2002. News sensitive stock trend prediction.In Advances in Knowledge Discovery and Data Min-ing, pages 481–493. Springer.
Bernd Hayo and Ali M Kutan. 2005. The impact ofnews, oil prices, and global market developmentson russian financial markets1. Economics of Tran-sition, 13(2):373–393.
Narasimhan Jegadeesh and Sheridan Titman. 1993.Returns to buying winners and selling losers: Im-plications for stock market efficiency. The Journalof Finance, 48(1):65–91.
Narasimhan Jegadeesh. 1990. Evidence of predictablebehavior of security returns. The Journal of Fi-nance, 45(3):881–898.
Heng Ji and Ralph Grishman. 2008. Refining event ex-traction through cross-document inference. In ACL,pages 254–262.
John Maynard Keynes. 1937. The general theory ofemployment. The Quarterly Journal of Economics,51(2):209–223.
Jaegwon Kim. 1993. Supervenience and mind: Se-lected philosophical essays. Cambridge UniversityPress.
Karin Kipper, Anna Korhonen, Neville Ryant, andMartha Palmer. 2006. Extending verbnet with novelverb classes. In Proceedings of LREC, volume 2006,page 1.
Shimon Kogan, Dimitry Levin, Bryan R. Routledge,Jacob S. Sagi, and Noah A. Smith. 2009. Predictingrisk from financial reports with regression. In Proc.NAACL, pages 272–280, Boulder, Colorado, June.Association for Computational Linguistics.
1424
Victor Lavrenko, Matt Schmill, Dawn Lawrie, PaulOgilvie, David Jensen, and James Allan. 2000.Mining of concurrent text and time series. In KDD-2000 Workshop on Text Mining, pages 37–44.
Qi Li, Heng Ji, and Liang Huang. 2013. Joint eventextraction via structured prediction with global fea-tures. In Proc. of ACL (Volume 1: Long Papers),pages 73–82, August.
Andrew W Lo and Archie Craig MacKinlay. 1990.When are contrarian profits due to stock mar-ket overreaction? Review of Financial studies,3(2):175–205.
Ronny Luss and Alexandre d’Aspremont. 2012.Predicting abnormal returns from news using textclassification. Quantitative Finance, pp.1–14,doi:10.1080/14697688.2012.672762.
Burton G. Malkiel. 1973. A Random Walk Down WallStreet. W. W. Norton, New York.
George A Miller. 1995. Wordnet: a lexicaldatabase for english. Communications of the ACM,38(11):39–41.
Kira Radinsky and Eric Horvitz. 2013. Mining theweb to predict future events. In Proceedings of thesixth ACM international conference on Web searchand data mining, pages 255–264. ACM.
Kira Radinsky, Sagie Davidovich, and ShaulMarkovitch. 2012. Learning causality fornews events prediction. In Proc. of WWW, pages909–918. ACM.
David E Rumelhart, Geoffrey E Hinton, and Ronald JWilliams. 1985. Learning internal representationsby error propagation. Technical report, DTIC Doc-ument.
Robert P Schumaker and Hsinchun Chen. 2009.Textual analysis of stock market prediction usingbreaking financial news: The azfin text system.ACM Transactions on Information Systems (TOIS),27(2):12.
Ramesh Sharda and Dursun Delen. 2006. Predict-ing box-office success of motion pictures with neu-ral networks. Expert Systems with Applications,30(2):243–254.
Jianfeng Si, Arjun Mukherjee, Bing Liu, Qing Li,Huayi Li, and Xiaotie Deng. 2013. Exploitingtopic based twitter sentiment for stock prediction. InProc. of ACL (Volume 2: Short Papers), pages 24–29, Sofia, Bulgaria, August. Association for Compu-tational Linguistics.
Paul C Tetlock, Maytal Saar-Tsechansky, and SofusMacskassy. 2008. More than words: Quantifyinglanguage to measure firms’ fundamentals. The Jour-nal of Finance, 63(3):1437–1467.
Paul C Tetlock. 2007. Giving content to investor sen-timent: The role of media in the stock market. TheJournal of Finance, 62(3):1139–1168.
William Yang Wang and Zhenhao Hua. 2014. Asemiparametric gaussian copula regression modelfor predicting financial risks from earnings calls. InProc. of ACL, June.
Boyi Xie, Rebecca J. Passonneau, Leon Wu, andGerman G. Creamer. 2013. Semantic frames to pre-dict stock price movement. In Proc. of ACL (Volume1: Long Papers), pages 873–883, August.
Alexander Yates, Michael Cafarella, Michele Banko,Oren Etzioni, Matthew Broadhead, and StephenSoderland. 2007. Textrunner: open information ex-traction on the web. In Proc. of NAACL: Demonstra-tions, pages 25–26. Association for ComputationalLinguistics.
Yue Zhang and Stephen Clark. 2011. Syntactic pro-cessing using the generalized perceptron and beamsearch. Computational Linguistics, 37(1):105–151.
1425