using smart attributes to estimate enterprise ssd lifetime
TRANSCRIPT
White Paper:
Using sMART ATTRibUTes To esTiMATe DRive LifeTiMe
increase Roi by Measuring the ssD Lifespan in Your Workload
The lifespan of storage has always been finite. Hard disk drives (HDDs) contain rotating platters, which subject them to mechanical wear out. While ssDs don’t contain any moving parts since nAnD is a semiconductor that operates through movement of electrons, the architecture of nAnD sets a limit on write endurance.
nAnD works by storing electrons in a floating gate (conductor) or charge trap (insulator). The stored electrons then create a charge, and the amount of charge determines the bit value of a cell. in order to program or erase a cell, a strong electric field is created by applying a high voltage on the control gate, which then forces the electrons to flow from the channel to the floating gate or charge trap through an insulating tunnel oxide. The electric field induces stress on the tunnel oxide and as the cell is programmed and erased, the tunnel oxide wears out overtime, reducing the reliability of the cell by reducing its ability to withhold the charge.
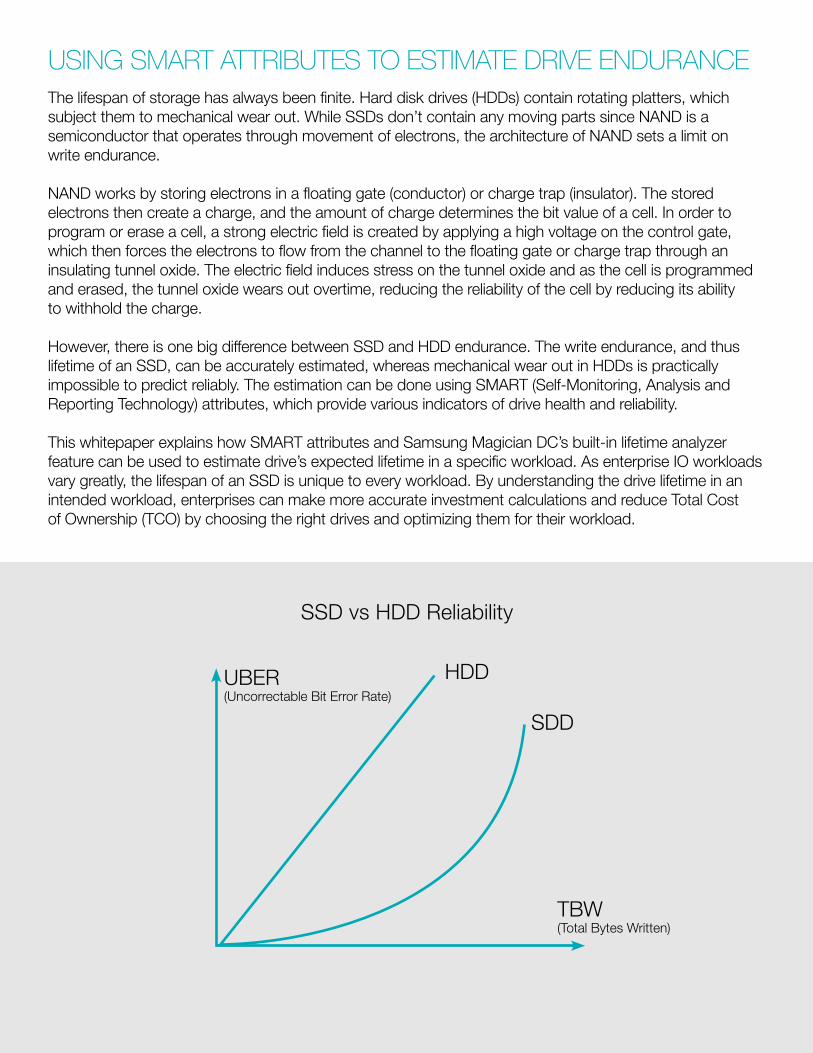
However, there is one big difference between ssD and HDD endurance. The write endurance, and thus lifetime of an ssD, can be accurately estimated, whereas mechanical wear out in HDDs is practically impossible to predict reliably. The estimation can be done using sMART (self-Monitoring, Analysis and Reporting Technology) attributes, which provide various indicators of drive health and reliability.
This whitepaper explains how sMART attributes and samsung Magician DC’s built-in lifetime analyzer feature can be used to estimate drive’s expected lifetime in a specific workload. As enterprise io workloads vary greatly, the lifespan of an ssD is unique to every workload. by understanding the drive lifetime in an intended workload, enterprises can make more accurate investment calculations and reduce Total Cost of ownership (TCo) by choosing the right drives and optimizing them for their workload.
Using sMART ATTRibUTes To esTiMATe DRive enDURAnce
UbeR(Uncorrectable bit error Rate)
HDD
sDD
TbW (Total bytes Written)
ssD vs HDD Reliability
ssD endurance is reported using two different metrics. Total bytes Written (TbW) refers to the maximum amount of host writes that a drive is guaranteed to withstand, whereas Drive Writes per Day (DWPD) is a derivative of TbW that translates the host writes into drive writes per day over a given warranty period.
Physical capacity and P/e cycles are both fixed values that are based on hardware configuration, whereas write amplification is workload dependent. in other words, each workload results in different write amplification, meaning that the endurance varies depending on the size of the factors.
Typically, random write workloads that consist of small ios induce higher write amplification than large io sequential write workloads. Wear Leveling factor is not examined further in this whitepaper as it is typically very close to 1.00.
since write amplification is a variable, it needs to be estimated in order to calculate the endurance in a specific workload. in order to do this, a drive needs to be subjected to a workload that represents the average usage of the whole storage system. The best way to do this is to install the drive to one of the servers and make it a part of the storage system, but that may not be possible in all scenarios due to potential compatibility issues. The other way is to use a secondary system and simulate the workload using a configurable benchmark tool such as iometer, but this method requires specific understanding of the io activity of the workload (distribution of io sizes, queue depths and randomness of data patterns).
The full procedure for estimating endurance and lifetime with sMART attributes consists of four steps:
1. Record initial sMART attributes
2. Run the test and record the duration of the test
3. Record final sMART attributes
4. Analyze results
FAcToRs oF ssD enDURAnce
esTiMATing WRiTe AMpliFicATion AnD ssD liFeTiMe WiTh sMART ATTRibUTes
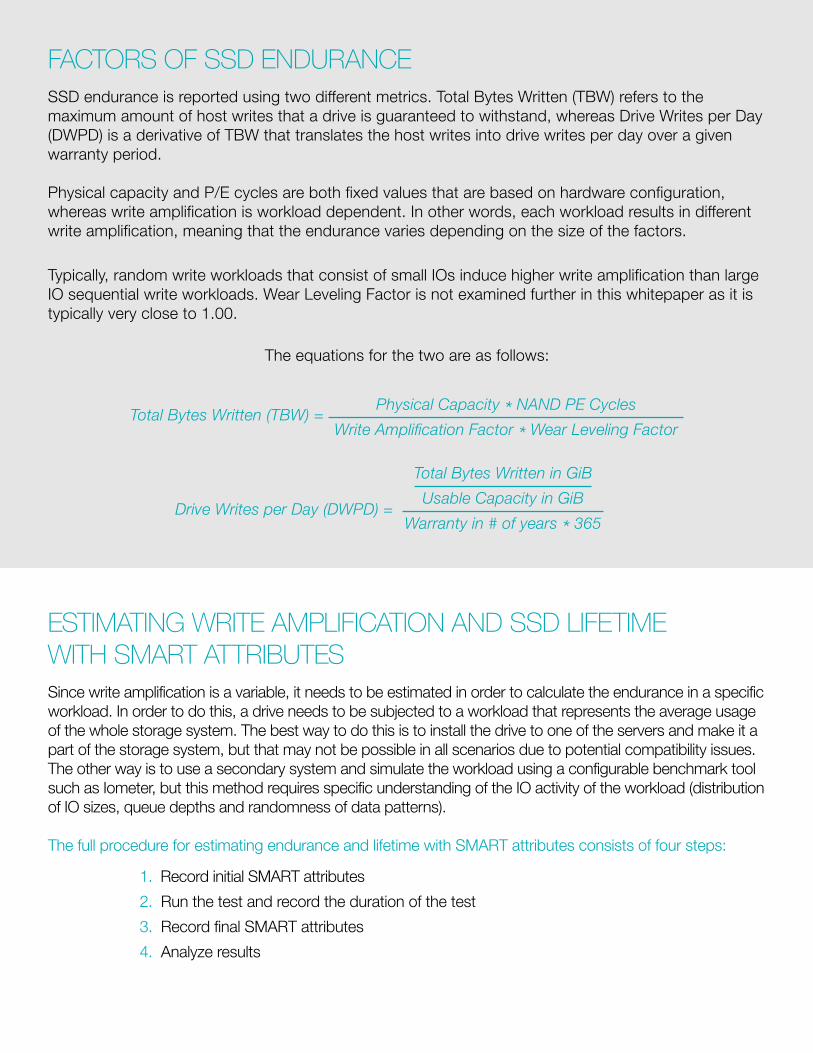
Total Bytes Written (TBW) =Physical Capacity * NAND PE Cycles
Write Amplification Factor * Wear Leveling Factor
Drive Writes per Day (DWPD) =
Total Bytes Written in GiB
Usable Capacity in GiB
Warranty in # of years * 365
The equations for the two are as follows:
step 1
before starting the test, it’s important to record the initial sMART attributes, which can be done using samsung Magician DC or third party software such as CrystalDiskinfo or smartctl. in samsung Magician DC, the following command is used to list the attributes for a specific drive:
magician –d X –S | where X is the physical disk number that can be obtained using “magician –L” command.
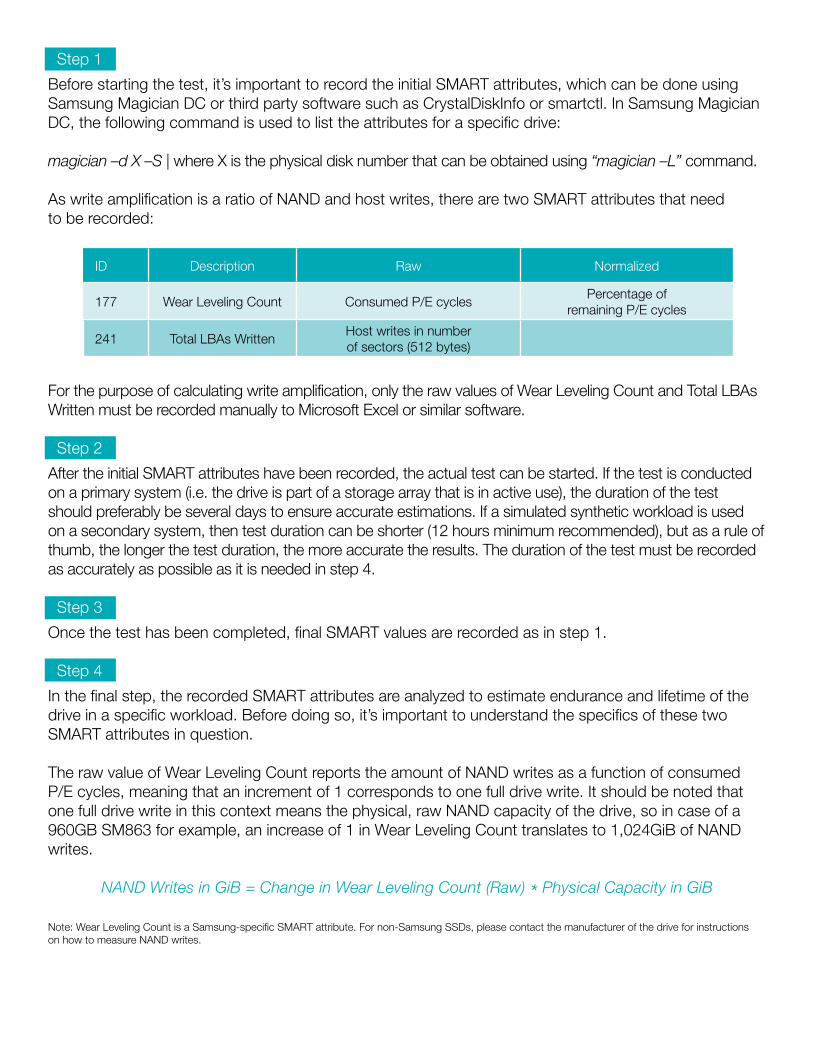
As write amplification is a ratio of nAnD and host writes, there are two sMART attributes that need to be recorded:
for the purpose of calculating write amplification, only the raw values of Wear Leveling Count and Total LbAs Written must be recorded manually to Microsoft excel or similar software.
step 2
After the initial sMART attributes have been recorded, the actual test can be started. if the test is conducted on a primary system (i.e. the drive is part of a storage array that is in active use), the duration of the test should preferably be several days to ensure accurate estimations. if a simulated synthetic workload is used on a secondary system, then test duration can be shorter (12 hours minimum recommended), but as a rule of thumb, the longer the test duration, the more accurate the results. The duration of the test must be recorded as accurately as possible as it is needed in step 4.
step 3
once the test has been completed, final sMART values are recorded as in step 1.
step 4
in the final step, the recorded sMART attributes are analyzed to estimate endurance and lifetime of the drive in a specific workload. before doing so, it’s important to understand the specifics of these two sMART attributes in question.
The raw value of Wear Leveling Count reports the amount of nAnD writes as a function of consumed P/e cycles, meaning that an increment of 1 corresponds to one full drive write. it should be noted that one full drive write in this context means the physical, raw nAnD capacity of the drive, so in case of a 960gb sM863 for example, an increase of 1 in Wear Leveling Count translates to 1,024gib of nAnD writes.
NAND Writes in GiB = Change in Wear Leveling Count (Raw) * Physical Capacity in GiB
note: Wear Leveling Count is a samsung-specific sMART attribute. for non-samsung ssDs, please contact the manufacturer of the drive for instructions on how to measure nAnD writes.
iD Description Raw normalized
177 Wear Leveling Count Consumed P/e cyclesPercentage of
remaining P/e cycles
241 Total LbAs WrittenHost writes in number of sectors (512 bytes)
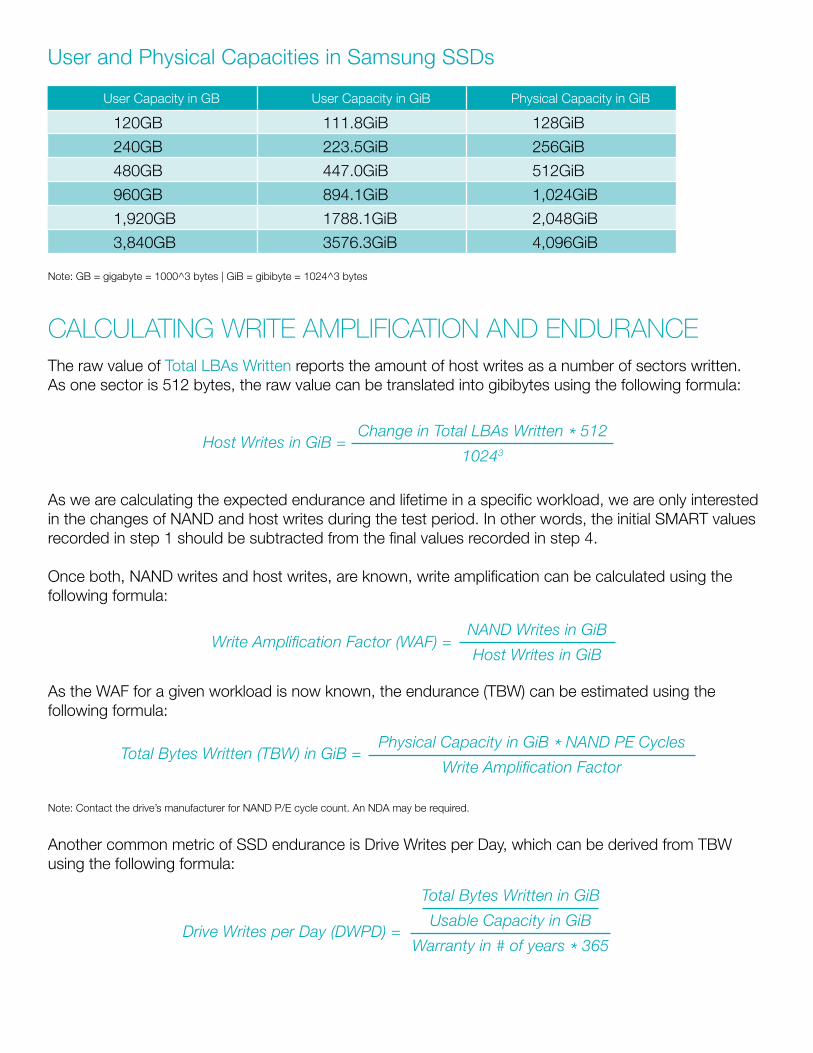
The raw value of Total LbAs Written reports the amount of host writes as a number of sectors written. As one sector is 512 bytes, the raw value can be translated into gibibytes using the following formula:
As we are calculating the expected endurance and lifetime in a specific workload, we are only interested in the changes of nAnD and host writes during the test period. in other words, the initial sMART values recorded in step 1 should be subtracted from the final values recorded in step 4.
once both, nAnD writes and host writes, are known, write amplification can be calculated using the following formula:
As the WAf for a given workload is now known, the endurance (TbW) can be estimated using the following formula:
note: Contact the drive’s manufacturer for nAnD P/e cycle count. An nDA may be required.
Another common metric of ssD endurance is Drive Writes per Day, which can be derived from TbW using the following formula:
note: gb = gigabyte = 1000^3 bytes | gib = gibibyte = 1024^3 bytes
User Capacity in gb User Capacity in gib Physical Capacity in gib
120gb 111.8gib 128gib
240gb 223.5gib 256gib
480gb 447.0gib 512gib
960gb 894.1gib 1,024gib
1,920gb 1788.1gib 2,048gib
3,840gb 3576.3gib 4,096gib
Write Amplification Factor (WAF) =NAND Writes in GiB
Host Writes in GiB
Host Writes in GiB =Change in Total LBAs Written * 512
10243
Total Bytes Written (TBW) in GiB =Physical Capacity in GiB * NAND PE Cycles
Write Amplification Factor
Drive Writes per Day (DWPD) =
Total Bytes Written in GiB
Usable Capacity in GiB
Warranty in # of years * 365
User and Physical Capacities in samsung ssDs
cAlcUlATing WRiTe AMpliFicATion AnD enDURAnce
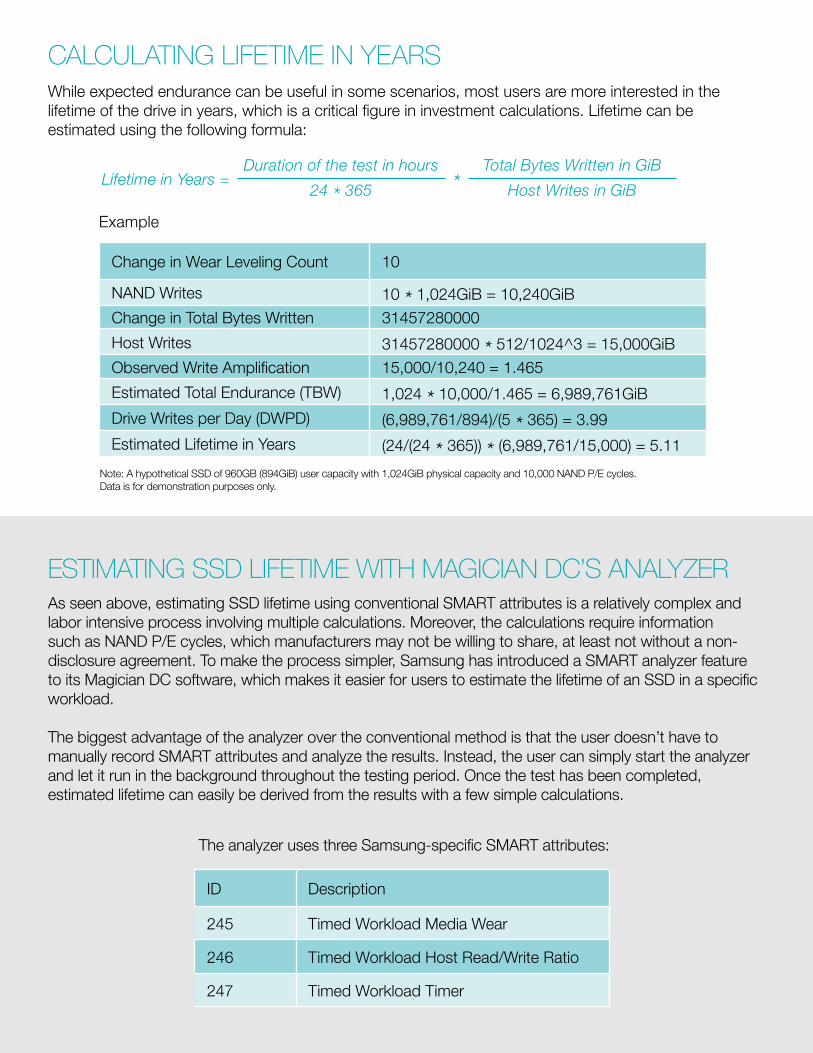
While expected endurance can be useful in some scenarios, most users are more interested in the lifetime of the drive in years, which is a critical figure in investment calculations. Lifetime can be estimated using the following formula:
note: A hypothetical ssD of 960gb (894gib) user capacity with 1,024gib physical capacity and 10,000 nAnD P/e cycles. Data is for demonstration purposes only.
Lifetime in Years =Duration of the test in hours
24 * 365
Total Bytes Written in GiB
Host Writes in GiB*
Change in Wear Leveling Count 10
nAnD Writes 10 * 1,024gib = 10,240gibChange in Total bytes Written 31457280000
Host Writes 31457280000 * 512/1024^3 = 15,000gibobserved Write Amplification 15,000/10,240 = 1.465
estimated Total endurance (TbW) 1,024 * 10,000/1.465 = 6,989,761gib
Drive Writes per Day (DWPD) (6,989,761/894)/(5 * 365) = 3.99
estimated Lifetime in Years (24/(24 * 365)) * (6,989,761/15,000) = 5.11
example
As seen above, estimating ssD lifetime using conventional sMART attributes is a relatively complex and labor intensive process involving multiple calculations. Moreover, the calculations require information such as nAnD P/e cycles, which manufacturers may not be willing to share, at least not without a non-disclosure agreement. To make the process simpler, samsung has introduced a sMART analyzer feature to its Magician DC software, which makes it easier for users to estimate the lifetime of an ssD in a specific workload.
The biggest advantage of the analyzer over the conventional method is that the user doesn’t have to manually record sMART attributes and analyze the results. instead, the user can simply start the analyzer and let it run in the background throughout the testing period. once the test has been completed, estimated lifetime can easily be derived from the results with a few simple calculations.
esTiMATing ssD liFeTiMe WiTh MAgiciAn Dc’s AnAlyzeR
iD Description
245 Timed Workload Media Wear
246 Timed Workload Host Read/Write Ratio
247 Timed Workload Timer
The analyzer uses three samsung-specific sMART attributes:
cAlcUlATing liFeTiMe in yeARs
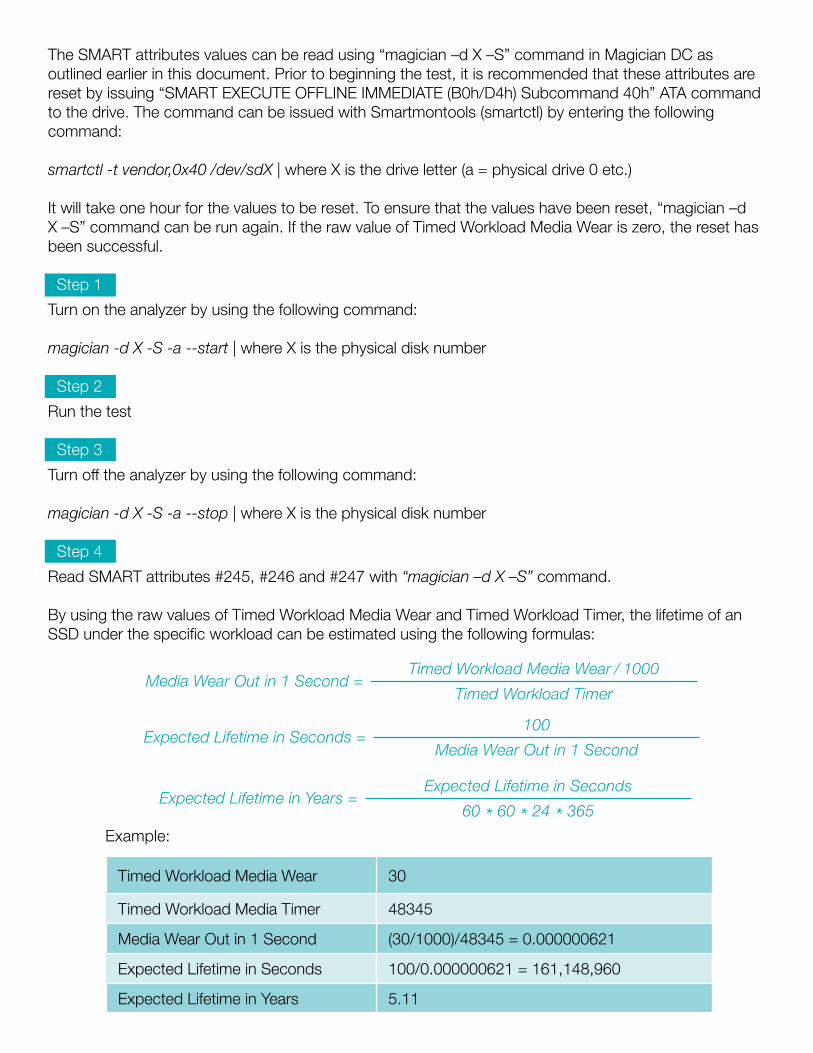
The sMART attributes values can be read using “magician –d X –s” command in Magician DC as outlined earlier in this document. Prior to beginning the test, it is recommended that these attributes are reset by issuing “sMART eXeCUTe offLine iMMeDiATe (b0h/D4h) subcommand 40h” ATA command to the drive. The command can be issued with smartmontools (smartctl) by entering the following command:
smartctl -t vendor,0x40 /dev/sdX | where X is the drive letter (a = physical drive 0 etc.)
it will take one hour for the values to be reset. To ensure that the values have been reset, “magician –d X –s” command can be run again. if the raw value of Timed Workload Media Wear is zero, the reset has been successful.
step 1
Turn on the analyzer by using the following command:
magician -d X -S -a --start | where X is the physical disk number
step 2
Run the test
step 3
Turn off the analyzer by using the following command: magician -d X -S -a --stop | where X is the physical disk number
step 4
Read sMART attributes #245, #246 and #247 with “magician –d X –S” command.
by using the raw values of Timed Workload Media Wear and Timed Workload Timer, the lifetime of an ssD under the specific workload can be estimated using the following formulas:
Media Wear Out in 1 Second =Timed Workload Media Wear ⁄ 1000
Timed Workload Timer
Expected Lifetime in Seconds =100
Media Wear Out in 1 Second
Expected Lifetime in Years =Expected Lifetime in Seconds
60 * 60 * 24 * 365
Timed Workload Media Wear 30
Timed Workload Media Timer 48345
Media Wear out in 1 second (30/1000)/48345 = 0.000000621
expected Lifetime in seconds 100/0.000000621 = 161,148,960
expected Lifetime in Years 5.11
example:
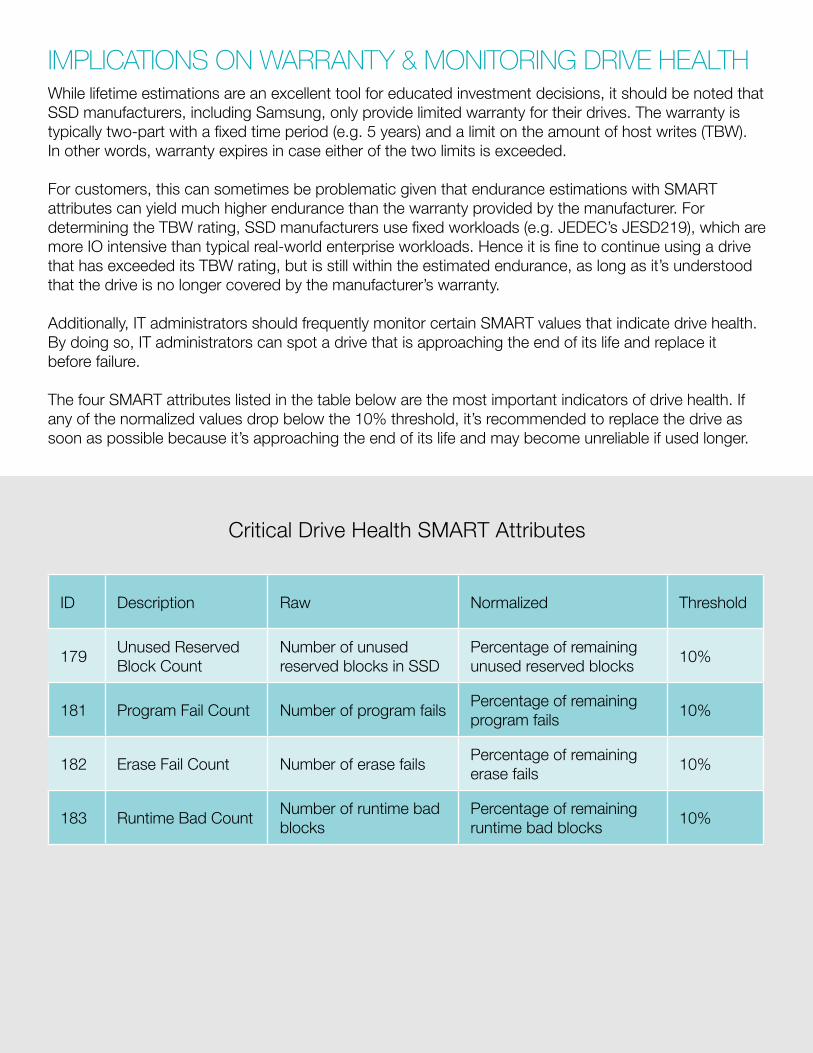
While lifetime estimations are an excellent tool for educated investment decisions, it should be noted that ssD manufacturers, including samsung, only provide limited warranty for their drives. The warranty is typically two-part with a fixed time period (e.g. 5 years) and a limit on the amount of host writes (TbW). in other words, warranty expires in case either of the two limits is exceeded.
for customers, this can sometimes be problematic given that endurance estimations with sMART attributes can yield much higher endurance than the warranty provided by the manufacturer. for determining the TbW rating, ssD manufacturers use fixed workloads (e.g. JeDeC’s JesD219), which are more io intensive than typical real-world enterprise workloads. Hence it is fine to continue using a drive that has exceeded its TbW rating, but is still within the estimated endurance, as long as it’s understood that the drive is no longer covered by the manufacturer’s warranty.
Additionally, iT administrators should frequently monitor certain sMART values that indicate drive health. by doing so, iT administrators can spot a drive that is approaching the end of its life and replace it before failure.
The four sMART attributes listed in the table below are the most important indicators of drive health. if any of the normalized values drop below the 10% threshold, it’s recommended to replace the drive as soon as possible because it’s approaching the end of its life and may become unreliable if used longer.
iMplicATions on WARRAnTy & MoniToRing DRive heAlTh
iD Description Raw normalized Threshold
179Unused Reserved block Count
number of unused reserved blocks in ssD
Percentage of remaining unused reserved blocks
10%
181 Program fail Count number of program failsPercentage of remaining program fails
10%
182 erase fail Count number of erase failsPercentage of remaining erase fails
10%
183 Runtime bad Countnumber of runtime bad blocks
Percentage of remaining runtime bad blocks
10%
Critical Drive Health sMART Attributes
As every io workload is unique, sMART attributes are the only way to attain lifetime information in a specific workload. by estimating drive lifetime with sMART attributes and samsung Magician DC’s built-in analyzer, enterprises can make more accurate investment calculations and ensure solid return on their investment. Additionally, enterprises can gain valuable information about their io workloads, which can be used as a basis for selecting the drives and configuring the optimal over-provisioning level for maximum drive lifetime and return on investment.
conclUsion
Learn more: samsung.com/enterprisessd | insights.samsung.com | 1-866-sAM4biZ
follow us: youtube.com/samsungbizusa | @samsungbizUsA
© 2016 samsung electronics America, inc. All rights reserved. samsung is a registered trademark of samsung electronics Co., Ltd. All products, logos and brand names are trademarks or registered trademarks of their respective companies. This white paper is for informational purposes only. samsung makes no warranties, express or implied, in this white paper. WHP-ssD-ssDsMARTATTRibUTes-APR16J
About the Author Kristian vättö is a technical marketing specialist and started his career as a news editor at AnandTech.com in 2011. He later became the site’s ssD editor and was responsible for producing highly-detailed and professional ssD reviews. in addition to his work with samsung, Kristian is currently studying economics at the University of Tampere in finland.
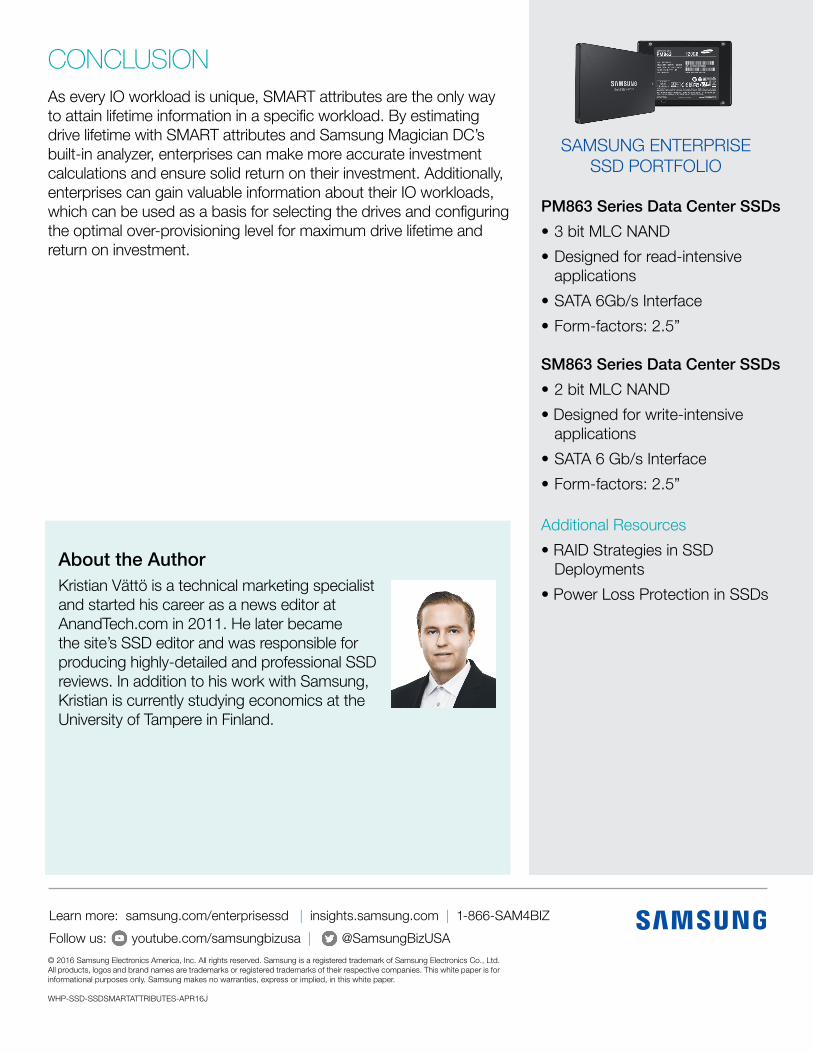
sAMsUng enTeRPRisessD PoRTfoLio
PM863 Series Data Center SSDs
•3bitMLCNAND
•Designedforread-intensiveapplications
•SATA6Gb/sInterface
•Form-factors:2.5”
SM863 Series Data Center SSDs
•2bitMLCNAND
•Designedforwrite-intensiveapplications
•SATA6Gb/sInterface
•Form-factors:2.5”
Additional Resources
•RAIDStrategiesinSSDDeployments
•PowerLossProtectioninSSDs