using simulation to assess conflicts between bicyclists
TRANSCRIPT
Using Simulation to Assess Conflicts Between Bicyclists and Right-Turning Vehicles
Michael Knodler, Jr., PhD Professor Civil & Environmental Engineering UMass Amherst
Eleni Christofa, PhD Assistant Professor Civil & Environmental Engineering UMass Amherst
i
Using Simulation to Assess Conflicts Between Bicyclists and Right-Turning Vehicles Eleni Christofa, PhD Assistant Professor Civil & Environmental Engineering University of Massachusetts Amherst https://orcid.org/0000-0002-8740-5558 Michael Knodler Jr., PhD Professor Civil & Environmental Engineering University of Massachusetts Amherst https://orcid.org/0000-0002-6517-4066
Aikaterini Deliali, MSc Graduate Student Researcher Civil & Environmental Engineering University of Massachusetts Amherst https://orcid.org/0000-0001-7950-3185
ii
A Report on Research
SAFER-SIM University Transportation Center
Federal Grant No: 69A3551747131
February 2019
DISCLAIMER
The contents of this report reflect the views of the authors, who are responsible for the facts and the accuracy of the information presented herein. This document is disseminated in the interest of information exchange. The report is funded, partially or entirely, by a grant from the U.S. Department of Transportation’s University Transportation Centers Program. However, the U.S. Government assumes no liability for the contents or use thereof.
iii
Table of Contents
Table of Contents ........................................................................................................... iii
List of Figures.................................................................................................................. v
List of Tables .................................................................................................................. vi
Abstract ..........................................................................................................................vii
1 Introduction................................................................................................................ 1
2 Background ............................................................................................................... 4
3 Methodology .............................................................................................................. 6
3.1 Experimental Design ......................................................................................... 7
3.1.1 Scenario Description ............................................................................. 7
3.1.2 Dependent and Independent Variables ................................................. 8
3.1.3 Participants and Experimental Procedure ............................................ 11
3.2 Apparatus ....................................................................................................... 12
3.2.1 Driving Simulator ................................................................................. 12
3.2.2 Eye Tracker ......................................................................................... 13
3.2.3 Questionnaires .................................................................................... 13
4 Results .................................................................................................................... 15
4.1 Eye Glances ................................................................................................... 15
4.1.1 Segment Analysis ............................................................................... 15
4.1.2 Intersection Analysis ........................................................................... 19
4.2 Speed ............................................................................................................. 22
4.2.1 Segment .............................................................................................. 22
4.2.2 Speed analysis at the intersection ....................................................... 24
5 Conclusions ............................................................................................................. 27
6 References .............................................................................................................. 29
Appendix A: Pre-Study Questionnaire ........................................................................... 32

iv
Appendix B: Post-Study Questionnaire.......................................................................... 34
v
List of Figures
Figure 3.1 - Bicycle infrastructure treatments used in the experimental design .......... 6
Figure 3.2 - Drive geometric configuration ................................................................. 8
Figure 3.3 - Intersection zones .................................................................................. 9
Figure 3.4 - Driving simulator at the University of Massachusetts Amherst Human
Performance Lab ........................................................................................................... 12
Figure 3.5 – Eye-tracking device and video output capturing eye movements ......... 13
Figure 4.1 - Glances at the bicyclist (AB segment level) .......................................... 17
Figure 4.2 - Intersection right glances (Zone 1) ....................................................... 20
Figure 4.3 - Intersection right glances (Zone 2) ....................................................... 20
Figure 4.4 - Box plot of speed on segment AB across all four segment environments
...................................................................................................................................... 23
Figure 4.5 - Box plot of speed at intersection (segment CD) across all eight scenarios
...................................................................................................................................... 25
vi
List of Tables
Table 3.1 - Scenarios ................................................................................................ 7
Table 4.1 - Logistic regression for glances at the bicyclist ....................................... 18
Table 4.2 - Logistic regression for glances at the bicyclist in Zone 1 (Confidence
Level=95%) ................................................................................................................... 21
Table 4.4 - t-test results for the impact of bicyclist presence and segment treatment
on average speed (mph) while traveling on segment AB ............................................... 24
vii
Abstract
Protected bike lanes, or cycle tracks, are increasing in popularity across the nation.
However, despite the documented benefits of protected bike lanes, including safer
cycling and increased ridership among differing populations of bicyclists, there remain
ongoing concerns about potential conflicts between bicycles and vehicles when they
merge back together at an intersection. The fear is that following a period of separation,
drivers are less likely to anticipate and scan for the presence of bicycles. This research
examines how transitions from fully separated to mixed-traffic environments and vice
versa affect driver behavior. The goal is to assess whether certain segment-intersection
treatment combinations can alert drivers of the presence of bicyclists and thus
encourage them to scan for bicyclists prior to a right turn, reducing potential right-hook
conflicts. Driving simulation is utilized in this study, and driver performance for right-
turning vehicles is recorded under the presence of various bicycle infrastructure
treatments along segments and at intersections. The experimental design includes two
types of bike lanes and two intersection configurations, namely conventional and
protected bike lanes and intersections with through bike lanes and protected
intersections. Results show that the presence of the bicyclist as well as the presence of
protected bike lanes reduce average speed on the segment. Additionally, the presence
of the bicyclist significantly reduces the intersection speed when non-protected
intersection design has been implemented. The presence of the bicyclist was also found
to significantly affect participants’ glancing behavior at the intersection approach,
triggering more of them to place a right glance regardless of the intersection
configuration. In addition, participants were found to be less likely to glance for the
bicyclist when riding on a segment with protected bike lanes compared to scenarios with
conventional bike lanes. This research can be used to guide decisions on bicycle
infrastructure implementation for safer multimodal operations.

1 Using Simulation to Assess Conflicts Between Bicyclists and Right-Turning Vehicles
1 Introduction
Bicycle commuting trips in the United States (U.S.) account for 0.6% of all
commuting trips, but at the same time bicyclists’ fatal accidents represent 2.2% of the
total fatalities [1]. Recent efforts to improve bicycle safety have focused on bicycle
infrastructure treatments with an increased interest in protected bike lanes (i.e., cycle
tracks). The mayor of New York City has announced the city’s plan to implement
innovative bicycle infrastructure treatments, emphasizing the need to increase the
number of miles of protected bike lanes [2]. Recently, the Massachusetts Department of
Transportation (DOT) became the first state DOT to publish guidelines for planning and
designing separated bike lanes [3].
Protected bike lanes, also known as separated bike lanes or cycle tracks, provide a
physical separation between motorists and bicyclists. As a result, they essentially
eliminate the possibility of collision along roadway segments and improve the level of
comfort for many bicyclists. However, this separation is not always maintained at
intersections, and bicyclists are often forced to interact with motorists in a mixed-traffic
environment. Serious concerns have been raised regarding the placement of protected
bike lanes since, after a period of separation, drivers might not anticipate interacting with
bicyclists and, as a result, might be less likely to scan for bicyclists prior to right turns. In
particular, recent research findings suggest that more than 50% of drivers turning right
omit scanning right for bicyclists at intersections after traveling next to protected bike
lanes [4].
The placement of protected or Dutch intersection features after a protected bike lane
is a potential solution for reducing right-hook crashes. This design utilizes a curb
extension and islands, which alter the placement of the driver and the bicyclist at the
intersection. As a result of this placement, drivers that are turning right, encounter the
2 Using Simulation to Assess Conflicts Between Bicyclists and Right-Turning Vehicles
bicyclist in front of them, not to the right of them which is the case for conventional
intersections. Finally, vehicles and bicyclists are physically separated with an island that
forces the driver to make the turn at a wider angle.
Extensive research efforts have focused on studying right-hook crashes under
various bicycle infrastructure treatments at intersections and roadway segments.
However, studies that investigate the impact of combinations of segment-level and
intersection-level bicycle infrastructure treatments and their effect on right-hook crashes
are missing. There is a need to understand the impact of such treatment combinations
on the behavior of drivers that are performing a right turn at intersections.
The objective of this study is to examine whether the placement of a protected
intersection after a protected bike lane can increase a driver’s situational awareness of
bicyclist presence and thus encourage scanning for bicyclists prior to a right turn. We
hypothesize that protected intersections, which combine pavement markings and
physical barriers, are more effective than conventional intersections in communicating to
a driver performing a right turn that a bicyclist might be present. We further hypothesize
that this holds both when protected bike lanes and when conventional bike lanes are
implemented upstream of those intersections. Another hypothesis tested through this
study is that drivers traveling next to a protected bike lane are less likely to scan for
bicyclists as they turn right at protected or conventional intersections. Finally, we
anticipate that the presence of a bicyclist on the segment prior to the intersection does
not have any impact on driver behavior at the segment level or intersection level.
Overall, this study investigates the effectiveness of four segment-intersection bicycle
infrastructure treatment combinations in altering driver behavior while performing a right
turn as well as while driving along segments. A driving simulator experiment has been
designed to test driver behavior during right-turning movements at intersections and
along roadway segments that consist of combinations of protected and conventional bike
lanes followed by protected and conventional intersections. The advantages of using a

3 Using Simulation to Assess Conflicts Between Bicyclists and Right-Turning Vehicles
simulation environment are that multiple combinations can be tested in a controlled
environment where one can also obtain demographic and other driver information in an
effort to understand factors that motivate certain behaviors.
4 Using Simulation to Assess Conflicts Between Bicyclists and Right-Turning Vehicles
2 Background
Research on the impact of protected bike lanes has flourished over the past few
years as more and more urban areas have implemented them. However, research on
the impact of protected intersections is limited, raising the need to understand their
safety benefits and design implementation guidelines. Additionally, existing studies
either focus on the segment treatments (e.g., away from the intersection) or only
evaluate intersection treatments, ignoring the benefits that could result from combining
segment and intersection bicycle infrastructure treatments.
In general, research findings conclude that protected bike lanes have the ability to
improve safety [5, 6, 7, 8] as they eliminate the interactions between motorists and
bicyclists. Specifically, protected bike lanes have been found to prevent certain types of
crashes that occur, for example, when a vehicle overtaking a bicycle and “dooring”
crashes [9]. For the bicyclists, riding on protected bike lanes is considered more
comfortable and less stressful than conventional bike lanes or shared streets [10].
However, crashes and conflicts have been commonplace at intersections that follow
segments with protected bike lanes [11, 12]. Summala et al. [13] investigated driver and
bicyclist behavior at T-intersections with cycle tracks (i.e., protected bike lanes). Video
recordings of drivers’ head movement and braking behavior revealed that drivers making
a right turn after traveling on a roadway segment next to a cycle track scan right less
frequently than left.
Recent studies suggest the need for interventions at intersections when protected
bike lanes are placed upstream of those intersections to reduce the risk of right-hook
crashes [14]. Examples of intersection treatments that have been studied include the
evaluation of traffic signal phases dedicated to bicyclists [15] and various intersection-
designs such as mixing zones, i.e., configurations that mix the traffic upstream of the
intersection [16, 17] and protected intersections [18]. In particular, Madsen and
5 Using Simulation to Assess Conflicts Between Bicyclists and Right-Turning Vehicles
Lahrmann [16] studied conflicts between drivers and bicyclists extracted from video
recordings for protected intersections and four other mixing zone designs that varied
with respect to the cycle track’s length and the infrastructure treatments for bicyclists and
right-turning vehicles at the intersection. Overall, protected intersections were the safest
in terms of conflicts. However, because very few conflicts were observed during this
observational study, the results were not statistically significant. Schepers [19] noted that
mixing cars and bicyclists is recommended only in cases where the speed limit is no
more than 18.6 mph (30 km/hour). Warner et al. [18] assessed the effectiveness of
various intersection design elements, including protected intersections and intersections
with painted through bike lanes, through a driving simulator experiment. Their study
found no significant differences among the different intersection treatments for scanning
right for bicyclists while approaching the intersection.
In a nutshell, existing research on right-hook crashes focuses on intersection designs
without considering the effect of bicycle treatment in the segment prior to the
intersection. For example, a protected bike lane followed by a protected intersection may
affect drivers’ ability to scan for and detect bicyclists differently than a conventional bike
lane leading to a protected intersection. Overall, there is a need to investigate the effect
of transitioning from separated or protected (i.e., treatments that physically separate
bicyclists from vehicular traffic) to mixed-traffic environments (i.e., no physical separation
between bicyclists and drivers) and vice versa.

6 Using Simulation to Assess Conflicts Between Bicyclists and Right-Turning Vehicles
3 Methodology
Driver behavior at four segment-intersection combinations was examined using a
driving simulator. The four combinations were: (1) a protected bike lane (PBL) followed
by a protected intersection (PI), (2) a PBL followed by a non-protected intersection (NPI),
(3) a conventional bike lane (CBL) followed by a PI, and (4) a CBL followed by an NPI.
Figure 3.1 illustrates the experimental design. The focus was on right-turn movements at
intersections, but behavior along segments prior to the right turns was also captured.
Figure 3.1 - Bicycle infrastructure treatments used in the experimental design
The main benefit of driving simulation is the ability to design and test various
scenarios that cannot be easily found in the field. For example, there is currently a
limited number of protected intersections in the U.S. The driving simulator records
kinematic data, i.e., X and Y coordinates, velocity, acceleration, and lateral position of
the vehicle over time. In order to capture the visual behavior of the driver, the study
utilized an eye-tracking device that tracks and records participants’ gaze. The

7 Using Simulation to Assess Conflicts Between Bicyclists and Right-Turning Vehicles
combination of driving simulation and eye tracking allows for an in-depth understanding
of drivers’ response to various elements of the environment.
3.1 Experimental Design
3.1.1 Scenario Description
The experiment consisted of eight drives, each representing one of the four
segment-intersection combinations (Figure 3.1) with or without a bicyclist on the
segment prior to the intersection. Table 3.1 presents all the drives that were tested. To
eliminate the order effect, the Latin square matrix method was chosen to generate a
different order for the eight drives for each participant.
Table 3.1 - Scenarios
Segment Intersection Bicyclist Present
Yes No
PBL PI 1 5
PPL NPI 2 6
CPL NPI 3 7
CPL PI 4 8
The participants drove 310 m on a straight, four-lane roadway segment that led to an
intersection; see Figure 3.2. The speed limit on that segment was 35 mph. While
approaching the intersection, drivers received an indication to make a right turn. The
drive terminated a few meters after the intersection. Points A and B on the segment
indicate the start and end point of the section where one could see the coded bicyclist
(when one existed); see Figure 3.2. The bicyclist traveled these 80 m at a speed of 10
mph. Therefore, the participant encountered the bicyclist upstream of the intersection
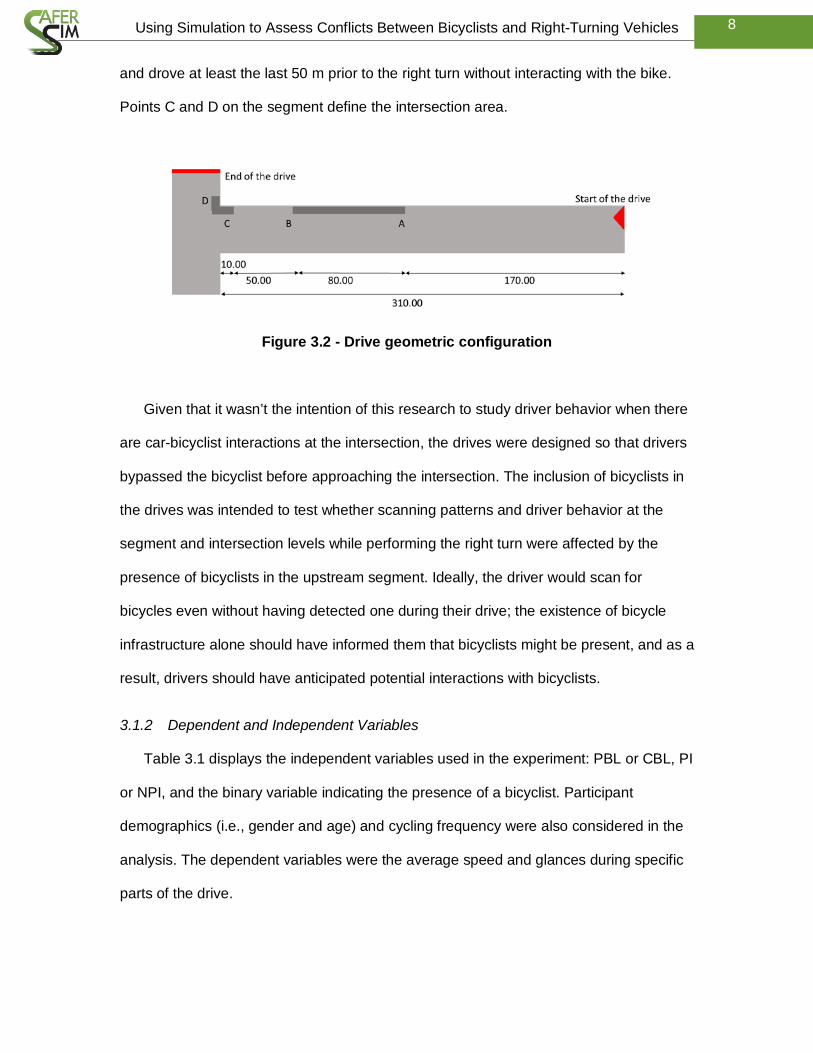
8 Using Simulation to Assess Conflicts Between Bicyclists and Right-Turning Vehicles
and drove at least the last 50 m prior to the right turn without interacting with the bike.
Points C and D on the segment define the intersection area.
Figure 3.2 - Drive geometric configuration
Given that it wasn’t the intention of this research to study driver behavior when there
are car-bicyclist interactions at the intersection, the drives were designed so that drivers
bypassed the bicyclist before approaching the intersection. The inclusion of bicyclists in
the drives was intended to test whether scanning patterns and driver behavior at the
segment and intersection levels while performing the right turn were affected by the
presence of bicyclists in the upstream segment. Ideally, the driver would scan for
bicycles even without having detected one during their drive; the existence of bicycle
infrastructure alone should have informed them that bicyclists might be present, and as a
result, drivers should have anticipated potential interactions with bicyclists.
3.1.2 Dependent and Independent Variables
Table 3.1 displays the independent variables used in the experiment: PBL or CBL, PI
or NPI, and the binary variable indicating the presence of a bicyclist. Participant
demographics (i.e., gender and age) and cycling frequency were also considered in the
analysis. The dependent variables were the average speed and glances during specific
parts of the drive.
9 Using Simulation to Assess Conflicts Between Bicyclists and Right-Turning Vehicles
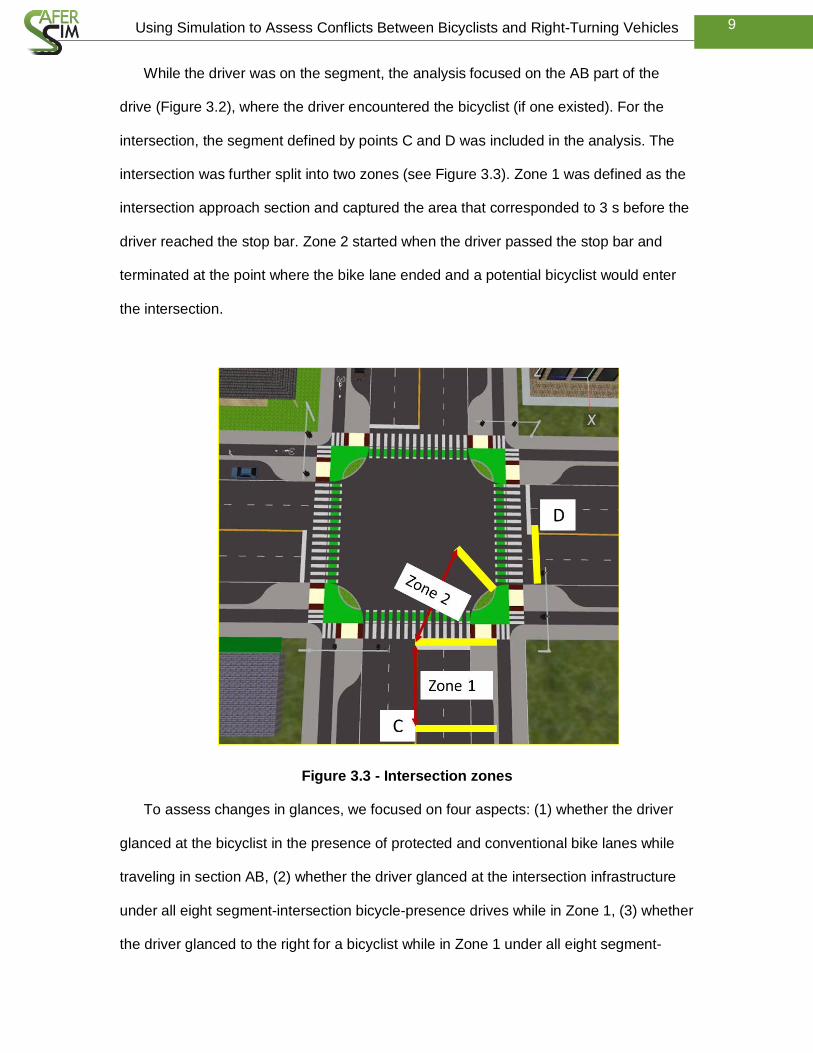
While the driver was on the segment, the analysis focused on the AB part of the
drive (Figure 3.2), where the driver encountered the bicyclist (if one existed). For the
intersection, the segment defined by points C and D was included in the analysis. The
intersection was further split into two zones (see Figure 3.3). Zone 1 was defined as the
intersection approach section and captured the area that corresponded to 3 s before the
driver reached the stop bar. Zone 2 started when the driver passed the stop bar and
terminated at the point where the bike lane ended and a potential bicyclist would enter
the intersection.
Figure 3.3 - Intersection zones
To assess changes in glances, we focused on four aspects: (1) whether the driver
glanced at the bicyclist in the presence of protected and conventional bike lanes while
traveling in section AB, (2) whether the driver glanced at the intersection infrastructure
under all eight segment-intersection bicycle-presence drives while in Zone 1, (3) whether
the driver glanced to the right for a bicyclist while in Zone 1 under all eight segment-
10 Using Simulation to Assess Conflicts Between Bicyclists and Right-Turning Vehicles
intersection bicycle-presence drives, and (4) whether the driver glanced right for a
bicyclist while in Zone 2 under all eight segment-intersection bicycle-presence drives.
Glances were treated as binary variables.
Since protected bike lanes keep the driver and the bicyclist away from each other
and eliminate interactions between them while traveling on the segment, it was expected
that drivers would not glance at the bicyclist on the segment and would fail to scan for
bicyclists as they performed a right turn at the intersection. At the intersection, a design
that incorporates colored pavement markings, curb extension, and raised elements is
more likely to capture the driver’s attention. As a result, we expected drivers to glance at
the intersection treatment and scan for bicyclists as they turned right when in a protected
intersection regardless of the segment infrastructure treatment upstream of the
intersection. Finally, it was expected that glance behavior at the intersection approach
and while the right turn was performed would not be affected by the presence of a
bicyclist upstream of the intersection segment.
Speed data was analyzed for the following parts of each drive: (1) while the driver
was traveling in section AB, and (2) while the driver was traveling in section CD. Speed
may be impacted by segment-level bicycle-infrastructure treatments and the presence of
a bicyclist. In PBLs, one would expect higher speeds than in a CBL due to the greater
distance between bicyclists and drivers. Higher speeds would also be expected in the
drives without bicyclists than in those where a bicyclist was present in the bike lane while
a driver was traversing the segment. The combination of segment-intersection
infrastructure was expected to alter driver speed as follows: in a protected intersection,
the driver was expected to view the design from a greater distance and thus reduce
speed earlier than in unprotected intersections.
11 Using Simulation to Assess Conflicts Between Bicyclists and Right-Turning Vehicles
3.1.3 Participants and Experimental Procedure
Thirty-two drivers completed the study: 16 females between 18 and 31 years old,
and 16 males between 18 and 36 years old. The average age was 23.7 years, and the
median age was 24 years with a standard deviation of 4.5 years. The participants were
recruited from the University of Massachusetts Amherst area via emails, and all had a
valid driver’s license. Of the 32 participants, 15 reported that they did not cycle. Among
the remaining 17, 5 cycled more than 4 times per week, 3 cycled more than one time per
week, and 9 cycled 1-2 times per month. The participants cycled for commuting-only
purposes, recreational-only purposes, and both. The majority of the participants (19 out
of 32) drove fewer than 50 miles during the week prior to participating in the experiment,
which could be attributed to the fact that all subjects were students or staff at the
University and tended to live close by.
The study procedure consisted of four steps:
1. The participant completed the consent form and a pre-study questionnaire
that obtained demographics as well as driving history and frequency (see
Appendix A).
2. The second step consisted of a test drive, which aimed to familiarize the
participant with the car and the simulator environment through a short drive.
The participant was seated in the driver’s seat and fitted with the eye tracker.
Besides allowing the participant to get used to the car (e.g., braking, turning
etc.), this step informed the researcher if the participant was susceptible to
simulator sickness, which would result in exclusion.
3. The participant drove the eight scenarios.
4. The participant completed the post-study questionnaire regarding cycling
purpose and frequency (see Appendix B).
12 Using Simulation to Assess Conflicts Between Bicyclists and Right-Turning Vehicles
3.2 Apparatus
3.2.1 Driving Simulator
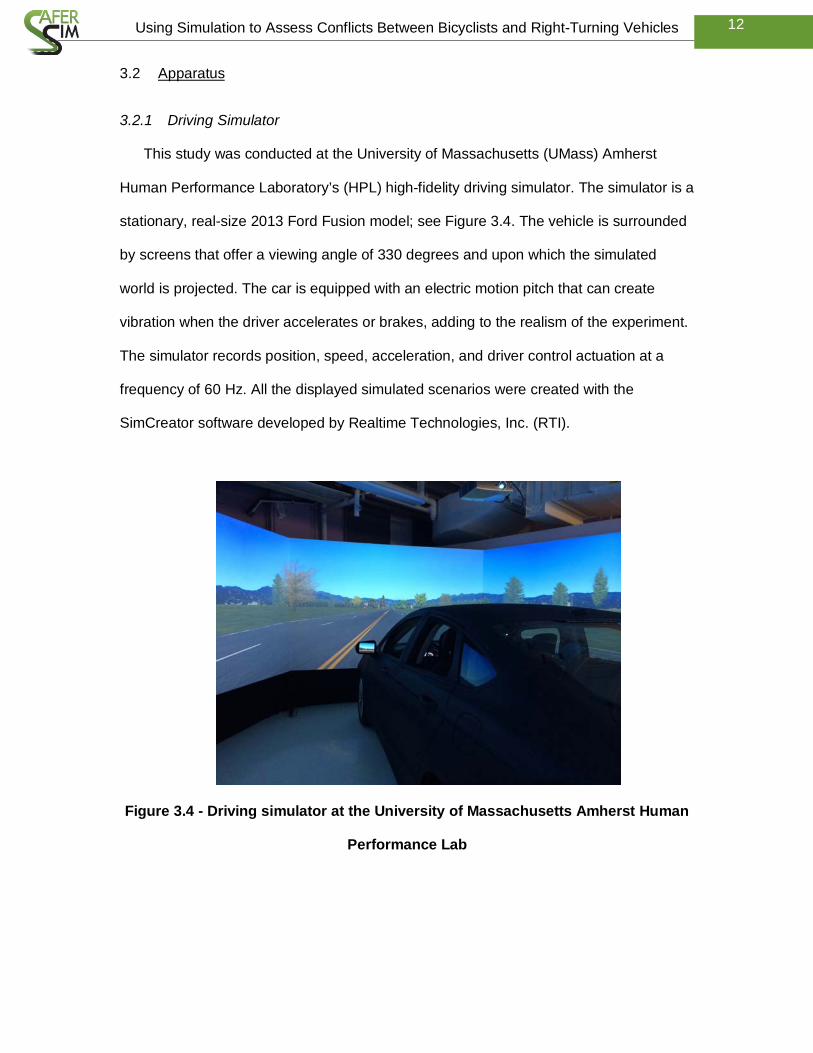
This study was conducted at the University of Massachusetts (UMass) Amherst
Human Performance Laboratory’s (HPL) high-fidelity driving simulator. The simulator is a
stationary, real-size 2013 Ford Fusion model; see Figure 3.4. The vehicle is surrounded
by screens that offer a viewing angle of 330 degrees and upon which the simulated
world is projected. The car is equipped with an electric motion pitch that can create
vibration when the driver accelerates or brakes, adding to the realism of the experiment.
The simulator records position, speed, acceleration, and driver control actuation at a
frequency of 60 Hz. All the displayed simulated scenarios were created with the
SimCreator software developed by Realtime Technologies, Inc. (RTI).
Figure 3.4 - Driving simulator at the University of Massachusetts Amherst Human
Performance Lab
13 Using Simulation to Assess Conflicts Between Bicyclists and Right-Turning Vehicles
3.2.2 Eye Tracker
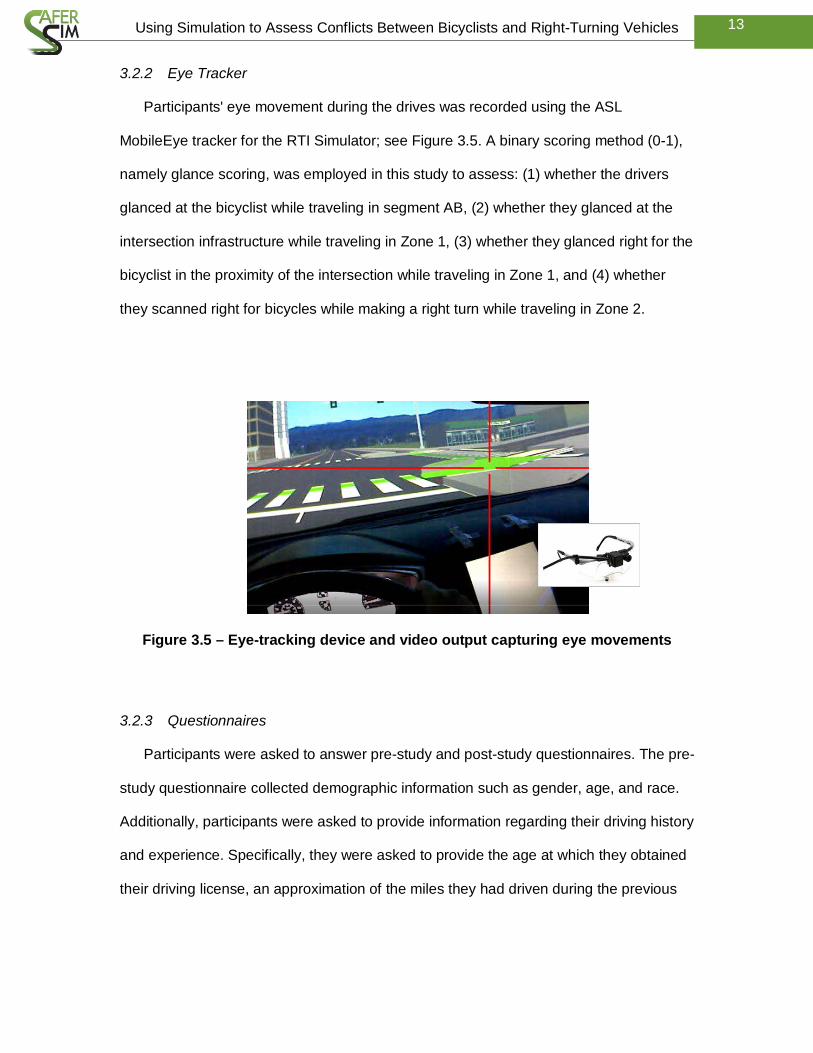
Participants' eye movement during the drives was recorded using the ASL
MobileEye tracker for the RTI Simulator; see Figure 3.5. A binary scoring method (0-1),
namely glance scoring, was employed in this study to assess: (1) whether the drivers
glanced at the bicyclist while traveling in segment AB, (2) whether they glanced at the
intersection infrastructure while traveling in Zone 1, (3) whether they glanced right for the
bicyclist in the proximity of the intersection while traveling in Zone 1, and (4) whether
they scanned right for bicycles while making a right turn while traveling in Zone 2.
Figure 3.5 – Eye-tracking device and video output capturing eye movements
3.2.3 Questionnaires
Participants were asked to answer pre-study and post-study questionnaires. The pre-
study questionnaire collected demographic information such as gender, age, and race.
Additionally, participants were asked to provide information regarding their driving history
and experience. Specifically, they were asked to provide the age at which they obtained
their driving license, an approximation of the miles they had driven during the previous
14 Using Simulation to Assess Conflicts Between Bicyclists and Right-Turning Vehicles
week, and an approximation of the miles they had driven during the previous year.
Appendix A presents the pre-study questionnaire.
Cycling history and frequency were collected in the post-study questionnaire
because answering those questions before the drives could have biased the participants
towards the study. The post-study questionnaire asked participants to state whether they
cycle. If they answered yes, the participants had to further indicate their cycling
frequency and purpose for bicycling. Appendix B presents the post-study questionnaire.
15 Using Simulation to Assess Conflicts Between Bicyclists and Right-Turning Vehicles
4 Results
To assess whether demographic characteristics or cycling frequency affect driver
behavior, we included age, gender, and cycling frequency as independent variables.
Since gender could be controlled during the recruiting period, female-male populations
were equal.
Participants were split into two age groups, 18-25 (62.50%) and 26-36 (37.50%),
considered novice and young drivers, respectively. This separation was based on
research findings that differentiate between the risk perceived by age groups of 25 years
and younger and 25-65 years [20,21,22]. Therefore, age was treated as a binary
variable.
Three groups were created based on cycling frequency. People who reported that
they did not bike at all were considered “no bicyclists” and represented 46.88% of
participants. Participants who reported biking 1-2 times per week or more than 4 times
per week were grouped together and formed the category of “weekly” bicyclists
(18.75%). Finally, participants who cycled 1-2 times per month formed the category of
“monthly” bicyclists (34.38%).
4.1 Eye Glances
Driver behavior was investigated in terms of eye glances at both the segment and
intersection levels, and the results are presented in the following sections.
4.1.1 Segment Analysis
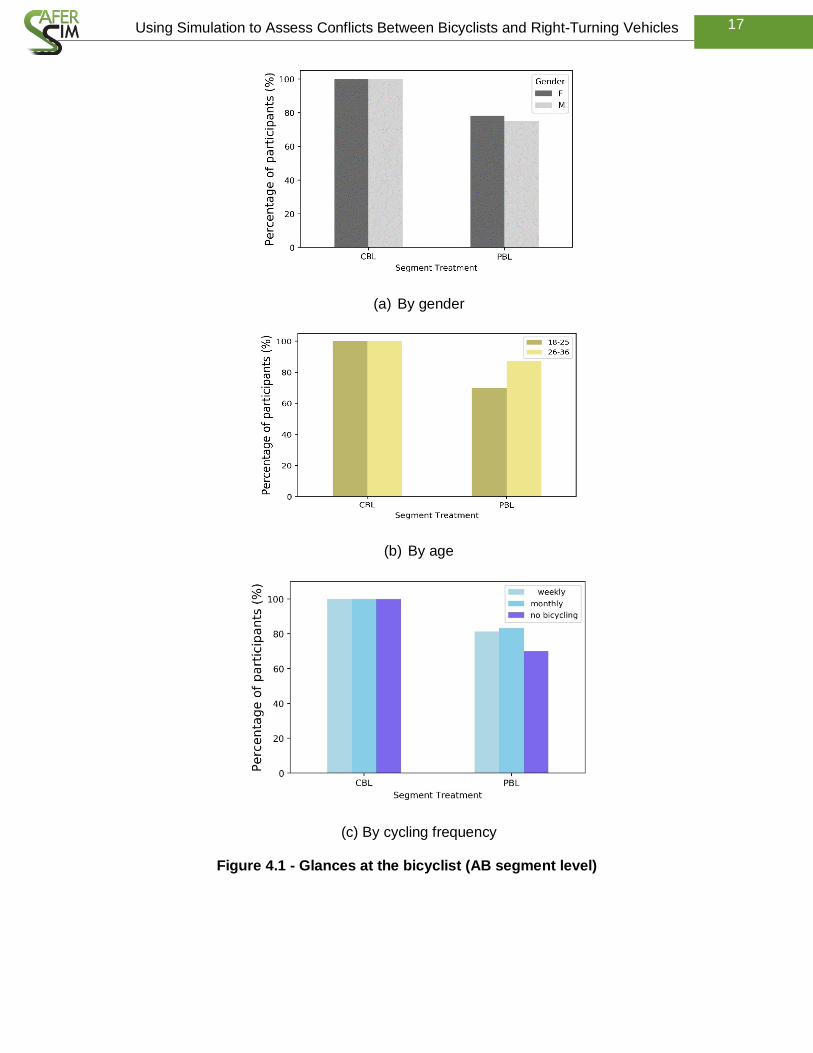
For the AB segment, only scenarios that included the bicyclist were considered for
the analysis. Glances were scored only when the red cross (see Figure 3.5) was placed
on the bicyclist. In the case of CBLs, all participants viewed the bicyclist. However, in the
case of PBLs, only 76% of participants glanced at the bicyclist. Glances were further
analyzed with respect to gender, age, and cycling frequency to investigate whether any
of these factors could be associated with the participants’ visual search. While gender
16 Using Simulation to Assess Conflicts Between Bicyclists and Right-Turning Vehicles
did not seem to have any impact on glances on the AB segment, age and cycling
frequency appeared to be stronger determinants of drivers’ visual search in the case of a
PBL (see Figure 4.1). In particular, participants in the 26-36 age group and the ones that
were even occasional cyclists were more likely to glance at the bicyclist.
After passing the bicyclist, several drivers glanced at the right mirror or outside the
window while turning their head to the right. These glances took place either within the
AB area or downstream of it but not within the CD area. If the latter was the case, then
the glances would count towards intersection right scanning (either Zone 1 or 2). In the
scenarios where a bicyclist was present, these glances were possibly an additional
check that the driver had passed the bicyclist. For the remainder of this report, this
glance is denoted as “bicyclist back.”
In total, 14.6% and 31.5% of the participants made this glance in the presence of
PBL and CBL, respectively, when a bicyclist was present. In the drives with PBL, the
glance was made by looking out the window and glancing at the area where the bicyclist
could potentially be. In the case of CBL, the participants glanced at the right mirror in
addition to looking out the window. Results were inconclusive on the impact of gender,
age, and cycling frequency on the behavior of glancing at the bicyclist after passing
him/her.
A binary logistic regression model was developed to study the factors impacting
driver glancing behavior at the segment when a bicyclist was present. The following
factors were considered: segment treatment, gender, age, and cycling frequency (see
Table 4.1). The variables were modeled as binary: gender = 1 for female participants, 0
otherwise; age = 1 for the 18-25 age group, 0 otherwise; cycling = 1 if participants
reported cycling on a monthly or weekly basis, 0 otherwise; and segment treatment = 1
for PBL, 0 otherwise.
17 Using Simulation to Assess Conflicts Between Bicyclists and Right-Turning Vehicles
(a) By gender
(b) By age
(c) By cycling frequency
Figure 4.1 - Glances at the bicyclist (AB segment level)
18 Using Simulation to Assess Conflicts Between Bicyclists and Right-Turning Vehicles
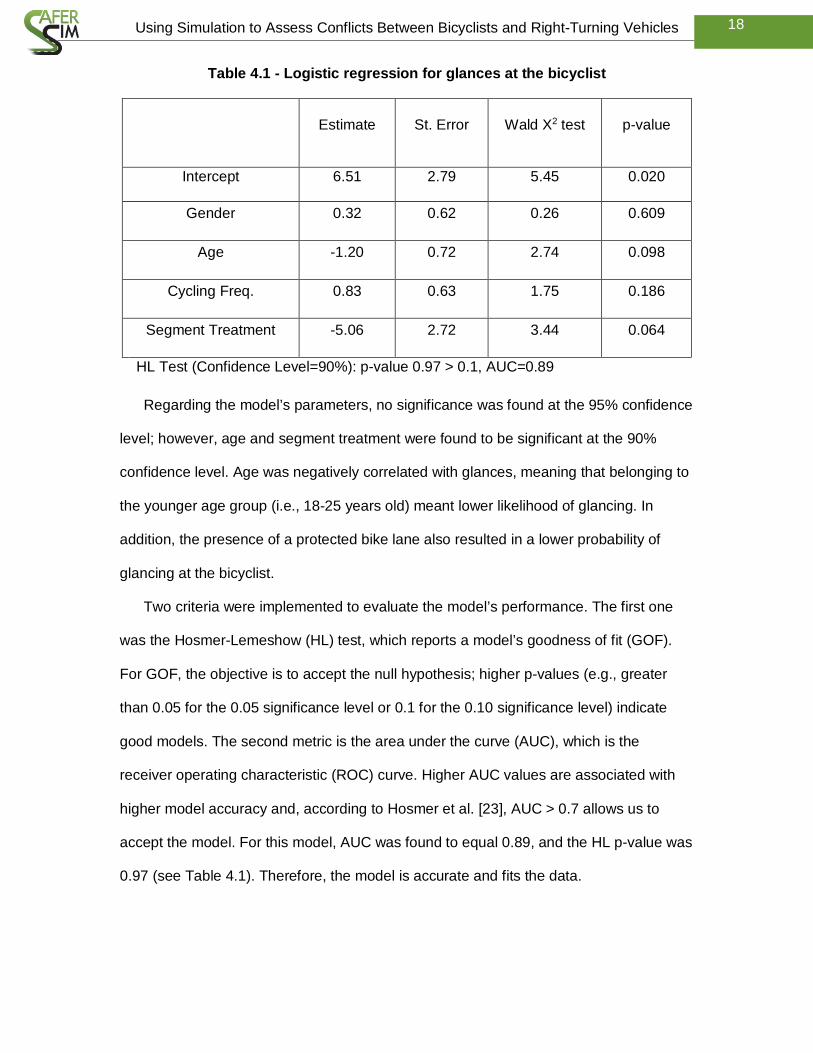
Table 4.1 - Logistic regression for glances at the bicyclist
Estimate St. Error Wald X2 test p-value
Intercept 6.51 2.79 5.45 0.020
Gender 0.32 0.62 0.26 0.609
Age -1.20 0.72 2.74 0.098
Cycling Freq. 0.83 0.63 1.75 0.186
Segment Treatment -5.06 2.72 3.44 0.064
HL Test (Confidence Level=90%): p-value 0.97 > 0.1, AUC=0.89
Regarding the model’s parameters, no significance was found at the 95% confidence
level; however, age and segment treatment were found to be significant at the 90%
confidence level. Age was negatively correlated with glances, meaning that belonging to
the younger age group (i.e., 18-25 years old) meant lower likelihood of glancing. In
addition, the presence of a protected bike lane also resulted in a lower probability of
glancing at the bicyclist.
Two criteria were implemented to evaluate the model’s performance. The first one
was the Hosmer-Lemeshow (HL) test, which reports a model’s goodness of fit (GOF).
For GOF, the objective is to accept the null hypothesis; higher p-values (e.g., greater
than 0.05 for the 0.05 significance level or 0.1 for the 0.10 significance level) indicate
good models. The second metric is the area under the curve (AUC), which is the
receiver operating characteristic (ROC) curve. Higher AUC values are associated with
higher model accuracy and, according to Hosmer et al. [23], AUC > 0.7 allows us to
accept the model. For this model, AUC was found to equal 0.89, and the HL p-value was
0.97 (see Table 4.1). Therefore, the model is accurate and fits the data.
19 Using Simulation to Assess Conflicts Between Bicyclists and Right-Turning Vehicles
The same method was followed to test the significance of the same factors for the
“bicyclist back” check. However, none of the variables were found significant at the 90%
confidence level.
In a nutshell, segment infrastructure affects drivers’ likelihood to glance at the
bicyclist on the segment, i.e., they are more likely to glance when the bicyclist is
traveling on a CBL adjacent to the traffic lane. This finding is in agreement with the
literature on drivers’ attention allocation, which claims that drivers tend to be more
focused on objects and stimuli that appear in front of them [24].
4.1.2 Intersection Analysis
The intersection analysis focused on two zones, as shown in Figure 3.3. For Zone 1
the analysis concentrated on (1) whether the drivers glanced at the intersection
infrastructure, and (2) whether they glanced to the right through the window or using the
right mirror. For Zone 2 the focus was on glances at the bike lane (protected or
conventional) in the area of the intersection because it could be seen from the right
window while the participant was making the right turn.
While in Zone 1, approximately 94% and 62% of the participants glanced at the
intersection infrastructure treatment in protected and conventional intersections,
respectively. As protected intersection design elements often display bright colors (e.g.,
green pavement markings) and include physical barriers, it is expected that they will
capture drivers’ attention.
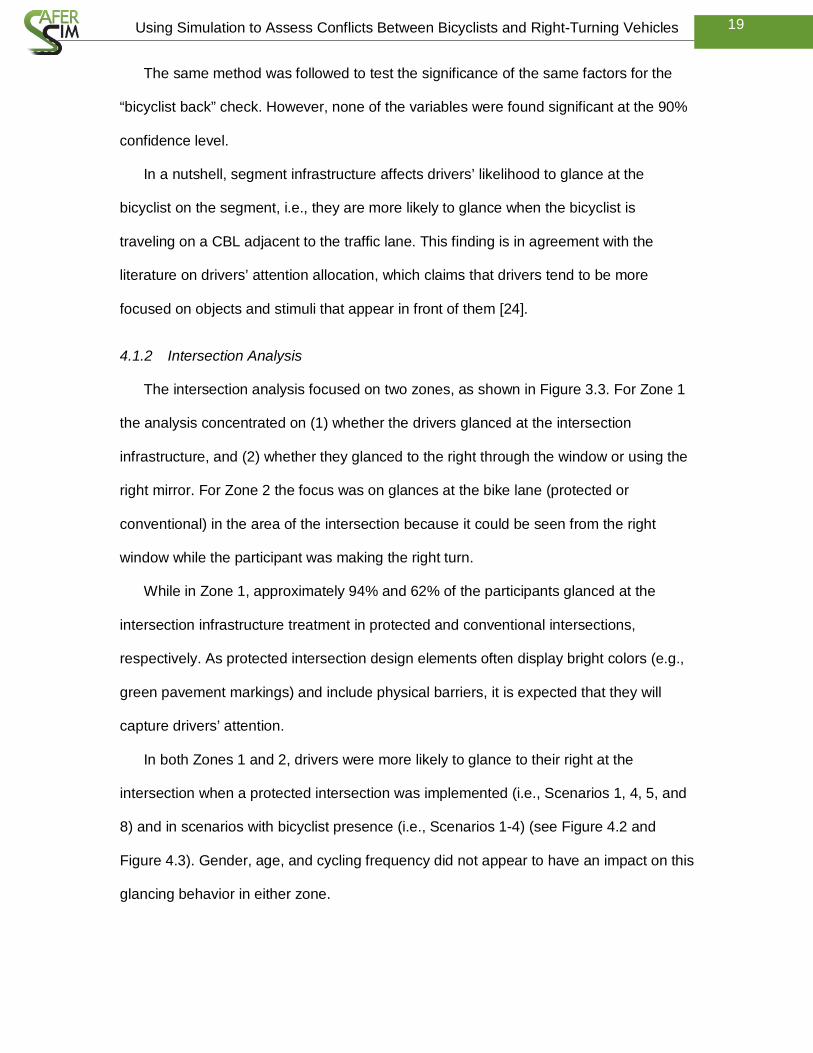
In both Zones 1 and 2, drivers were more likely to glance to their right at the
intersection when a protected intersection was implemented (i.e., Scenarios 1, 4, 5, and
8) and in scenarios with bicyclist presence (i.e., Scenarios 1-4) (see Figure 4.2 and
Figure 4.3). Gender, age, and cycling frequency did not appear to have an impact on this
glancing behavior in either zone.
20 Using Simulation to Assess Conflicts Between Bicyclists and Right-Turning Vehicles
Figure 4.2 - Intersection right glances (Zone 1)
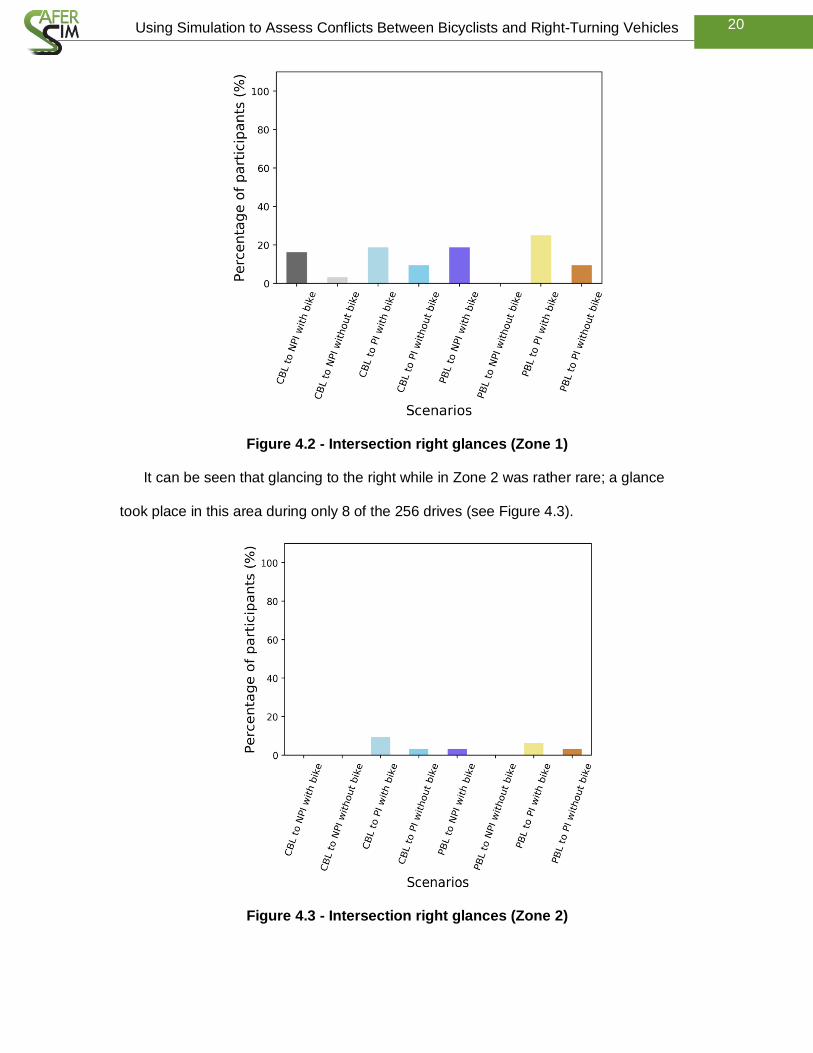
It can be seen that glancing to the right while in Zone 2 was rather rare; a glance
took place in this area during only 8 of the 256 drives (see Figure 4.3).
Figure 4.3 - Intersection right glances (Zone 2)
21 Using Simulation to Assess Conflicts Between Bicyclists and Right-Turning Vehicles
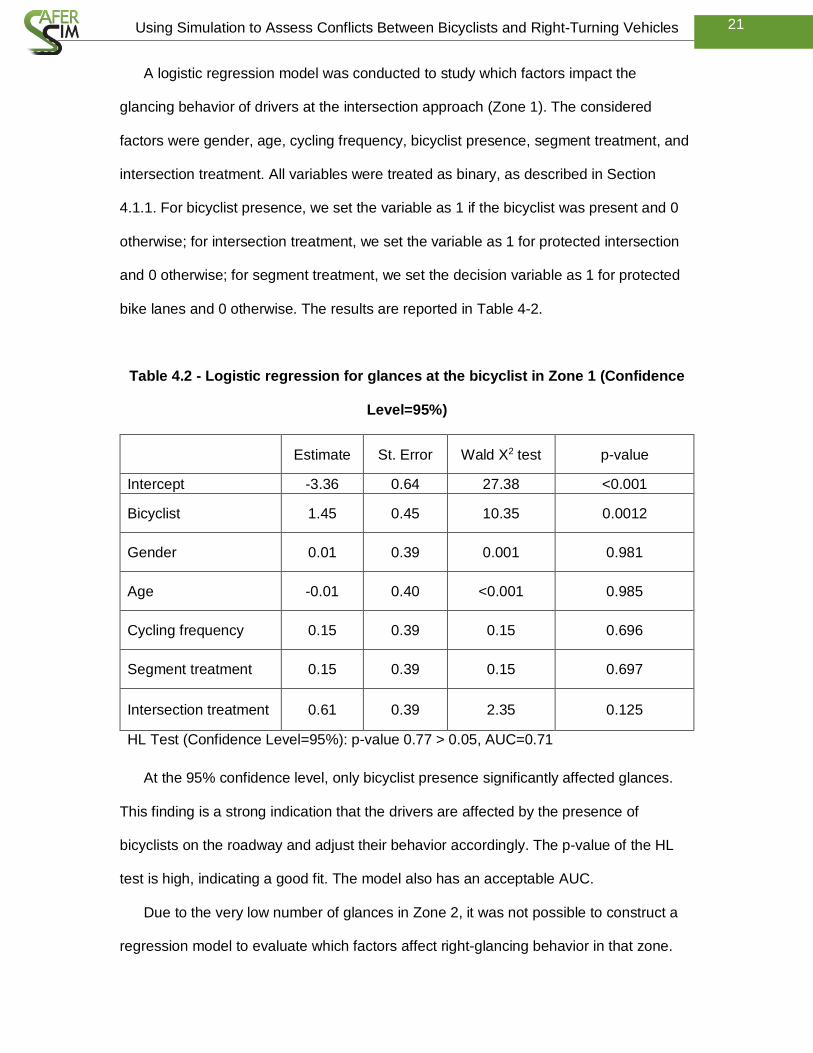
A logistic regression model was conducted to study which factors impact the
glancing behavior of drivers at the intersection approach (Zone 1). The considered
factors were gender, age, cycling frequency, bicyclist presence, segment treatment, and
intersection treatment. All variables were treated as binary, as described in Section
4.1.1. For bicyclist presence, we set the variable as 1 if the bicyclist was present and 0
otherwise; for intersection treatment, we set the variable as 1 for protected intersection
and 0 otherwise; for segment treatment, we set the decision variable as 1 for protected
bike lanes and 0 otherwise. The results are reported in Table 4-2.
Table 4.2 - Logistic regression for glances at the bicyclist in Zone 1 (Confidence
Level=95%)
Estimate St. Error Wald X2 test p-value
Intercept -3.36 0.64 27.38 <0.001
Bicyclist 1.45 0.45 10.35 0.0012
Gender 0.01 0.39 0.001 0.981
Age -0.01 0.40 <0.001 0.985
Cycling frequency 0.15 0.39 0.15 0.696
Segment treatment 0.15 0.39 0.15 0.697
Intersection treatment 0.61 0.39 2.35 0.125
HL Test (Confidence Level=95%): p-value 0.77 > 0.05, AUC=0.71
At the 95% confidence level, only bicyclist presence significantly affected glances.
This finding is a strong indication that the drivers are affected by the presence of
bicyclists on the roadway and adjust their behavior accordingly. The p-value of the HL
test is high, indicating a good fit. The model also has an acceptable AUC.
Due to the very low number of glances in Zone 2, it was not possible to construct a
regression model to evaluate which factors affect right-glancing behavior in that zone.
22 Using Simulation to Assess Conflicts Between Bicyclists and Right-Turning Vehicles
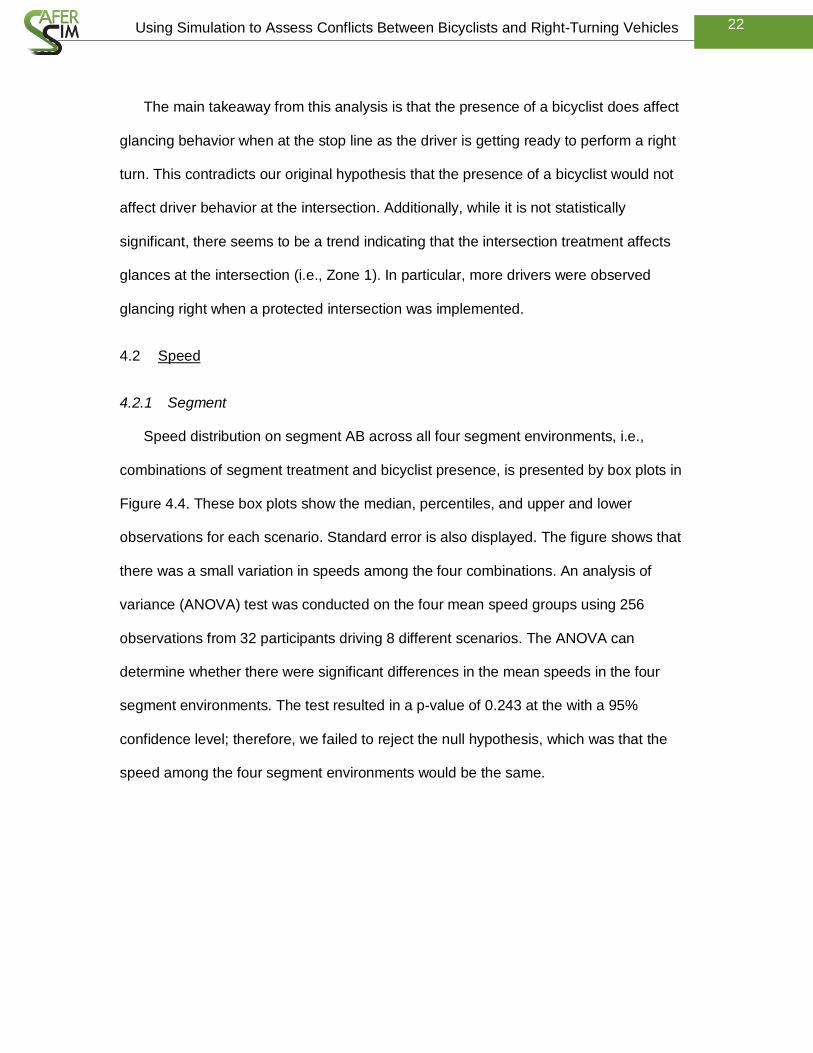
The main takeaway from this analysis is that the presence of a bicyclist does affect
glancing behavior when at the stop line as the driver is getting ready to perform a right
turn. This contradicts our original hypothesis that the presence of a bicyclist would not
affect driver behavior at the intersection. Additionally, while it is not statistically
significant, there seems to be a trend indicating that the intersection treatment affects
glances at the intersection (i.e., Zone 1). In particular, more drivers were observed
glancing right when a protected intersection was implemented.
4.2 Speed
4.2.1 Segment
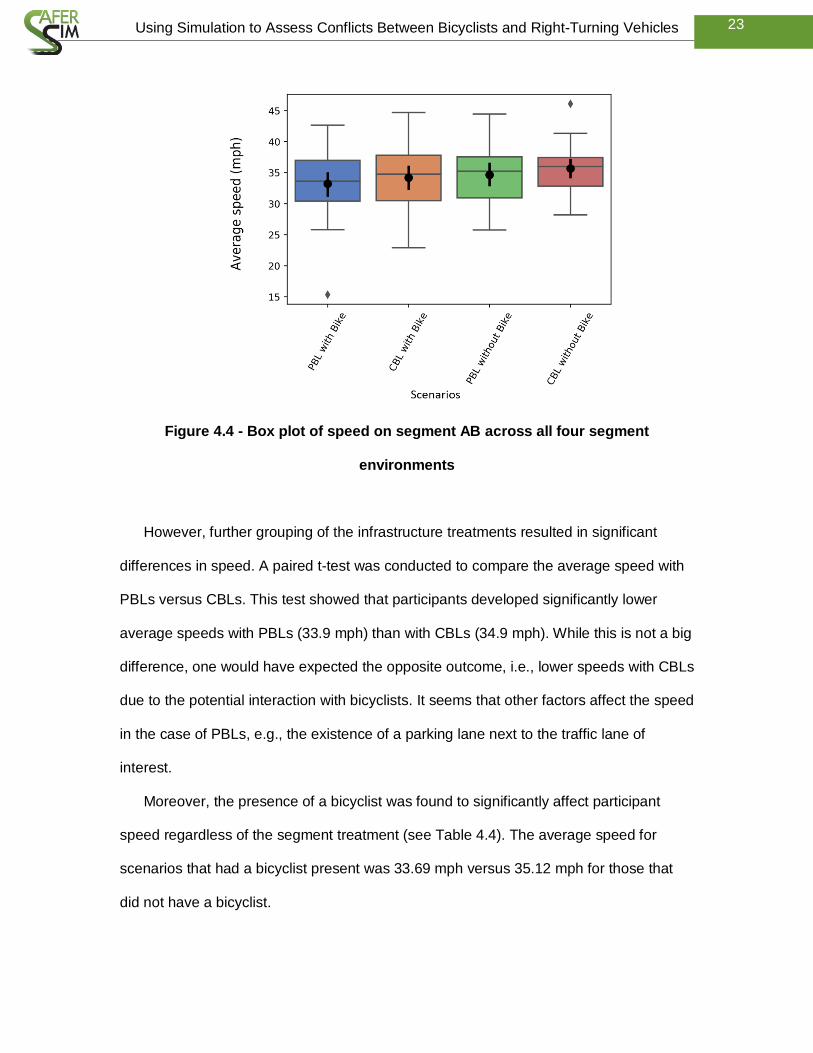
Speed distribution on segment AB across all four segment environments, i.e.,
combinations of segment treatment and bicyclist presence, is presented by box plots in
Figure 4.4. These box plots show the median, percentiles, and upper and lower
observations for each scenario. Standard error is also displayed. The figure shows that
there was a small variation in speeds among the four combinations. An analysis of
variance (ANOVA) test was conducted on the four mean speed groups using 256
observations from 32 participants driving 8 different scenarios. The ANOVA can
determine whether there were significant differences in the mean speeds in the four
segment environments. The test resulted in a p-value of 0.243 at the with a 95%
confidence level; therefore, we failed to reject the null hypothesis, which was that the
speed among the four segment environments would be the same.
23 Using Simulation to Assess Conflicts Between Bicyclists and Right-Turning Vehicles
Figure 4.4 - Box plot of speed on segment AB across all four segment
environments
However, further grouping of the infrastructure treatments resulted in significant
differences in speed. A paired t-test was conducted to compare the average speed with
PBLs versus CBLs. This test showed that participants developed significantly lower
average speeds with PBLs (33.9 mph) than with CBLs (34.9 mph). While this is not a big
difference, one would have expected the opposite outcome, i.e., lower speeds with CBLs
due to the potential interaction with bicyclists. It seems that other factors affect the speed
in the case of PBLs, e.g., the existence of a parking lane next to the traffic lane of
interest.
Moreover, the presence of a bicyclist was found to significantly affect participant
speed regardless of the segment treatment (see Table 4.4). The average speed for
scenarios that had a bicyclist present was 33.69 mph versus 35.12 mph for those that
did not have a bicyclist.
24 Using Simulation to Assess Conflicts Between Bicyclists and Right-Turning Vehicles
Focusing only on the scenarios that had bicyclist presence, a t-test was performed to
compare speeds with the presence of CBLs and PBLs (see Table 4.4). The differences
are rather small (~1 mph), which could be attributed to the fact that drivers did not
interact with the bicyclist for a big part of the segment.
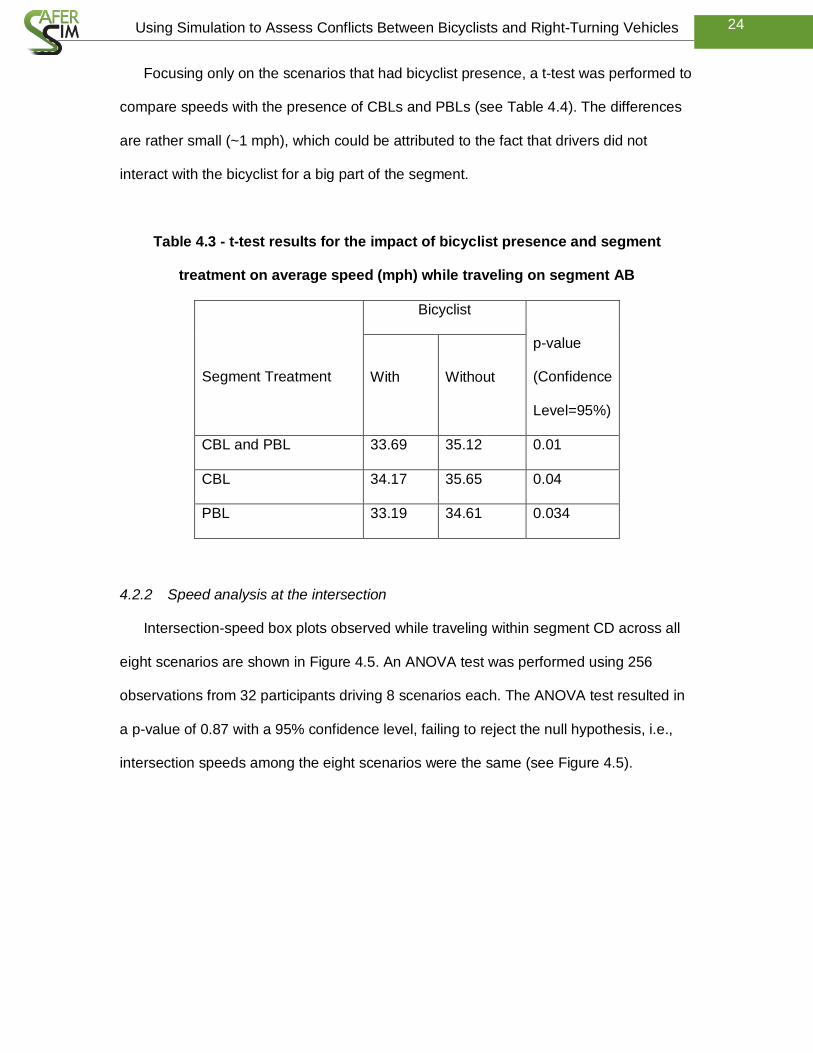
Table 4.3 - t-test results for the impact of bicyclist presence and segment
treatment on average speed (mph) while traveling on segment AB
Segment Treatment
Bicyclist
p-value
(Confidence
Level=95%)
With Without
CBL and PBL 33.69 35.12 0.01
CBL 34.17 35.65 0.04
PBL 33.19 34.61 0.034
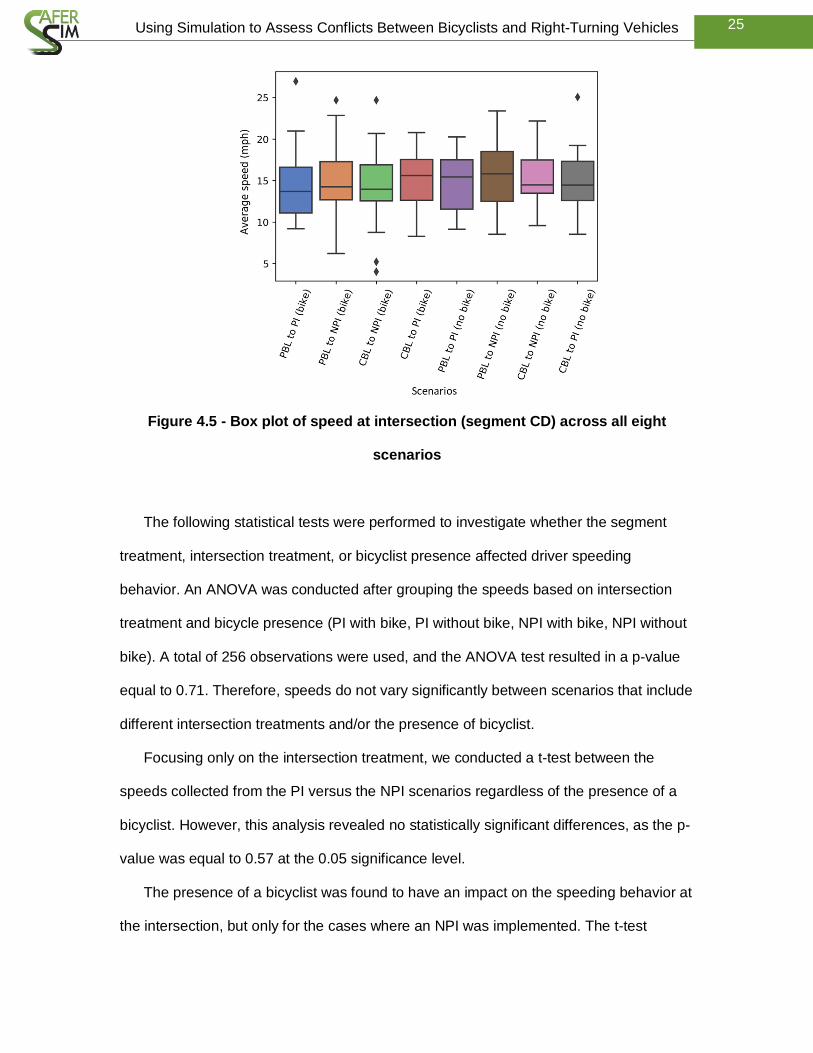
4.2.2 Speed analysis at the intersection
Intersection-speed box plots observed while traveling within segment CD across all
eight scenarios are shown in Figure 4.5. An ANOVA test was performed using 256
observations from 32 participants driving 8 scenarios each. The ANOVA test resulted in
a p-value of 0.87 with a 95% confidence level, failing to reject the null hypothesis, i.e.,
intersection speeds among the eight scenarios were the same (see Figure 4.5).
25 Using Simulation to Assess Conflicts Between Bicyclists and Right-Turning Vehicles
Figure 4.5 - Box plot of speed at intersection (segment CD) across all eight
scenarios
The following statistical tests were performed to investigate whether the segment
treatment, intersection treatment, or bicyclist presence affected driver speeding
behavior. An ANOVA was conducted after grouping the speeds based on intersection
treatment and bicycle presence (PI with bike, PI without bike, NPI with bike, NPI without
bike). A total of 256 observations were used, and the ANOVA test resulted in a p-value
equal to 0.71. Therefore, speeds do not vary significantly between scenarios that include
different intersection treatments and/or the presence of bicyclist.
Focusing only on the intersection treatment, we conducted a t-test between the
speeds collected from the PI versus the NPI scenarios regardless of the presence of a
bicyclist. However, this analysis revealed no statistically significant differences, as the p-
value was equal to 0.57 at the 0.05 significance level.
The presence of a bicyclist was found to have an impact on the speeding behavior at
the intersection, but only for the cases where an NPI was implemented. The t-test
26 Using Simulation to Assess Conflicts Between Bicyclists and Right-Turning Vehicles
between intersection speeds for the NPI with bicyclist presence and without bicyclist
presence showed that when drivers encountered a bicyclist upstream of the intersection,
average speed at the intersection was reduced by approximately 1 mph. This result is
significant at the 0.10 significance level with a p-value = 0.073. However, speeds were
not statistically different in the case of the PI between scenarios with a bicyclist present
and those without a bicyclist.
In conclusion, we can infer that neither the intersection treatment nor the
combination of segment-intersection treatment impacts speeding behavior at the
intersection.
27 Using Simulation to Assess Conflicts Between Bicyclists and Right-Turning Vehicles
5 Conclusions
This study conducted an in-depth analysis of the effect that the combination of
segment and intersection bicycle treatments may have on driver behavior while making
right turns. For segment, two infrastructure treatments were considered, namely,
protected bike lanes and conventional bike lanes. For intersection, the two treatments
were the protected, or Dutch, intersection and the non-protected intersection consisting
of intersection through bike lanes. Driver behavior was assessed through eye movement
and speed data at both the segment and the intersection under the presence or absence
of bicyclists.
The results of the study show that age and segment treatment significantly affect
glance behavior at the segment level when a bicyclist is present. This means that
younger drivers (i.e., 18-25 years old) and the presence of protected bike lanes result in
a lower probability of glances at the bicyclist. As a result, protected bike lanes could be
contributing to lower situational awareness regarding the potential presence of bicyclists
at the intersection. Bicyclist presence was found to affect both glances at the intersection
approach (Zone 1) and speed at the segment level regardless of the segment treatment;
this suggests that drivers tend to anticipate interaction with bicyclists if they have seen
one earlier in the drive. The presence of bicyclists on a bike lane results in higher
situational awareness in drivers; this leads to greater safety for bicyclists, a phenomenon
often referred to as safety in numbers. Regardless of bicyclist presence, speeds were
significantly lower while traveling next to protected bike lanes than conventional bike
lanes.
Overall, neither the intersection infrastructure treatment nor the combination of
segment-intersection treatments was found to affect driver speed while approaching the
intersection and completing a right turn. A limitation of this study is that, due to the
placement of the data markers, it was not possible to distinguish between intersection
28 Using Simulation to Assess Conflicts Between Bicyclists and Right-Turning Vehicles
approach speed and the speed while performing a right turn. Only the presence of a
bicyclist was found to be a statistically significant factor affecting speeds at the
intersection, and then only in the absence of protected-intersection elements.
While this study lacked scenarios with driver-bicycle interactions, it still contributes to
the understanding of driver behavior in complex roadway environments such as when
bicycle infrastructure treatments are present. Because the presence of a bicyclist along
the segment appeared to impact driver behavior, future studies should examine this
impact for a variety of bicycle demand scenarios (both in terms of volume and location
where bicyclist is present). It is also important to study how drivers interact with bicyclists
in the presence of such treatments and how they would react if bicyclists were present at
the intersection prior to the right turn. Different geometric configurations of protected
intersection design elements and a more diverse population in terms of age should also
be tested. Finally, given that bicycle infrastructure treatments are mostly placed in busy
urban environments, future studies should increase driver workload (e.g., increase
motorized traffic) to examine whether the combination of segment-intersection
treatments can be associated with bicyclist safety.
29 Using Simulation to Assess Conflicts Between Bicyclists and Right-Turning Vehicles
6 References
1. National Highway Traffic Safety Administration (NHTSA). (2017). Bicyclists and other
cyclists: 2015 data. National Highway Traffic Safety Administration, Washington,
D.C.
2. New York City Department of Transportation. (2017). Safer cycling: Bicycle ridership
and safety in New York City. Retrieved from
http://www.nyc.gov/html/dot/downloads/pdf/bike-safety-study-fullreport2017.pdf
3. Massachusetts Department of Transportation. (2015). Separated bike lane: Planning
and design. Retrieved from: http://www.nyc.gov/html/dot/downloads/pdf/bike-safety-
study-fullreport2017.pdf
4. Kaya, N. E., Ayas, S., Ponnambalam, C. T., & Donmez, B. (2018, June). Visual
attention failures during turns at intersections: An on-road study. 28th Canadian
Association of Road Safety Professionals Conference, 10-13 June,Victoria, BC,
Canada.
5. Harris, M. A., Reynolds, C. C., Winters, M., Cripton, P. A., Shen, H., Chipman, M. L.,
... & Hunte, G. (2013). Comparing the effects of infrastructure on bicycling injury at
intersections and non-intersections using a case–crossover design. Injury
Prevention, 19(5), 303-310.
6. Thomas, B., & DeRobertis, M. (2013). The safety of urban cycle tracks: A review of
the literature. Accident Analysis & Prevention, 52, 219-227.
7. Teschke, K., Harris, M. A., Reynolds, C. C., Winters, M., Babul, S., Chipman, M., ...
& Monro, M. (2012). Route infrastructure and the risk of injuries to bicyclists: a case-
crossover study. American Journal of Public Health, 102(12), 2336-2343.
8. Lusk, A. C., Morency, P., Miranda-Moreno, L. F., Willett, W. C., & Dennerlein,
J. T. (2013). Bicycle guidelines and crash rates on cycle tracks in the United
States. American Journal of Public Health, 103(7), 1240-1248.
30 Using Simulation to Assess Conflicts Between Bicyclists and Right-Turning Vehicles
9. Rothenberg, H., Goodman, D., & Sundstrom, C. (2016, January). Separated bike
lane crash analysis. Paper No. 16-4289. Transportation Research Board 95th
Annual Meeting, 10–14 January, Washington, D.C.
10. Pucher, J. R., & Buehler, R. (Eds.). (2012). City cycling (Vol. 11). Cambridge, MA:
MIT Press.
11. Sayed, T., Zaki, M. H., & Autey, J. (2013). Automated safety diagnosis of vehicle–
bicycle interactions using computer vision analysis. Safety Science, 59, 163-172.
12. Jensen, S. U. (2008, January). Bicycle tracks and lanes: A before-after study. In
Transportation Research Board 87th Annual Meeting, 13–17 January, Washington,
D.C.
13. Summala, H., Pasanen, E., Räsänen, M., & Sievänen, J. (1996). Bicycle accidents
and drivers' visual search at left and right turns. Accident Analysis &
Prevention, 28(2), 147-153.
14. Schepers, P., Twisk, D., Fishman, E., Fyhri, A., & Jensen, A. (2017). The Dutch road
to a high level of cycling safety. Safety Science, 92, 264-273.
15. Furth, P. G., Koonce, P. J., Miao, Y., Peng, F., & Littman, M. (2014). Mitigating right-
turn conflict with protected yet concurrent phasing for cycle track and pedestrian
crossings. Transportation Research Record, 2438(1), 81-88.
16. Madsen, T. K. O., & Lahrmann, H. (2017). Comparison of five bicycle facility designs
in signalized intersections using traffic conflict studies. Transportation Research Part
F: Traffic Psychology and Behaviour, 46, 438-450.
17. Monsere, C. M., Foster, N., Dill, J., & McNeil, N. (2015). User behavior and
perceptions at intersections with turning and mixing zones on protected bike
lanes. Transportation Research Record: Journal of the Transportation Research
Board, (2520), 112-122.
31 Using Simulation to Assess Conflicts Between Bicyclists and Right-Turning Vehicles
18. Warner, J., Hurwitz, D. S., Monsere, C. M., & Fleskes, K. (2017). A simulator-based
analysis of engineering treatments for right-hook bicycle crashes at signalized
intersections. Accident Analysis & Prevention, 104, 46-57.
19. Schepers, J. P., Kroeze, P. A., Sweers, W., & Wüst, J. C. (2011). Road factors and
bicycle–motor vehicle crashes at unsignalized priority intersections. Accident
Analysis & Prevention, 43(3), 853-861.
20. Strayer, D. L., & Drew, F. A. (2004). Profiles in driver distraction: Effects of cell
phone conversations on younger and older drivers. Human Factors, 46(4), 640-649.
21. Borowsky, A., Oron-Gilad, T., & Parmet, Y. (2009). Age and skill differences in
classifying hazardous traffic scenes. Transportation Research Part F: Traffic
Psychology and Behaviour, 12(4), 277-287.
22. Borowsky, A., Shinar, D., & Oron-Gilad, T. (2010). Age, skill, and hazard perception
in driving. Accident Analysis & Prevention, 42(4), 1240-1249.
23. Hosmer Jr, D.W., Lemeshow, S., Sturdivant, R., 2013. Applied Logistic Regression.
John Wiley & Sons.
24. Jannat, M., Hurwitz, D. S., Monsere, C., & Funk II, K. H. (2018). The role of driver’s
situational awareness on right-hook bicycle-motor vehicle crashes. Safety Science,
110, 92-101.
32 Using Simulation to Assess Conflicts Between Bicyclists and Right-Turning Vehicles
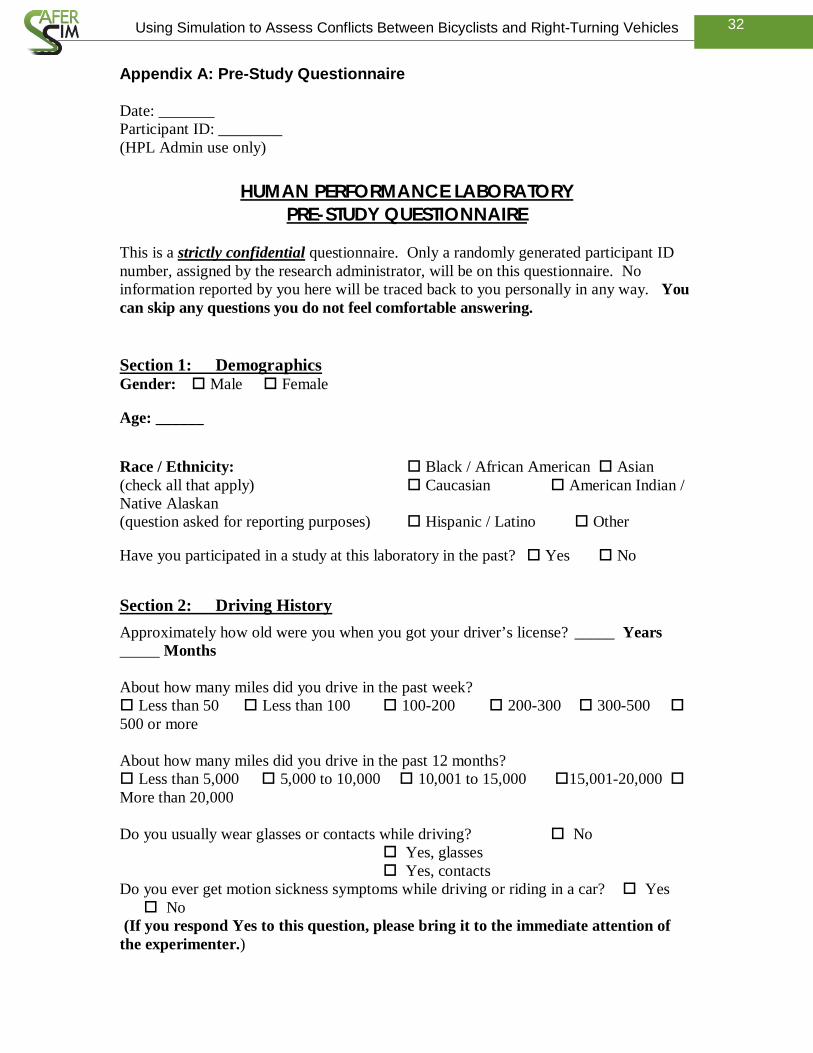
Appendix A: Pre-Study Questionnaire
Date: _______ Participant ID: ________ (HPL Admin use only)
HUMAN PERFORMANCE LABORATORY PRE-STUDY QUESTIONNAIRE
This is a strictly confidential questionnaire. Only a randomly generated participant ID number, assigned by the research administrator, will be on this questionnaire. No information reported by you here will be traced back to you personally in any way. You can skip any questions you do not feel comfortable answering. Section 1: Demographics Gender: Male Female Age: ______ Race / Ethnicity: Black / African American Asian (check all that apply) Caucasian American Indian / Native Alaskan (question asked for reporting purposes) Hispanic / Latino Other Have you participated in a study at this laboratory in the past? Yes No Section 2: Driving History Approximately how old were you when you got your driver’s license? _____ Years _____ Months About how many miles did you drive in the past week? Less than 50 Less than 100 100-200 200-300 300-500 500 or more About how many miles did you drive in the past 12 months? Less than 5,000 5,000 to 10,000 10,001 to 15,000 15,001-20,000 More than 20,000 Do you usually wear glasses or contacts while driving? No Yes, glasses Yes, contacts Do you ever get motion sickness symptoms while driving or riding in a car? Yes No (If you respond Yes to this question, please bring it to the immediate attention of the experimenter.)
33 Using Simulation to Assess Conflicts Between Bicyclists and Right-Turning Vehicles
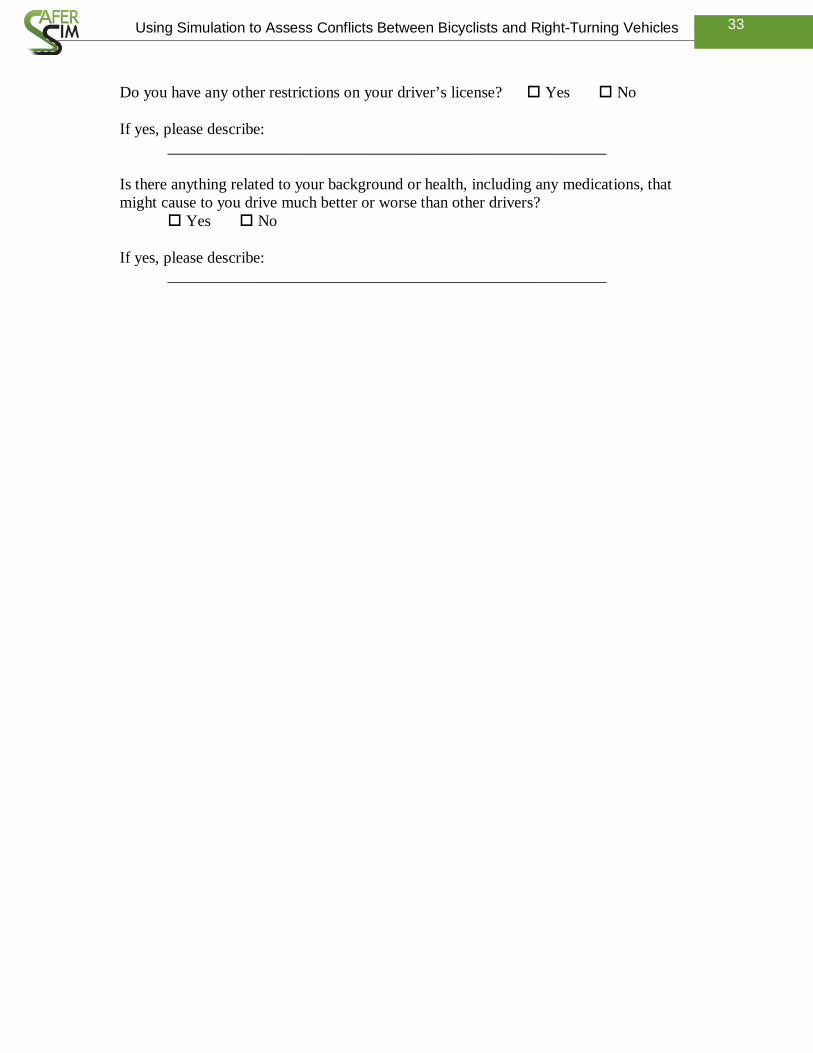
Do you have any other restrictions on your driver’s license? Yes No If yes, please describe:
_______________________________________________________ Is there anything related to your background or health, including any medications, that might cause to you drive much better or worse than other drivers? Yes No If yes, please describe:
_______________________________________________________

34 Using Simulation to Assess Conflicts Between Bicyclists and Right-Turning Vehicles
Appendix B: Post-Study Questionnaire
Date: _______ Participant ID: ________ (HPL Admin use only)
HUMAN PERFORMANCE LABORATORY POST-STUDY QUESTIONNAIRE
Cycling History Do you cycle for commuting purposes or for recreational purposes? Yes, for commuting only Yes, for recreation only Yes, both for commuting & recreation No If you answered No please skip the rest of this questionnaire. How often do you cycle? > 4 times a week 1-2 times a week 1-2 times a month If a cyclist, approximately how old were you when you started cycling? _____ Years _____ Months