using novel geospatial tools and approaches for identifying critical nutrient source - heyming
TRANSCRIPT
1
Using Geospatial Tools to Identify Critical Nutrient Source Areas and Agricultural BMP Implementation
Priorities
Presentation by: Louise HeymingGrand River Conservation Authority
Cambridge, Ontario, Canada

2
Project Objectives
1) Demonstrate how a high resolution digital elevation model (DEM) and advanced GIS techniques can be used to determine nutrient source areas
2) Demonstrate how the identified nutrient source areas can be used to target agricultural best management practices (BMPs)
3
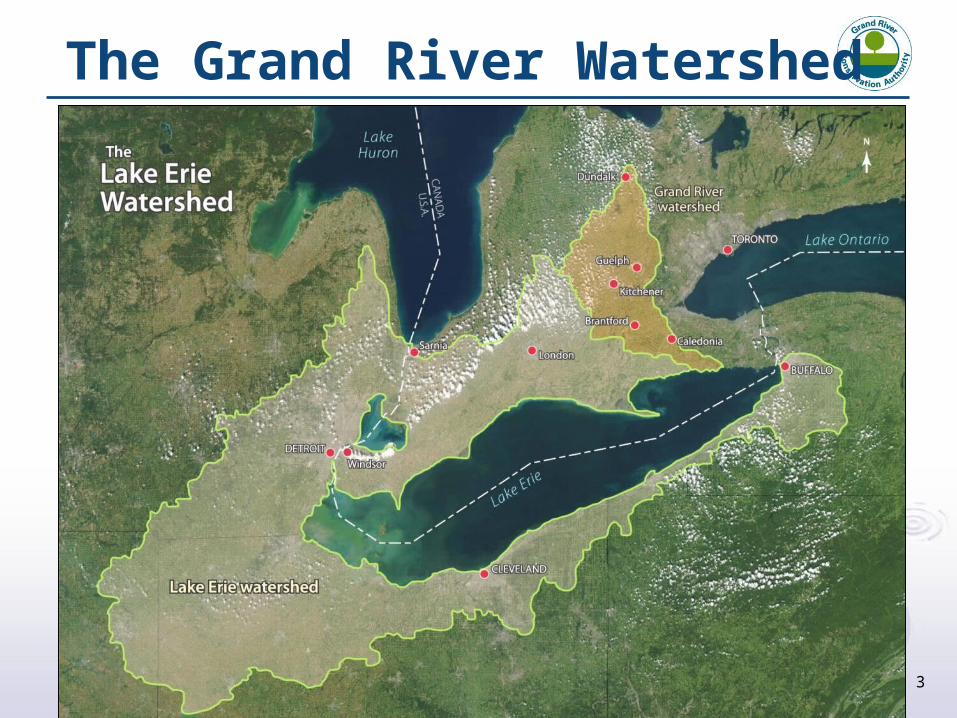
The Grand River Watershed

4
80 year history of water management planning
Shared responsibility
Successful collaboration
Building on existing data,knowledge and accomplishments
Finding practical ‘best value’ solutions
A long history of water management
2014
5
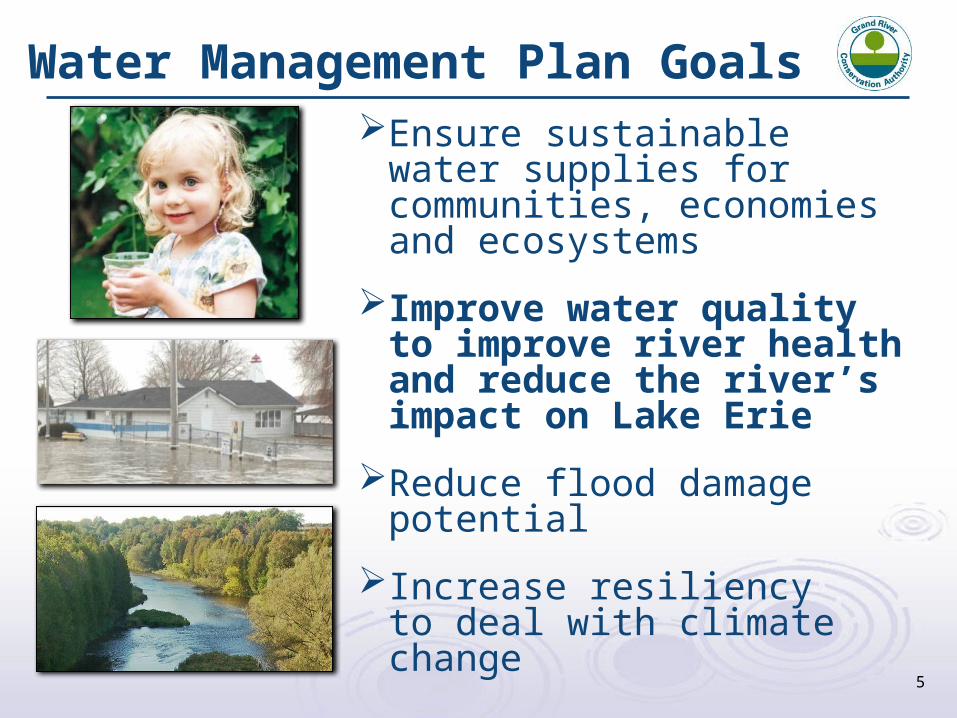
Water Management Plan GoalsEnsure sustainable water supplies
for communities, economiesand ecosystems
Improve water quality to improve river health and reduce the river’s impact on Lake Erie
Reduce flood damage potential
Increase resiliencyto deal with climate change
6
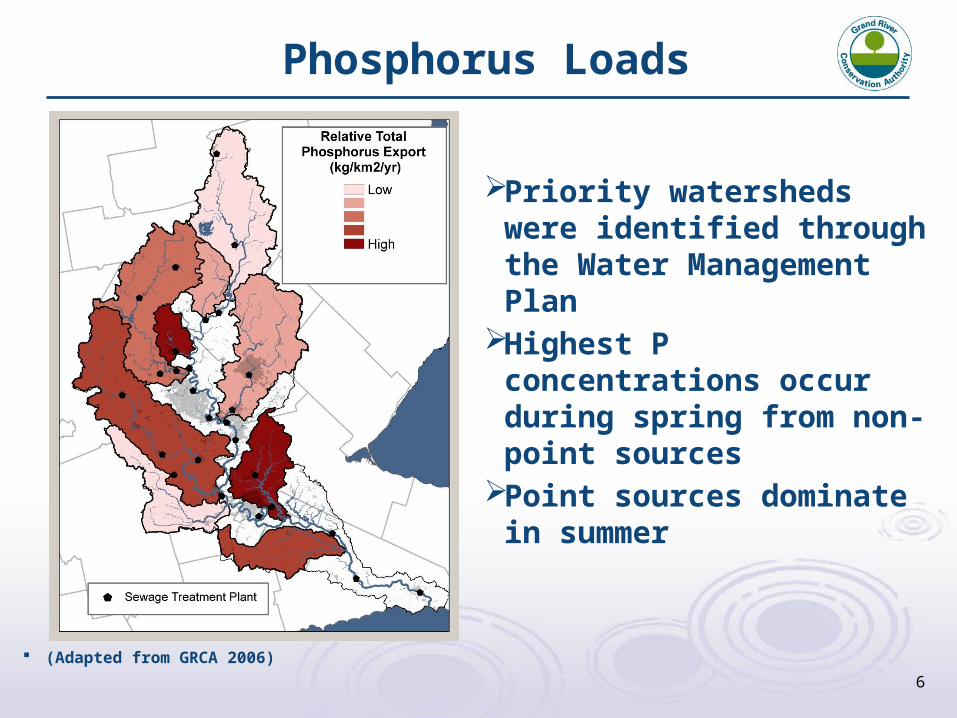
Phosphorus Loads
Priority watersheds were identified through the Water Management Plan
Highest P concentrations occur during spring from non-point sources
Point sources dominate in summer
(Adapted from GRCA 2006)
7
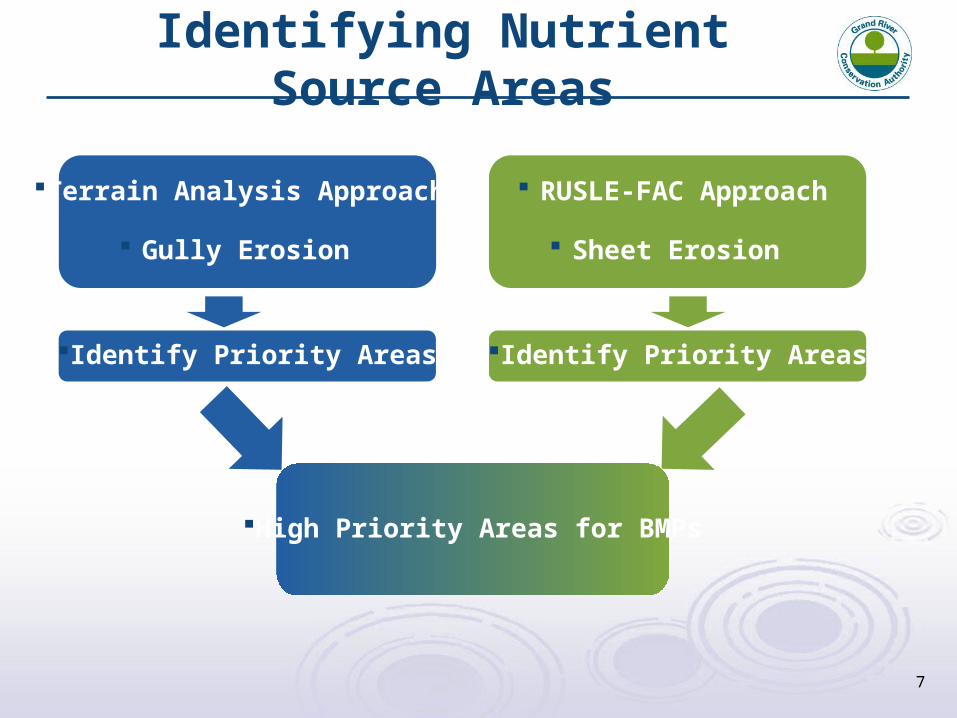
Identifying Nutrient Source Areas
Terrain Analysis Approach
Gully Erosion
RUSLE-FAC Approach
Sheet Erosion
Identify Priority Areas Identify Priority Areas
High Priority Areas for BMPs
8
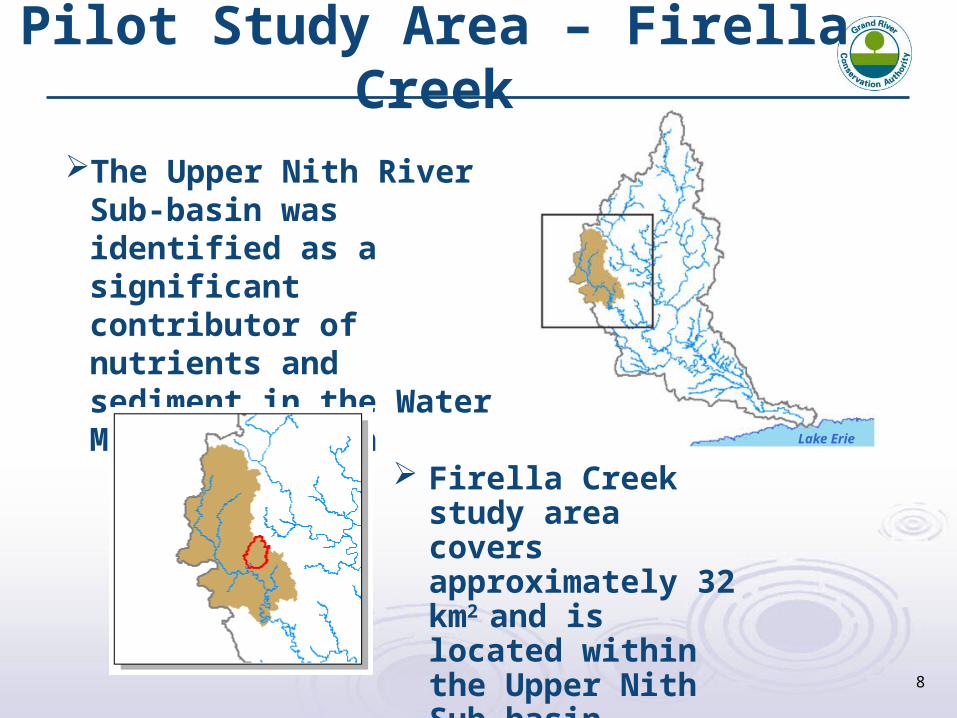
Pilot Study Area – Firella Creek
The Upper Nith River Sub-basin was identified as a significant contributor of nutrients and sediment in the Water Management Plan
Firella Creek study area covers approximately 32 km2 and is located within the Upper Nith Sub-basin
Lake Erie

9
DEM DevelopmentStereo Project Creation:Aerial Data
Scans Camera Files Orientation Files Control Files

10
DEM Development
Source: www.planar3d.com
Large Scale 3D Vector Hydrology Creation:

11
DEM DevelopmentPixel-Auto Correlation (PAC) Point Collection:

12
Final Firella Creek DEM

13
Terrain Analysis Approach
Digital Elevation Model
Slope Raster
Stream Power Index Raster
Flow Accumulation Raster
Stream Power Index measures the erosive power of flowing water, identifies areas of potential gully erosion
Approach adapted from (Galzki, Birr and Mulla 2011)

14
Terrain Analysis Approach
Stream Power Index (SPI)
High SPI values represent the likely overland flow paths during a storm event
– the potential gullies

15
Stream Power Index (SPI) Signatures
Terrain Analysis Approach
SPI Value Percentile
-0.540 75.00%
-0.079 80.00%
0.460 85.00%
1.135 90.00%
2.214 95.00%
A path of high SPI values that flow into
observed surface hydrology

16
Terrain Analysis Approach
Field VerificationSPI Signatures - 95th Percentile
Correctly Identified
Incorrect IdentificationFalse Positive Thick Vegetation Other
9/10 (90%) 0/10 (0%) 1/10 (10%) 0/10 (0%)
17
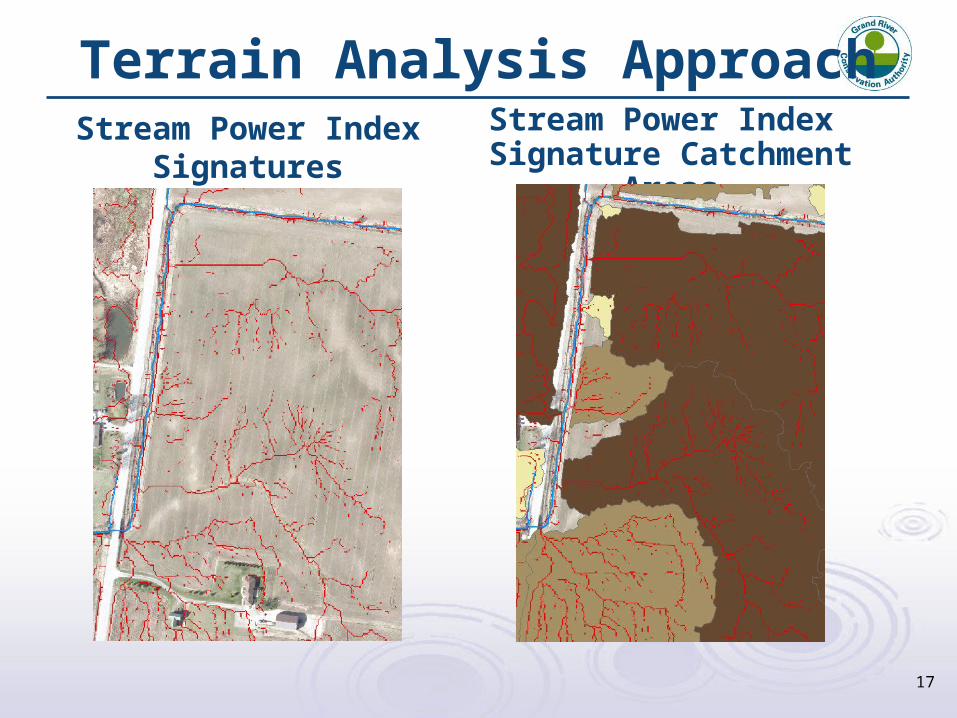
Terrain Analysis ApproachStream Power Index
Signatures
Stream Power Index Signature Catchment Areas

18
Priority Areas using Terrain Analysis
19
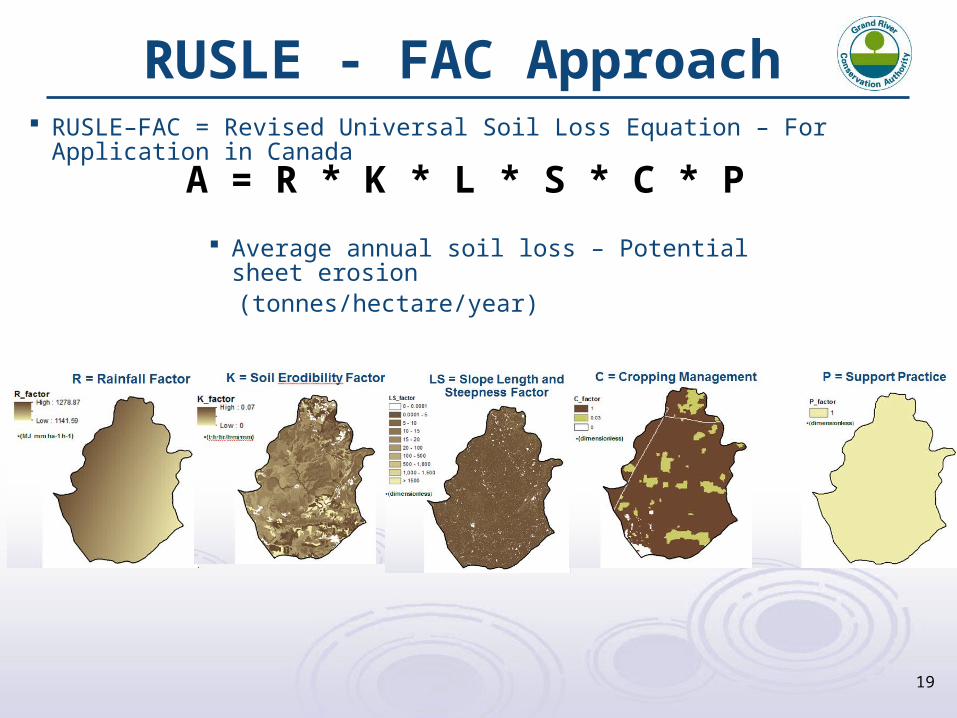
RUSLE - FAC Approach
A = R * K * L * S * C * P
Average annual soil loss – Potential sheet erosion (tonnes/hectare/year)
RUSLE–FAC = Revised Universal Soil Loss Equation – For Application in Canada
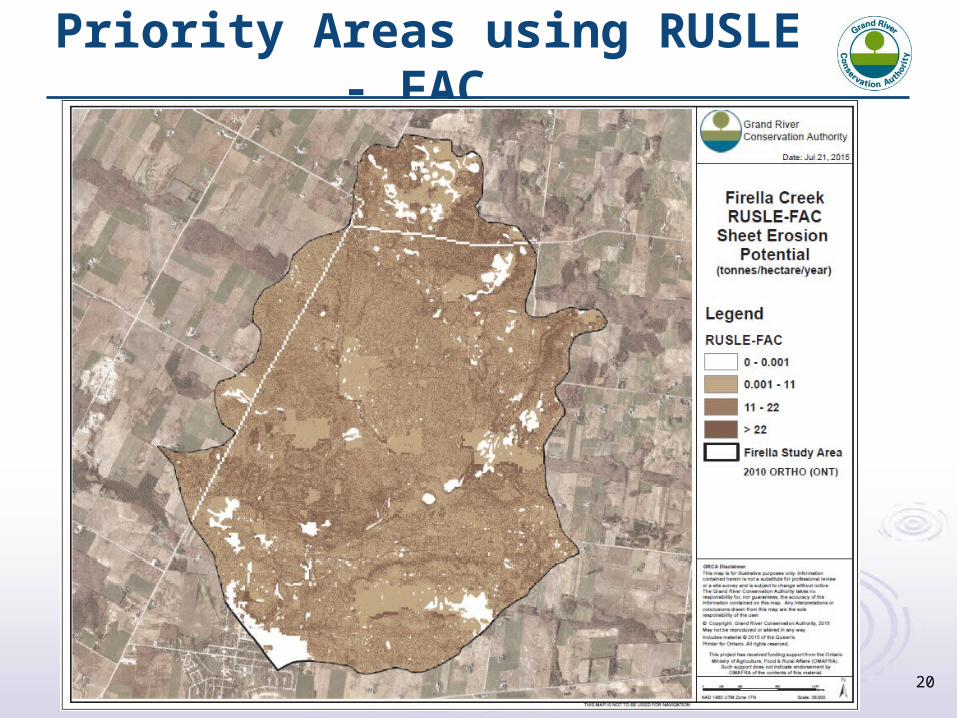
20
Priority Areas using RUSLE - FAC

21
Priority Nutrient Source Areas
Priority Nutrient Source Areas - High Values
SPI – High Catchments
RUSLE-FAC -High Values

22
Current Extension Program Approach
Technical assistance and financial incentives to all farmers
Work with those farmers who come forward (i.e. they know they have an erosion issue)
Financial incentives are offered for both structures and conservation practices
All erosion control projects are offered the same incentive structure
Photo: C. Heibert
23
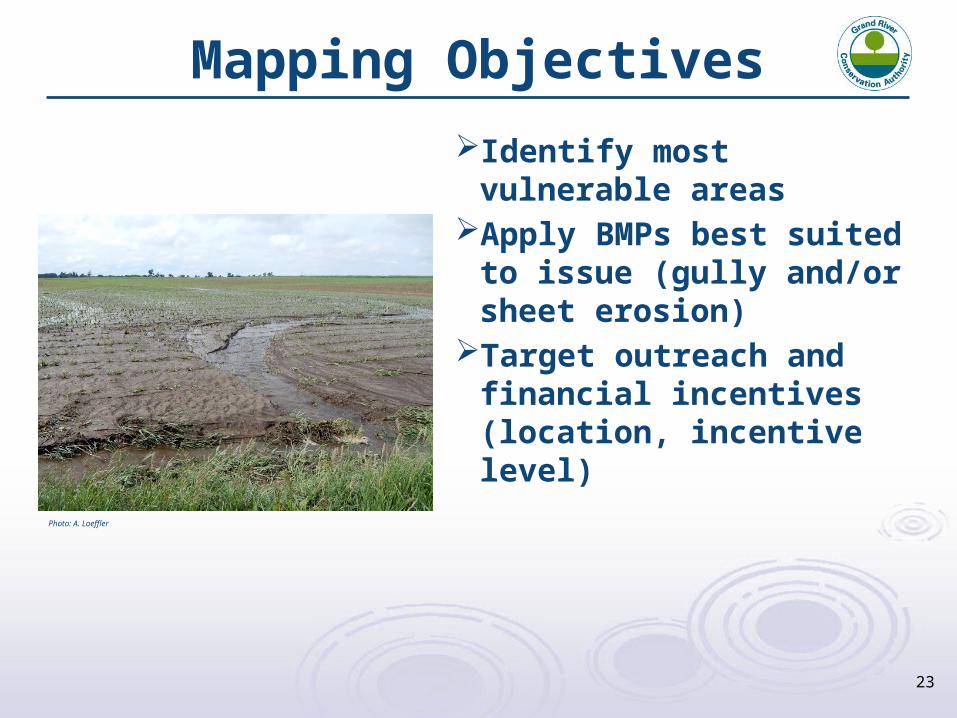
Mapping Objectives
Identify most vulnerable areas
Apply BMPs best suited to issue (gully and/or sheet erosion)
Target outreach and financial incentives (location, incentive level)
Photo: A. Loeffler
24
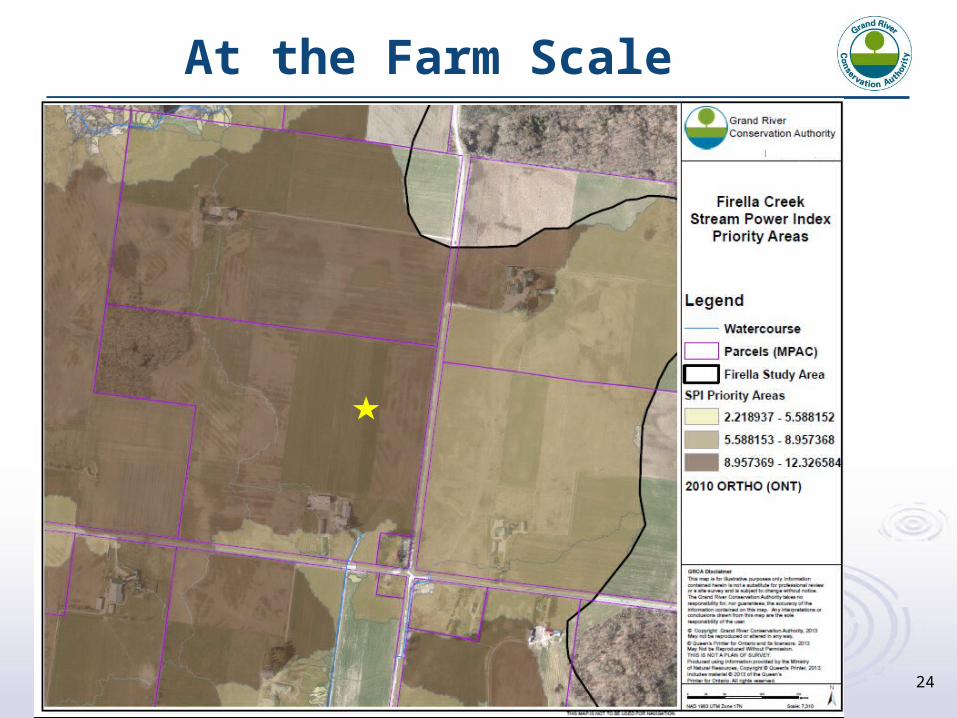
At the Farm Scale

25
At the Farm Scale

26
At the Farm Scale

27
Early Results
Increase in requests for technical assistance to design erosion control system
Requests for mapping outside our pilot study area
Photo: A. Loeffler

28
Future Applications
Internal CA use: Identify priority subwatersheds (best value
solutions) Connect issues to BMPs (structures vs
cropping practices) Identify potential water quality monitoring
sites.
Communication tool: Engage landowners to raise awareness.
Program delivery level: Tailor financial incentives to improve chances
of target farms participating.Erosion control structure design
DEM will help facilitate design work
Photo: L Heyming
29
Thank you
Ontario Ministry of the Environment & Climate Change
Grand River Conservation Authority
Ontario Ministry of Agriculture, Food & Rural Affairs
Regional Municipality of Waterloo
Agriculture & Agri-Food Canada
Environment Canada
This Project has received funding support from the Government of Ontario. Such support does not indicate endorsement by the Government of Ontario of the contents of this material.

30
ReferencesGalzki, J. C., et al. "Identifying critical agricultural areas with three-meter LiDAR elevation data for precision conservation." Journal of Soil and Water Conservation 66.6 (2011): 423-430.