using nhts to estimate activity patterns heather contrino, travel surveys team leader fhwa office of...
TRANSCRIPT
Using NHTS to Estimate Activity
Patterns
Heather Contrino, Travel Surveys Team LeaderFHWA Office of Highway Policy Information
Nancy McGuckin, Travel Behavior AnalystYuki Nakamoto, SAS Programmer Extraordinaire
Planning Applications Conference, 2007
Objectives
To explore the application of travel survey data for activity analysis and AB Model inputs: Fill data gaps for transportation planners, Provide guidance on key determinants of
travel, Support benchmarking and testing during
transition time from four-step to new generation, and
Assess trend behavior in use of time/activity
Data Steps…
1. Bridge the trip purpose codes and activity types using three categories: subsistence/mandatory, maintenance, and discretionary
2. Re-code the trip file into home-to-home tours3. Develop profiles of traveler types (developed
with CART) to look at time spent in each activity type, and time spent in travel for each activity type
4. Examine Trends in activity patterns using traveler profiles
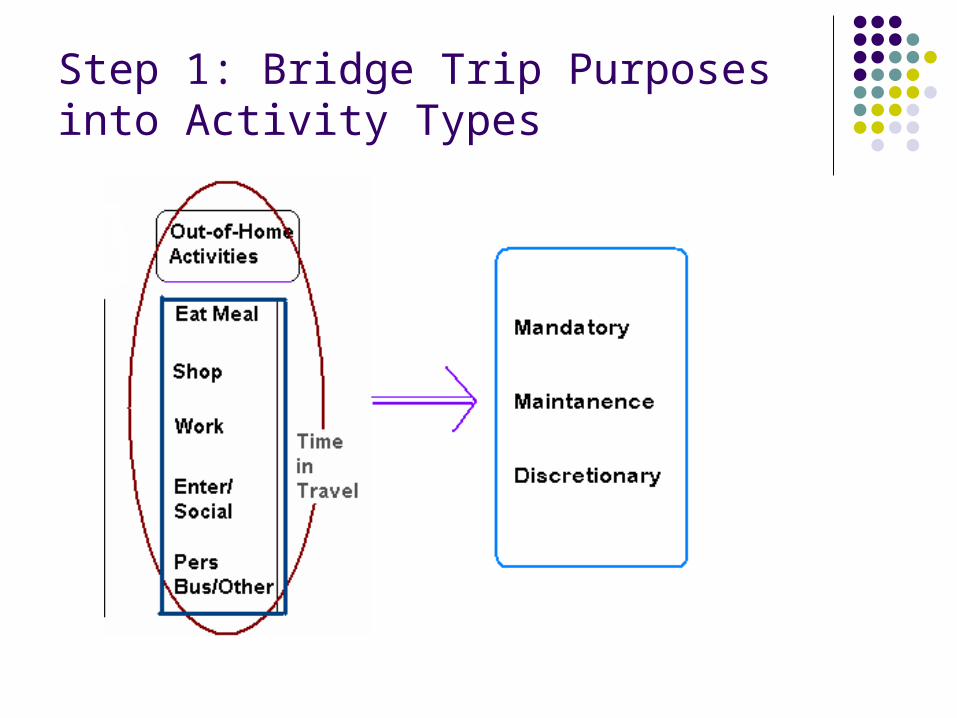
Step 1: Bridge Trip Purposes into Activity Types
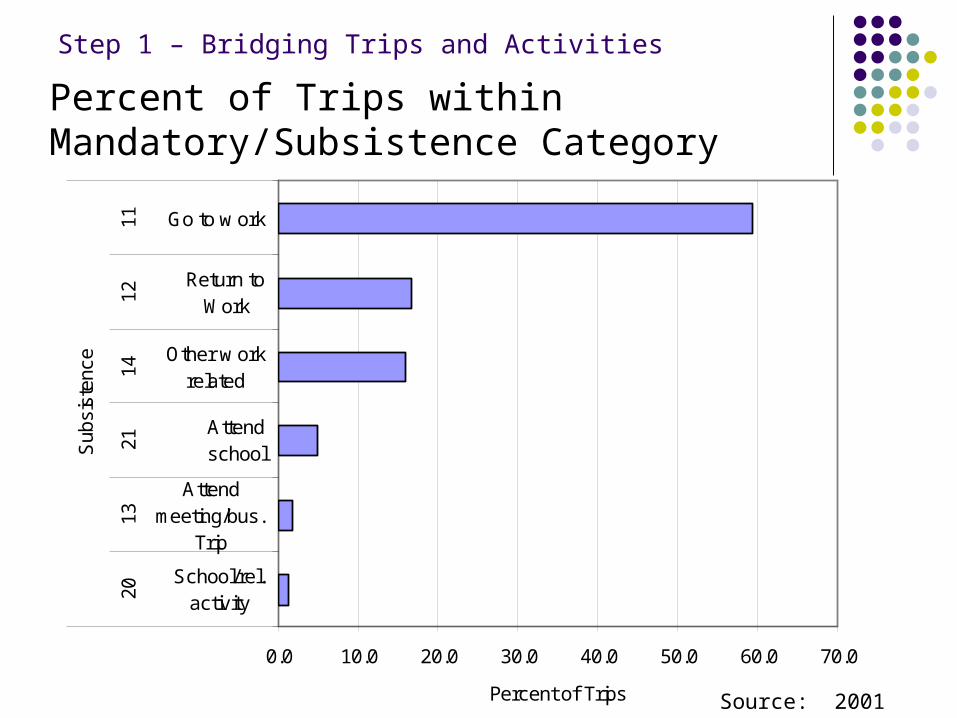
Percent of Trips within Mandatory/Subsistence Category
Step 1 – Bridging Trips and Activities
Source: 2001 NHTS
0.0 10.0 20.0 30.0 40.0 50.0 60.0 70.0
School/rel.activity
Attendmeeting/bus.
Trip
Attendschool
Other w orkrelated
Return toWork
Go to w ork
2013
2114
1211
Sub
sist
ence
Percent of Trips
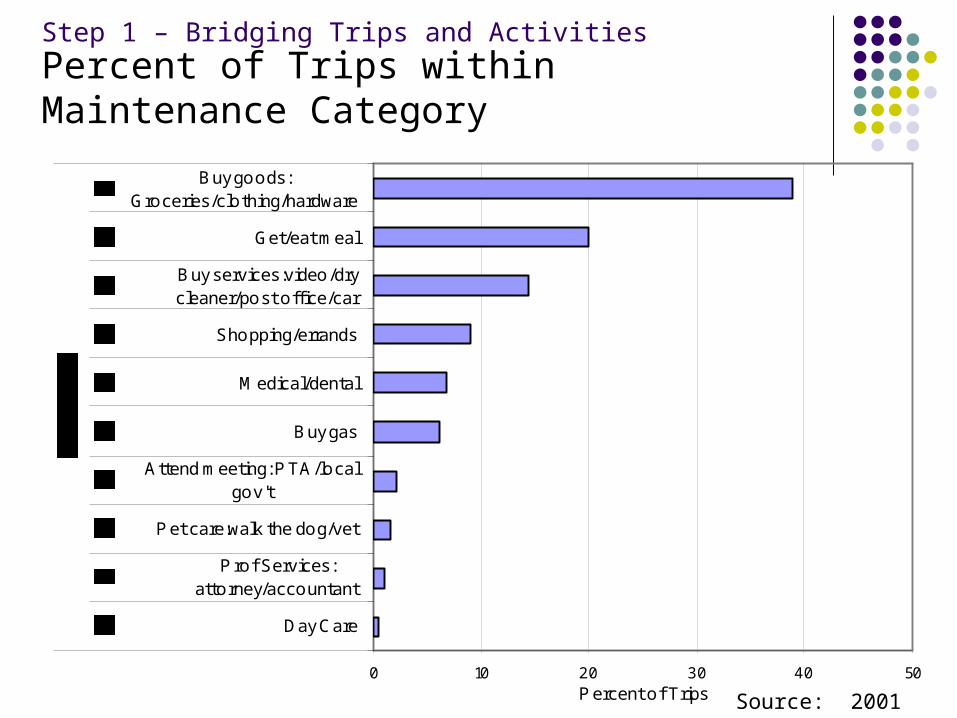
Step 1 – Bridging Trips and ActivitiesPercent of Trips within Maintenance Category
Source: 2001 NHTS
0 10 20 30 40 50
Day Care
P rof Services:attorney/accountant
P et care:walk the dog/vet
Attend meeting: P TA/localgov't
Buy gas
Medical/dental
Shopping/errands
Buy services:video/drycleaner/post office/car
Get/eat meal
Buy goods:Groceries/clothing/hardware
P ercent of Trips
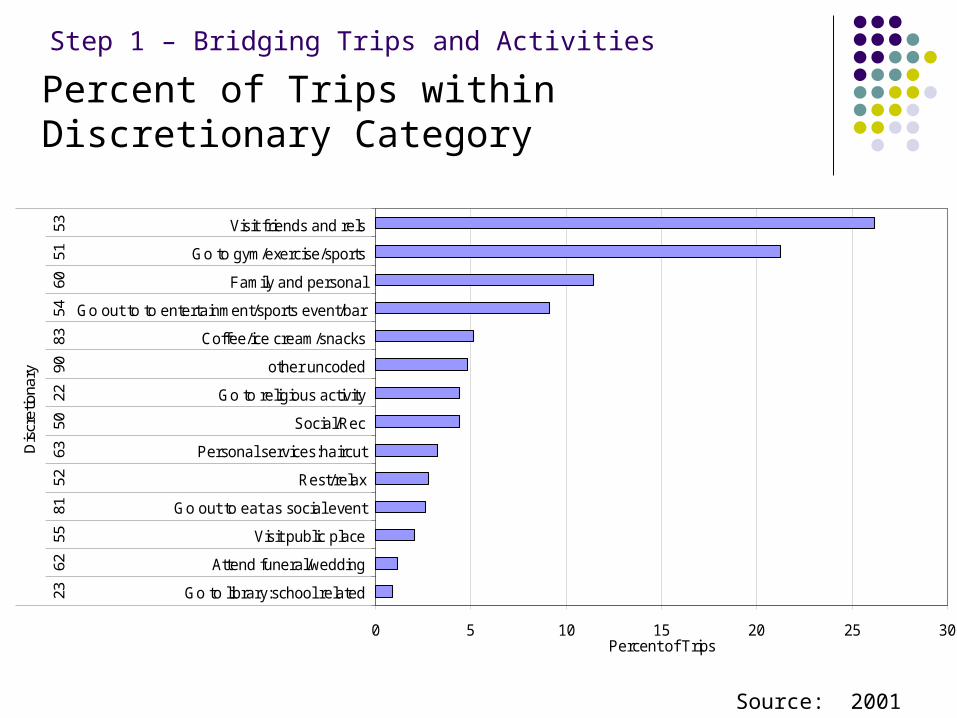
0 5 10 15 20 25 30
Go to library:school related
Attend funeral/wedding
Visit public place
Go out to eat as social event
Rest/relax
Personal services:haircut
Social/Rec
Go to religious activity
other uncoded
Coffee/ice cream/snacks
Go out to to entertainment/sports event/bar
Family and personal
Go to gym/exercise/sports
Visit friends and rels
2362
5581
5263
5022
9083
5460
5153
Dis
cret
iona
ry
Percent of Trips
Step 1 – Bridging Trips and Activities
Percent of Trips within Discretionary Category
Source: 2001 NHTS
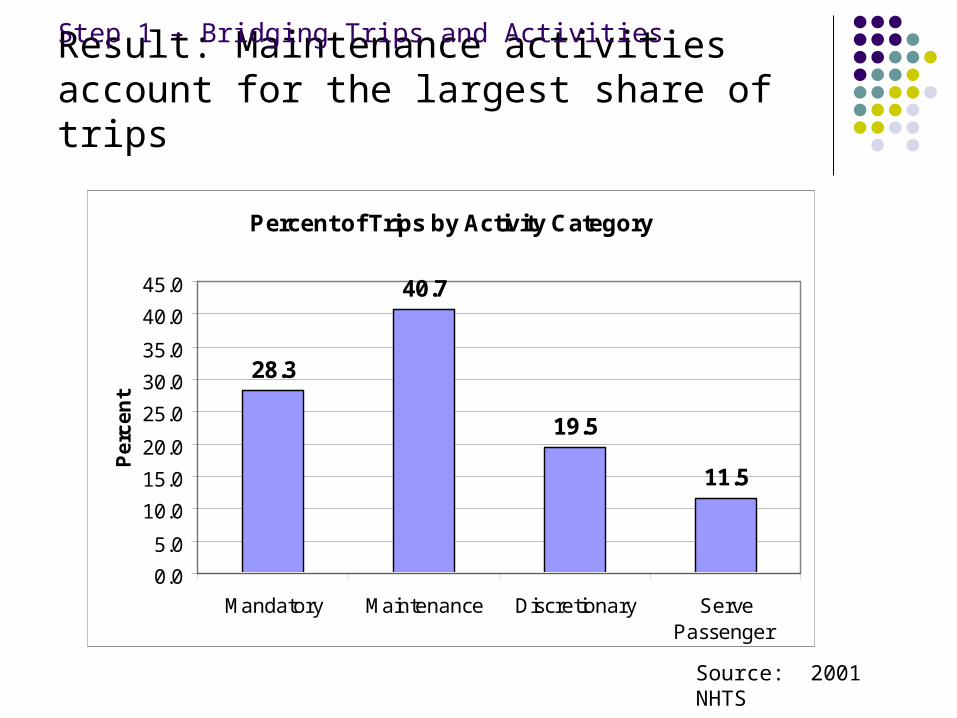
Percent of Trips by Activity Category
28.3
40.7
19.5
11.5
0.0
5.0
10.0
15.0
20.0
25.0
30.0
35.0
40.0
45.0
Mandatory Maintenance Discretionary ServePassenger
Pe
rce
nt
Result: Maintenance activities account for the largest share of trips
Step 1 – Bridging Trips and Activities
Source: 2001 NHTS
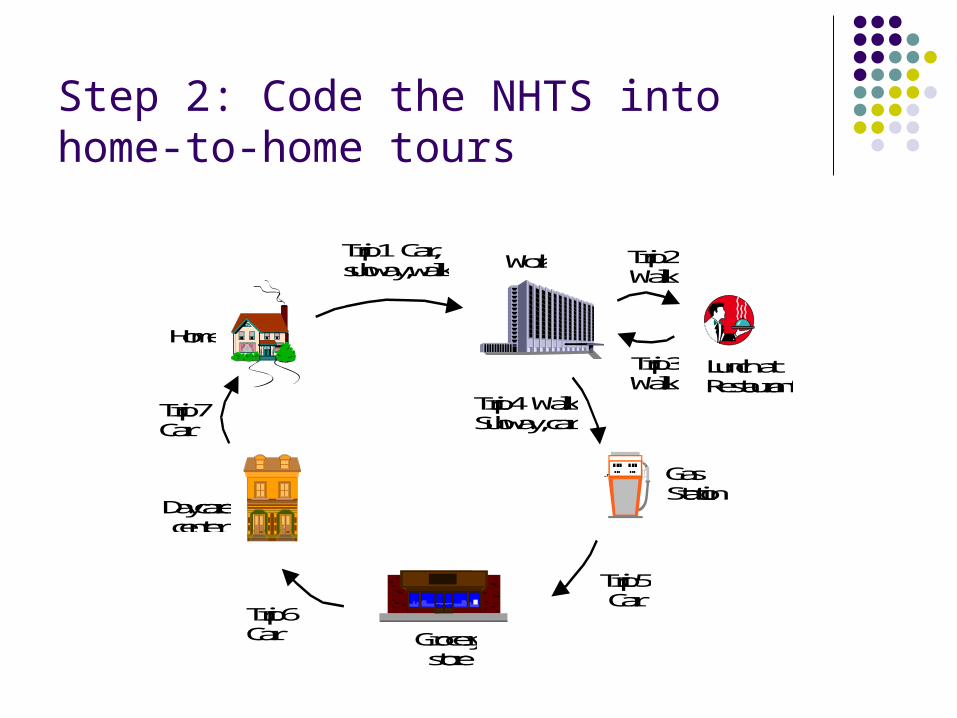
Step 2: Code the NHTS into home-to-home tours
Trip 2 Walk
Work
Home
Trip 3 Walk
Lunch at Restaurant
Trip 4 Walk Subway, car
Trip 6 Car
Trip 7 Car
Grocery store
Daycare center
Trip 1 Car, subway, walk
Gas Station
Trip 5 Car
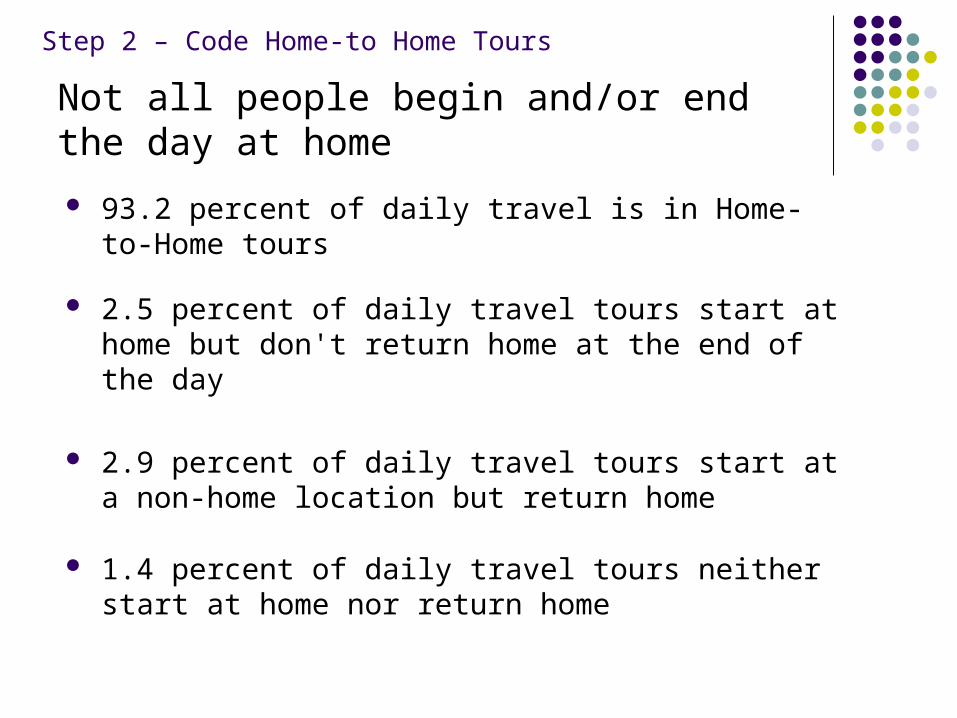
93.2 percent of daily travel is in Home-to-Home tours
2.5 percent of daily travel tours start at home but don't return home at the end of the day
2.9 percent of daily travel tours start at a non-home location but return home
1.4 percent of daily travel tours neither start at home nor return home
Step 2 – Code Home-to Home Tours
Not all people begin and/or end the day at home
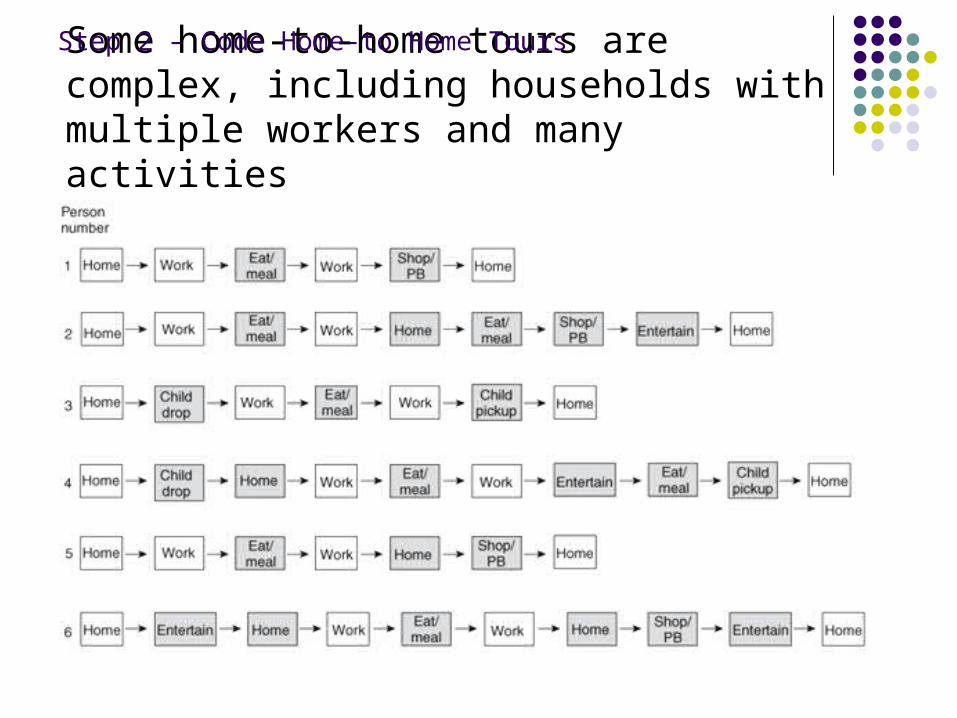
Some home-to-home tours are complex, including households with multiple workers and many activities
Step 2 – Code Home-to Home Tours
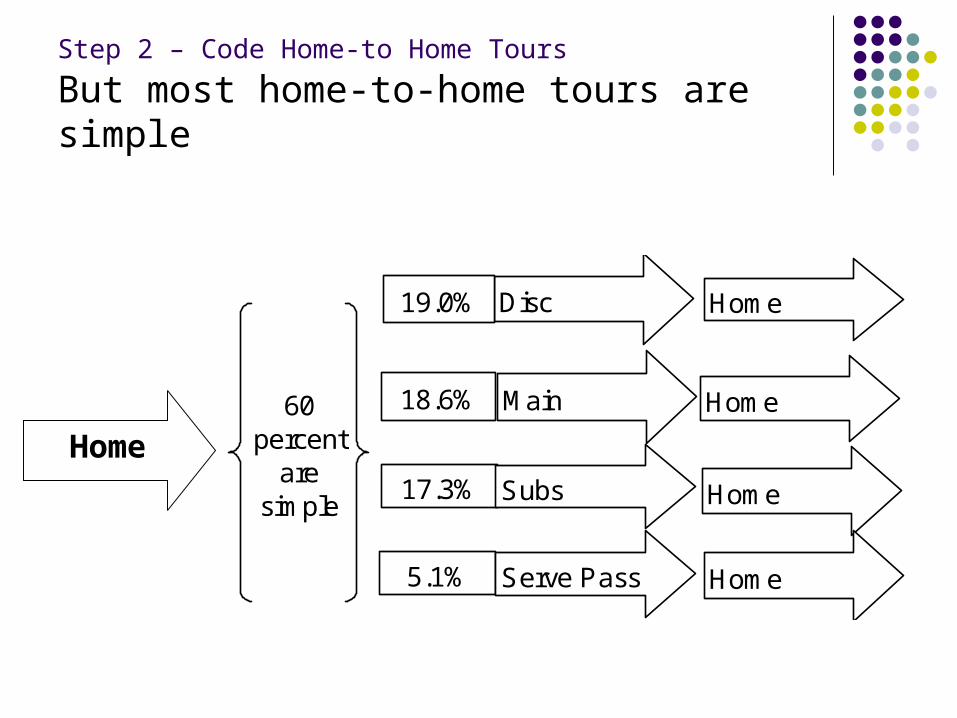
Disc Home
Main
19.0%
18.6% Home
17.3% Subs Home
60 percent
are simple
5.1% Serve Pass Home
Home
But most home-to-home tours are simple
Step 2 – Code Home-to Home Tours
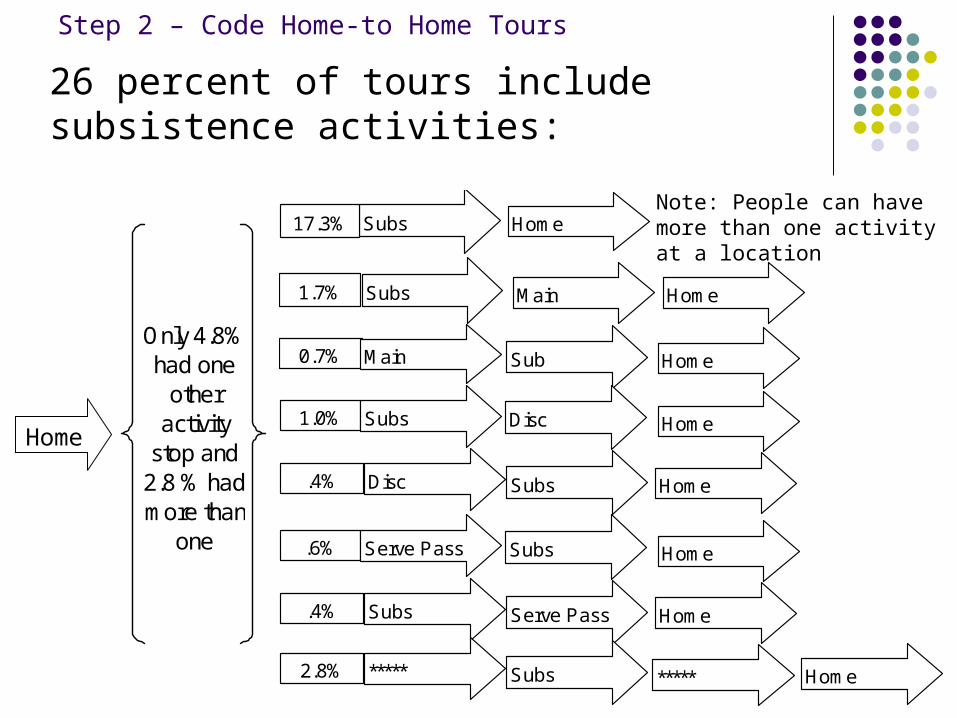
Subs Home
Subs
17.3%
1.7% Home
0.7% Main Sub
1.0% Subs Disc
Main
Home
Home
.4% Disc Subs Home
.6% Serve Pass Subs Home
.4% Subs Serve Pass Home
2.8% ***** Subs ***** Home
Only 4.8% had one
other activity
stop and 2.8 % had more than
one
Note: People can have more than one activity at a location
Home
26 percent of tours include subsistence activities:
Step 2 – Code Home-to Home Tours

Step 3: Develop Traveler Profiles
Start with characteristics that determine travel from CART (Cluster Analysis Regression Tree), e.g.:
Worker status Vehicle Availability Presence of Children (we used ‘dependants’ who do not
drive) Sex
Then run the number of activities, time in activities, travel time, total out-of-home time, etc by these profile demographics
Then do it for 1995 and look to see if any trends emerge
Look for the groupings that define population segments for activity analysis:
Step 3 – Develop Traveler Profiles
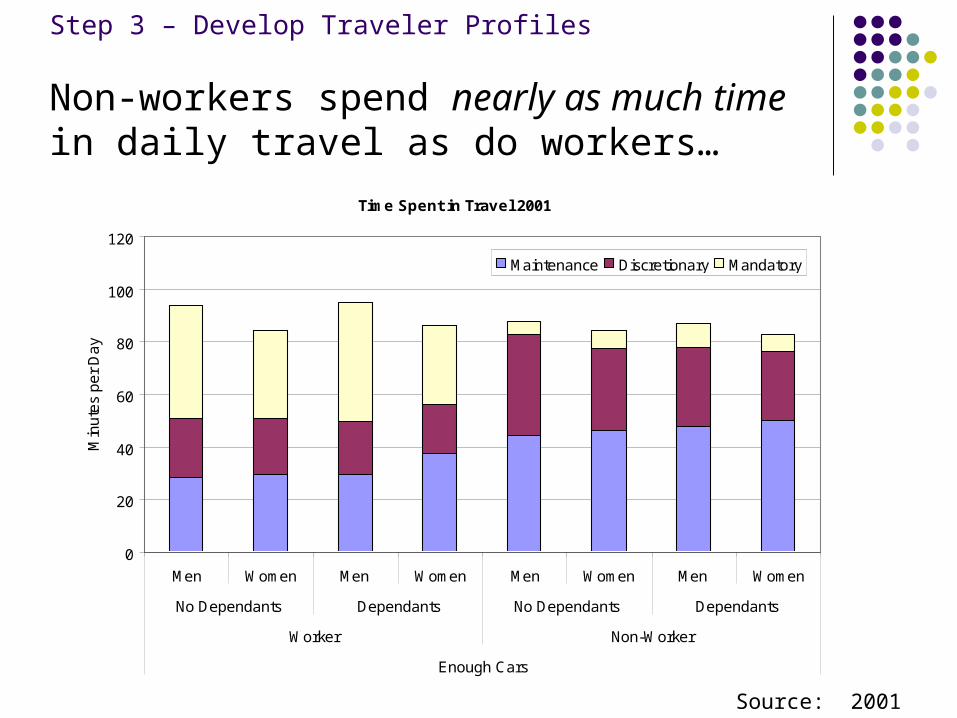
Worker status showed greatest difference in time spent in activities out-of-home: Workers spend more time out-of-home and less time
in maintenance and discretionary activities Non-workers spend nearly as much time in daily
travel as do workers. Less work may not equal less travel
Presence of dependants/children effected both working and non-working women’s time in maintenance activities
Early Findings
Step 3 – Develop Traveler Profiles
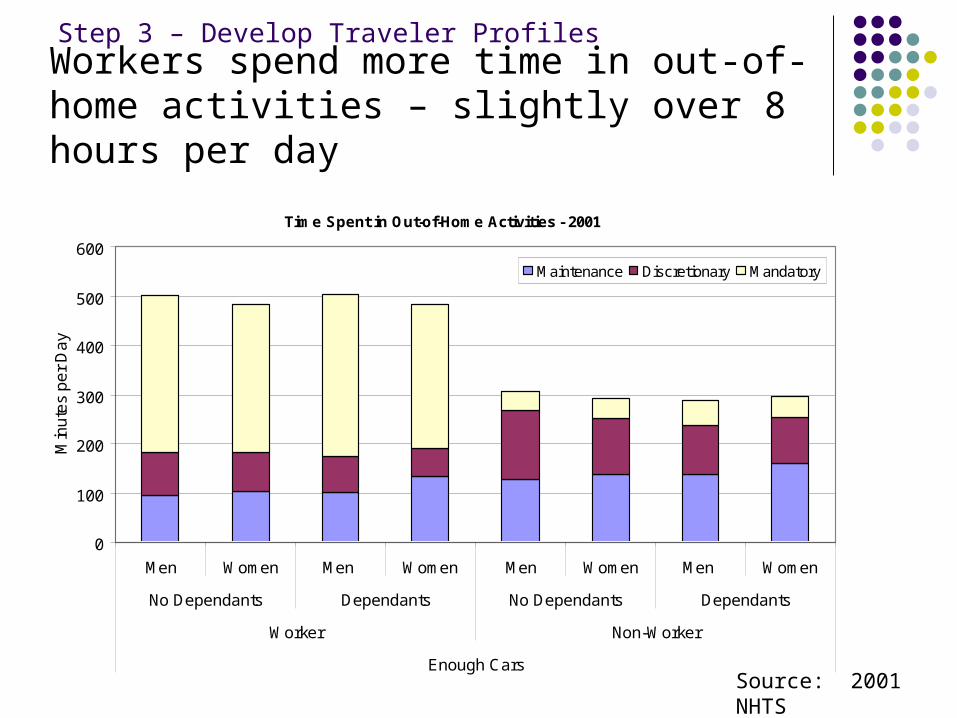
Time Spent in Out-of-Home Activities - 2001
0
100
200
300
400
500
600
Men Women Men Women Men Women Men Women
No Dependants Dependants No Dependants Dependants
Worker Non-Worker
Enough Cars
Min
ute
s p
er
Da
y
Maintenance Discretionary Mandatory
Workers spend more time in out-of-home activities – slightly over 8 hours per day
Step 3 – Develop Traveler Profiles
Source: 2001 NHTS

Time Spent in Out-of-Home Activities - 2001
0
100
200
300
400
500
600
Men Women Men Women Men Women Men * Women
No Dependants Dependants No Dependants Dependants
Worker Non-Worker
Not Enough Cars
Min
utes
per
Day
Maintenance Discretionary Mandatory
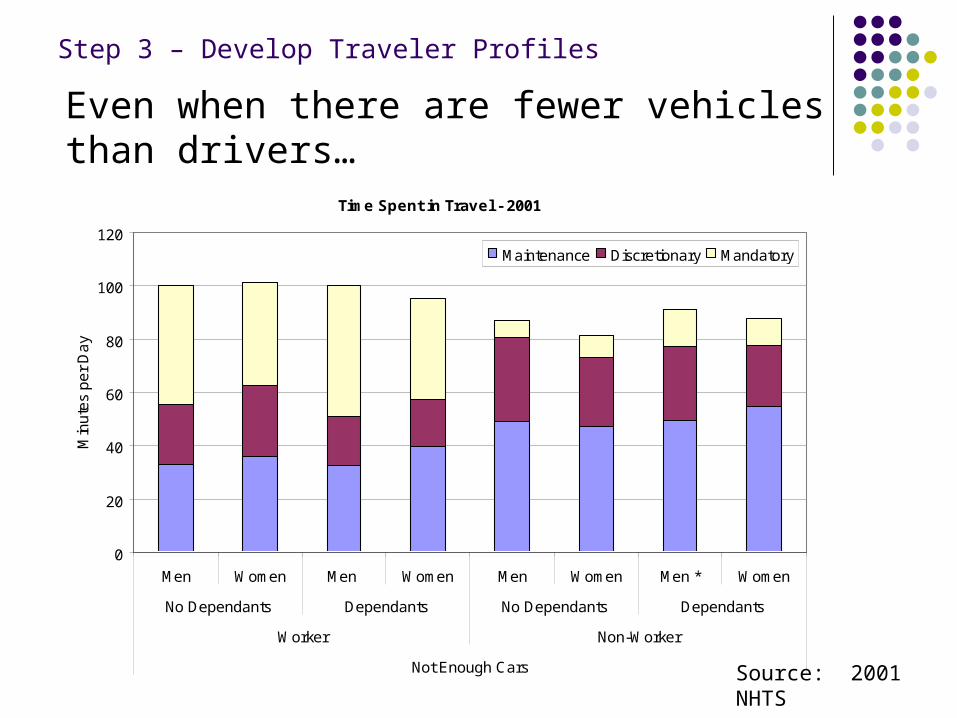
This is true even if there are fewer vehicles than drivers…
Source: 2001 NHTS
Step 3 – Develop Traveler Profiles
Time Spent in Travel 2001
0
20
40
60
80
100
120
Men Women Men Women Men Women Men Women
No Dependants Dependants No Dependants Dependants
Worker Non-Worker
Enough Cars
Min
ute
s p
er
Da
y
Maintenance Discretionary Mandatory
Source: 2001 NHTS
Non-workers spend nearly as much time in daily travel as do workers…
Step 3 – Develop Traveler Profiles
Time Spent in Travel - 2001
0
20
40
60
80
100
120
Men Women Men Women Men Women Men * Women
No Dependants Dependants No Dependants Dependants
Worker Non-Worker
Not Enough Cars
Min
ute
s p
er
Da
y
Maintenance Discretionary Mandatory
Source: 2001 NHTS
Even when there are fewer vehicles than drivers…
Step 3 – Develop Traveler Profiles
What are the Trends in Activity Patterns?
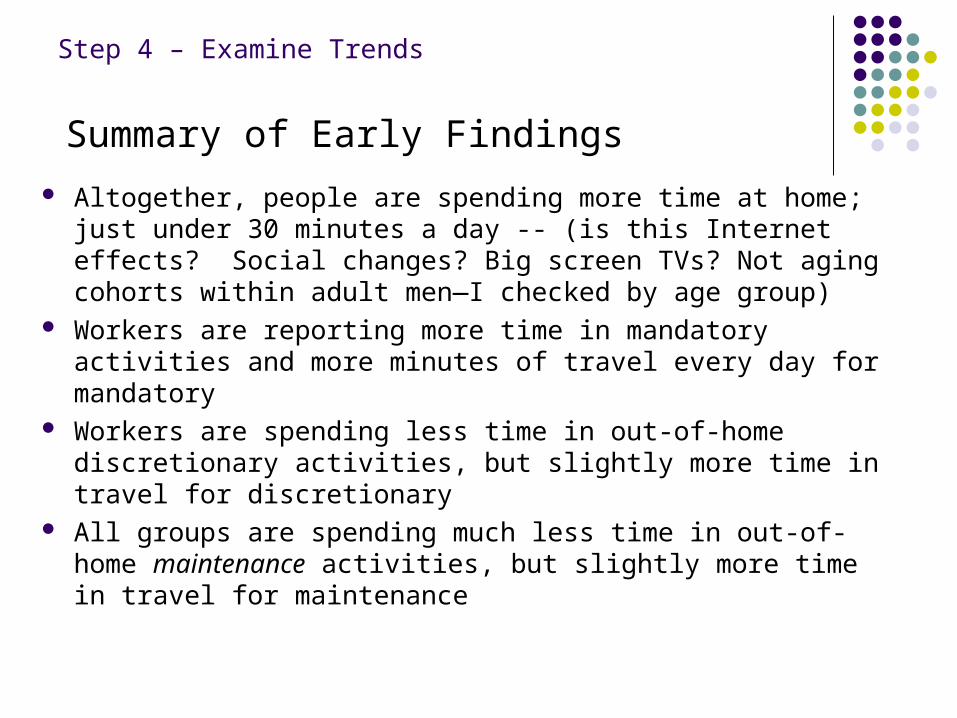
Altogether, people are spending more time at home; just under 30 minutes a day -- (is this Internet effects? Social changes? Big screen TVs? Not aging cohorts within adult men—I checked by age group)
Workers are reporting more time in mandatory activities and more minutes of travel every day for mandatory
Workers are spending less time in out-of-home discretionary activities, but slightly more time in travel for discretionary
All groups are spending much less time in out-of-home maintenance activities, but slightly more time in travel for maintenance
Summary of Early Findings
Step 4 – Examine Trends
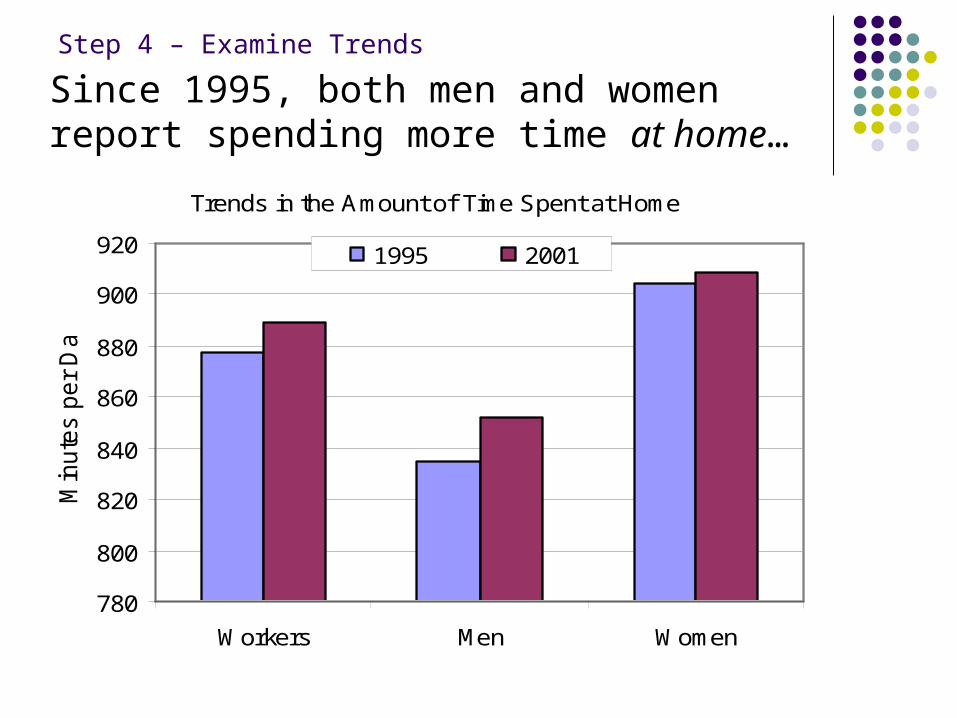
Since 1995, both men and women report spending more time at home…
Trends in the Amount of Time Spent at Home
780
800
820
840
860
880
900
920
Workers Men Women
Min
ute
s p
er
Day
1995 2001
Step 4 – Examine Trends
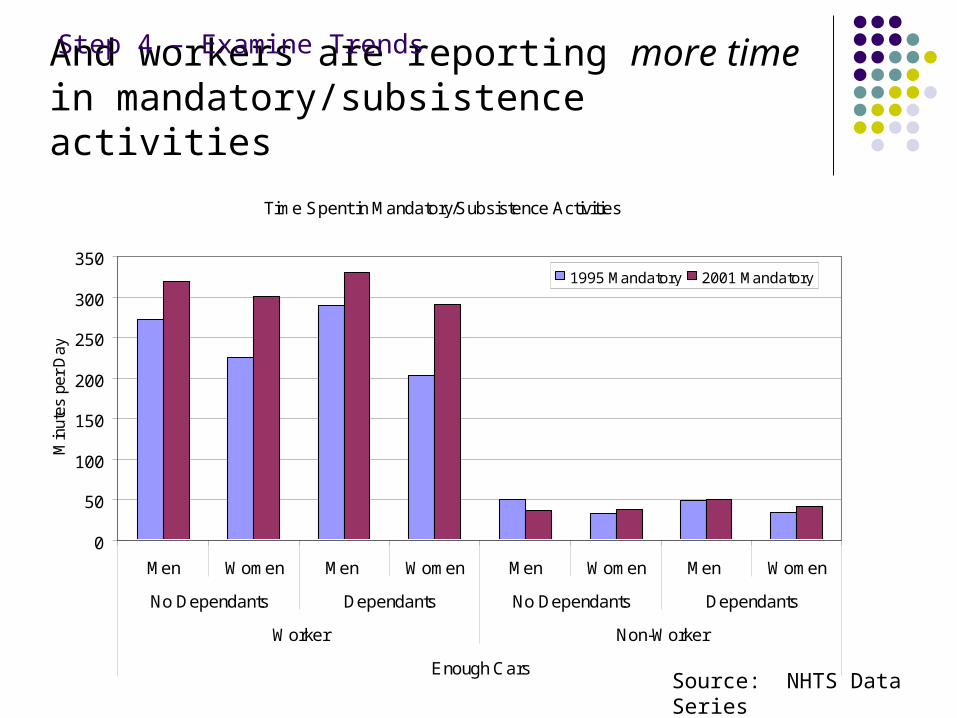
Time Spent in Mandatory/Subsistence Activities
0
50
100
150
200
250
300
350
Men Women Men Women Men Women Men Women
No Dependants Dependants No Dependants Dependants
Worker Non-Worker
Enough Cars
Min
utes
per
Day
1995 Mandatory 2001 Mandatory
Source: NHTS Data Series
And workers are reporting more time in mandatory/subsistence activities
Step 4 – Examine Trends
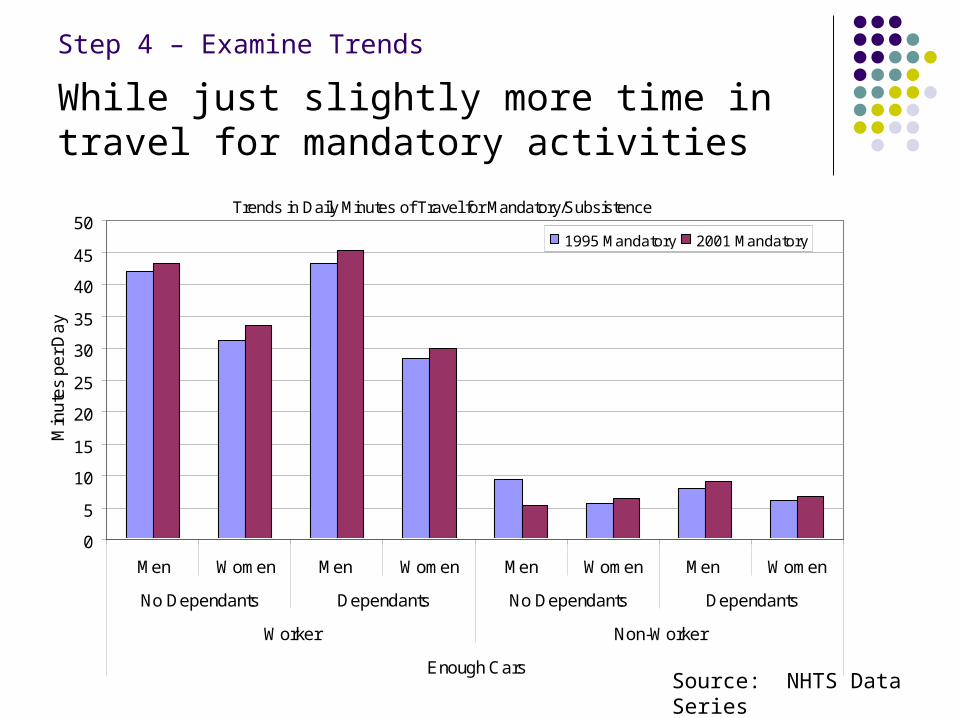
Trends in Daily Minutes of Travel for Mandatory/Subsistence
0
5
10
15
20
25
30
35
40
45
50
Men Women Men Women Men Women Men Women
No Dependants Dependants No Dependants Dependants
Worker Non-Worker
Enough Cars
Min
ute
s p
er
Da
y
1995 Mandatory 2001 Mandatory
Source: NHTS Data Series
While just slightly more time in travel for mandatory activities
Step 4 – Examine Trends
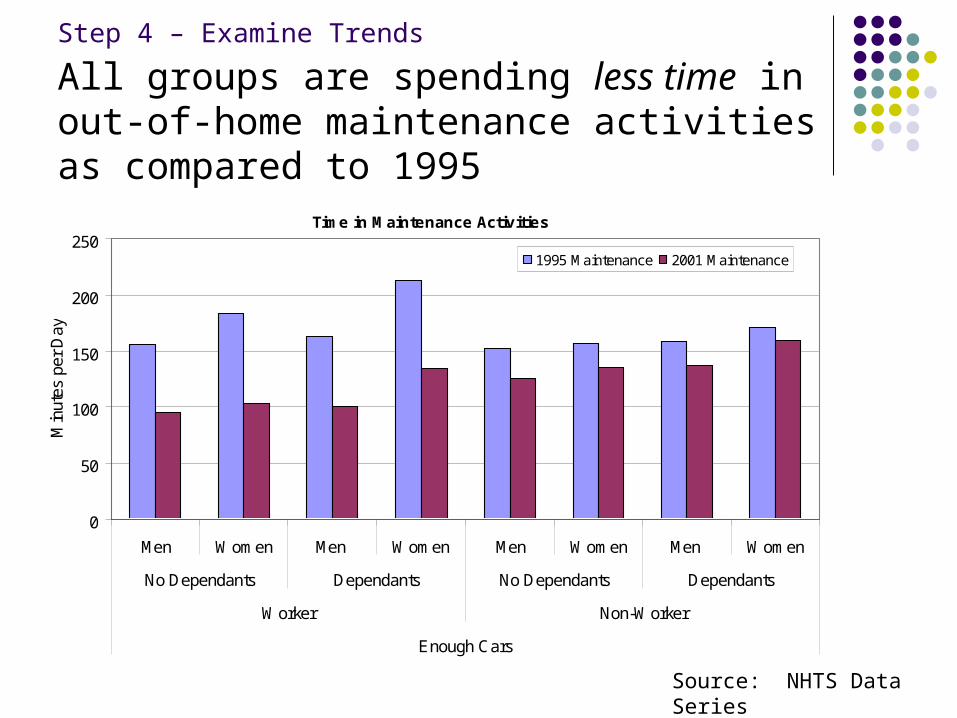
Time in Maintenance Activities
0
50
100
150
200
250
Men Women Men Women Men Women Men Women
No Dependants Dependants No Dependants Dependants
Worker Non-Worker
Enough Cars
Min
utes
per
Day
1995 Maintenance 2001 Maintenance
All groups are spending less time in out-of-home maintenance activities as compared to 1995
Step 4 – Examine Trends
Source: NHTS Data Series

Trends in Daily Minutes of Travel for Maintenance
0
10
20
30
40
50
60
Men Women Men Women Men Women Men Women
No Dependants Dependants No Dependants Dependants
Worker Non-Worker
Enough Cars
Min
utes
per
Day
1995 Maintenance 2001 Maintenance
And slightly more time in travel for out-of-home maintenance activities…
Source: NHTS Data Series
Step 4 – Examine Trends
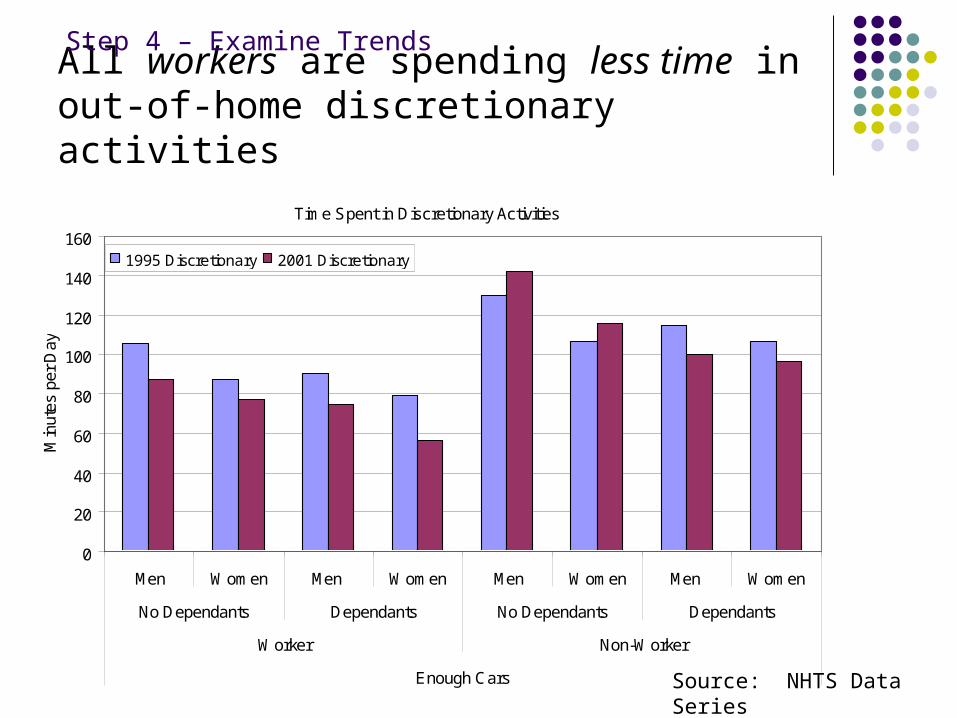
Time Spent in Discretionary Activities
0
20
40
60
80
100
120
140
160
Men Women Men Women Men Women Men Women
No Dependants Dependants No Dependants Dependants
Worker Non-Worker
Enough Cars
Min
utes
per
Day
1995 Discretionary 2001 Discretionary
Source: NHTS Data Series
All workers are spending less time in out-of-home discretionary activities
Step 4 – Examine Trends

Trends in Daily Minutes of Travel for Discretionary
0
5
10
15
20
25
30
35
40
45
Men Women Men Women Men Women Men Women
No Dependants Dependants No Dependants Dependants
Worker Non-Worker
Enough Cars
Min
utes
per
day
1995 Discretionary 2001 Discretionary
But all groups are spending more time in travel for discretionary activities
Source: NHTS Data Series
Step 4 – Examine Trends
Summary Overall, most tours are simple Workers and non-workers have similar daily amounts of
time in travel (is there a minimum threshold to ‘travel time budgets’?)
Non-workers travel more and spend more time in Maintenance and Discretionary activities
Less time constraint ≠ less travel
As baby-boomers retire will they travel more for maintenance and discretionary activities?
Trends show workers spending less time in maintenance if people are substituting/multi-tasking at work then let’s not
just focus on substitution ‘at-home’
Further Analysis Look at the complexity of tours/activity patterns related to
urban area size Are simple tours less likely in large metro areas?
Look at shared activities/shared rideStill haven’t untangles inter-household interaction/decision making aspectAuto constraint of less cars than drivers didn’t show much difference in behavior
Suggestion: try to separate shopping more precisely into maintenance or discretionary
Suggestion: better data on work-at-home and at-work multi-tasking
Other suggestions on data gaps?
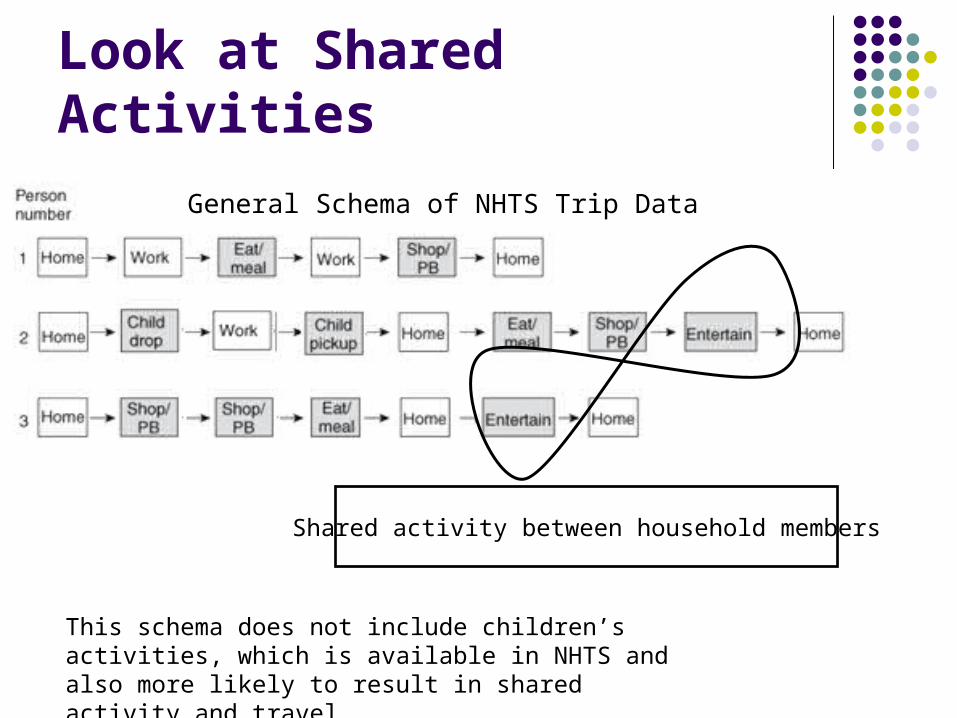
Shared activity between household members
This schema does not include children’s activities, which is available in NHTS and also more likely to result in shared activity and travel
General Schema of NHTS Trip Data
Look at Shared Activities
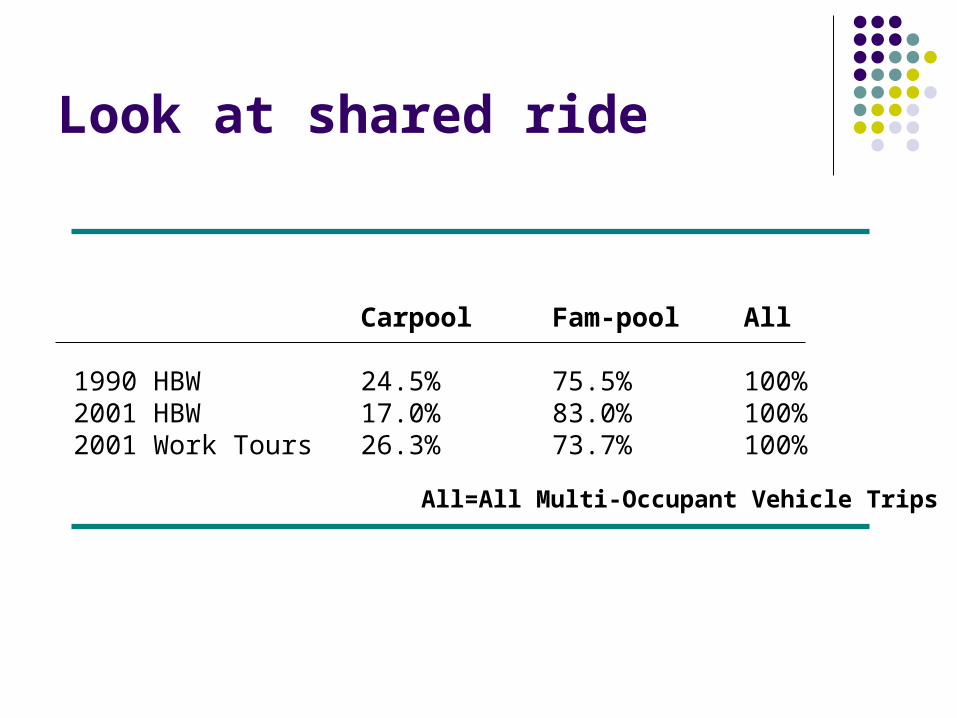
Look at shared ride
Carpool Fam-pool All
1990 HBW 24.5% 75.5% 100%2001 HBW 17.0% 83.0% 100%2001 Work Tours 26.3% 73.7% 100%
All=All Multi-Occupant Vehicle Trips