using nasa resources to inform climate and land …€¦ · using nasa resources to inform climate...
TRANSCRIPT
Using NASA Resources to Inform Climate and Land Use Adaptation
Ecological Forecasting, Vulnerability Assessment, and Evaluation of Management Options Across Two US DOI
Landscape Conservation CooperativesProject Overview - August 2011
LCC-VPLandscape Climate Change Vulnerability Project
2 LCC Vulnerability Project
Using NASA Resources to Inform Climate and Land Use AdaptationEcological Forecasting, Vulnerability Assessment, and Evaluation of Management Options Across Two US DOI Landscape Conservation Cooperatives
Project Overview (August 2011)
Project Science TeamAndrew J. Hansen, Montana State University, Bozeman, MT 59717Scott Goetz, Woods Hole Research CenterForrest Melton California State University, Monterey Bay / NASA AmesResearch CenterBill Monahan, National Park Service Inventory and Monitoring ProgramRamakrishna Nemani, NASA Ames Research CenterTom Olliff , Great Northern Landscape Conservation CooperativeDavid Theobald, Colorado State UniversityJohn Gross, National Park Service Inventory and Monitoring Program
CollaboratorsMike Britten, NPS I&M Rocky Mountain NetworkJim Comiskey, NPS I&M Mid-Atlantic NetworkKeith Langdon, Great Smoky Mountain National Park I&M CoordinatorMatt Marshall, NPS I&M Eastern Rivers and Mountains NetworkJim Schaberl, Shenandoah National Park
Supported by NASA Applied Sciences Program, National Park Service Inventory and Monitor-ing Program, and Great Northern Landscape Conservation Cooperative Project Period: August 2011 – July 2015
Cover photographs: Whitebark pine in Yellowstone National Park. Whitebark pine is a keystone species but is threat-ened throughout much of its range by blister rust and mountain pine beetle. These threats appear to be strongly exacer-bated by rapid climate change. Photographs from: Greater Yellowstone Learning Center http://www.greateryellowstone-science.org/topics/biological/vegetation/whitebarkpine/
LCC Vulnerability Project 3
Project SummaryDesignation of US Department of Interior Landscape Conservation Cooperatives (LCCs) emphasizes the important threat that climate and land use change pose to biological resources in national parks and on other federal lands. Developing strate-gies for management and adaptation in the coming century requires improvements in our ability to forecast biological responses under future scenarios, assess spatial variation in the vulnerabilities of biological resources, and design multi-scale manage-ment strategies based on vulnerability and management feasibility.
The goal of this project is to develop and apply decision support tools that use NASA and other data and models to assess the vulnerability of ecosystems and species to climate and land use change, and to evalu-ate management options.
Our objectives are to:
1. Quantify trends in ecological process-es, ecosystem types, and dominant tree species from past to present, and under projected future climate and land use scenarios using NASA and other data and models across two LCCs.
2. Assess the vulnerability of ecosystem types and dominant tree species to climate and land use change by quan-tifying exposure, sensitivity, adaptive capacity, and uncertainty in and around focal national parks within LCCs.
3. Evaluate management options for the more vulnerable ecosystem types and tree species within these focal parks.
4. Design multi-scale management ap-proaches for vulnerable ecosystem types and tree species to illustrate adaptation strategies under climate and land use change.
5. Facilitate transfer of data, methods, and models to federal agencies to facilitate broad application of the decision sup-port tools.
The proposed work will build on our previous successful NASA Applied Sci-ences project to enhance decision support within the National Park Service Inventory and Monitoring Program. This project will focus on portions of the Great Northern and Appalachian LCCs, both of which support critical biological resources and have already undergone climatic warming. Within a climate adaptation framework recently derived by an interagency team, we will integrate component models and data from the Terrestrial Observation and Prediction System (TOPS; Nemani et al. 2009) and the SERGoM land use change model (Theobald 2005) to hindcast (2001-2010) and forecast (2010-2100) responses of ecosystems and illustrative species to 36 future scenarios.
Ecosystem process indicators we will evalu-ate include snow pack, runoff , vegetation phenology, primary productivity, lifeform dynamics, and disturbance events. Bio-diversity response will be analyzed with a coarse-fi lter approach emphasizing land facets, ecological system types, and domi-nant tree species. Correspondence among dynamic models of vegetation lifeform and statistical distribution models of ecological system types and dominant tree species will be used to assess uncertainty.
Results of these forecasts and expert opin-ion will be used to assess vulnerability and place indicators into one of three man-agement classes: Low Risk (management not needed); Manageable (management eff ective and required); and Lost Cause (potentially high risk, but management un-likely to mitigate). For those components rated as Manageable, the team will design spatially and temporally-explicit man-agement strategies to improve resilience and/or adaptation. The decision support framework, ecological forecasting tools, and management strategies derived through this project should help to prioritize future activities within the two case-study LCCs and provide a demonstration that may lead to application nationwide.
4 LCC Vulnerability Project
Rationale and ObjectivesOver the coming century, change in climate may exceed the resilience of ecosystems and lead to major disruptions of habi-tats and species. Such potential changes present a profound challenge for natural resource managers globally, including in the US. Future climate change is antici-pated to drive shifts of hundreds of kilome-ters in the range of ecosystems and species, and play out over decades to centuries. At the same time, land use intensifi cation is likely to constrain both the movements of organisms and the adaptation strategies of managers. Thus, successful management in the future will require consideration of large spatial and temporal scales, the ability to anticipate biological response under various future scenarios, and cooperation among resource managers across large regions (Glick et al. 2011).
Accordingly, the US Department of Interior (DOI) has initiated various programs to meet these management challenges. The National Park Service Inventory and Moni-toring Program (NPS I&M) was created in 2000 to provide a framework for scientifi -cally sound information on the status and trends of national park condition. Under the NPS Climate Change Adaptation Strategy, co-I’s Olliff , Monahan, and Gross and other NPS colleagues are developing implementation plans to integrate monitor-ing, science, and management for climate change adaptation. Based partially on
the success of the NPS I&M, in 2009 the DOI launched the creation of Landscape Conservation Cooperatives (LCCs) across networks of the federal lands (US DOI Sec-retarial Order 3289). The goal of the LCCs is to craft practical, landscape-level strate-gies for managing climate-change impacts, with emphasis on: 1)Ecological systems and function, 2) Strengthened observation-al systems, 3) Model-based projections, 4) Species-habitat linkages, 5) Risk assess-ment, 6) Adaptive management. The NPS implementation plan will be used as a basis for achieving this goal.
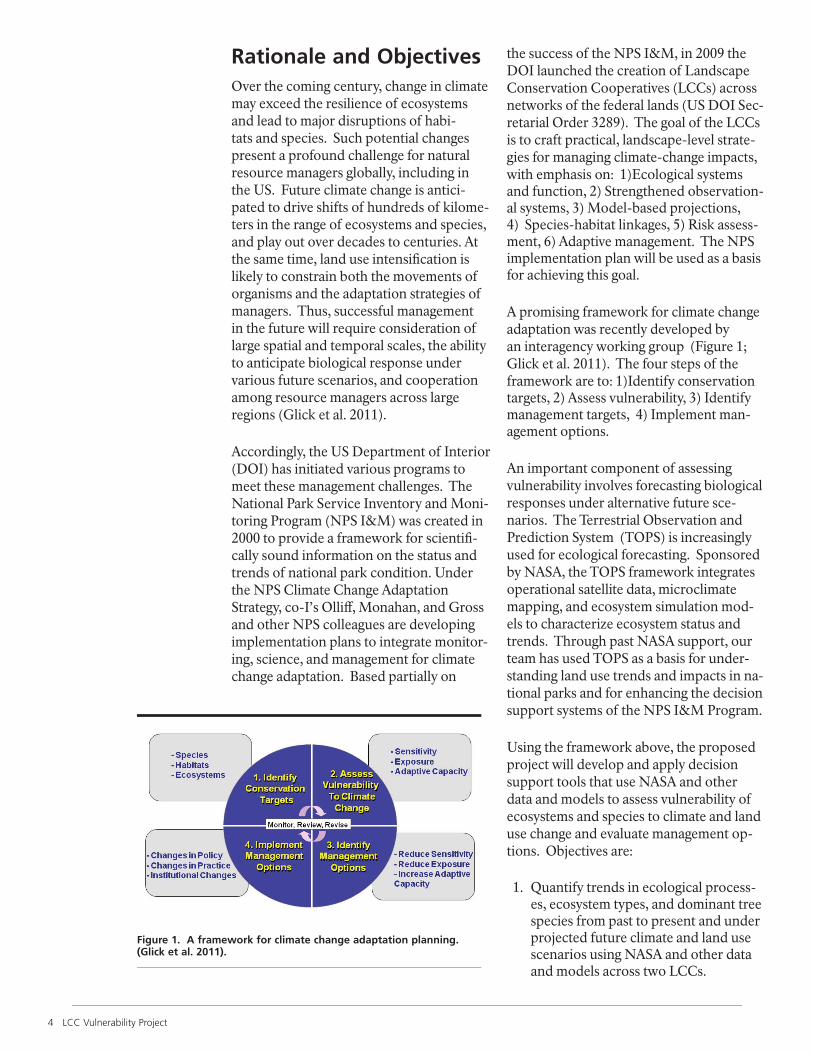
A promising framework for climate change adaptation was recently developed by an interagency working group (Figure 1; Glick et al. 2011). The four steps of the framework are to: 1)Identify conservation targets, 2) Assess vulnerability, 3) Identify management targets, 4) Implement man-agement options.
An important component of assessing vulnerability involves forecasting biological responses under alternative future sce-narios. The Terrestrial Observation and Prediction System (TOPS) is increasingly used for ecological forecasting. Sponsored by NASA, the TOPS framework integrates operational satellite data, microclimate mapping, and ecosystem simulation mod-els to characterize ecosystem status and trends. Through past NASA support, our team has used TOPS as a basis for under-standing land use trends and impacts in na-tional parks and for enhancing the decision support systems of the NPS I&M Program.
Using the framework above, the proposed project will develop and apply decision support tools that use NASA and other data and models to assess vulnerability of ecosystems and species to climate and land use change and evaluate management op-tions. Objectives are:
1. Quantify trends in ecological process-es, ecosystem types, and dominant tree species from past to present and under projected future climate and land use scenarios using NASA and other data and models across two LCCs.
Figure 1. A framework for climate change adaptation planning. (Glick et al. 2011).
LCC Vulnerability Project 5
2. Assess the vulnerability of ecosystem types and dominant tree species to climate and land use change by quan-tifying exposure, sensitivity, adaptive capacity, and uncertainty in and around focal national parks within LCCs.
3. Evaluate management options for the more vulnerable ecosystem types and tree species within these focal parks.
4. Design multi-scale management ap-proaches for vulnerable ecosystem types and tree species to illustrate adaptation strategies under climate and land use change.
5. Facilitate technology transfer of data, methods, and models to federal agen-cies to allow the decision support tools to be applied more broadly
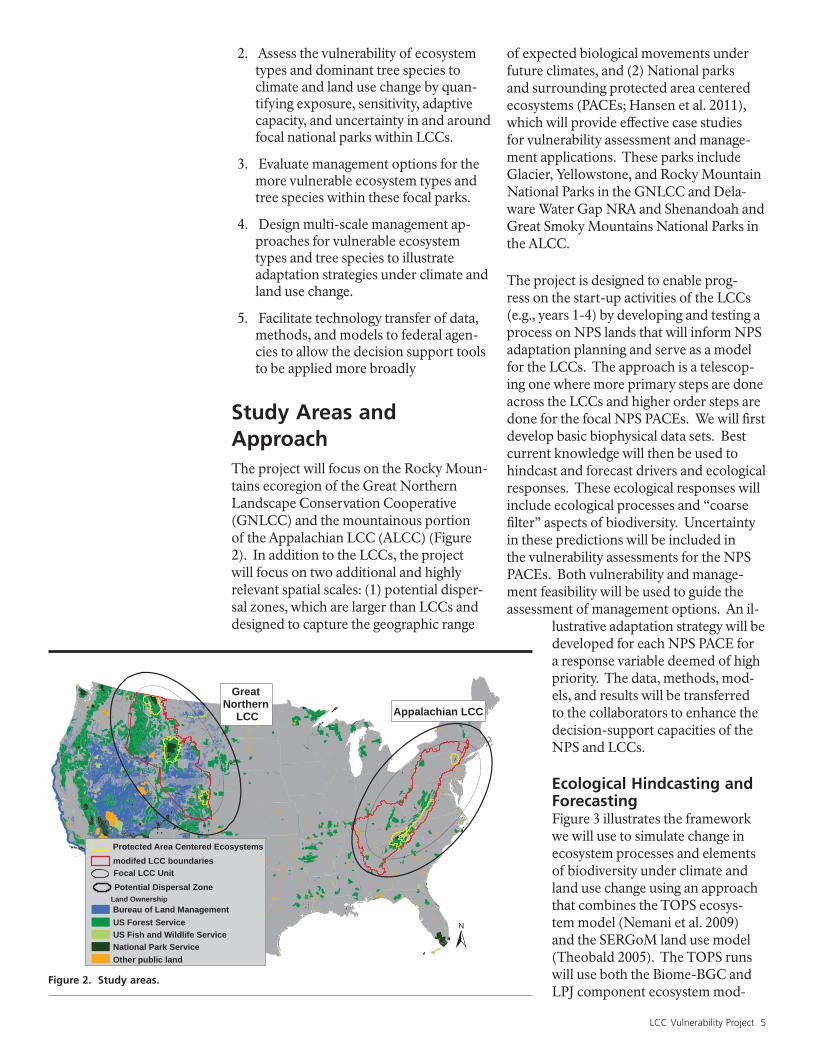
Study Areas and ApproachThe project will focus on the Rocky Moun-tains ecoregion of the Great Northern Landscape Conservation Cooperative (GNLCC) and the mountainous portion of the Appalachian LCC (ALCC) (Figure 2). In addition to the LCCs, the project will focus on two additional and highly relevant spatial scales: (1) potential disper-sal zones, which are larger than LCCs and designed to capture the geographic range
of expected biological movements under future climates, and (2) National parks and surrounding protected area centered ecosystems (PACEs; Hansen et al. 2011), which will provide eff ective case studies for vulnerability assessment and manage-ment applications. These parks include Glacier, Yellowstone, and Rocky Mountain National Parks in the GNLCC and Dela-ware Water Gap NRA and Shenandoah and Great Smoky Mountains National Parks in the ALCC.
The project is designed to enable prog-ress on the start-up activities of the LCCs (e.g., years 1-4) by developing and testing a process on NPS lands that will inform NPS adaptation planning and serve as a model for the LCCs. The approach is a telescop-ing one where more primary steps are done across the LCCs and higher order steps are done for the focal NPS PACEs. We will fi rst develop basic biophysical data sets. Best current knowledge will then be used to hindcast and forecast drivers and ecological responses. These ecological responses will include ecological processes and “coarse fi lter” aspects of biodiversity. Uncertainty in these predictions will be included in the vulnerability assessments for the NPS PACEs. Both vulnerability and manage-ment feasibility will be used to guide the assessment of management options. An il-
lustrative adaptation strategy will be developed for each NPS PACE for a response variable deemed of high priority. The data, methods, mod-els, and results will be transferred to the collaborators to enhance the decision-support capacities of the NPS and LCCs.
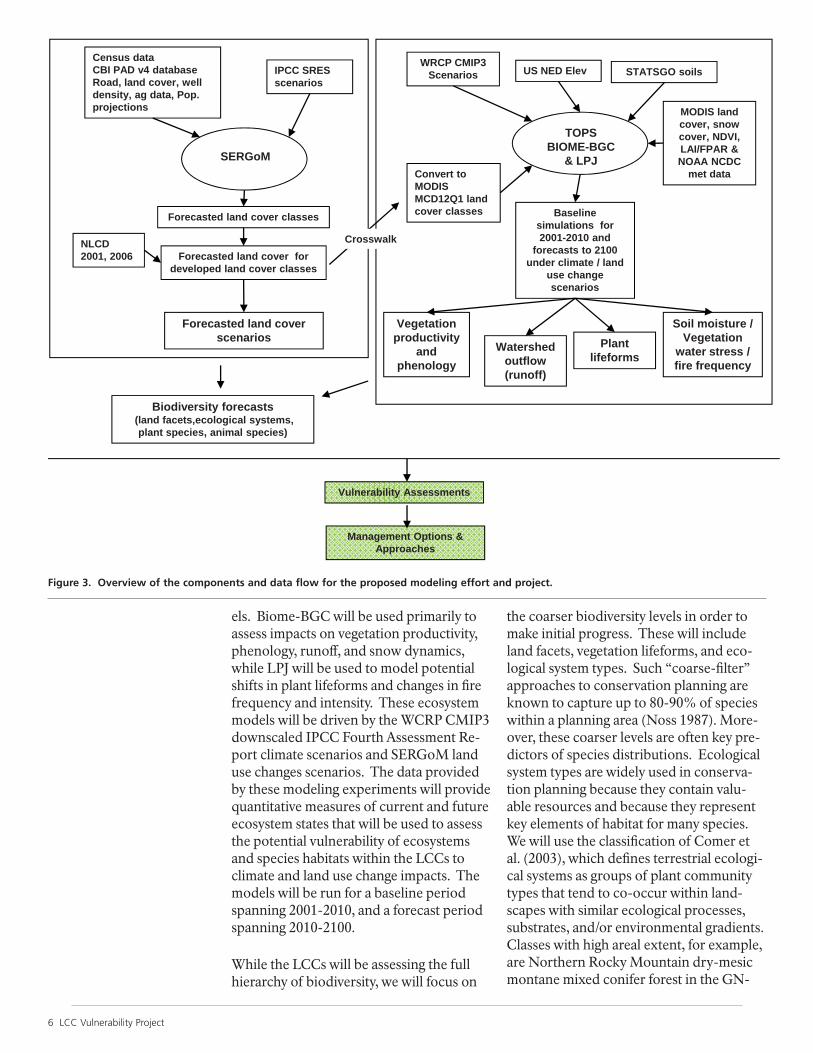
Ecological Hindcasting and ForecastingFigure 3 illustrates the framework we will use to simulate change in ecosystem processes and elements of biodiversity under climate and land use change using an approach that combines the TOPS ecosys-tem model (Nemani et al. 2009)and the SERGoM land use model (Theobald 2005). The TOPS runs will use both the Biome-BGC and LPJ component ecosystem mod-
±Bureau of Land ManagementUS Forest ServiceUS Fish and Wildlife ServiceNational Park Service
Focal LCC UnitPotential Dispersal Zone
Other public land
Land Ownership
Great Northern
LCC Appalachian LCC
modifed LCC boundariesProtected Area Centered Ecosystems
Figure 2. Study areas.
6 LCC Vulnerability Project
els. Biome-BGC will be used primarily to assess impacts on vegetation productivity, phenology, runoff , and snow dynamics, while LPJ will be used to model potential shifts in plant lifeforms and changes in fi re frequency and intensity. These ecosystem models will be driven by the WCRP CMIP3 downscaled IPCC Fourth Assessment Re-port climate scenarios and SERGoM land use changes scenarios. The data provided by these modeling experiments will provide quantitative measures of current and future ecosystem states that will be used to assess the potential vulnerability of ecosystems and species habitats within the LCCs to climate and land use change impacts. The models will be run for a baseline period spanning 2001-2010, and a forecast period spanning 2010-2100.
While the LCCs will be assessing the full hierarchy of biodiversity, we will focus on
the coarser biodiversity levels in order to make initial progress. These will include land facets, vegetation lifeforms, and eco-logical system types. Such “coarse-fi lter” approaches to conservation planning are known to capture up to 80-90% of species within a planning area (Noss 1987). More-over, these coarser levels are often key pre-dictors of species distributions. Ecological system types are widely used in conserva-tion planning because they contain valu-able resources and because they represent key elements of habitat for many species. We will use the classifi cation of Comer et al. (2003), which defi nes terrestrial ecologi-cal systems as groups of plant community types that tend to co-occur within land-scapes with similar ecological processes, substrates, and/or environmental gradients. Classes with high areal extent, for example, are Northern Rocky Mountain dry-mesic montane mixed conifer forest in the GN-
WRCP CMIP3 Scenarios STATSGO soilsUS NED Elev
MODIS l d
Census dataCBI PAD v4 databaseRoad, land cover, well density, ag data, Pop. projections
IPCC SRES scenarios
Convert to MODISMCD12Q1 land
TOPSBIOME-BGC
& LPJ
MODIS landcover, snow cover, NDVI, LAI/FPAR & NOAA NCDC
met data
projections
SERGoM
MCD12Q1 landcover classes Baseline
simulations for 2001-2010 and
forecasts to 2100 under climate / land
use change scenarios
Forecasted land cover classes
NLCD2001, 2006 Forecasted land cover for
developed land cover classes
Crosswalk
Vegetation productivity
and phenology
Watershed outflow (runoff)
Soil moisture / Vegetation
water stress / fire frequency
Plantlifeforms
Forecasted land cover scenarios
Biodiversity forecasts(land facets,ecological systems, plant species, animal species)
Vulnerability Assessments
Management Options & Approaches
Figure 3. Overview of the components and data fl ow for the proposed modeling effort and project.
LCC Vulnerability Project 7
LCC (50%) and Appalachian (Hemlock)-Northern Hardwood Forest in the ALCC (10%).
Within each NPS PACE, we will select for analysis the subset of ecological systems (ca 5) that are identifi ed as the highest priorities in workshops with the collabora-tors. We will model the potential future locations of these ecological systems using statistical models parameterized through analyses of the biophysical envelope of current locations of these ecosystems. We anticipate that TOPS products such as phenology, snow cover, runoff , soil mois-ture and primary productivity, which have not been previously available for broad areas at a resolution of 1 km, will improve the strength of the statistical models. As a means of validation, we will also model the habitat suitability of tree species that are dominant in each ecological system. Cor-respondence in the predictions from the vegetation lifeform, ecological systems, and dominant plant species modeling will be used to quantify uncertainty.
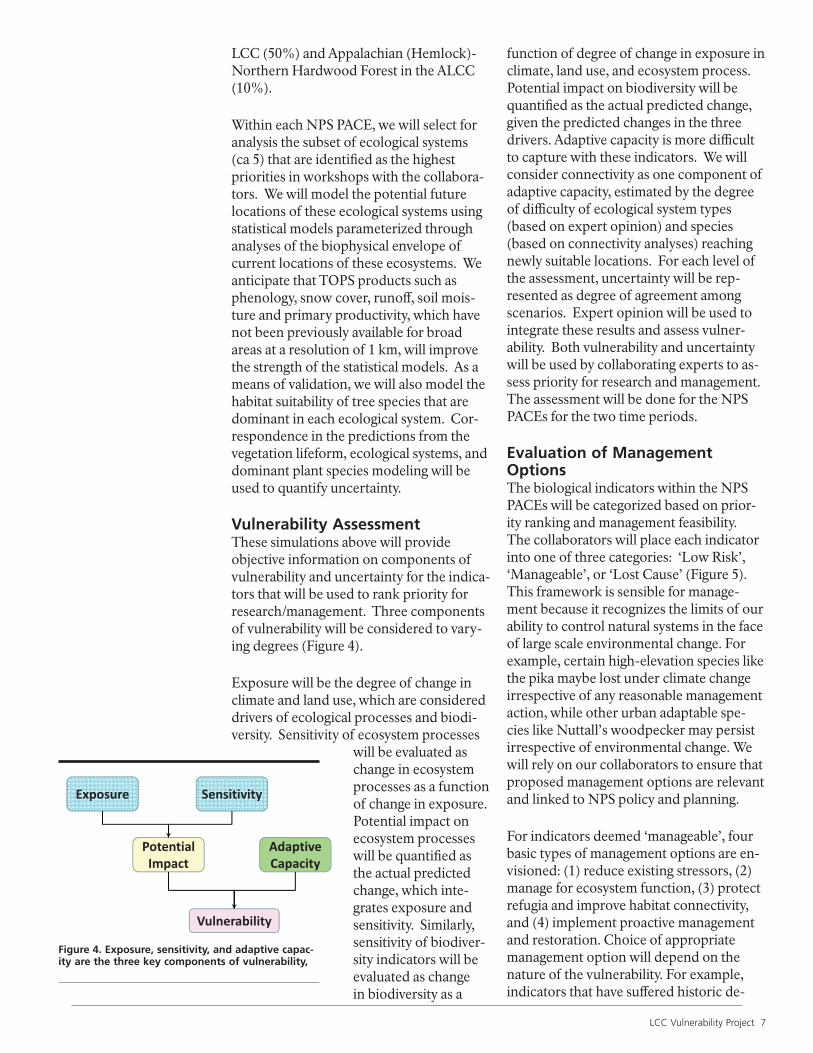
Vulnerability AssessmentThese simulations above will provide objective information on components of vulnerability and uncertainty for the indica-tors that will be used to rank priority for research/management. Three components of vulnerability will be considered to vary-ing degrees (Figure 4).
Exposure will be the degree of change in climate and land use, which are considered drivers of ecological processes and biodi-versity. Sensitivity of ecosystem processes
will be evaluated as change in ecosystem processes as a function of change in exposure. Potential impact on ecosystem processes will be quantifi ed as the actual predicted change, which inte-grates exposure and sensitivity. Similarly, sensitivity of biodiver-sity indicators will be evaluated as change in biodiversity as a
function of degree of change in exposure in climate, land use, and ecosystem process. Potential impact on biodiversity will be quantifi ed as the actual predicted change, given the predicted changes in the three drivers. Adaptive capacity is more diffi cult to capture with these indicators. We will consider connectivity as one component of adaptive capacity, estimated by the degree of diffi culty of ecological system types (based on expert opinion) and species (based on connectivity analyses) reaching newly suitable locations. For each level of the assessment, uncertainty will be rep-resented as degree of agreement among scenarios. Expert opinion will be used to integrate these results and assess vulner-ability. Both vulnerability and uncertainty will be used by collaborating experts to as-sess priority for research and management. The assessment will be done for the NPS PACEs for the two time periods.
Evaluation of Management OptionsThe biological indicators within the NPS PACEs will be categorized based on prior-ity ranking and management feasibility. The collaborators will place each indicator into one of three categories: ‘Low Risk’, ‘Manageable’, or ‘Lost Cause’ (Figure 5). This framework is sensible for manage-ment because it recognizes the limits of our ability to control natural systems in the face of large scale environmental change. For example, certain high-elevation species like the pika maybe lost under climate change irrespective of any reasonable management action, while other urban adaptable spe-cies like Nuttall’s woodpecker may persist irrespective of environmental change. We will rely on our collaborators to ensure that proposed management options are relevant and linked to NPS policy and planning.
For indicators deemed ‘manageable’, four basic types of management options are en-visioned: (1) reduce existing stressors, (2) manage for ecosystem function, (3) protect refugia and improve habitat connectivity, and (4) implement proactive management and restoration. Choice of appropriate management option will depend on the nature of the vulnerability. For example, indicators that have suff ered historic de-
Exposure Sensitivity
Potential AdaptivePotentialImpact
AdaptiveCapacity
Vulnerability
Figure 4. Exposure, sensitivity, and adaptive capac-ity are the three key components of vulnerability,
8 LCC Vulnerability Project
clines due to anthropogenic infl uences may require proactive management and restora-tion, while others that remain stable and viable may benefi t from the protection of refugia and improvements to connectivity. This categorization of biological indicators and development of management op-tions will be done at a third workshop with collaborators.
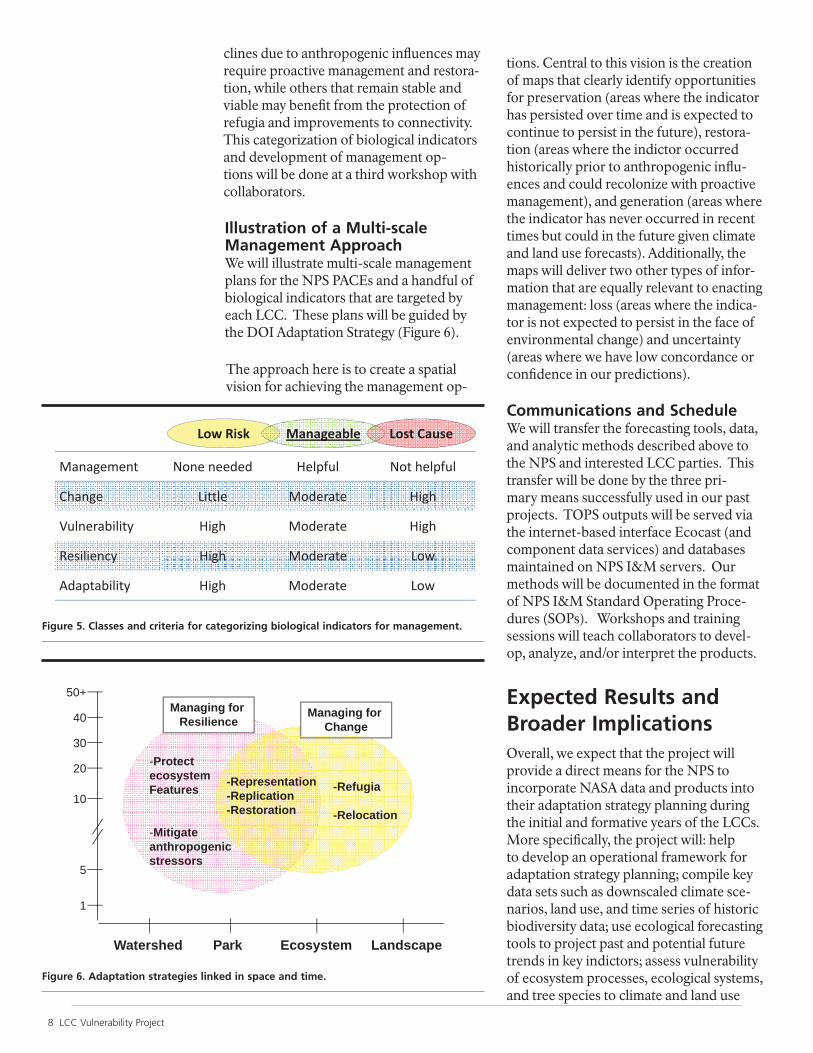
Illustration of a Multi-scale Management ApproachWe will illustrate multi-scale management plans for the NPS PACEs and a handful of biological indicators that are targeted by each LCC. These plans will be guided by the DOI Adaptation Strategy (Figure 6).
The approach here is to create a spatial vision for achieving the management op-
tions. Central to this vision is the creation of maps that clearly identify opportunities for preservation (areas where the indicator has persisted over time and is expected to continue to persist in the future), restora-tion (areas where the indictor occurred historically prior to anthropogenic infl u-ences and could recolonize with proactive management), and generation (areas where the indicator has never occurred in recent times but could in the future given climate and land use forecasts). Additionally, the maps will deliver two other types of infor-mation that are equally relevant to enacting management: loss (areas where the indica-tor is not expected to persist in the face of environmental change) and uncertainty (areas where we have low concordance or confi dence in our predictions).
Communications and ScheduleWe will transfer the forecasting tools, data, and analytic methods described above to the NPS and interested LCC parties. This transfer will be done by the three pri-mary means successfully used in our past projects. TOPS outputs will be served via the internet-based interface Ecocast (and component data services) and databases maintained on NPS I&M servers. Our methods will be documented in the format of NPS I&M Standard Operating Proce-dures (SOPs). Workshops and training sessions will teach collaborators to devel-op, analyze, and/or interpret the products.
Expected Results and Broader ImplicationsOverall, we expect that the project will provide a direct means for the NPS to incorporate NASA data and products into their adaptation strategy planning during the initial and formative years of the LCCs. More specifi cally, the project will: help to develop an operational framework for adaptation strategy planning; compile key data sets such as downscaled climate sce-narios, land use, and time series of historic biodiversity data; use ecological forecasting tools to project past and potential future trends in key indictors; assess vulnerability of ecosystem processes, ecological systems, and tree species to climate and land use
50+
40Managing for
ResilienceManaging for
Change
-Protectecosystem Features -Representation
-Replication-Refugia
10
20
30
-Mitigateanthropogenicstressors
p-Restoration -Relocation
5
10
1
5
Watershed Park Ecosystem Landscape
Figure 6. Adaptation strategies linked in space and time.
Low Risk Lost CauseManageable
Management None needed Helpful Not helpful
Change Little Moderate High
Vulnerability High Moderate High
Resiliency High Moderate LowResiliency High Moderate Low
Adaptability High Moderate Low
Figure 5. Classes and criteria for categorizing biological indicators for management.
LCC Vulnerability Project 9
change; and demonstrate the development and implementation of management options for NPS PACEs. The transfer of the technol-ogy underlying the project should enhance the decision support capabilities of the NPS during the project and subsequently. The project may also serve as a model for adapta-tion by additional LCCs as they develop.
The project is also expected to make contri-butions to conservation science. The merging of the TOPS models of ecosystem processes with the SERGoM model of land use change is expected to have widespread application in global change science. Our hierarchical approach to representing biodiversity will advance the coarse to fi ne fi lter approach
to analyzing biodiversity. Thirdly, the project will evaluate the extent to which habitat suitability models may be improved by inclusion of TOPS outputs such as phenology.
The project has high potential to contribute to public education on global change sci-ence and management. The NPS interpre-tive staff provide educational programs to millions of park visitors annually and reach millions more through web sites and other types of outreach. The concrete examples of climate and land use change, biological response, and adaptation strategies emerg-ing from the project should be highly useful in these educational programs.
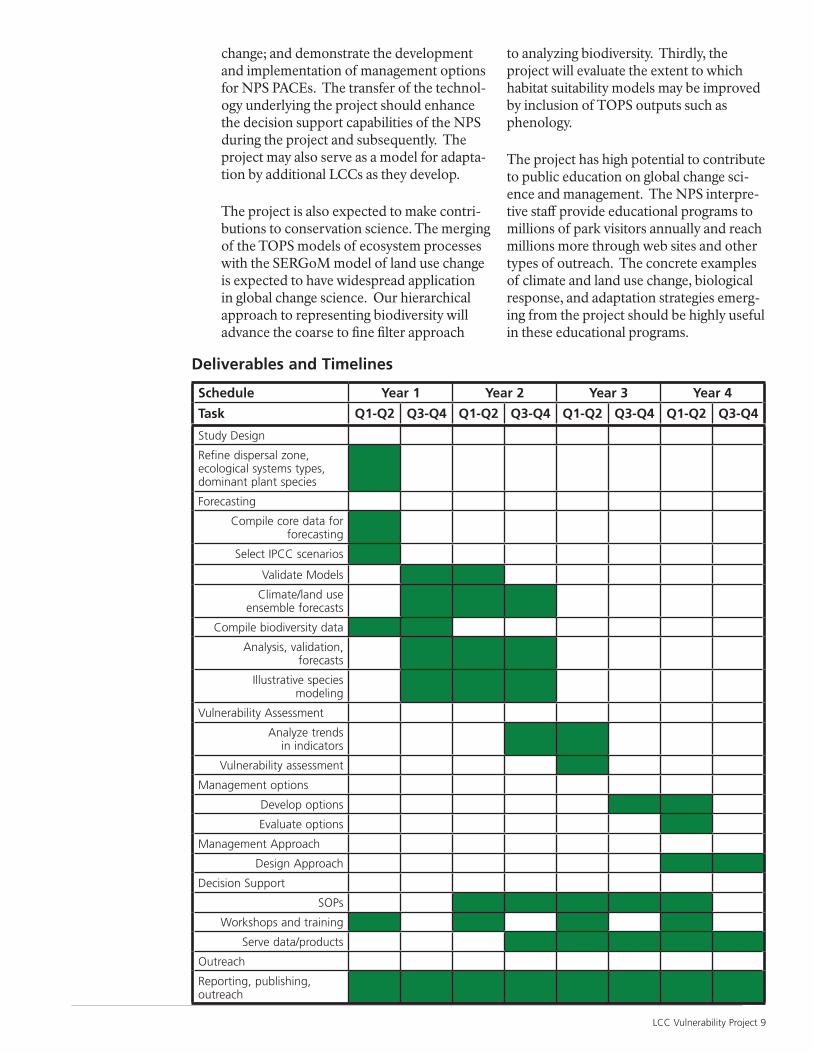
Deliverables and Timelines
Schedule Year 1 Year 2 Year 3 Year 4
Task Q1-Q2 Q3-Q4 Q1-Q2 Q3-Q4 Q1-Q2 Q3-Q4 Q1-Q2 Q3-Q4
Study Design
Refi ne dispersal zone, ecological systems types, dominant plant species
Forecasting
Compile core data for forecasting
Select IPCC scenarios
Validate Models
Climate/land use ensemble forecasts
Compile biodiversity data
Analysis, validation, forecasts
Illustrative species modeling
Vulnerability Assessment
Analyze trendsin indicators
Vulnerability assessment
Management options
Develop options
Evaluate options
Management Approach
Design Approach
Decision Support
SOPs
Workshops and training
Serve data/products
Outreach
Reporting, publishing, outreach
10 LCC Vulnerability Project
Comer, P., D. Faber-Langendoen, R. Evans, S. Gawler, C. Josse, G. Kittel, S. Menard, M. Pyne, M. Reid, K. Schulz, K. Snow, and J. Teague. 2003. Ecological systems of the United States: A working classifi cation of U.S. terrestrial systems. NatureServe, Arlington, Virginia.
Glick P., B.A. Stein, and N. Edelson (eds). 2011. Scanning the Conservation Horizon: A Guide to Climate Change Vulnerability Assessment. National Wildlife Federation, Washington, D.C.
Hansen, A. J., C. Davis, N. B. Piekielek, J. E. Gross, D. M. Theobald, S. J. Goetz, F. Melton, and R. DeFries. 2011. Delineating the ecosystems containing protected areas for monitoring and management. BioScience 61:263-273.
Nemani, R., H. Hashimoto, P. Votava, F. Melton, W. L. Wang, A. Michaelis, L. Mutch, C. Milesi, S. Hiatt, and M. White. 2009. Monitoring and forecasting ecosystem dynamics using the Terrestrial Observation and Prediction System (TOPS). Remote Sensing of Environment 113:1497-1509.
Noss, R. F. 1987. From plant communities to landscapes in conservation inventories: a look at the Nature Conservancy (USA). Biological Conservation| 41:11-37.
Theobald, D.M. 2005. Landscape patterns of exurban growth in the USA from 1980 to 2020. Ecology and Society 10(1): 32 (online).
Literature Cited