using intron position conservation for homology-based …€¦ · using intron position...
TRANSCRIPT
Published online 17 February 2016 Nucleic Acids Research, 2016, Vol. 44, No. 9 e89doi: 10.1093/nar/gkw092
Using intron position conservation forhomology-based gene predictionJens Keilwagen1,*, Michael Wenk2, Jessica L. Erickson3, Martin H. Schattat3, Jan Grau2 andFrank Hartung1
1Institute for Biosafety in Plant Biotechnology, Julius Kuhn-Institut (JKI) - Federal Research Centre for CultivatedPlants, D-06484 Quedlinburg, Germany, 2Institute of Computer Science, Martin Luther University Halle–Wittenberg,D-06120 Halle (Saale), Germany and 3Schattat Lab, Institute of Biology, Martin Luther University Halle–Wittenberg,D-06120 Halle (Saale), Germany
Received October 30, 2015; Revised February 01, 2016; Accepted February 06, 2016
ABSTRACT
Annotation of protein-coding genes is very importantin bioinformatics and biology and has a decisive in-fluence on many downstream analyses. Homology-based gene prediction programs allow for transfer-ring knowledge about protein-coding genes from anannotated organism to an organism of interest.
Here, we present a homology-based gene predic-tion program called GeMoMa. GeMoMa utilizes theconservation of intron positions within genes to pre-dict related genes in other organisms. We assess theperformance of GeMoMa and compare it with state-of-the-art competitors on plant and animal genomesusing an extended best reciprocal hit approach. Wefind that GeMoMa often makes more precise pre-dictions than its competitors yielding a substan-tially increased number of correct transcripts. Sub-sequently, we exemplarily validate GeMoMa predic-tions using Sanger sequencing. Finally, we use RNA-seq data to compare the predictions of homology-based gene prediction programs, and find again thatGeMoMa performs well.
Hence, we conclude that exploiting intron positionconservation improves homology-based gene pre-diction, and we make GeMoMa freely available ascommand-line tool and Galaxy integration.
INTRODUCTION
Next Generation Sequencing technologies enable rapid andcost-efficient sequencing of genomes. However, after se-quencing and assembling the genome of an organism, itis important to provide annotations, especially of protein-coding genes. Annotation pipelines for newly sequencedgenomes utilize three main sources of information: (i) ev-idence from wet-lab experiments, (ii) ab initio and (iii)
homology-based gene prediction relying on (closely) relatedand annotated species (1,2).
Wet-lab experiments like RNA-seq (3) or Iso-seq (4) pro-vide a wealth of information about transcripts includingexon–intron boundaries and Untranslated region (UTRs),but are limited to those transcripts expressed under thestudied conditions. Hence, annotations based on RNA-seqdata might miss lowly or very specifically expressed tran-scripts. By contrast, ab initio gene prediction programs arecomputer programs that predict gene models without evi-dence from wet-lab experiments or related species.
Here, we focus on homology-based gene prediction pro-grams that predict genes or transcripts in the newly se-quenced target genomes based on the similarity to knowngenes from closely related and, typically, well annotated ref-erence genomes. Given some knowledge about a gene ina specific organism, we are interested in whether a simi-lar or, ideally, an orthologous gene exists in another organ-ism, which could allow for transferring knowledge from onespecies to another.
One of the most popular tools for identifying similargenes or proteins is Basic Local Alignment Search Tool(BLAST) (5). However, BLAST does not explicitly accountfor the exon–intron structure of genes and, for this reason,is typically applied to find similar genes or transcripts al-ready extracted from genomic sequence. Searching for pro-teins or coding sequences in complete genomes, long andvariable introns might be a problem for BLAST yieldinga plethora of short, similar sequences scattered over thegenome. Hence, BLAST is no gene prediction program interms of this manuscript.
To circumvent this problem, several approaches havebeen proposed for combining smaller, local hits of high sim-ilarity to parts of a given gene into larger, complete genemodels, as for instance Genewise (6), exonerate (7), Pro-jector (8), GeneMapper (9) and genBlastG (10). In thismanuscript, we focus on exonerate and genBlastG. Exon-erate is a very versatile tool allowing diverse alignments
*To whom correspondence should be addressed. Tel: +49 3946 47 510; Fax: +49 3946 47 500; Email: [email protected]
C© The Author(s) 2016. Published by Oxford University Press on behalf of Nucleic Acids Research.This is an Open Access article distributed under the terms of the Creative Commons Attribution License (http://creativecommons.org/licenses/by-nc/4.0/), whichpermits non-commercial re-use, distribution, and reproduction in any medium, provided the original work is properly cited. For commercial re-use, please [email protected]

e89 Nucleic Acids Research, 2016, Vol. 44, No. 9 PAGE 2 OF 11
and is often used as part of genome annotation pipelines(11). GenBlastG is specially tailored to aligning proteins togenomes and especially optimized for runtime.
However, most of these tools do not utilize the knowngene structures, i.e. the exon–intron boundaries and ex-ons lengths, of the query genes while searching for tar-get genes, although the gene structure of intron-containingorthologous genes is strongly conserved throughout thewhole plant or animal kingdom and to a smaller extent evenacross kingdoms (12,13). By contrast, Projector (8) andGeneMapper (9) use the conservation of the gene structurein addition to the similarity of the encoded amino acid se-quences. Projector uses a pairHMM approach, while Gen-eMapper uses bottom-up approach utilizing an alignmentof codons for the exons.
Here, we propose a Gene Model Mapper approach calledGeMoMa that exploits the conservation of gene structuresto predict gene models in a target genome based on the genemodels of a reference genome. Specifically, GeMoMa usesBLAST as a first step to align individual coding exons to thegenome on the level of (translated) amino acids. For several,especially short, exons, BLAST will report multiple matchesspread across the genome. To reduce computational com-plexity for the following steps, GeMoMa segments thegenome into matching regions based on the occurrence ofsuch exon matches. Within each region, GeMoMa uses adynamic programming approach to create a complete genemodel that joins the matching exons in this region in thecorrect order, but allows for intron gain and loss duringthis procedure. Finally, predicted exons are refined such thateach exon is flanked by proper splice sites and each (coding)transcript begins with a start codon and ends with a stopcodon.
Aiming at a lowly biased comparison of different tools,we extend the best reciprocal hit (BRH) approach. Twogenes residing in different genomes are called BRHs orbidirectional best hits if the corresponding proteins findeach other as the best hit in the opposite genome (14). Of-ten BRHs are used to determine orthologous genes, butfor several reasons this might be problematic (15). In thismanuscript, we adapt the approach comparing the best hitsof transcripts in different genomes. We enrich the analysisby several categories, as for instance, correct transcript, cor-rect gene and correct gene family and measure whether thecomplete gene model can be predicted.
Using this extended BRH approach, we test GeMoMafor gene prediction in plants and animals, and compareit with exonerate and genBlastG. Subsequently, we uti-lize Sanger sequencing and demonstrate that predictions ofGeMoMa for Carica papaya might allow for improving par-tially known gene models or predicting previously unknowngene models. Finally, we evaluate exonerate, genBlastG andGeMoMa using RNA-Seq data for Nicotiana benthamiana.
MATERIALS AND METHODS
Algorithm
The main idea for predicting gene models in a genome orgenome assembly is to rely on annotated genes in otherspecies. In addition to using the amino acid sequence, we
also use the exon–intron boundaries, i.e. the split of thecomplete Coding Sequence (CDS) into smaller parts.
Hence, each (partially) coding exon of a transcript istranslated into an amino acid sequence. Subsequently, thesesequences are fed to tblastn to obtain regions potentiallycoding for similar amino acid sequences in the targetgenome (Text S1).
The tblastn results of each transcript are filtered per con-tig and strand. For each contig-strand combination, a dy-namic programming algorithm is performed to assemble thetblastn results to an initial gene model (Text S1) returningan initial sum score. Based on this initial sum score, thecontig-strand combinations are filtered obtaining promis-ing initial gene models using the parameter ct, which spec-ifies the percentage of the maximal initial sum score that hasto be be succeeded to be used for further analysis.
For each of those contig-strand combinations, regions areidentified that possibly encode for a similar transcript. Ineach region, coding parts of the transcript are searched thathave no tblastn result. Again the dynamic programming al-gorithm is used that this time considers canonical splice sitesand only in-frame combinations of individual parts to ob-tain a gene model and a corresponding score (Text S1).
Based on this score, the predictions of each region areranked and a user-specified number of predictions is re-turned.
Extended best reciprocal hit approach
In order to compare the predictions of different tools, theBRH approach was extended to allow for a less biased com-parison. The BRH approach can be summarized as follows:Given transcript A encoded in genome 1, we search for thebest matching transcript B in genome 2. Given transcriptB, we are searching for the best matching transcript C ingenome 1. If A equals C, we have a BRH. Hence, the BRHapproach only provides one category.
We extend this approach by introducing 8 additional cat-egories:
(i) A and C are the same transcript (BRH),(ii) A and C are different transcripts of the same gene,
(iii) A and C are transcripts of a gene family,(iv) A and C are transcripts that do not belong to a gene
family,(v) There is no prediction of transcript A in genome 2,
(vi) There is no annotation (B) in genome 2 that overlapswith the prediction of transcript A in genome 2,
(vii) There is no prediction of transcript B in genome 1,(viii) There is no annotation (C) in genome 1 that overlaps
with the prediction of transcript B in genome 1.
Furthermore, we enrich this approach by an additionalmeasure of confidence. The nucleotide F1 measure was com-puted twice, namely, between the prediction of transcriptA in genome 2 and transcript B, and between the predic-tion of transcript B in genome 1 and transcript C (Text S4).In a nutshell, nucleotide F1 aggregates nucleotide precisionand nucleotide recall into one scalar value varying between0 and 1 corresponding to completely wrong and perfect pre-dictions, respectively. Finally, the minimum of these two F1

PAGE 3 OF 11 Nucleic Acids Research, 2016, Vol. 44, No. 9 e89
values was computed and denoted as minimal F1. Predic-tions that fall in one of the first four categories were furthercharacterized by the minimal F1.
Genomes and annotations
For the extended BRH approach, we downloaded thegenome (assemblies) and gene annotation of the plantspecies Arabidopsis lyrata, Arabidopsis thaliana, Carica pa-paya, Oryza sativa and Solanum tuberosum from Phytozome(16), and the animal species Homo sapiens, Gallus gallus andMus musculus from Ensembl (17) (cf. Text S3).
Additionally, we downloaded genome assembly andgene annotation of Nicotiana benthamiana v0.4.4 (18)from ftp://ftp.solgenomics.net/genomes/Nicotiana benthamiana/assemblies/ for map-ping RNA-seq data and assessing GeMoMa predictions.
For all analyses, we discarded gene models from the givenannotation with missing start or stop codon, prematurestop codon(s) or ambiguous nucleotide(s). In addition, weonly used one representative gene model if several genemodels of a gene have the same CDS, i.e. only differ in theirUTRs.
Polymerase Chain Reaction (PCR) and sequencing
The mRNA was isolated from A. thaliana ecotype Col-0and C. papaya inflorescences using the Bio & Sell RNA miniKit (Bio&Sell e.K., Feucht, Germany). In the case of C. pa-paya, flowers were stored in RNAshield (Zymo research Eu-rope GmbH, Freiburg, Germany) prior to RNA isolation.The cDNA was synthesized using an anchored oligo dT-Primer and the Maxima H Minus Reverse Transcriptase Kit(Thermo Fisher Scientific, Germany) using 2–4 �g of totalRNA as template for the reverse transcriptase reaction. Thegenomic DNA of A. thaliana was isolated as described pre-viously (19). The genomic DNA of C. papaya was providedby Ray Ming who was leading the original C. papaya se-quencing project (University of Illinois).
For amplification of complementary and genomic DNAfrom A. thaliana, primer pairs were deduced and designedfrom the published sequence of the TAIR 10 database. Foramplification of the GeMoMa predicted C. papaya exons,we designed primer pairs as near as possible to the predictedstart codon (ATG) and stop codon. For primer detailssee Supplementary Table S7.
The PCR using cDNA of A. thaliana and C. papaya wasdone with an appropriate polymerization time of 1 to 2 minat 72◦C depending on the size of the predicted cDNA length(from 250 to a maximum of 2037 bp). The genomic DNA ofA. thaliana and C. papaya was amplified as control using thesame primers and conditions adapted to the expected size(ranging from 1.2 kb up to 7 kb). The 16 kb long C. papayagene homologous to At4g16566 was amplified in two partscovering the first 3.5 kb and the last 4 kb.
To confirm the full length sequence of the amplified cD-NAs of C. papaya, we subjected them to Sanger-sequencing.The amplified cDNA and in one case (homologous geneto At4g16566) the gDNA was purified using the ‘Gene-JET PCR Purification Kit’ (Thermo Scientific Germany,Braunschweig) and without cloning send to sequencing at
GATC Biotech AG (Cologne, Germany). We used the PCR-amplification primer to completely sequence the cDNAfrom both sides. Direct sequencing was used to avoid pointmutations which could have been introduced by PCR. Inthe case of the gene homologous to At4g38240, the pa-paya cDNA sequence was unreadable and therefore clonedusing the ‘InsTAclone PCR Cloning Kit’ (Thermo Scien-tific Germany, Braunschweig). After cloning we performedamplification by M13 forward and reverse primer (cf. Sup-plementary Table S7) flanking the multiple cloning site ofpTZ57R/T.
Next Generation Sequencing data
Three transgenic N. benthamiana plants were grown on soilunder 8 h light (120 �Em−2) and 16 h dark at 20◦C. Thetransgene, an expression cassette facilitating the expressionof a stroma targeted eGFP, was introduced into N. ben-thamiana for the purpose of examining the plastids as partof another experiment (for details cf. (20,21)). A total of∼100 mg of plant tissue was harvested from the third andfourth leaves of six week old plants. The Qiagen RNeasyPlant Mini Kit was used to isolate total RNA from the threeplants (three biological replicates), which was then sent toMWG Eurofins (Ebersberg, Germany) for RNA sequenc-ing with Illumina HiSeq 2000 (v3.0 chemistry). RNA-seqdata have been submitted to ENA and are available understudy accession number PRJEB11424.
We independently mapped the RNA-seq triplicates us-ing TopHat2 (22) v2.0.12 to the Nicotiana benthamianagenome v0.4.4 using parameter --library-type=fr-firststrand for strand specificity. For each of thethree mapping files, we assembled transcripts using Cuf-flinks (23) v2.2.1 using parameter--library-type fr-firststrand for strand specificity. We finally merged thethree resulting transcript annotations using cuffmerge. Thetranscripts reported by cuffmerge were then shortened tothe longest reading frame starting with a start codon andending with a stop codon and non-coding exons are re-moved, since the predictions of all tools considered arebased only on coding regions of the corresponding tran-scripts.
RESULTS
In this section, we analyze the performance of GeMoMaon plant and animal genomes. Due to the different intronsize distributions in these kingdoms, we set in all studies themaximum intron length of GeMoMa for plants to 15 kband for animals to 200 kb.
Best reciprocal hits – Benchmark
In a pilot study, we tested the performance of GeMoMaon the modified projector data set (8,9) for the predic-tion of mouse transcripts given the approximate regions ofthe mouse genome and human reference transcripts. Wefind that GeneMapper, which is no longer available, andGeMoMa perform comparable, while they clearly outper-form the remaining tools especially for the categories exonand gene (Text S2).
e89 Nucleic Acids Research, 2016, Vol. 44, No. 9 PAGE 4 OF 11
Based on these promising results, we performed a largebenchmark study using the extended BRH approach forpredicting gene models in animal and plant genomes, in-cluding Homo sapiens (HS), Mus musculus (MM), Gallusgallus (GG), as well as Arabidopsis thaliana (AT), Arabidop-sis lyrata (AL), Carica papaya (CP), Solanum tuberosum(ST) and Oryza sativa (OS). Since H. sapiens and A. thalianahave the best annotated genomes among the selected, weused these as the start and end point of the extended BRHapproach.
We selected the minimal F1 as a measure of accuracy ofa prediction (see Materials and Methods and Text S4). Ba-sically, minimal F1 = 1 indicates a perfect prediction in thesense that the predicted coding exons are perfectly identi-cal to the coding exons of an annotated transcript on thetarget genome, and minimal F1 = 0 indicates a predictionthat does not overlap with any known exons. We may basethe evaluation in the extended BRH on different thresh-olds on the minimal F1 values corresponding to differentlevels of required accuracy. For different thresholds on theminimal F1 measure, we may determine the correspondingnumber of predictions for several categories: correct tran-script, correct gene, correct gene family and wrong predic-tion, whereas the remaining categories can be determinedwithout such a threshold.
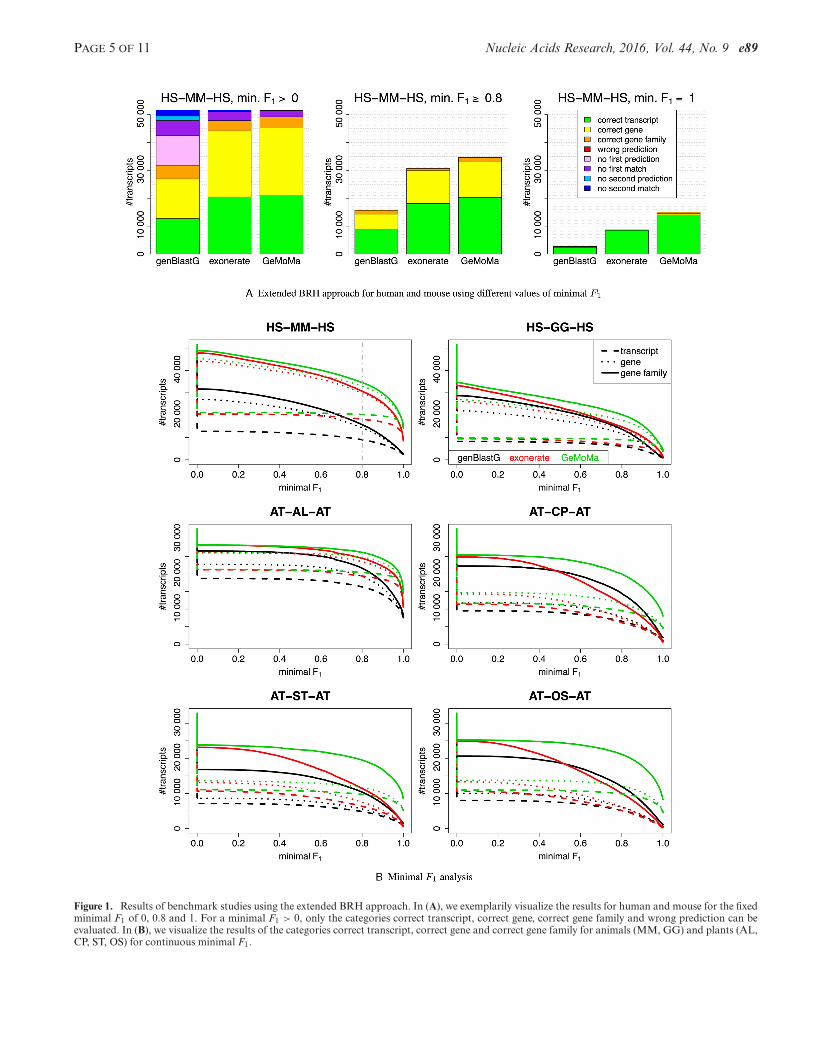
In Figure 1A, we present the results for human and mouseusing the different thresholds. For the threshold of minimalF1 = 1, GeMoMa yields 14 035, 446 and 563 predictionsin the categories correct transcript, correct gene and genefamilies, respectively. By contrast, exonerate and genBlastGyield 8526, 93 and 82 as well as 2430, 108 and 183 predic-tions in the corresponding categories, respectively.
However, different thresholds might give different results.Hence, we tested in total three thresholds, namely minimalF1 > 0, minimal F1 ≥ 0.8 and minimal F1 = 1. In a nut-shell, we find that exonerate and GeMoMa outperform gen-BlastG for these three thresholds, whereas GeMoMa per-forms comparable to exonerate for minimal F1 > 0 andyields a larger number of correct predictions than exoner-ate for minimal F1 ≥ 0.8 and minimal F1 = 1.
These results indicate that the relative performance of ap-proaches depends on the threshold on the minimal F1 val-ues. For this reason, we plot the number of predictions forthe categories correct transcript, correct gene and correctgene family against the minimal F1 in Figure 1B. For humanand mouse (top left panel), we find that exonerate performsbetter than genBlastG and GeMoMa performs better thanexonerate independent of the minimal F1.
Comparing these results with the other results for animalsand plants, we find for the threshold minimal F1 = 1 thatGeMoMa always predicts the highest number of BRHs ofthe category correct transcript (Supplementary Table S5A).The absolute numbers vary between 3807 and 14 514 forGeMoMa, whereas the numbers vary between 231 and 10584 for exonerate and genBlastG. This is equivalent to animprovement between 37% for A. lyrata and 623% for O.sativa using GeMoMa instead of genBlastG or exonerate.
Being less conservative and using the category correctgene family and minimal F1 ≥ 0.8, GeMoMa still outper-forms its competitors. However, the difference is less pro-
nounced, varying between 7% for A. lyrata and 77% for O.sativa.
Comparing the number of predictions versus varyingthresholds on the minimal F1 in Figure 1B, we find thatexonerate often performs better than genBlastG, whereasGeMoMa always performs better than exonerate and gen-BlastG. Especially for C. papaya, S. tuberosum and O.sativa, we find that GeMoMa clearly outperforms the othertools for high values of minimal F1.
In addition, we determined for each of the three toolsand each of the plant and animal genomes those predictedtranscripts that do not match any annotated transcript inthe target organism. If such transcripts are consistently pre-dicted by all three tools, this might increase our confidencein those predictions. We find that the number of predictedtranscripts without match in the target genome varies be-tween 599 for M. musculus and 9607 for G. gallus. Addingthe further constraint that the predictions of the three toolsare located in the same genomic region, the number variesbetween 411 for M. musculus and 8068 for G. gallus (Supple-mentary Table S6). These numbers indicate that there is stilla substantial potential of identifying new transcripts usingtools like genBlastG, exonerate and GeMoMa even in an-notated genomes.
In Figure 1, we also observe that the accuracy of pre-dictions decreases with increasing evolutionary distance ofreference and target organism. To further investigate thisobservation, we consider two extreme examples (A.thalianaversus Chlamydomonas reinhardtii and H. sapiens versusDrosophila melanogaster) in Supplementary Text S8. Wefind that, given the large evolutionary distance betweenthese organisms, the number of perfect predictions (F1 = 1)is extremely low for all three tools. Hence, we conclude thathomology-based gene prediction using any of the tools con-sidered greatly profits from using an evolutionary relatedorganism as reference.
For these genome-wide studies, we fixed all parameters ofGeMoMa as well as genBlastG and exonerate. GeMoMaparameters that might be tuned for specific applications are(i) the maximum intron length, (ii) the parameter ct con-trolling the number of contigs considered and (iii) the sub-stitution matrix. The choice of the maximum intron lengthhas a clear impact on the prediction results only for drasticchanges (e.g. 15 kb versus 200 kb for plants and animals, re-spectively). For the parameterct, lower values yield a largernumber of potential GeMoMa predictions but also result inan increased runtime. As we considered only the top-rankedprediction in the benchmark studies above, these are not af-fected by the choice of ct. We further investigated the influ-ence of the substitution matrix on the results for A. thalianaand O. sativa and found that the performance of GeMoMais quite stable (Text S7).
Importance of intron position conservationWe examined the characteristics of the approaches based onthe predictions between A. thaliana and O. sativa. First, wescrutinized the impact of intron position conservation byrunning GeMoMa on protein sequences instead of exon-wise amino acid subsequences (Text S9). We find that theperformance of GeMoMa without intron position is lowerthan that of GeMoMa using intron position conservation.
PAGE 5 OF 11 Nucleic Acids Research, 2016, Vol. 44, No. 9 e89
Figure 1. Results of benchmark studies using the extended BRH approach. In (A), we exemplarily visualize the results for human and mouse for the fixedminimal F1 of 0, 0.8 and 1. For a minimal F1 > 0, only the categories correct transcript, correct gene, correct gene family and wrong prediction can beevaluated. In (B), we visualize the results of the categories correct transcript, correct gene and correct gene family for animals (MM, GG) and plants (AL,CP, ST, OS) for continuous minimal F1.
e89 Nucleic Acids Research, 2016, Vol. 44, No. 9 PAGE 6 OF 11
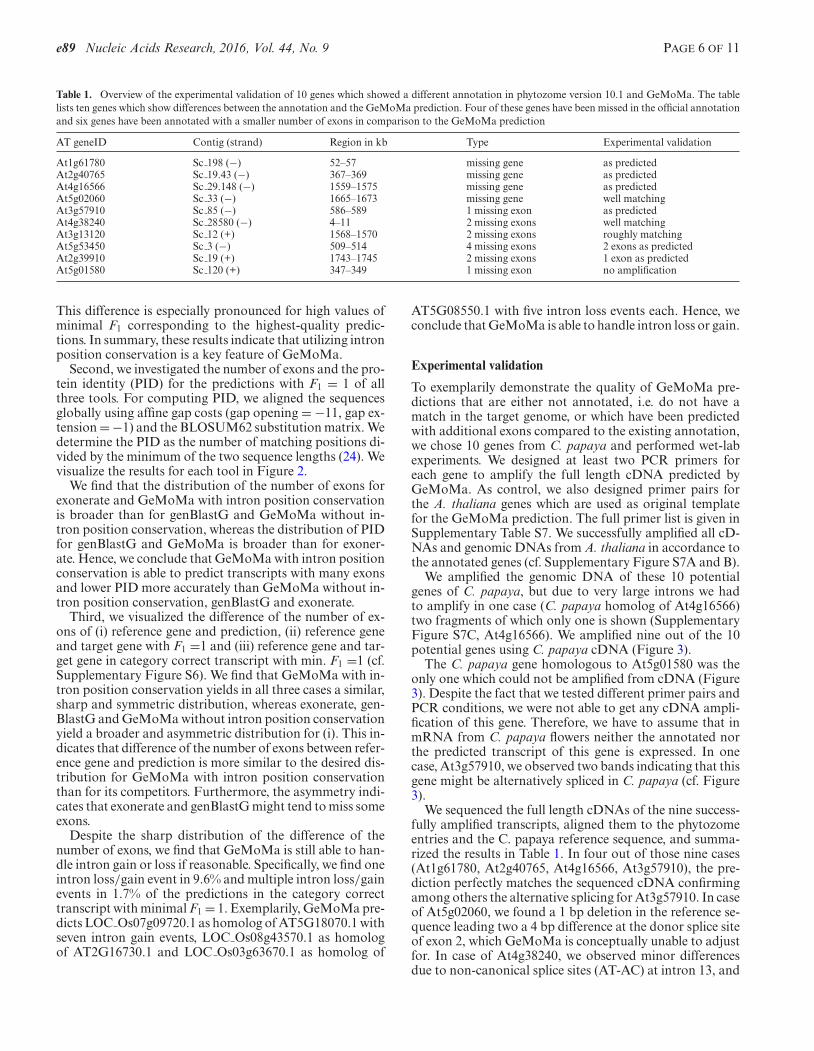
Table 1. Overview of the experimental validation of 10 genes which showed a different annotation in phytozome version 10.1 and GeMoMa. The tablelists ten genes which show differences between the annotation and the GeMoMa prediction. Four of these genes have been missed in the official annotationand six genes have been annotated with a smaller number of exons in comparison to the GeMoMa prediction
AT geneID Contig (strand) Region in kb Type Experimental validation
At1g61780 Sc 198 (−) 52–57 missing gene as predictedAt2g40765 Sc 19.43 (−) 367–369 missing gene as predictedAt4g16566 Sc 29.148 (−) 1559–1575 missing gene as predictedAt5g02060 Sc 33 (−) 1665–1673 missing gene well matchingAt3g57910 Sc 85 (−) 586–589 1 missing exon as predictedAt4g38240 Sc 28580 (−) 4–11 2 missing exons well matchingAt3g13120 Sc 12 (+) 1568–1570 2 missing exons roughly matchingAt5g53450 Sc 3 (−) 509–514 4 missing exons 2 exons as predictedAt2g39910 Sc 19 (+) 1743–1745 2 missing exons 1 exon as predictedAt5g01580 Sc 120 (+) 347–349 1 missing exon no amplification
This difference is especially pronounced for high values ofminimal F1 corresponding to the highest-quality predic-tions. In summary, these results indicate that utilizing intronposition conservation is a key feature of GeMoMa.
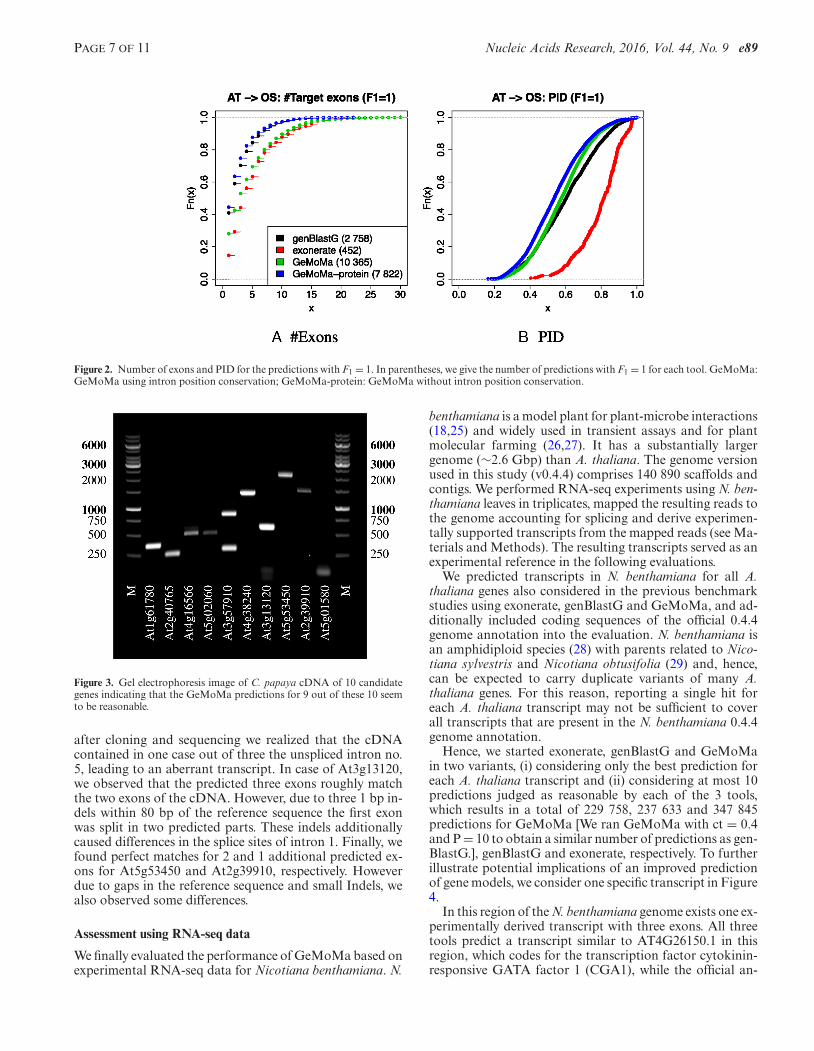
Second, we investigated the number of exons and the pro-tein identity (PID) for the predictions with F1 = 1 of allthree tools. For computing PID, we aligned the sequencesglobally using affine gap costs (gap opening = −11, gap ex-tension = −1) and the BLOSUM62 substitution matrix. Wedetermine the PID as the number of matching positions di-vided by the minimum of the two sequence lengths (24). Wevisualize the results for each tool in Figure 2.
We find that the distribution of the number of exons forexonerate and GeMoMa with intron position conservationis broader than for genBlastG and GeMoMa without in-tron position conservation, whereas the distribution of PIDfor genBlastG and GeMoMa is broader than for exoner-ate. Hence, we conclude that GeMoMa with intron positionconservation is able to predict transcripts with many exonsand lower PID more accurately than GeMoMa without in-tron position conservation, genBlastG and exonerate.
Third, we visualized the difference of the number of ex-ons of (i) reference gene and prediction, (ii) reference geneand target gene with F1 =1 and (iii) reference gene and tar-get gene in category correct transcript with min. F1 =1 (cf.Supplementary Figure S6). We find that GeMoMa with in-tron position conservation yields in all three cases a similar,sharp and symmetric distribution, whereas exonerate, gen-BlastG and GeMoMa without intron position conservationyield a broader and asymmetric distribution for (i). This in-dicates that difference of the number of exons between refer-ence gene and prediction is more similar to the desired dis-tribution for GeMoMa with intron position conservationthan for its competitors. Furthermore, the asymmetry indi-cates that exonerate and genBlastG might tend to miss someexons.
Despite the sharp distribution of the difference of thenumber of exons, we find that GeMoMa is still able to han-dle intron gain or loss if reasonable. Specifically, we find oneintron loss/gain event in 9.6% and multiple intron loss/gainevents in 1.7% of the predictions in the category correcttranscript with minimal F1 = 1. Exemplarily, GeMoMa pre-dicts LOC Os07g09720.1 as homolog of AT5G18070.1 withseven intron gain events, LOC Os08g43570.1 as homologof AT2G16730.1 and LOC Os03g63670.1 as homolog of
AT5G08550.1 with five intron loss events each. Hence, weconclude that GeMoMa is able to handle intron loss or gain.
Experimental validation
To exemplarily demonstrate the quality of GeMoMa pre-dictions that are either not annotated, i.e. do not have amatch in the target genome, or which have been predictedwith additional exons compared to the existing annotation,we chose 10 genes from C. papaya and performed wet-labexperiments. We designed at least two PCR primers foreach gene to amplify the full length cDNA predicted byGeMoMa. As control, we also designed primer pairs forthe A. thaliana genes which are used as original templatefor the GeMoMa prediction. The full primer list is given inSupplementary Table S7. We successfully amplified all cD-NAs and genomic DNAs from A. thaliana in accordance tothe annotated genes (cf. Supplementary Figure S7A and B).
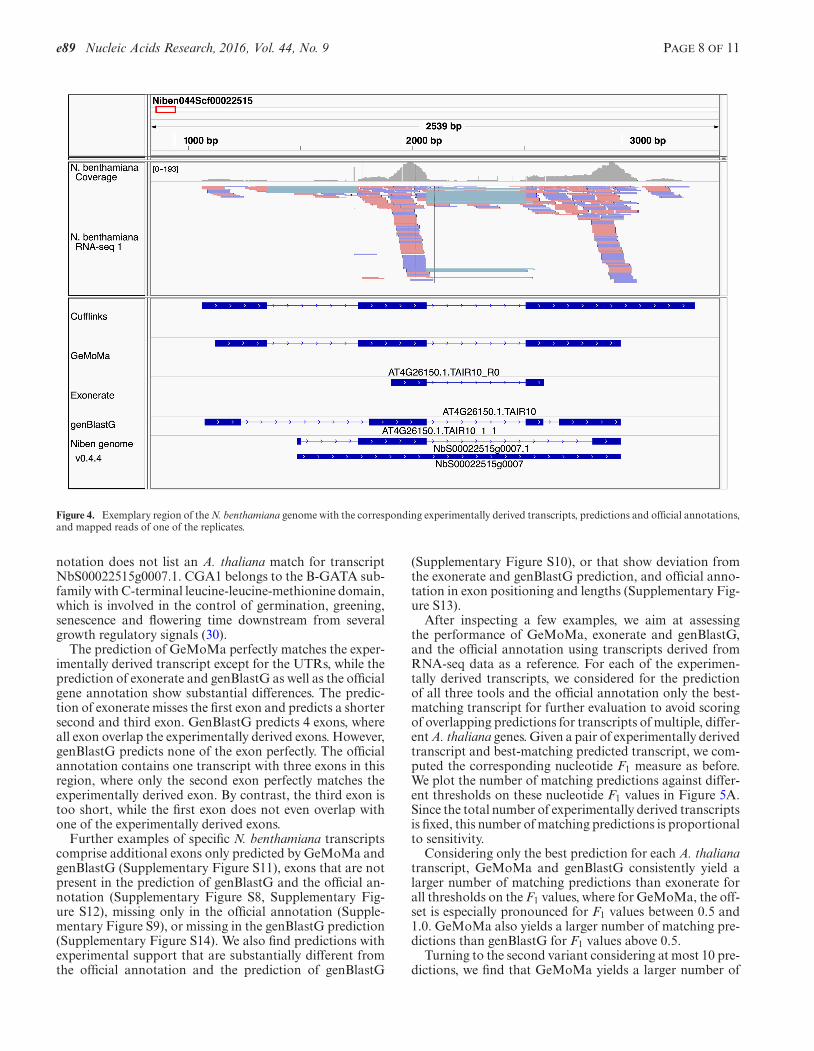
We amplified the genomic DNA of these 10 potentialgenes of C. papaya, but due to very large introns we hadto amplify in one case (C. papaya homolog of At4g16566)two fragments of which only one is shown (SupplementaryFigure S7C, At4g16566). We amplified nine out of the 10potential genes using C. papaya cDNA (Figure 3).
The C. papaya gene homologous to At5g01580 was theonly one which could not be amplified from cDNA (Figure3). Despite the fact that we tested different primer pairs andPCR conditions, we were not able to get any cDNA ampli-fication of this gene. Therefore, we have to assume that inmRNA from C. papaya flowers neither the annotated northe predicted transcript of this gene is expressed. In onecase, At3g57910, we observed two bands indicating that thisgene might be alternatively spliced in C. papaya (cf. Figure3).
We sequenced the full length cDNAs of the nine success-fully amplified transcripts, aligned them to the phytozomeentries and the C. papaya reference sequence, and summa-rized the results in Table 1. In four out of those nine cases(At1g61780, At2g40765, At4g16566, At3g57910), the pre-diction perfectly matches the sequenced cDNA confirmingamong others the alternative splicing for At3g57910. In caseof At5g02060, we found a 1 bp deletion in the reference se-quence leading two a 4 bp difference at the donor splice siteof exon 2, which GeMoMa is conceptually unable to adjustfor. In case of At4g38240, we observed minor differencesdue to non-canonical splice sites (AT-AC) at intron 13, and
PAGE 7 OF 11 Nucleic Acids Research, 2016, Vol. 44, No. 9 e89
Figure 2. Number of exons and PID for the predictions with F1 = 1. In parentheses, we give the number of predictions with F1 = 1 for each tool. GeMoMa:GeMoMa using intron position conservation; GeMoMa-protein: GeMoMa without intron position conservation.
Figure 3. Gel electrophoresis image of C. papaya cDNA of 10 candidategenes indicating that the GeMoMa predictions for 9 out of these 10 seemto be reasonable.
after cloning and sequencing we realized that the cDNAcontained in one case out of three the unspliced intron no.5, leading to an aberrant transcript. In case of At3g13120,we observed that the predicted three exons roughly matchthe two exons of the cDNA. However, due to three 1 bp in-dels within 80 bp of the reference sequence the first exonwas split in two predicted parts. These indels additionallycaused differences in the splice sites of intron 1. Finally, wefound perfect matches for 2 and 1 additional predicted ex-ons for At5g53450 and At2g39910, respectively. Howeverdue to gaps in the reference sequence and small Indels, wealso observed some differences.
Assessment using RNA-seq data
We finally evaluated the performance of GeMoMa based onexperimental RNA-seq data for Nicotiana benthamiana. N.
benthamiana is a model plant for plant-microbe interactions(18,25) and widely used in transient assays and for plantmolecular farming (26,27). It has a substantially largergenome (∼2.6 Gbp) than A. thaliana. The genome versionused in this study (v0.4.4) comprises 140 890 scaffolds andcontigs. We performed RNA-seq experiments using N. ben-thamiana leaves in triplicates, mapped the resulting reads tothe genome accounting for splicing and derive experimen-tally supported transcripts from the mapped reads (see Ma-terials and Methods). The resulting transcripts served as anexperimental reference in the following evaluations.
We predicted transcripts in N. benthamiana for all A.thaliana genes also considered in the previous benchmarkstudies using exonerate, genBlastG and GeMoMa, and ad-ditionally included coding sequences of the official 0.4.4genome annotation into the evaluation. N. benthamiana isan amphidiploid species (28) with parents related to Nico-tiana sylvestris and Nicotiana obtusifolia (29) and, hence,can be expected to carry duplicate variants of many A.thaliana genes. For this reason, reporting a single hit foreach A. thaliana transcript may not be sufficient to coverall transcripts that are present in the N. benthamiana 0.4.4genome annotation.
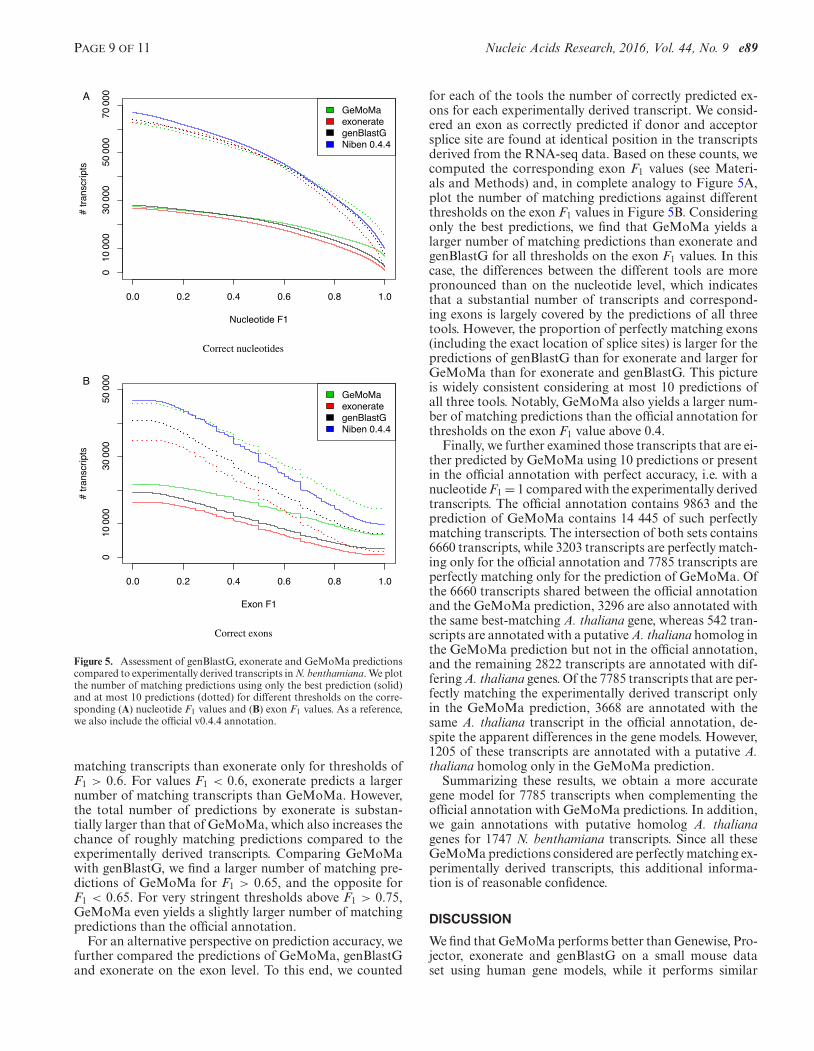
Hence, we started exonerate, genBlastG and GeMoMain two variants, (i) considering only the best prediction foreach A. thaliana transcript and (ii) considering at most 10predictions judged as reasonable by each of the 3 tools,which results in a total of 229 758, 237 633 and 347 845predictions for GeMoMa [We ran GeMoMa with ct = 0.4and P = 10 to obtain a similar number of predictions as gen-BlastG.], genBlastG and exonerate, respectively. To furtherillustrate potential implications of an improved predictionof gene models, we consider one specific transcript in Figure4.
In this region of the N. benthamiana genome exists one ex-perimentally derived transcript with three exons. All threetools predict a transcript similar to AT4G26150.1 in thisregion, which codes for the transcription factor cytokinin-responsive GATA factor 1 (CGA1), while the official an-
e89 Nucleic Acids Research, 2016, Vol. 44, No. 9 PAGE 8 OF 11
Figure 4. Exemplary region of the N. benthamiana genome with the corresponding experimentally derived transcripts, predictions and official annotations,and mapped reads of one of the replicates.
notation does not list an A. thaliana match for transcriptNbS00022515g0007.1. CGA1 belongs to the B-GATA sub-family with C-terminal leucine-leucine-methionine domain,which is involved in the control of germination, greening,senescence and flowering time downstream from severalgrowth regulatory signals (30).
The prediction of GeMoMa perfectly matches the exper-imentally derived transcript except for the UTRs, while theprediction of exonerate and genBlastG as well as the officialgene annotation show substantial differences. The predic-tion of exonerate misses the first exon and predicts a shortersecond and third exon. GenBlastG predicts 4 exons, whereall exon overlap the experimentally derived exons. However,genBlastG predicts none of the exon perfectly. The officialannotation contains one transcript with three exons in thisregion, where only the second exon perfectly matches theexperimentally derived exon. By contrast, the third exon istoo short, while the first exon does not even overlap withone of the experimentally derived exons.
Further examples of specific N. benthamiana transcriptscomprise additional exons only predicted by GeMoMa andgenBlastG (Supplementary Figure S11), exons that are notpresent in the prediction of genBlastG and the official an-notation (Supplementary Figure S8, Supplementary Fig-ure S12), missing only in the official annotation (Supple-mentary Figure S9), or missing in the genBlastG prediction(Supplementary Figure S14). We also find predictions withexperimental support that are substantially different fromthe official annotation and the prediction of genBlastG
(Supplementary Figure S10), or that show deviation fromthe exonerate and genBlastG prediction, and official anno-tation in exon positioning and lengths (Supplementary Fig-ure S13).
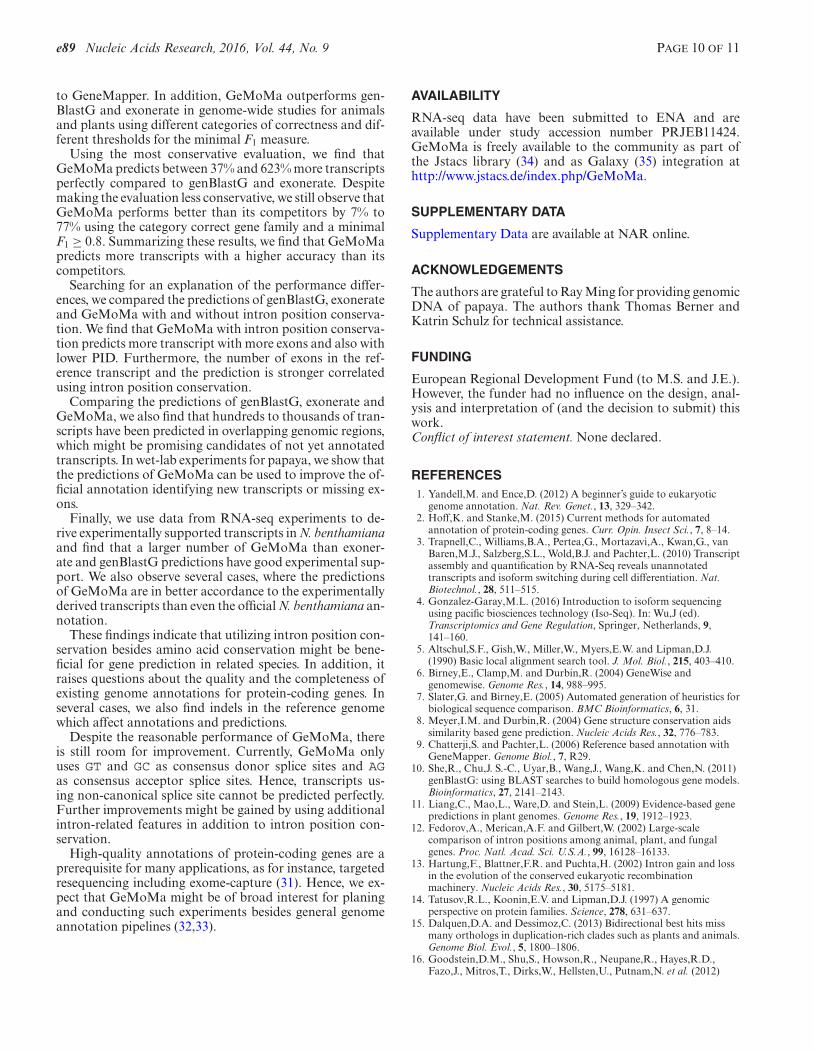
After inspecting a few examples, we aim at assessingthe performance of GeMoMa, exonerate and genBlastG,and the official annotation using transcripts derived fromRNA-seq data as a reference. For each of the experimen-tally derived transcripts, we considered for the predictionof all three tools and the official annotation only the best-matching transcript for further evaluation to avoid scoringof overlapping predictions for transcripts of multiple, differ-ent A. thaliana genes. Given a pair of experimentally derivedtranscript and best-matching predicted transcript, we com-puted the corresponding nucleotide F1 measure as before.We plot the number of matching predictions against differ-ent thresholds on these nucleotide F1 values in Figure 5A.Since the total number of experimentally derived transcriptsis fixed, this number of matching predictions is proportionalto sensitivity.
Considering only the best prediction for each A. thalianatranscript, GeMoMa and genBlastG consistently yield alarger number of matching predictions than exonerate forall thresholds on the F1 values, where for GeMoMa, the off-set is especially pronounced for F1 values between 0.5 and1.0. GeMoMa also yields a larger number of matching pre-dictions than genBlastG for F1 values above 0.5.
Turning to the second variant considering at most 10 pre-dictions, we find that GeMoMa yields a larger number of
PAGE 9 OF 11 Nucleic Acids Research, 2016, Vol. 44, No. 9 e89
B
A
Figure 5. Assessment of genBlastG, exonerate and GeMoMa predictionscompared to experimentally derived transcripts in N. benthamiana. We plotthe number of matching predictions using only the best prediction (solid)and at most 10 predictions (dotted) for different thresholds on the corre-sponding (A) nucleotide F1 values and (B) exon F1 values. As a reference,we also include the official v0.4.4 annotation.
matching transcripts than exonerate only for thresholds ofF1 > 0.6. For values F1 < 0.6, exonerate predicts a largernumber of matching transcripts than GeMoMa. However,the total number of predictions by exonerate is substan-tially larger than that of GeMoMa, which also increases thechance of roughly matching predictions compared to theexperimentally derived transcripts. Comparing GeMoMawith genBlastG, we find a larger number of matching pre-dictions of GeMoMa for F1 > 0.65, and the opposite forF1 < 0.65. For very stringent thresholds above F1 > 0.75,GeMoMa even yields a slightly larger number of matchingpredictions than the official annotation.
For an alternative perspective on prediction accuracy, wefurther compared the predictions of GeMoMa, genBlastGand exonerate on the exon level. To this end, we counted
for each of the tools the number of correctly predicted ex-ons for each experimentally derived transcript. We consid-ered an exon as correctly predicted if donor and acceptorsplice site are found at identical position in the transcriptsderived from the RNA-seq data. Based on these counts, wecomputed the corresponding exon F1 values (see Materi-als and Methods) and, in complete analogy to Figure 5A,plot the number of matching predictions against differentthresholds on the exon F1 values in Figure 5B. Consideringonly the best predictions, we find that GeMoMa yields alarger number of matching predictions than exonerate andgenBlastG for all thresholds on the exon F1 values. In thiscase, the differences between the different tools are morepronounced than on the nucleotide level, which indicatesthat a substantial number of transcripts and correspond-ing exons is largely covered by the predictions of all threetools. However, the proportion of perfectly matching exons(including the exact location of splice sites) is larger for thepredictions of genBlastG than for exonerate and larger forGeMoMa than for exonerate and genBlastG. This pictureis widely consistent considering at most 10 predictions ofall three tools. Notably, GeMoMa also yields a larger num-ber of matching predictions than the official annotation forthresholds on the exon F1 value above 0.4.
Finally, we further examined those transcripts that are ei-ther predicted by GeMoMa using 10 predictions or presentin the official annotation with perfect accuracy, i.e. with anucleotide F1 = 1 compared with the experimentally derivedtranscripts. The official annotation contains 9863 and theprediction of GeMoMa contains 14 445 of such perfectlymatching transcripts. The intersection of both sets contains6660 transcripts, while 3203 transcripts are perfectly match-ing only for the official annotation and 7785 transcripts areperfectly matching only for the prediction of GeMoMa. Ofthe 6660 transcripts shared between the official annotationand the GeMoMa prediction, 3296 are also annotated withthe same best-matching A. thaliana gene, whereas 542 tran-scripts are annotated with a putative A. thaliana homolog inthe GeMoMa prediction but not in the official annotation,and the remaining 2822 transcripts are annotated with dif-fering A. thaliana genes. Of the 7785 transcripts that are per-fectly matching the experimentally derived transcript onlyin the GeMoMa prediction, 3668 are annotated with thesame A. thaliana transcript in the official annotation, de-spite the apparent differences in the gene models. However,1205 of these transcripts are annotated with a putative A.thaliana homolog only in the GeMoMa prediction.
Summarizing these results, we obtain a more accurategene model for 7785 transcripts when complementing theofficial annotation with GeMoMa predictions. In addition,we gain annotations with putative homolog A. thalianagenes for 1747 N. benthamiana transcripts. Since all theseGeMoMa predictions considered are perfectly matching ex-perimentally derived transcripts, this additional informa-tion is of reasonable confidence.
DISCUSSION
We find that GeMoMa performs better than Genewise, Pro-jector, exonerate and genBlastG on a small mouse dataset using human gene models, while it performs similar
e89 Nucleic Acids Research, 2016, Vol. 44, No. 9 PAGE 10 OF 11
to GeneMapper. In addition, GeMoMa outperforms gen-BlastG and exonerate in genome-wide studies for animalsand plants using different categories of correctness and dif-ferent thresholds for the minimal F1 measure.
Using the most conservative evaluation, we find thatGeMoMa predicts between 37% and 623% more transcriptsperfectly compared to genBlastG and exonerate. Despitemaking the evaluation less conservative, we still observe thatGeMoMa performs better than its competitors by 7% to77% using the category correct gene family and a minimalF1 ≥ 0.8. Summarizing these results, we find that GeMoMapredicts more transcripts with a higher accuracy than itscompetitors.
Searching for an explanation of the performance differ-ences, we compared the predictions of genBlastG, exonerateand GeMoMa with and without intron position conserva-tion. We find that GeMoMa with intron position conserva-tion predicts more transcript with more exons and also withlower PID. Furthermore, the number of exons in the ref-erence transcript and the prediction is stronger correlatedusing intron position conservation.
Comparing the predictions of genBlastG, exonerate andGeMoMa, we also find that hundreds to thousands of tran-scripts have been predicted in overlapping genomic regions,which might be promising candidates of not yet annotatedtranscripts. In wet-lab experiments for papaya, we show thatthe predictions of GeMoMa can be used to improve the of-ficial annotation identifying new transcripts or missing ex-ons.
Finally, we use data from RNA-seq experiments to de-rive experimentally supported transcripts in N. benthamianaand find that a larger number of GeMoMa than exoner-ate and genBlastG predictions have good experimental sup-port. We also observe several cases, where the predictionsof GeMoMa are in better accordance to the experimentallyderived transcripts than even the official N. benthamiana an-notation.
These findings indicate that utilizing intron position con-servation besides amino acid conservation might be bene-ficial for gene prediction in related species. In addition, itraises questions about the quality and the completeness ofexisting genome annotations for protein-coding genes. Inseveral cases, we also find indels in the reference genomewhich affect annotations and predictions.
Despite the reasonable performance of GeMoMa, thereis still room for improvement. Currently, GeMoMa onlyuses GT and GC as consensus donor splice sites and AGas consensus acceptor splice sites. Hence, transcripts us-ing non-canonical splice site cannot be predicted perfectly.Further improvements might be gained by using additionalintron-related features in addition to intron position con-servation.
High-quality annotations of protein-coding genes are aprerequisite for many applications, as for instance, targetedresequencing including exome-capture (31). Hence, we ex-pect that GeMoMa might be of broad interest for planingand conducting such experiments besides general genomeannotation pipelines (32,33).
AVAILABILITY
RNA-seq data have been submitted to ENA and areavailable under study accession number PRJEB11424.GeMoMa is freely available to the community as part ofthe Jstacs library (34) and as Galaxy (35) integration athttp://www.jstacs.de/index.php/GeMoMa.
SUPPLEMENTARY DATA
Supplementary Data are available at NAR online.
ACKNOWLEDGEMENTS
The authors are grateful to Ray Ming for providing genomicDNA of papaya. The authors thank Thomas Berner andKatrin Schulz for technical assistance.
FUNDING
European Regional Development Fund (to M.S. and J.E.).However, the funder had no influence on the design, anal-ysis and interpretation of (and the decision to submit) thiswork.Conflict of interest statement. None declared.
REFERENCES1. Yandell,M. and Ence,D. (2012) A beginner’s guide to eukaryotic
genome annotation. Nat. Rev. Genet., 13, 329–342.2. Hoff,K. and Stanke,M. (2015) Current methods for automated
annotation of protein-coding genes. Curr. Opin. Insect Sci., 7, 8–14.3. Trapnell,C., Williams,B.A., Pertea,G., Mortazavi,A., Kwan,G., van
Baren,M.J., Salzberg,S.L., Wold,B.J. and Pachter,L. (2010) Transcriptassembly and quantification by RNA-Seq reveals unannotatedtranscripts and isoform switching during cell differentiation. Nat.Biotechnol., 28, 511–515.
4. Gonzalez-Garay,M.L. (2016) Introduction to isoform sequencingusing pacific biosciences technology (Iso-Seq). In: Wu,J (ed).Transcriptomics and Gene Regulation, Springer, Netherlands, 9,141–160.
5. Altschul,S.F., Gish,W., Miller,W., Myers,E.W. and Lipman,D.J.(1990) Basic local alignment search tool. J. Mol. Biol., 215, 403–410.
6. Birney,E., Clamp,M. and Durbin,R. (2004) GeneWise andgenomewise. Genome Res., 14, 988–995.
7. Slater,G. and Birney,E. (2005) Automated generation of heuristics forbiological sequence comparison. BMC Bioinformatics, 6, 31.
8. Meyer,I.M. and Durbin,R. (2004) Gene structure conservation aidssimilarity based gene prediction. Nucleic Acids Res., 32, 776–783.
9. Chatterji,S. and Pachter,L. (2006) Reference based annotation withGeneMapper. Genome Biol., 7, R29.
10. She,R., Chu,J. S.-C., Uyar,B., Wang,J., Wang,K. and Chen,N. (2011)genBlastG: using BLAST searches to build homologous gene models.Bioinformatics, 27, 2141–2143.
11. Liang,C., Mao,L., Ware,D. and Stein,L. (2009) Evidence-based genepredictions in plant genomes. Genome Res., 19, 1912–1923.
12. Fedorov,A., Merican,A.F. and Gilbert,W. (2002) Large-scalecomparison of intron positions among animal, plant, and fungalgenes. Proc. Natl. Acad. Sci. U.S.A., 99, 16128–16133.
13. Hartung,F., Blattner,F.R. and Puchta,H. (2002) Intron gain and lossin the evolution of the conserved eukaryotic recombinationmachinery. Nucleic Acids Res., 30, 5175–5181.
14. Tatusov,R.L., Koonin,E.V. and Lipman,D.J. (1997) A genomicperspective on protein families. Science, 278, 631–637.
15. Dalquen,D.A. and Dessimoz,C. (2013) Bidirectional best hits missmany orthologs in duplication-rich clades such as plants and animals.Genome Biol. Evol., 5, 1800–1806.
16. Goodstein,D.M., Shu,S., Howson,R., Neupane,R., Hayes,R.D.,Fazo,J., Mitros,T., Dirks,W., Hellsten,U., Putnam,N. et al. (2012)
PAGE 11 OF 11 Nucleic Acids Research, 2016, Vol. 44, No. 9 e89
Phytozome: a comparative platform for green plant genomics. NucleicAcids Res., 40, D1178–D1186.
17. Flicek,P., Amode,M.R., Barrell,D., Beal,K., Billis,K., Brent,S.,Carvalho-Silva,D., Clapham,P., Coates,G., Fitzgerald,S. et al. (2014)Ensembl 2014. Nucleic Acids Res., 42, D749–D755.
18. Bombarely,A., Rosli,H.G., Vrebalov,J., Moffett,P., Mueller,L.A. andMartin,G.B. (2012) A draft genome sequence of nicotianabenthamiana to enhance molecular plant-microbe biology research.Mol. Plant Microbe Interact., 25, 1523–1530.
19. Kasajima,I., Ide,Y., Ohkama-Ohtsu,N., Hayashi,H., Yoneyama,T.and Fujiwara,T. (2004) A protocol for rapid DNA extraction fromArabidopsis thaliana for PCR analysis. Plant Mol. Biol. Rep., 22,49–52.
20. Erickson,J., Ziegler,J., Guevara,D., Abel,S., Klosgen,R., Mathur,J.,Rothstein,S. and Schattat,M. (2014) Agrobacterium-derivedcytokinin influences plastid morphology and starch accumulation inNicotiana benthamiana during transient assays. BMC Plant Biol., 14,127.
21. Schattat,M., Barton,K., Baudisch,B., Klosgen,R.B. and Mathur,J.(2011) Plastid stromule branching coincides with contiguousendoplasmic reticulum dynamics. Plant Physiol., 155, 1667–1677.
22. Kim,D., Pertea,G., Trapnell,C., Pimentel,H., Kelley,R. andSalzberg,S.L. (2013) TopHat2: accurate alignment of transcriptomesin the presence of insertions, deletions and gene fusions. GenomeBiol., 14, R36.
23. Trapnell,C., Roberts,A., Goff,L., Pertea,G., Kim,D., Kelley,D.R.,Pimentel,H., Salzberg,S.L., Rinn,J.L. and Pachter,L. (2012)Differential gene and transcript expression analysis of RNA-seqexperiments with TopHat and Cufflinks. Nat. Protoc., 7, 562–578.
24. Raghava,G. and Barton,G. (2006) Quantification of the variation inpercentage identity for protein sequence alignments. BMCBioinformatics, 7, 415.
25. Goodin,M.M., Zaitlin,D., Naidu,R.A. and Lommel,S.A. (2008)Nicotiana benthamiana: its history and future as a model forplant-pathogen interactions. Mol. Plant Microbe Interact., 21,1015–1026.
26. Gleba,Y., Klimyuk,V. and Marillonnet,S. (2005) Magnifection – anew platform for expressing recombinant vaccines in plants. Vaccine,23, 2042–2048.
27. Gleba,Y., Klimyuk,V. and Marillonnet,S. (2007) Viral vectors for theexpression of proteins in plants. Curr. Opin. Biotechnol., 18, 134–141.
28. Sierro,N., Battey,J., Ouadi,S., Bovet,L., Goepfert,S., Bakaher,N.,Peitsch,M. and Ivanov,N. (2013) Reference genomes andtranscriptomes of Nicotiana sylvestris and Nicotianatomentosiformis. Genome Biol., 14, R60.
29. Jones,L., Keining,T., Eamens,A. and Vaistij,F.E. (2006)Virus-induced gene silencing of argonaute genes in nicotianabenthamiana demonstrates that extensive systemic silencing requiresArgonaute1-like and Argonaute4-like genes. Plant Physiol., 141,598–606.
30. Behringer,C. and Schwechheimer,C. (2015) B-GATA transcriptionfactors - insights into their structure, regulation and role in plantdevelopment. Front. Plant Sci., 6, 90.
31. Bamshad,M.J., Ng,S.B., Bigham,A.W., Tabor,H.K., Emond,M.J.,Nickerson,D.A. and Shendure,J. (2011) Exome sequencing as a toolfor Mendelian disease gene discovery. Nat. Rev. Genet., 12, 745–755.
32. Allen,J.E., Pertea,M. and Salzberg,S.L. (2004) Computational GenePrediction Using Multiple Sources of Evidence. Genome Res., 14,142–148.
33. Zickmann,F. and Renard,B.Y. (2015) IPred - integrating ab initio andevidence based gene predictions to improve prediction accuracy.BMC Genomics, 16, 134.
34. Grau,J., Keilwagen,J., Gohr,A., Haldemann,B., Posch,S. andGrosse,I. (2012) Jstacs: a java framework for statistical analysis andclassification of biological sequences. J. Mach. Learn. Res., 13,1967–1971.
35. Goecks,J., Nekrutenko,A., Taylor,J. and The Galaxy Team (2010)Galaxy: a comprehensive approach for supporting accessible,reproducible, and transparent computational research in the lifesciences. Genome Biol., 11, R86.