using hand performance measures to predict handedness
TRANSCRIPT
This article was downloaded by: [University of Western Ontario]On: 07 October 2014, At: 01:58Publisher: RoutledgeInforma Ltd Registered in England and Wales Registered Number: 1072954 Registeredoffice: Mortimer House, 37-41 Mortimer Street, London W1T 3JH, UK
Laterality: Asymmetries of Body, Brainand CognitionPublication details, including instructions for authors andsubscription information:http://www.tandfonline.com/loi/plat20
Using hand performance measures topredict handednessSusan Brown a , Eric Roy a , Linda Rohr a & Pamela Bryden ba University of Waterloo, Canadab Wilfrid Laurier University, ON, CanadaPublished online: 21 Sep 2010.
To cite this article: Susan Brown , Eric Roy , Linda Rohr & Pamela Bryden (2006) Using handperformance measures to predict handedness, Laterality: Asymmetries of Body, Brain and Cognition,11:1, 1-14, DOI: 10.1080/1357650054200000440
To link to this article: http://dx.doi.org/10.1080/1357650054200000440
PLEASE SCROLL DOWN FOR ARTICLE
Taylor & Francis makes every effort to ensure the accuracy of all the information (the“Content”) contained in the publications on our platform. However, Taylor & Francis,our agents, and our licensors make no representations or warranties whatsoever as tothe accuracy, completeness, or suitability for any purpose of the Content. Any opinionsand views expressed in this publication are the opinions and views of the authors,and are not the views of or endorsed by Taylor & Francis. The accuracy of the Contentshould not be relied upon and should be independently verified with primary sourcesof information. Taylor and Francis shall not be liable for any losses, actions, claims,proceedings, demands, costs, expenses, damages, and other liabilities whatsoever orhowsoever caused arising directly or indirectly in connection with, in relation to or arisingout of the use of the Content.
This article may be used for research, teaching, and private study purposes. Anysubstantial or systematic reproduction, redistribution, reselling, loan, sub-licensing,systematic supply, or distribution in any form to anyone is expressly forbidden. Terms &Conditions of access and use can be found at http://www.tandfonline.com/page/terms-and-conditions
Using hand performance measures to predict
handedness
Susan G. Brown, Eric A. Roy, and Linda E. Rohr
University of Waterloo, Canada
Pamela J. Bryden
Wilfrid Laurier University, ON, Canada
Handedness is defined by the individual's preference to use one hand pre-dominately for unimanual tasks and the ability to perform these tasks more effi-ciently with one hand (Corey, Hurley, & Foundas, 2001). It is important to useperformance variables to measure handedness because they are more objectivethan traditional hand preference questionnaires (Bryden, Pryde, & Roy, 2000a).The current study develops a predictive model of handedness as measured by theWaterloo Handedness Questionnaire (WHQ) using several performance indicatorsof handedness. A total of 120 individuals (60 right-handers and 60 left-handers)were asked to complete four performance-based tasks: the Grooved Pegboard(GP), the Annett pegboard (AP), finger tapping (FT), and grip strength (GS) aswell as an observational measure of preference, the Wathand Box Test (WBT).Backward linear regression analysis showed that the Wathand Box measure andthe laterality quotients for several performance measures (GP place, AP, and FT)combined to act as the most accurate predictors of hand preference. The predictivemodel of handedness developed is as follows: WHQ = 72.760 ± 0.667(GP place)+ 0.809(FT) + 0.234(WBT) ± 0.748(AP) with an explained variance of 0.836.These results illustrate, as Corey et al. (2001) suggested, that the best predictivemodel of handedness combines preference measures and several performancemeasures that tap into different elements of motor performance. By developing thismodel, it is possible to get an accurate measure of handedness using objectivemeasures.
Handedness is one of the most obvious asymmetries of human behaviour, and
arises from individuals using one hand more often than the other for unimanual
activities (Corey, Hurley, & Foundas, 2001). The relationship between hand
preference, hand performance, and hemispheric asymmetries is crucial to
Address correspondence to Susan G. Brown, Department of Kinesiology, University of Waterloo,
200 University Avenue W, Waterloo, ON N2L 3G1, Canada. Email: [email protected]
This work was supported by grants from NSERC (E.A.R. and P.J.B.) and the Heart and Stroke
Foundation of Ontario (E.A.R.).
# 2006 Psychology Press Ltd
http://www.psypress.com/laterality DOI:10.1080/1357650054200000440
LATERALITY, 2006, 11 (1), 1±14
Dow
nloa
ded
by [
Uni
vers
ity o
f W
este
rn O
ntar
io]
at 0
1:58
07
Oct
ober
201
4
understanding the neural systems that underlie human behavioural asymmetries
(Corey et al., 2001). Specifically, an understanding of the relationship between
hand preference and hand performance will undoubtedly help in examining the
relationship between handedness and cerebral organisation, especially with
respect to language functions, and may ultimately help define the risk of
acquiring specific language disorders that occur more frequently in left-handers
than right-handers, such as aphasia (Bryden, Bulman-Fleming, & MacDonald,
1996).
Both hand preference measures and hand performance measures can be used
to categorise individuals into handedness groups. Preference measures provide a
way of subjectively measuring handedness for unimanual activities, whereas
performance measures afford a more objective measurement of handedness
(Bryden, Pryde, & Roy, 2000b). It is possible to link the subjective preference
measures with the objective performance measures by developing predictive
models of handedness.
The distributions of preference and performance data are different. Whereas
preference measures typically exhibit a bimodal distribution with two handed-
ness groups, performance measures such as peg-moving tasks tend to be dis-
tributed unimodally (Annett, 2002). As a result, there are two identifiable groups
when examining preference data, but not when examining performance data.
Therefore, finding a link between preference and performance data is
challenging, unless the factors that underlie handedness groups are the same for
preference and performance measures (Corey et al., 2001).
Questionnaires offer a convenient means of dividing individuals into hand-
edness groups, as they are easier to administer than performance-based measures
(Bryden et al., 2000b). However, despite the time advantage, measuring hand-
edness with preference measures is not always ideal due to the inherent sub-
jectivity of the task; they rely on the reader's interpretation of the question as
well as ability to imagine oneself performing the particular task (Bryden et al.,
1996). Due to their subjectivity, questionnaires are particularly unreliable when
administered to special populations such as the elderly or children, because
individuals in these populations may have difficulty remembering which hand
they would use to perform certain tasks, and may have difficulty making
appropriate judgement calls about which hand is used in certain circumstances
(Bryden et al., 2000a). In contrast, performance measures have an important
objectivity but require both a greater amount of time and increased resources to
administer compared to preference measures. Despite the objectivity advantage,
preference measures have traditionally been used to divide individuals into
handedness groups due to the ease of administration (Peters, 1998).
Because there are so many different underlying components of hand per-
formance (proximal versus distal musculature, and fine versus gross control), a
combination of performance measures, each emphasising a different aspect of
performance, is important in creating an accurate predictive model of handed-
2 BROWN ET AL.
Dow
nloa
ded
by [
Uni
vers
ity o
f W
este
rn O
ntar
io]
at 0
1:58
07
Oct
ober
201
4
ness (Corey et al., 2001). Some performance measures, such as writing and
throwing a ball, are highly specialised and could be influenced by the indivi-
dual's experience in performing the task, thus skewing the outcome distribution
in favour of the preferred hand (Peters, 1998). To ensure that the performance
tasks are measuring true hand differences, they must be specialised, but not so
much that those differences are due to the individual's experience in performing
the task (Peters, 1998). For example, a task such as writing or sewing would be
specialised enough to show large hand performance differencesÐhowever, the
fact that the participant would routinely perform these tasks with one hand
would skew the results and add a component of differential experience between
the hands to the task performance. Tasks that are less specialised and so meet the
criteria mentioned above include peg-moving tasks as well as finger-tapping
tasks.
The current study attempts to examine in more detail the relationship between
measures of hand preference and measures of hand performance. By establishing
how preference and performance measures are related, it might be possible to
develop effective preference-based measures of handedness that use many of the
same skills as do performance-based measures. In this way, it would be possible
to remove some of the subjectivity of preference measures by basing specific
items on the questionnaire on those performance measures that have been linked
to true lateralisation effects, or developing more robust observational measures
of preference to measure handedness.
METHOD
Participants
Data were collected on 120 volunteers between the ages of 18 and 25. Partici-
pants were not recruited on the basis of gender, but handedness was important:
60 participants were self-proclaimed right-handers (43 females, 17 males) and
60 participants were self-proclaimed left-handers (38 females, 22 males). Rather
than use a sample representative of the population with approximately 90%
right-handers and 10% left-handers, an equal number of right-handed and left-
handed individuals were tested in order to be able to increase the power to find
the relationship between hand preference and hand performance. This paper
does not attempt to predict the probability of being either right- or left-handed
based on test scores, and therefore using an equal number of right- and left-
handers was appropriate. Inclusion in either the right or left hand preference
group was determined with respect to the participant's stated hand preference.
The majority of subjects were recruited from introductory psychology and
psychomotor behaviour classes. All subjects were free from neurological
damage and had corrected to normal vision. The study was approved by the
Office of Research Ethics, and all participants gave informed consent before
beginning the study.
PERFORMANCE MEASURES OF HANDEDNESS 3
Dow
nloa
ded
by [
Uni
vers
ity o
f W
este
rn O
ntar
io]
at 0
1:58
07
Oct
ober
201
4
Apparatus and procedures
The preference and performance tasks used in this study are standard measures
used in research on manual asymmetries, and included a preference measure,
performance measures, and an observational measure of preference (the Wat-
hand Box Test). Hand preference was evaluated using the Waterloo Handedness
Questionnaire and the Wathand Box Test. Hand performance indicators inclu-
ded: two pegboard tasks, a finger-tapping task, and a measure of grip strength.
Participants completed the tasks in a randomised order, however each partici-
pant completed all trials of a single task before moving on to the subsequent
task.
Waterloo Handedness Questionnaire (WHQ). The Waterloo Handedness
Questionnaire was the primary measure of hand preference in the study.
Participants were presented with 20 questions, asking them to indicate which
hand they would use to perform a series of unimanual activities (such as using a
hammer, writing). Some of the items on the questionnaire reflect skilled
performance (i.e., writing) whereas other items reflect relatively unskilled
activities (i.e., opening a drawer). Five possible responses were offered for each
question, allowing the participant to rate the frequency with which they would
use a particular hand for each activity using a 5-point scale (i.e., ``always use the
left hand'', ``usually use the left hand'', ``use both hands equally often'',
``usually use the right hand'', ``always use the right hand''). Each of these
responses was scored as 72, 71, 0, 1, 2 respectively, and the dependent
handedness measure was calculated as the total composite score of these
individual responses. Therefore, right-handed individuals yielded positive scores
on the WHQ whereas left-handed individuals yielded negative scores. For a list
of the questions included in the WHQ, please refer to the Appendix.
Wathand Box Test (WBT). Participants were asked to complete several
unimanual tasks such as lifting a cupboard door, using a toy hammer, placing
rings on hooks, and tossing a ball. The researcher recorded which hand they used
to perform these activities. A laterality quotient was calculated by subtracting
the number of tasks performed with the left hand from the number of tasks
performed with the right hand and dividing by the total number of tasks. This
laterality quotient was renamed the ``Wathand Box Score'', and was used in the
statistical analysis.
Previous research has shown that the WBT is an accurate performance-based
measure of preference and it has been used to measure hand preference in
special populations, including children, where traditional questionnaire-based
measures of preference would not be appropriate (Bryden et al., 2000b).
4 BROWN ET AL.
Dow
nloa
ded
by [
Uni
vers
ity o
f W
este
rn O
ntar
io]
at 0
1:58
07
Oct
ober
201
4
Grooved Pegboard (GP). The GP task provided a measure of manipulative
skill and visuomotor control. The first portion of the GP place phase of the GP
task was completed according to the standard instructions provided in the
Lafayette Instrument Instruction/Owner's Manual for the 32025 Grooved
Pegboard (Lafayette Instruments, 1989). Participants were asked to complete
two trials with each hand in which they were required to move a set of 25 pegs
from a large receptacle to a set of 25 holes. This was called the ``place phase''.
The pegs were irregularly shaped and would therefore only fit into the holes in
one orientation. These pegs were approximately the same size as the holes and
therefore the task required significant skill to complete. In addition to
completing the place phase, participants were required to complete two trials
using an alternative method of administration in which they were required to
remove the pegs from the holes and place them back into the receptacle,
beginning at the bottom of the board, on the contralateral side to the hand being
used (Bryden & Roy, 2005). This was called the ``replace phase''. For both the
place and replace phases, participants first completed each set of trials with their
dominant hand, and in each case, a dropped peg resulted in the trial being
repeated.
The dependent variable for this task was the time required for each compo-
nent to be completed. For the place phase, timing began when the first peg was
placed in the hole and was stopped with the last peg was placed in the hole, and
for the replace phase, timing began when the first peg was placed in the
receptacle and was stopped when the last peg was placed in the receptacle. In
each phase, the average time across the two trials was used in calculating the
laterality quotient.
Annett pegboard (AP). Similar to the GP task, the AP task provided a
measure of skill and speed. All participants were asked to move 10 small dowels
from one horizontal row of holes to a parallel row (located closer to the subject)
as rapidly as possible. Performance was measured by the amount of time
required to complete the peg-moving task. Three trials were completed with
each hand and the times were averaged for each hand. The hand with which
participants began was randomised between subjects, and participants alternated
between performing the task with the starting hand and the other hand.
Participants were requested to begin with their hand on the table and were
provided with a cue to begin the task. Participants were required to move the
pegs, one at a time, beginning on the side of the pegboard contralateral to the
hand being used to perform the task. Timing ended when the last peg was placed
in the hole. As with the Grooved Pegboard task, if the participant dropped a peg,
the trial was repeated.
Finger tapping (FT). The FT task provided a measure of distal muscular
control and coordination. Participants were required to place their hand palm
PERFORMANCE MEASURES OF HANDEDNESS 5
Dow
nloa
ded
by [
Uni
vers
ity o
f W
este
rn O
ntar
io]
at 0
1:58
07
Oct
ober
201
4
down on the table with their index finger extended and on a key. The other
fingers were extended and resting on the table. Participants were asked to tap the
key as many times as possible in a 10-second period, using only the index finger.
Participants completed five trials with the preferred hand, followed by five trials
with the non-preferred hand. For each hand, a rest period of 30 seconds was
offered following the third tapping trial, in order to avoid fatigue. Performance
was measured by the number of taps performed in the 10-second period, and
averaged across repeated trials.
Grip strength (GS). Each participant was required to execute three
maximum grip strength efforts with each hand, while standing with the arm
straight, holding a dynamometer. The participant performed three trials with
each hand, beginning with the preferred hand. Performance was measured in
KgW for each effort and was averaged across all trials.
Data analysis
For the Grooved Pegboard (GP), Annett pegboard (AP), finger-tapping (FT), and
grip strength (GS) tasks described above, performance was expressed as a
laterality quotient, i.e., (Rperformance ± Lperformance) / (Rperformance + Lperformance).
Therefore, for the pegboard tasks, a positive score was indicative of left hand
superiority whereas a negative score was indicative of right hand superiority. For
all other performance measures, a positive score is indicative of right hand
superiority.
RESULTS
In an attempt to remove outlying data points, the data were examined to ensure
that all data points fell within three standard deviations of the mean for each
measure of preference or performance prior to data analysis. Three data points
were removed because they did not meet this criterion. Table 1 presents the
modified means and standard deviations (according to hand preference and
gender) following the exclusion of the outlying values. Subsequent data analysis
was completed based on the trimmed sample.
Upon inspection of the data divided in this manner, it appears as though the
two handedness groups showed similar variability across each of the perfor-
mance variables. While two of the variables (WBT and GS) appeared to show a
fairly large difference in variability (WBT due to the nature of the way in which
the task is scored, and GS due to the gross nature of the task itself) the difference
in variability on any of the performance tasks was not statistically significant (as
calculated by Fisher's F-test for the equality of variances). Despite the observed
equality of variance, the left-handers were less strongly biased to the left than
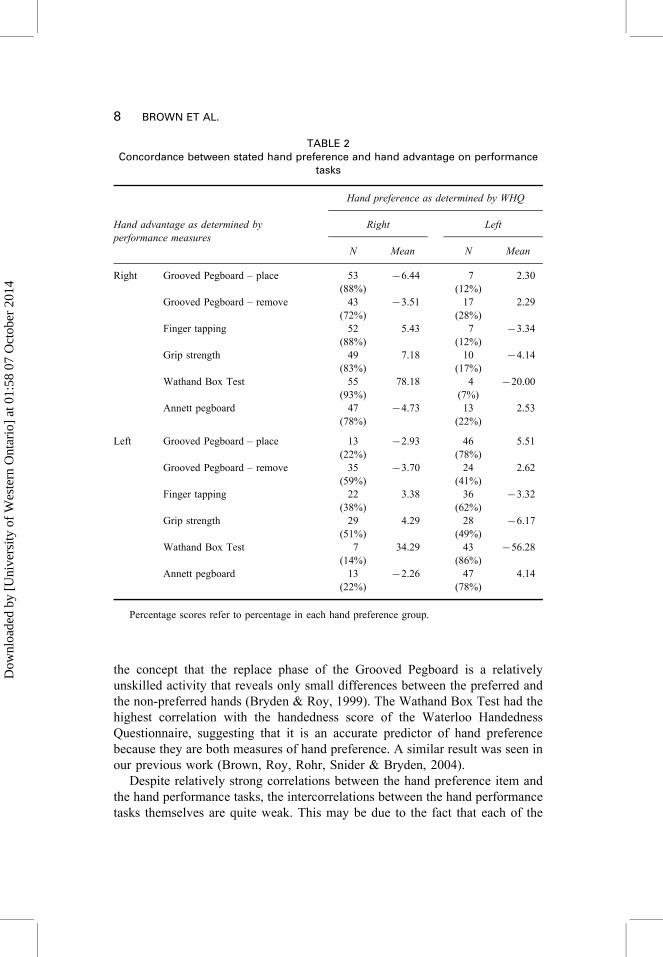
the right-handers were biased to the right. Table 2 presents data about the
concordance of hand advantage (based on outcomes of performance tasks) for
6 BROWN ET AL.
Dow
nloa
ded
by [
Uni
vers
ity o
f W
este
rn O
ntar
io]
at 0
1:58
07
Oct
ober
201
4
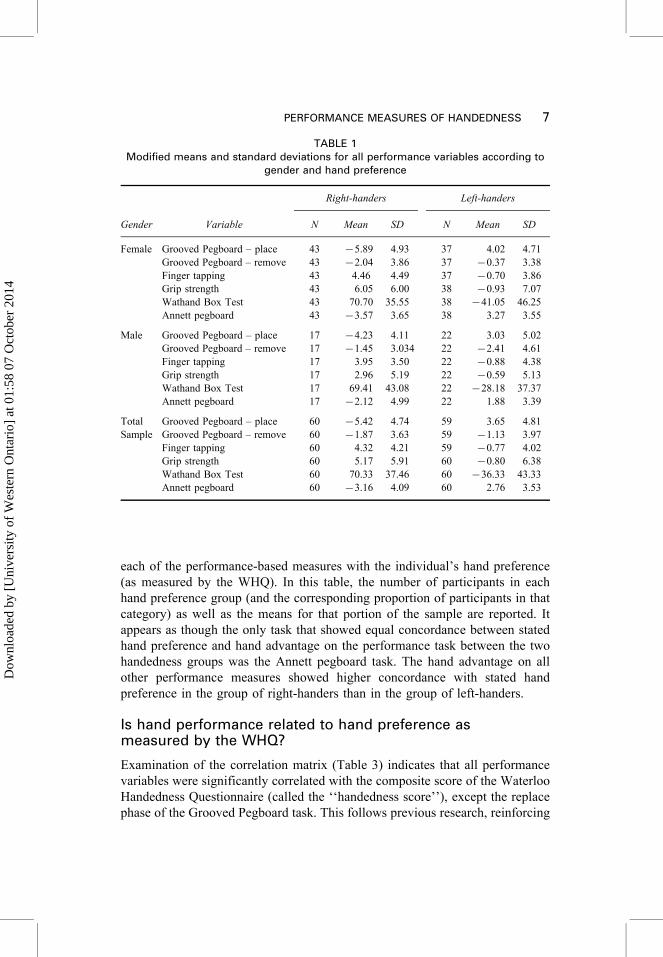
each of the performance-based measures with the individual's hand preference
(as measured by the WHQ). In this table, the number of participants in each
hand preference group (and the corresponding proportion of participants in that
category) as well as the means for that portion of the sample are reported. It
appears as though the only task that showed equal concordance between stated
hand preference and hand advantage on the performance task between the two
handedness groups was the Annett pegboard task. The hand advantage on all
other performance measures showed higher concordance with stated hand
preference in the group of right-handers than in the group of left-handers.
Is hand performance related to hand preference asmeasured by the WHQ?
Examination of the correlation matrix (Table 3) indicates that all performance
variables were significantly correlated with the composite score of the Waterloo
Handedness Questionnaire (called the ``handedness score''), except the replace
phase of the Grooved Pegboard task. This follows previous research, reinforcing
TABLE 1Modified means and standard deviations for all performance variables according to
gender and hand preference
Right-handers Left-handers
Gender Variable N Mean SD N Mean SD
Female Grooved Pegboard ± place 43 75.89 4.93 37 4.02 4.71
Grooved Pegboard ± remove 43 72.04 3.86 37 70.37 3.38
Finger tapping 43 4.46 4.49 37 70.70 3.86
Grip strength 43 6.05 6.00 38 70.93 7.07
Wathand Box Test 43 70.70 35.55 38 741.05 46.25
Annett pegboard 43 73.57 3.65 38 3.27 3.55
Male Grooved Pegboard ± place 17 74.23 4.11 22 3.03 5.02
Grooved Pegboard ± remove 17 71.45 3.034 22 72.41 4.61
Finger tapping 17 3.95 3.50 22 70.88 4.38
Grip strength 17 2.96 5.19 22 70.59 5.13
Wathand Box Test 17 69.41 43.08 22 728.18 37.37
Annett pegboard 17 72.12 4.99 22 1.88 3.39
Total Grooved Pegboard ± place 60 75.42 4.74 59 3.65 4.81
Sample Grooved Pegboard ± remove 60 71.87 3.63 59 71.13 3.97
Finger tapping 60 4.32 4.21 59 70.77 4.02
Grip strength 60 5.17 5.91 60 70.80 6.38
Wathand Box Test 60 70.33 37.46 60 736.33 43.33
Annett pegboard 60 73.16 4.09 60 2.76 3.53
PERFORMANCE MEASURES OF HANDEDNESS 7
Dow
nloa
ded
by [
Uni
vers
ity o
f W
este
rn O
ntar
io]
at 0
1:58
07
Oct
ober
201
4
the concept that the replace phase of the Grooved Pegboard is a relatively
unskilled activity that reveals only small differences between the preferred and
the non-preferred hands (Bryden & Roy, 1999). The Wathand Box Test had the
highest correlation with the handedness score of the Waterloo Handedness
Questionnaire, suggesting that it is an accurate predictor of hand preference
because they are both measures of hand preference. A similar result was seen in
our previous work (Brown, Roy, Rohr, Snider & Bryden, 2004).
Despite relatively strong correlations between the hand preference item and
the hand performance tasks, the intercorrelations between the hand performance
tasks themselves are quite weak. This may be due to the fact that each of the
TABLE 2Concordance between stated hand preference and hand advantage on performance
tasks
Hand preference as determined by WHQ
Hand advantage as determined by Right Left
performance measures
N Mean N Mean
Right Grooved Pegboard ± place 53
(88%)
76.44 7
(12%)
2.30
Grooved Pegboard ± remove 43
(72%)
73.51 17
(28%)
2.29
Finger tapping 52
(88%)
5.43 7
(12%)
73.34
Grip strength 49
(83%)
7.18 10
(17%)
74.14
Wathand Box Test 55
(93%)
78.18 4
(7%)
720.00
Annett pegboard 47
(78%)
74.73 13
(22%)
2.53
Left Grooved Pegboard ± place 13
(22%)
72.93 46
(78%)
5.51
Grooved Pegboard ± remove 35
(59%)
73.70 24
(41%)
2.62
Finger tapping 22
(38%)
3.38 36
(62%)
73.32
Grip strength 29
(51%)
4.29 28
(49%)
76.17
Wathand Box Test 7
(14%)
34.29 43
(86%)
756.28
Annett pegboard 13
(22%)
72.26 47
(78%)
4.14
Percentage scores refer to percentage in each hand preference group.
8 BROWN ET AL.
Dow
nloa
ded
by [
Uni
vers
ity o
f W
este
rn O
ntar
io]
at 0
1:58
07
Oct
ober
201
4
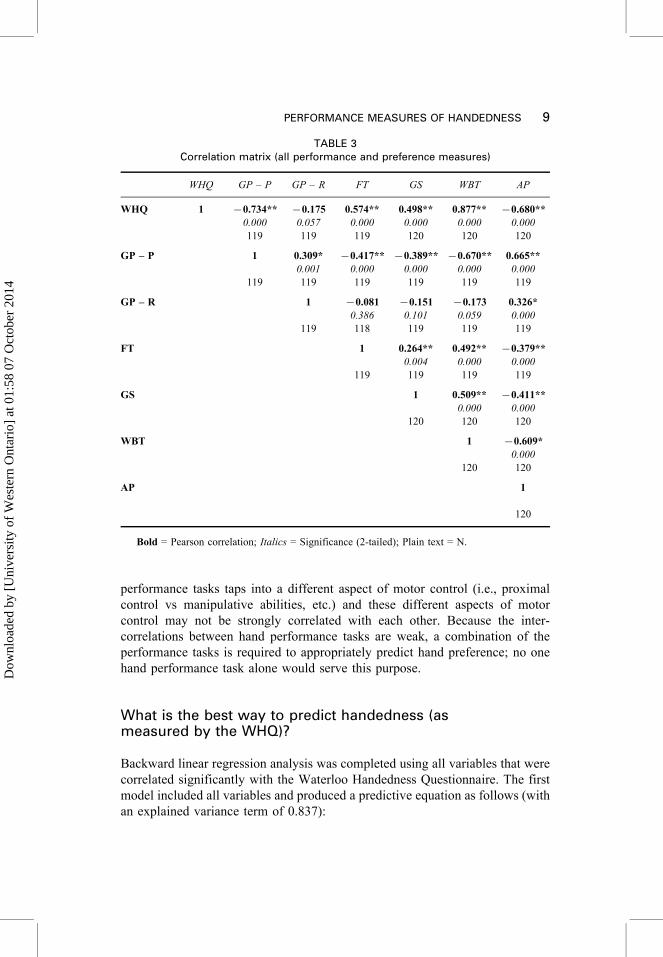
performance tasks taps into a different aspect of motor control (i.e., proximal
control vs manipulative abilities, etc.) and these different aspects of motor
control may not be strongly correlated with each other. Because the inter-
correlations between hand performance tasks are weak, a combination of the
performance tasks is required to appropriately predict hand preference; no one
hand performance task alone would serve this purpose.
What is the best way to predict handedness (asmeasured by the WHQ)?
Backward linear regression analysis was completed using all variables that were
correlated significantly with the Waterloo Handedness Questionnaire. The first
model included all variables and produced a predictive equation as follows (with
an explained variance term of 0.837):
TABLE 3Correlation matrix (all performance and preference measures)
WHQ GP ± P GP ± R FT GS WBT AP
WHQ 1 70.734**
0.000
119
70.175
0.057
119
0.574**
0.000
119
0.498**
0.000
120
0.877**
0.000
120
70.680**
0.000
120
GP ± P 1
119
0.309*
0.001
119
70.417**
0.000
119
70.389**
0.000
119
70.670**
0.000
119
0.665**
0.000
119
GP ± R 1
119
70.081
0.386
118
70.151
0.101
119
70.173
0.059
119
0.326*
0.000
119
FT 1
119
0.264**
0.004
119
0.492**
0.000
119
70.379**
0.000
119
GS 1
120
0.509**
0.000
120
70.411**
0.000
120
WBT 1
120
70.609*
0.000
120
AP 1
120
Bold = Pearson correlation; Italics = Significance (2-tailed); Plain text = N.
PERFORMANCE MEASURES OF HANDEDNESS 9
Dow
nloa
ded
by [
Uni
vers
ity o
f W
este
rn O
ntar
io]
at 0
1:58
07
Oct
ober
201
4
WHQ = 72.942 7 0.665(GP place) + 0.808(FT) + 0.133(GS)
+ 0.228(WBT) 7 0.719(AP) (1)
In this model, the grip strength variable did not contribute significantly (p =
.427), and therefore, a second model was computed excluding the grip strength
variable (this time with an explained variance term of .836, adjusted R2 = .830):
WHQ = 72.760 7 0.667(GP place) + 0.809(FT) + 0.234(WBT) 7 0.748(AP) (2)
The change in explained variance between the first and the second model was
not significant (p = .427), illustrating that the second model was the most
parsimonious predictive model of handedness when WHQ is the dependent
variable. Corey et al. (2001) also found that removing the grip strength variable
from a regression model predicting preference from a series of performance
variables (including finger-tapping and pegboard tasks) did not significantly
reduce the level of explained variance in the model. Therefore, EQ2 is a more
parsimonious model than EQ1, using fewer variables to make as accurate a
prediction as EQ1.
Do the performance variables relate in the sameway to the WHQ and the WBT?
Both the questionnaire and the Wathand Box Test are effective tools for
uncovering performance differences between the hands, and Table 2 shows that
both of these variables are highly correlated with performance on the Annett
pegboard task, which has been widely used as a standard tool for exposing
differential performance between the hands. Because the questionnaire and the
Wathand Box Test are highly correlated with the Annett pegboard scores as
well as with each other, it was important to know whether one of these vari-
ables was statistically more significant at measuring hand preference than the
other. If the performance variables predict the Wathand Box Test score as well
as they predict the questionnaire score, it is possible that the Wathand Box Test
could replace the questionnaire as a performance-based measure of preference
and therefore remove some of the subjectivity associated with preference
measures. In order to test this, two new regression models were developed
using only the performance variables (i.e., Grooved Pegboard, finger tapping,
grip strength, and Annett pegboard) to predict the composite scores from the
two preference measures (the Wathand Box Test and the questionnaire). These
equations differ from EQ2 in that they do not use the questionnaire score as a
predictor variable.
The equations are reported using the unstandardised coefficients, but the
standardised coefficients are reported in Table 4 for future discussion.
Equation 3 used the performance measures to predict the WBT score (with an
explained variance term of .575, adjusted R2 = .559) and was as follows:
10 BROWN ET AL.
Dow
nloa
ded
by [
Uni
vers
ity o
f W
este
rn O
ntar
io]
at 0
1:58
07
Oct
ober
201
4
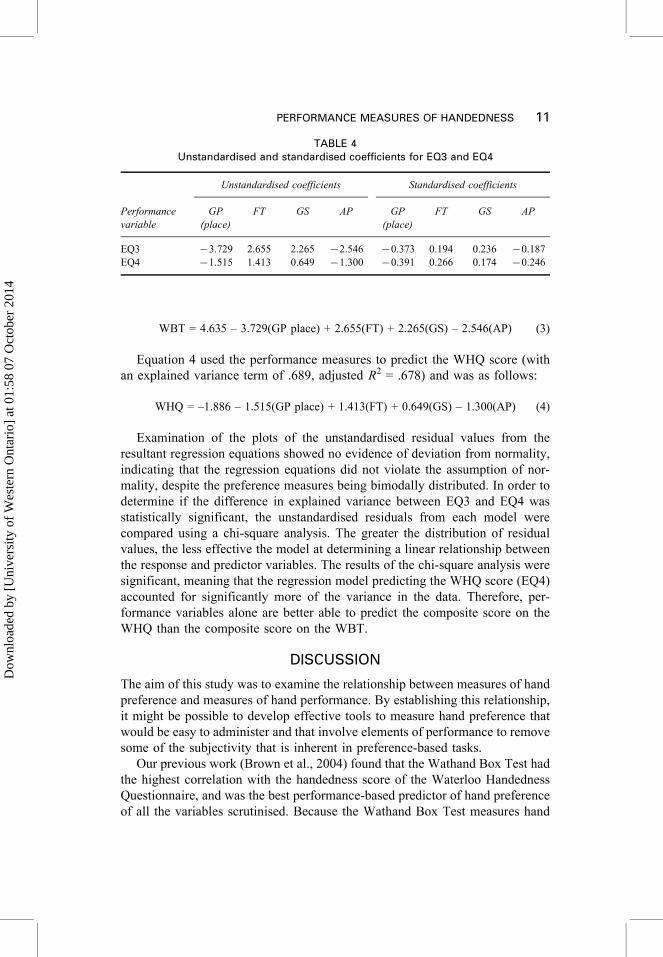
WBT = 4.635 ± 3.729(GP place) + 2.655(FT) + 2.265(GS) ± 2.546(AP) (3)
Equation 4 used the performance measures to predict the WHQ score (with
an explained variance term of .689, adjusted R2 = .678) and was as follows:
WHQ = ±1.886 ± 1.515(GP place) + 1.413(FT) + 0.649(GS) ± 1.300(AP) (4)
Examination of the plots of the unstandardised residual values from the
resultant regression equations showed no evidence of deviation from normality,
indicating that the regression equations did not violate the assumption of nor-
mality, despite the preference measures being bimodally distributed. In order to
determine if the difference in explained variance between EQ3 and EQ4 was
statistically significant, the unstandardised residuals from each model were
compared using a chi-square analysis. The greater the distribution of residual
values, the less effective the model at determining a linear relationship between
the response and predictor variables. The results of the chi-square analysis were
significant, meaning that the regression model predicting the WHQ score (EQ4)
accounted for significantly more of the variance in the data. Therefore, per-
formance variables alone are better able to predict the composite score on the
WHQ than the composite score on the WBT.
DISCUSSION
The aim of this study was to examine the relationship between measures of hand
preference and measures of hand performance. By establishing this relationship,
it might be possible to develop effective tools to measure hand preference that
would be easy to administer and that involve elements of performance to remove
some of the subjectivity that is inherent in preference-based tasks.
Our previous work (Brown et al., 2004) found that the Wathand Box Test had
the highest correlation with the handedness score of the Waterloo Handedness
Questionnaire, and was the best performance-based predictor of hand preference
of all the variables scrutinised. Because the Wathand Box Test measures hand
TABLE 4Unstandardised and standardised coefficients for EQ3 and EQ4
Unstandardised coefficients Standardised coefficients
Performance
variable
GP
(place)
FT GS AP GP
(place)
FT GS AP
EQ3 73.729 2.655 2.265 72.546 70.373 0.194 0.236 70.187
EQ4 71.515 1.413 0.649 71.300 70.391 0.266 0.174 70.246
PERFORMANCE MEASURES OF HANDEDNESS 11
Dow
nloa
ded
by [
Uni
vers
ity o
f W
este
rn O
ntar
io]
at 0
1:58
07
Oct
ober
201
4
preference based on the performance of individual tasks, it is not surprising that
it shows the highest correlation with the traditional preference measure. Simi-
larly, the current work has shown that the Wathand Box Test was indeed the best
predictor of hand preference: it had the highest correlation with the handedness
score of the Waterloo Handedness Questionnaire, lending further support to the
proposition that the Wathand Box Test is a robust alternative to traditional
preference measures such as questionnaires, and may prove more accurate when
working with special populations such as children (Bryden et al., 2000b).
Despite the high correlation between the WBT and the WHQ, the current
analysis has shown that performance-based measures more accurately predict
handedness as measured by the WHQ than they predict handedness as measured
by the WBT. Comparing the standardised coefficients for each of these
regression equations reveals the relative weightings of the performance-based
tasks in each of the equations. It appears that EQ4 (using performance measures
to predict the score on the WHQ test) has greater emphasis on the Grooved
Pegboard, finger-tapping, and Annett pegboard tasks (revealed by higher stan-
dardised coefficients for each of these variables), whereas EQ3 (using perfor-
mance measures to predict the score on the WBT test) emphasises the grip
strength task (revealed by a higher standardised coefficient for this variable). It
is interesting that the performance-based tasks requiring the most skill are more
heavily weighted on the questionnaire task, whereas grip strength, which is the
least skilled performance task due to its lack of manipulative or visuomotor
components, is more heavily weighted on the Wathand Box Test. The fact that
the questionnaire examines many skilled elements while the grip strength
measure is not a skilled activity might explain why the grip strength measure did
not contribute significantly to the equation predicting the questionnaire score
using all of the performance measures (including the Wathand Box Test) (EQ1).
Although the Wathand Box Test does involve skilled activities such as turning a
key in a small lock and using a screwdriver, the questionnaire presents more
skilled activities such as using a needle to sew, using tweezers, etc. Future
analysis examining the individual components of each of the performance-based
tasks will help to explain the relationship between the skilled and unskilled tasks
included on the questionnaire and in the Wathand Box Test, and will serve to
assist in developing preference-based tools that will incorporate both skilled and
unskilled activities. As Corey et al. (2001) suggest, it is difficult to establish a
link between preference and performance measures unless the factors that
underlie these measures are the same for handedness groups and it seems as
though the relative lack of the Wathand Box Test to incorporate skilled activities
as compared with the questionnaire is the reason why traditional performance-
based measures better predict the score on the questionnaire than the score on
the Wathand Box Test.
Peters (1998) suggests that in order to accurately develop a predictive model
of handedness, the performance tasks used must emphasise many different facets
12 BROWN ET AL.
Dow
nloa
ded
by [
Uni
vers
ity o
f W
este
rn O
ntar
io]
at 0
1:58
07
Oct
ober
201
4

of hand performance. Indeed, our predictive model of handedness combined
several types of performance. As has been stated earlier, the Wathand Box Test
serves as an observational measure of preference. Each of the performance tasks
used focuses on a slightly different aspect of hand performance. For instance,
while finger tapping requires good control of the distal musculature, the Annett
pegboard requires that the participant have good control of proximal muscles as
well as distal muscles, and the Grooved Pegboard not only requires strong skill
of both proximal and distal musculature, but it also places high importance on
the use of vision to place the pegs in the appropriate orientation. This result also
supports the work by Corey et al. (2001) by incorporating a combination of
preference- and performance-based measures into the predictive model of
handedness.
In conclusion, the current study developed a predictive model of handedness
that accurately predicted handedness by incorporating both preference and
performance measures of handedness, and including consideration of the dif-
ferent components involved with movement control. Rather than simply linking
the laterality quotients from the performance-based measures with the pre-
ference-based scores, future analysis will study the link between the components
of hand performance such as visuomotor requirements, fine motor control, and
strength contributions of the performance tasks, how these components are
related to the two measures of hand preference, and whether or not gender
differences exist. By examining the components of the standard performance-
based tasks, it will be possible to develop effective performance-based measures
of preference that incorporate movement components from all domains.
Manuscript received 23 November 2004
Revised manuscript received 3 February 2005
PrEview proof published online 21 June 2005
REFERENCES
Annett, M. (2002). Handedness and brain asymmetry: The right shift theory. Hove, UK: Psychology
Press.
Brown, S. G., Roy, E. A., Rohr, L. E., Snider, B. R., & Bryden, P. J. (2004). Preference and
performance measures of handedness. Brain and Cognition, 55, 283±285.
Bryden, M. P., Bulman-Fleming, M. B., & MacDonald, V. (1996). The measurement of handedness
and its relation to neuropsychological issues. In D. Elliott & E. A. Roy (Eds.), Manual asym-
metries in motor performance (pp. 57±81). Boca Raton, FL: CRC Press.
Bryden, P. J., Pryde, K. M., & Roy, E. A. (2000a). A performance measure of the degree of hand
preference. Brain and Cognition, 44, 402±414.
Bryden, P. J., Pryde, K. M., & Roy, E. A. (2000b). A developmental analysis of the relationship
between hand preference and performance: II. A performance-based method of measuring hand
preference in children. Brain and Cognition, 43(1±3), 60±64.
Bryden, P. J., & Roy, E. A. (1999). Spatial task demands affect the extent of manual asymmetries.
Laterality, 4(1), 27±37.
PERFORMANCE MEASURES OF HANDEDNESS 13
Dow
nloa
ded
by [
Uni
vers
ity o
f W
este
rn O
ntar
io]
at 0
1:58
07
Oct
ober
201
4
Bryden, P. J., & Roy, E. A. (2005). A new method of administering the Grooved Pegboard Test:
Performance as a function of handedness and sex. Brain and Cognition, 58, 258±268.
Corey, D. M., Hurley, M. M., & Foundas, A. L. (2001). Right and left handedness defined: A
multivariate approach using hand preference and hand performance measures. Neuropsychiatry,
Neuropsychology and Behavioural Neurology, 14, 144±152.
Lafayette Instrument. (1989). Instruction manual for the 32025 Grooved Pegboard Test. Lafayette
IN: Lafayette Instrument.
Peters, M. (1998). Description and validation of a flexible and broadly usable handedness ques-
tionnaire. Laterality, 3(1), 77±96.
APPENDIX
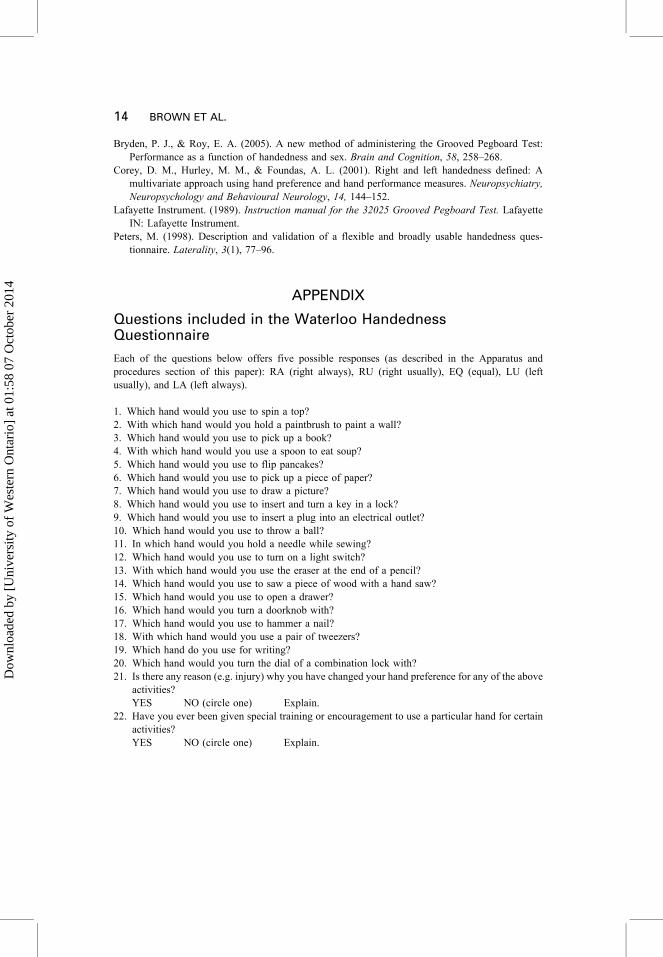
Questions included in the Waterloo HandednessQuestionnaire
Each of the questions below offers five possible responses (as described in the Apparatus and
procedures section of this paper): RA (right always), RU (right usually), EQ (equal), LU (left
usually), and LA (left always).
1. Which hand would you use to spin a top?
2. With which hand would you hold a paintbrush to paint a wall?
3. Which hand would you use to pick up a book?
4. With which hand would you use a spoon to eat soup?
5. Which hand would you use to flip pancakes?
6. Which hand would you use to pick up a piece of paper?
7. Which hand would you use to draw a picture?
8. Which hand would you use to insert and turn a key in a lock?
9. Which hand would you use to insert a plug into an electrical outlet?
10. Which hand would you use to throw a ball?
11. In which hand would you hold a needle while sewing?
12. Which hand would you use to turn on a light switch?
13. With which hand would you use the eraser at the end of a pencil?
14. Which hand would you use to saw a piece of wood with a hand saw?
15. Which hand would you use to open a drawer?
16. Which hand would you turn a doorknob with?
17. Which hand would you use to hammer a nail?
18. With which hand would you use a pair of tweezers?
19. Which hand do you use for writing?
20. Which hand would you turn the dial of a combination lock with?
21. Is there any reason (e.g. injury) why you have changed your hand preference for any of the above
activities?
YES NO (circle one) Explain.
22. Have you ever been given special training or encouragement to use a particular hand for certain
activities?
YES NO (circle one) Explain.
14 BROWN ET AL.
Dow
nloa
ded
by [
Uni
vers
ity o
f W
este
rn O
ntar
io]
at 0
1:58
07
Oct
ober
201
4