using gartner bi platform mq to standardize your bi ... · • critical capabilities for business...
TRANSCRIPT

Notes accompany this presentation. Please select Notes Page view.These materials can be reproduced only with written approval from Gartner. Such approvals must be requested via e-mail: [email protected]. Gartner is a registered trademark of Gartner, Inc. or its affiliates.
Using Gartner BI Platform MQ to Standardize Your BI Capabilities
Rita SallamKurt Schlegel
Welcome! Here’s how to participate in today’s webinar• You can listen to the presentation using your
computer’s speaker system as the default (VoIP).
• Or dial the conference line by selecting Use Telephone in the webinar audio pane.
• Have a question for the presenter(s)? Type it into the Questions pane—we will answer as many as time permits.
• A recording of this presentation will be sent to you within 48 hours.
• If you would like a copy of today’s presentation, contact your Gartner Account Executive or visit Gartner.com/webinars. A copy of the presentation will be available within 24 hours.
• Please note you may be polled during the webinar; only aggregate answers will appear.

Our world-class, objective insight is drawn from thousands of daily client interactions
65% of Fortune 1000;
85% ofGlobal 500
60+ Conferences
3,700CIOs
650 Analysts Across 80 Countries
100,000IT End-User
Inquiries
10,000Media
Inquiries
2 Million+IT End-User
Searches
60,000Clients
10,000 Client
Enterprises
5,500Benchmarks
2© 2009 Gartner, Inc. and/or its affiliates. All rights reserved. Gartner is a registered trademark of Gartner, Inc. or its affiliates.

Key Issues
1. What are the key information delivery and analysis capabilities?
2. Which vendors are best positioned to deliver these capabilities?
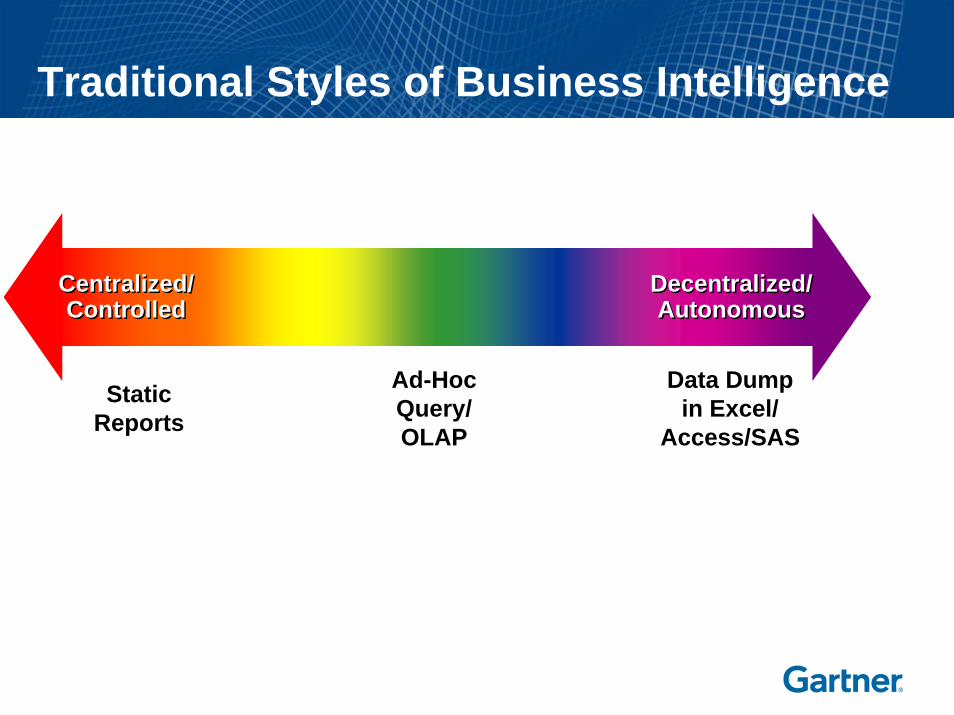
Traditional Styles of Business Intelligence
StaticReports
Ad-HocQuery/OLAP
Data Dumpin Excel/
Access/SAS
Centralized/Controlled
Centralized/Controlled
Decentralized/Autonomous
Decentralized/Autonomous
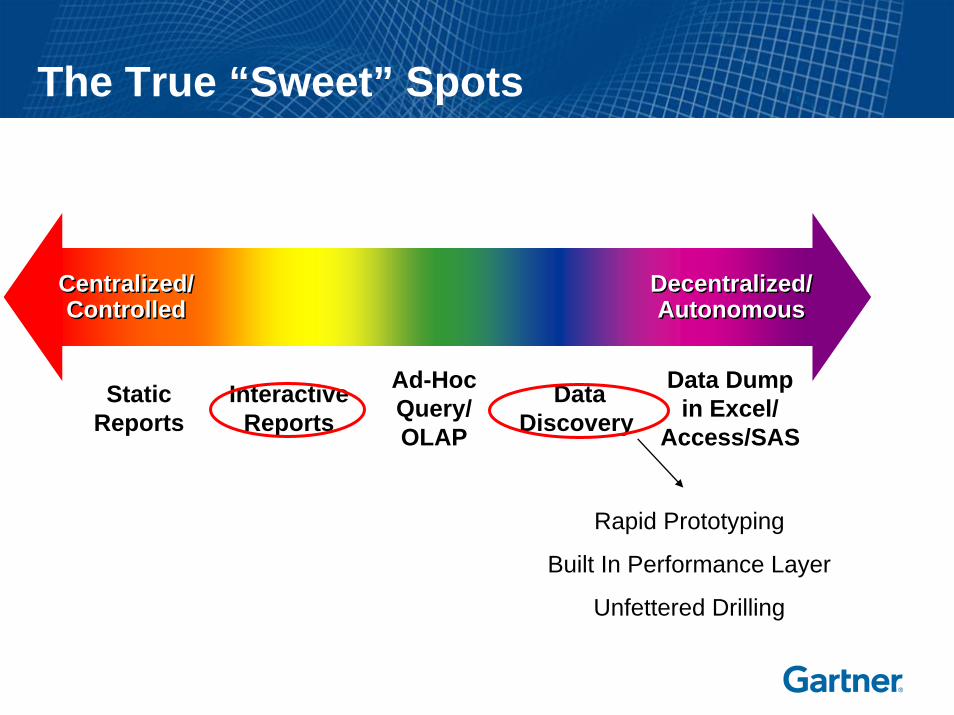
The True “Sweet” Spots
InteractiveReports
DataDiscovery
StaticReports
Ad-HocQuery/OLAP
Data Dumpin Excel/
Access/SAS
Centralized/Controlled
Centralized/Controlled
Decentralized/Autonomous
Decentralized/Autonomous
Rapid Prototyping
Built In Performance Layer
Unfettered Drilling
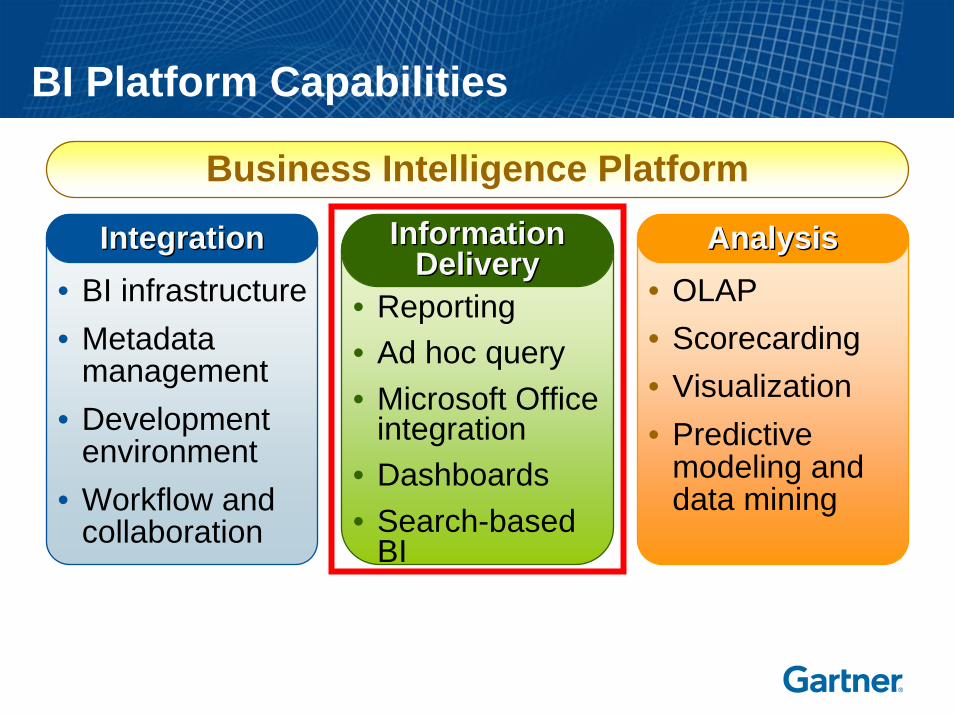
BI Platform Capabilities
InformationInformationDeliveryDelivery
IntegrationIntegration AnalysisAnalysis• BI infrastructure• Metadata
management• Development
environment• Workflow and
collaboration
• Reporting• Ad hoc query• Microsoft Office
integration• Dashboards• Search-based
BI
• OLAP • Scorecarding• Visualization• Predictive
modeling and data mining
Business Intelligence Platform
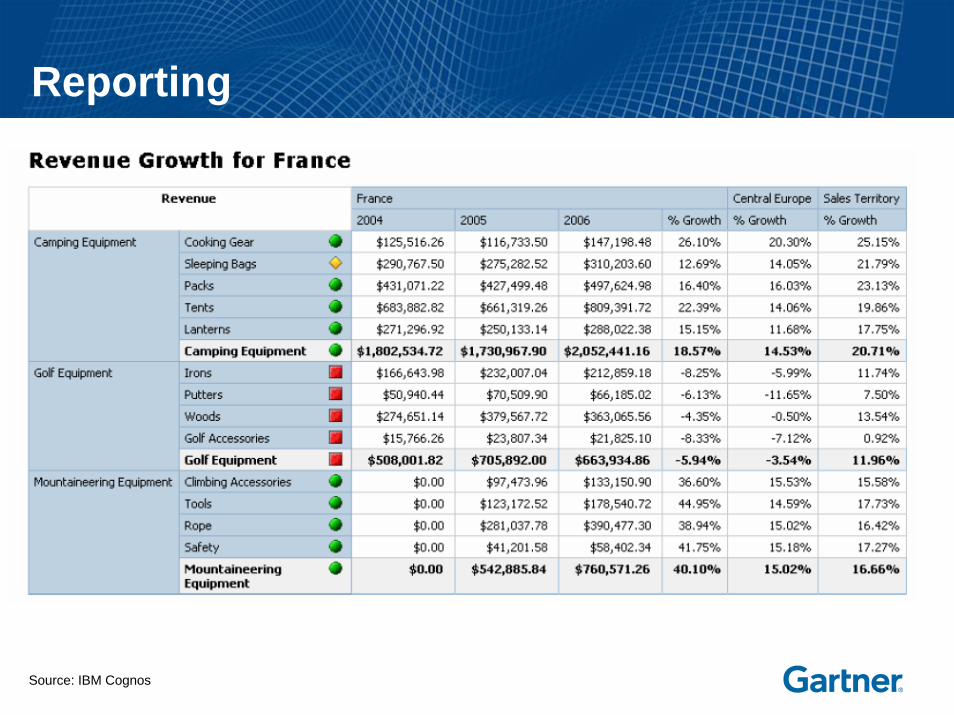
Reporting
Source: IBM Cognos
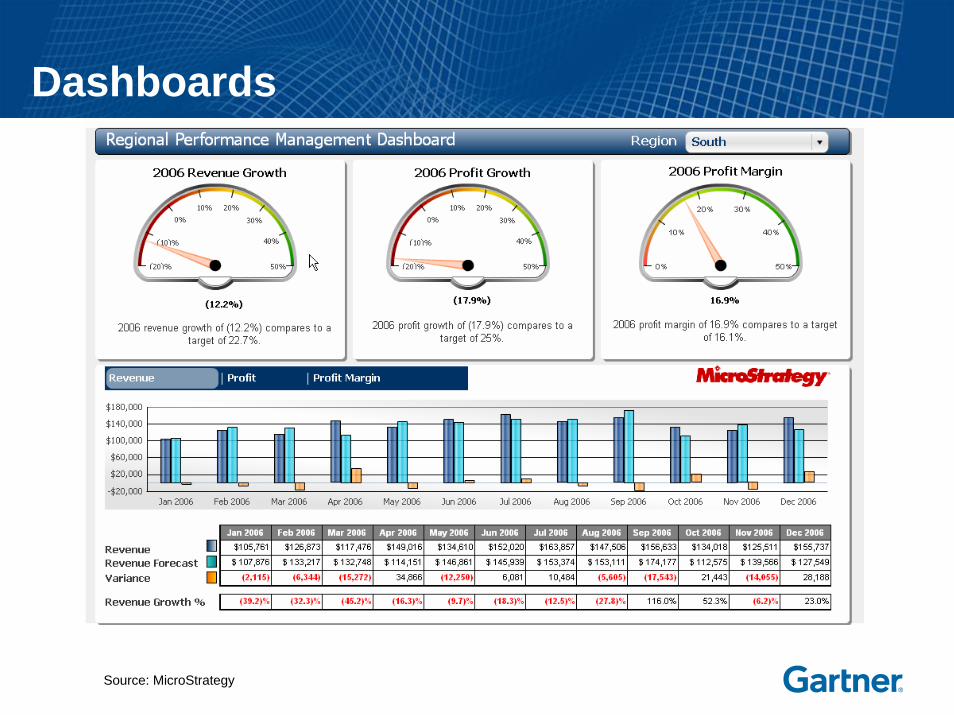
Dashboards
Source: MicroStrategy

Ad Hoc Query
Source: SAP Business Objects

Plus Search-Based BI
Source: Information Builders
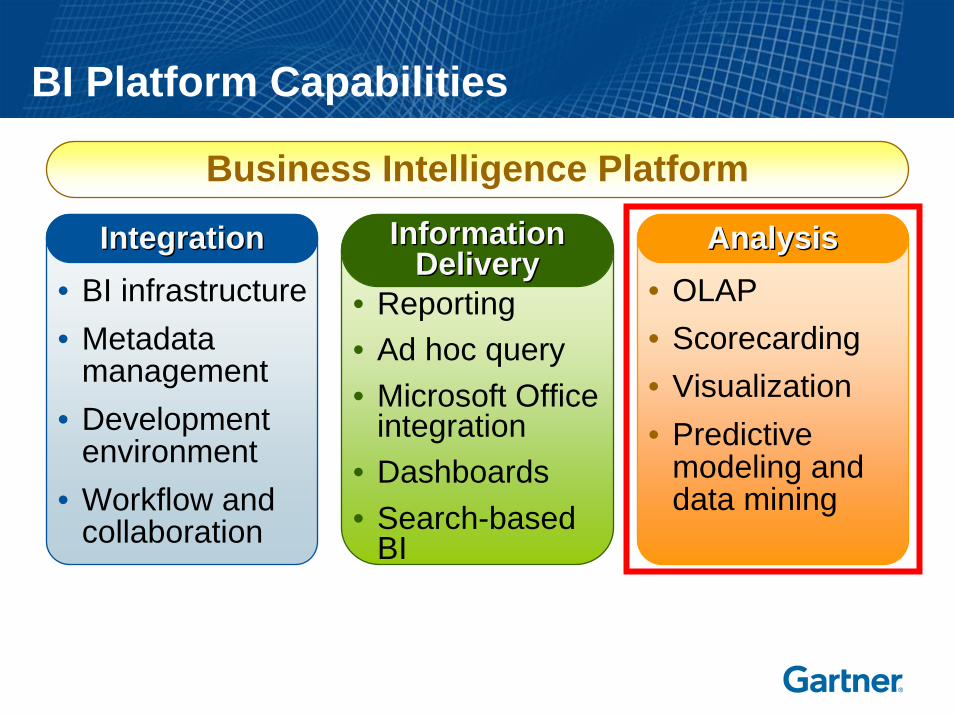
BI Platform Capabilities
InformationInformationDeliveryDelivery
IntegrationIntegration AnalysisAnalysis• BI infrastructure• Metadata
management• Development
environment• Workflow and
collaboration
• Reporting• Ad hoc query• Microsoft Office
integration• Dashboards• Search-based
BI
• OLAP • Scorecarding• Visualization• Predictive
modeling and data mining
Business Intelligence Platform
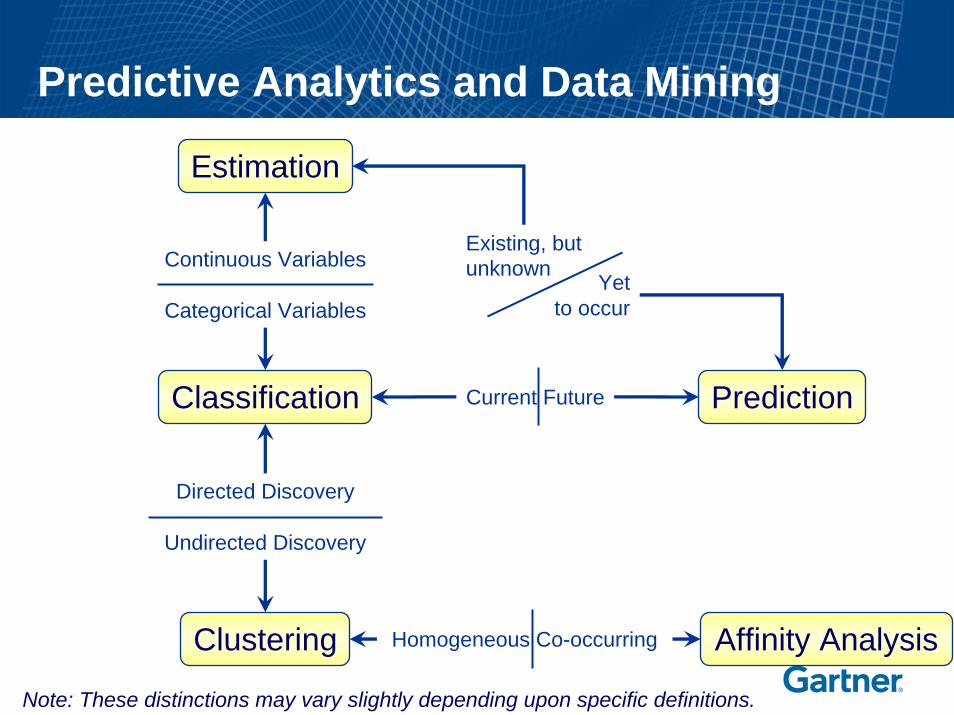
Predictive Analytics and Data Mining
Affinity Analysis
Classification
Clustering
Estimation
PredictionCurrent Future
Directed Discovery
Undirected Discovery
Continuous Variables
Categorical Variables
Homogeneous Co-occurring
Yetto occur
Existing, but unknown
Note: These distinctions may vary slightly depending upon specific definitions.
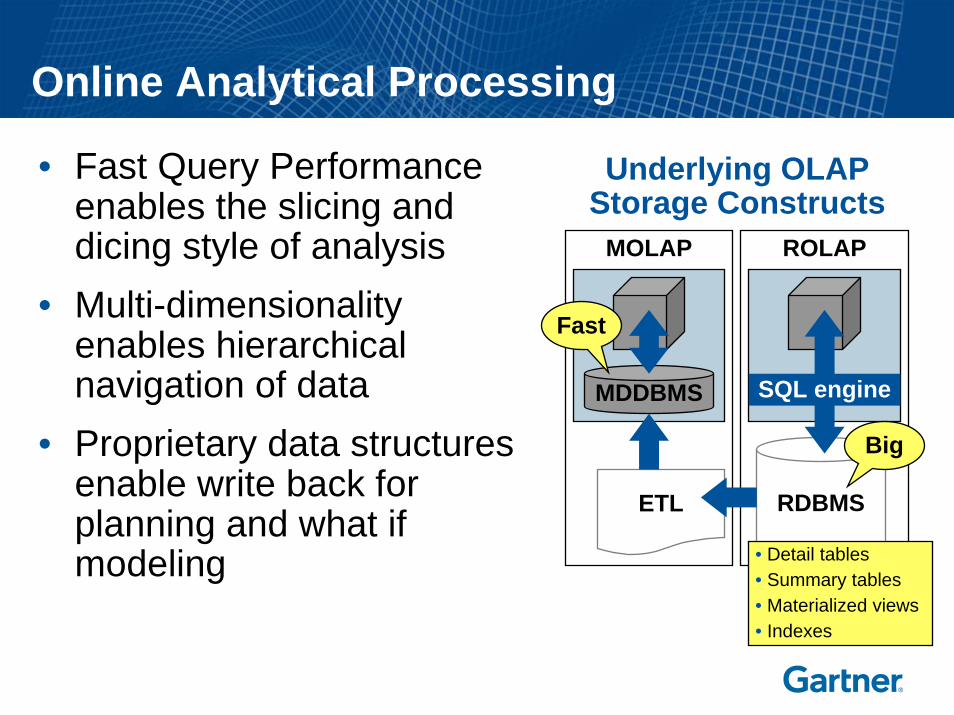
Online Analytical Processing
• Fast Query Performance enables the slicing and dicing style of analysis
• Multi-dimensionality enables hierarchical navigation of data
• Proprietary data structures enable write back for planning and what if modeling
RDBMS
MOLAP ROLAP
Underlying OLAP Storage Constructs
MDDBMS SQL engine
ETL
Fast
Big
• Detail tables• Summary tables• Materialized views• Indexes
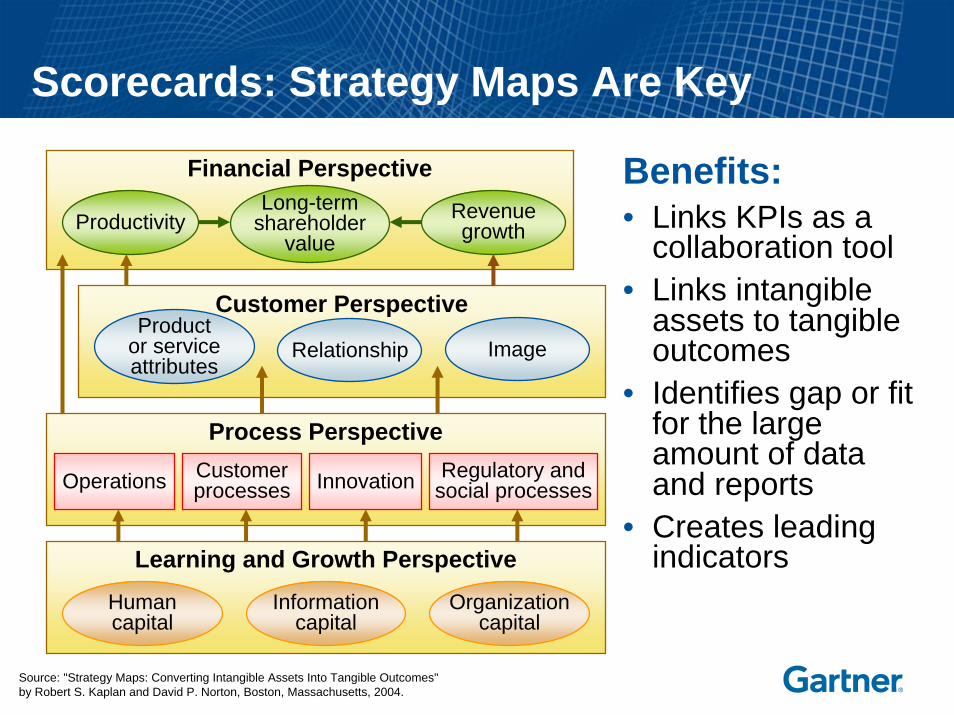
Scorecards: Strategy Maps Are Key
Benefits:• Links KPIs as a
collaboration tool• Links intangible
assets to tangible outcomes
• Identifies gap or fit for the large amount of data and reports
• Creates leading indicators
Source: "Strategy Maps: Converting Intangible Assets Into Tangible Outcomes" by Robert S. Kaplan and David P. Norton, Boston, Massachusetts, 2004.
Customer Perspective
Financial Perspective
Process Perspective
Operations Customerprocesses Innovation Regulatory and
social processes
Learning and Growth Perspective
Relationship ImageProduct
or serviceattributes
Informationcapital
Organizationcapital
Humancapital
Productivity Revenuegrowth
Long-termshareholder
value
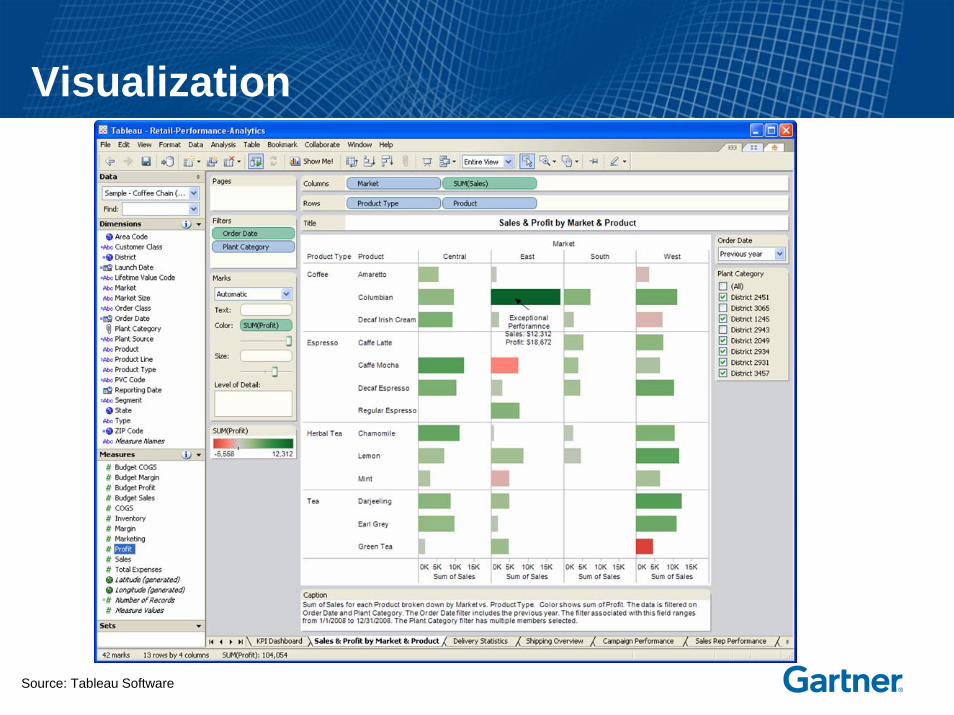
Visualization
Source: Tableau Software
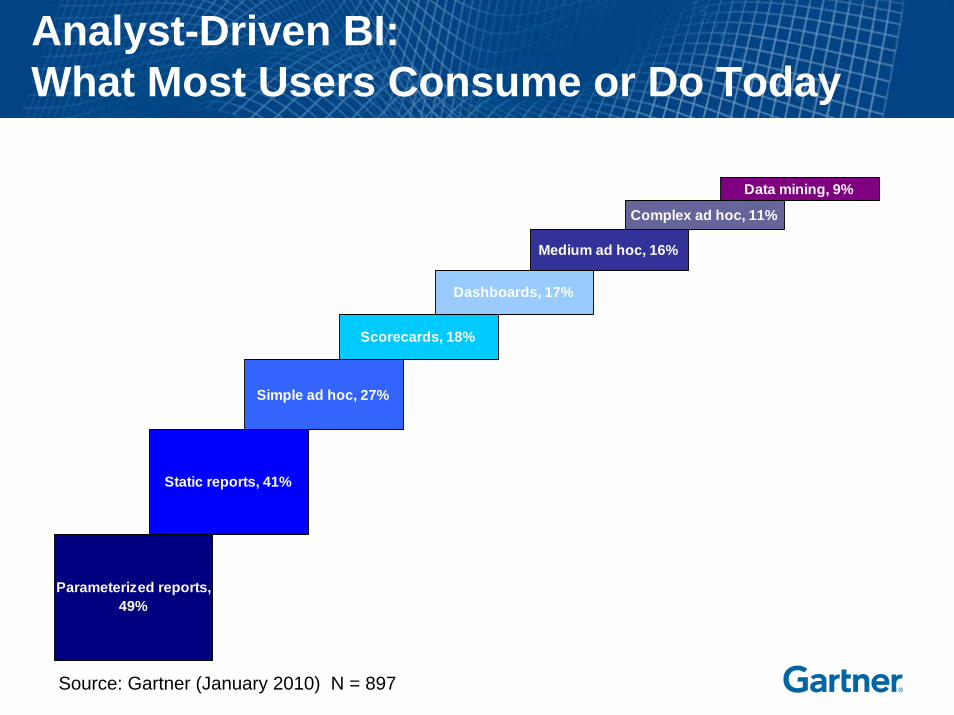
Parameterized reports, 49%
Static reports, 41%
Simple ad hoc, 27%
Scorecards, 18%
Dashboards, 17%
Medium ad hoc, 16%
Complex ad hoc, 11%
Data mining, 9%
Analyst-Driven BI: What Most Users Consume or Do Today
Source: Gartner (January 2010) N = 897
Key Issues
1. What are the key information delivery and analysis capabilities?
2. Which vendors are best positioned to deliver these capabilities?
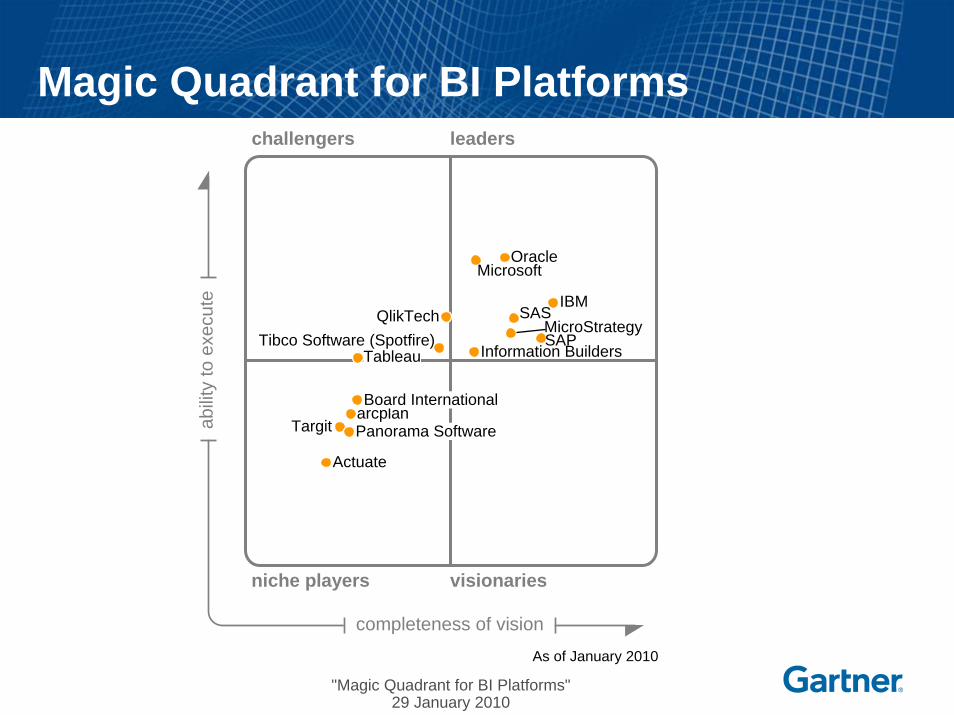
Magic Quadrant for BI Platformschallengers leaders
niche players visionaries
completeness of vision
abilit
y to
exe
cute
As of January 2010
Oracle
IBMSAS
MicroStrategySAP
Information Builders
Actuate
Panorama SoftwareTargitarcplanBoard International
TableauTibco Software (Spotfire)
QlikTech
Microsoft
"Magic Quadrant for BI Platforms"29 January 2010
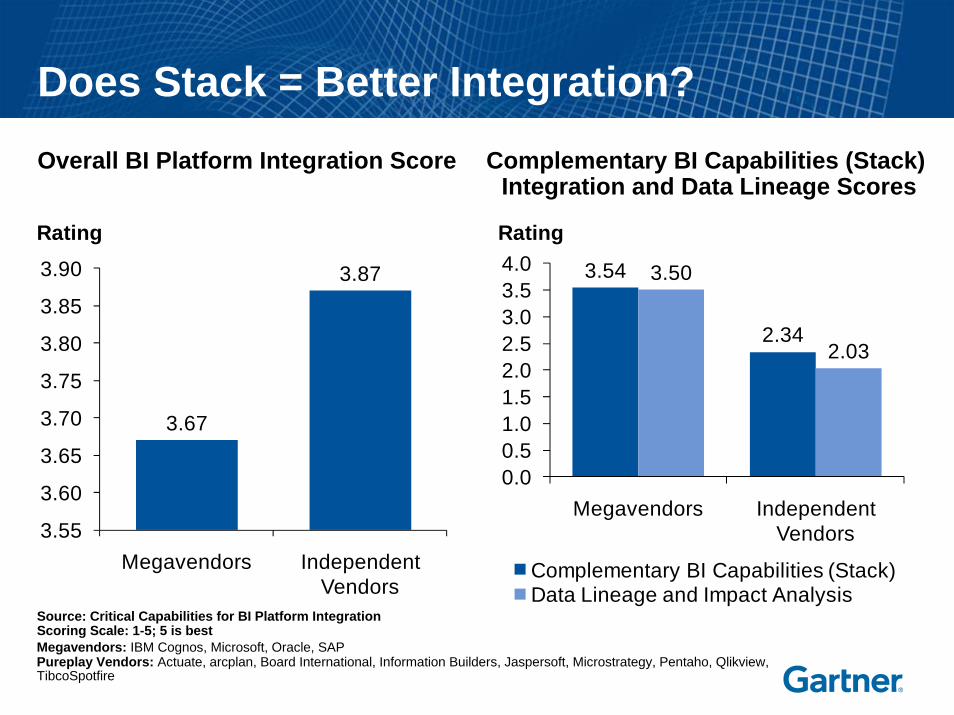
3.54
2.34
3.50
2.03
0.00.51.01.52.02.53.03.54.0
Megavendors Independent Vendors
Rating
Complementary BI Capabilities (Stack)Data Lineage and Impact Analysis
3.67
3.87
3.55
3.60
3.65
3.70
3.75
3.80
3.85
3.90
Megavendors Independent Vendors
Rating
Source: Critical Capabilities for BI Platform IntegrationScoring Scale: 1-5; 5 is best
Does Stack = Better Integration?Overall BI Platform Integration Score
Megavendors: IBM Cognos, Microsoft, Oracle, SAPPureplay Vendors: Actuate, arcplan, Board International, Information Builders, Jaspersoft, Microstrategy, Pentaho, Qlikview, TibcoSpotfire
Complementary BI Capabilities (Stack) Integration and Data Lineage Scores
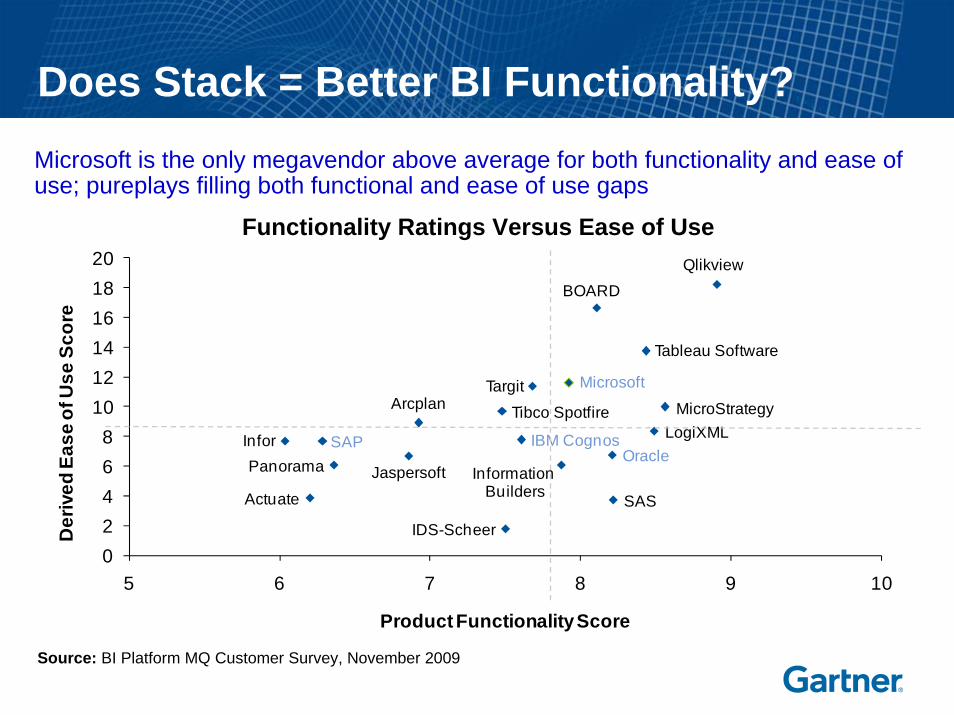
Actuate
Arcplan
BOARD
IBM Cognos
IDS-Scheer
Infor
InformationBuilders
Jaspersoft
LogiXML
Microsoft
MicroStrategy
OraclePanorama
Qlikview
SAP
SAS
Tableau Software
Targit Tibco Spotfire
02468
101214161820
5 6 7 8 9 10
Der
ived
Eas
e of
Use
Sco
re
Product Functionality Score
Functionality Ratings Versus Ease of Use
Does Stack = Better BI Functionality?
Source: BI Platform MQ Customer Survey, November 2009
Microsoft is the only megavendor above average for both functionality and ease of use; pureplays filling both functional and ease of use gaps
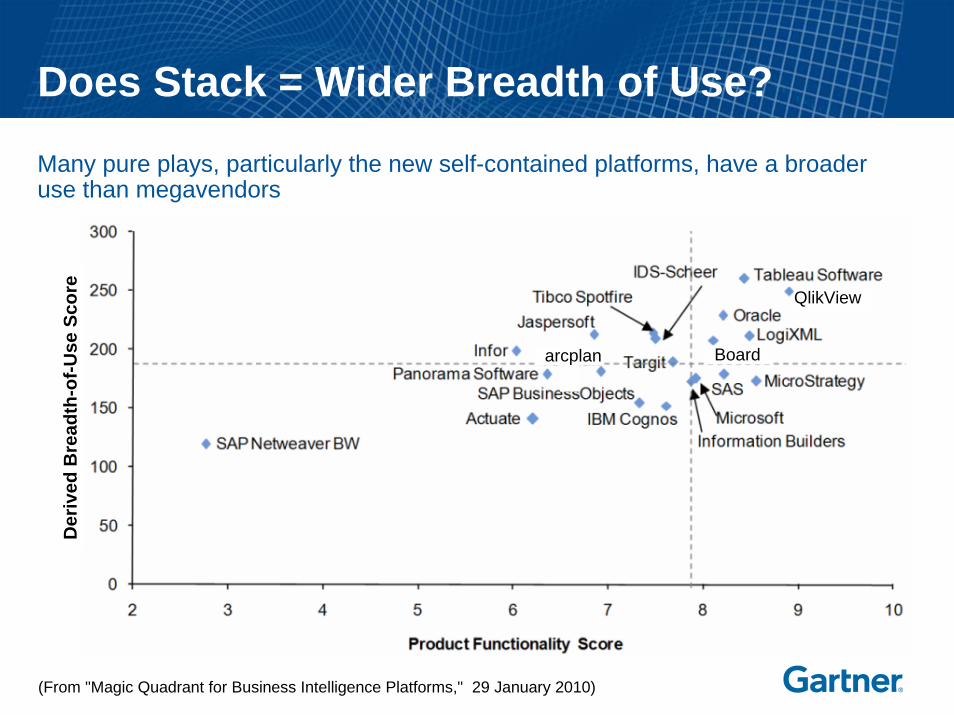
Does Stack = Wider Breadth of Use?
Many pure plays, particularly the new self-contained platforms, have a broader use than megavendors
(From "Magic Quadrant for Business Intelligence Platforms," 29 January 2010)
Der
ived
Bre
adth
-of-U
se S
core
Boardarcplan
QlikView
ActuateArcplan
BOARD
IBM CognosIDS-Scheer
InforInformation Builders
Jaspersoft
LogiXMLMicrosoft
MicroStrategy
Oracle
PanoramaQlikview
SAPSAS
Tableau Software
Targit
Tibco Spotfire
0
1
2
3
4
5
6
7
6.0 6.5 7.0 7.5 8.0 8.5 9.0 9.5 10.0
Softw
are
Qua
lity
Perception of Support
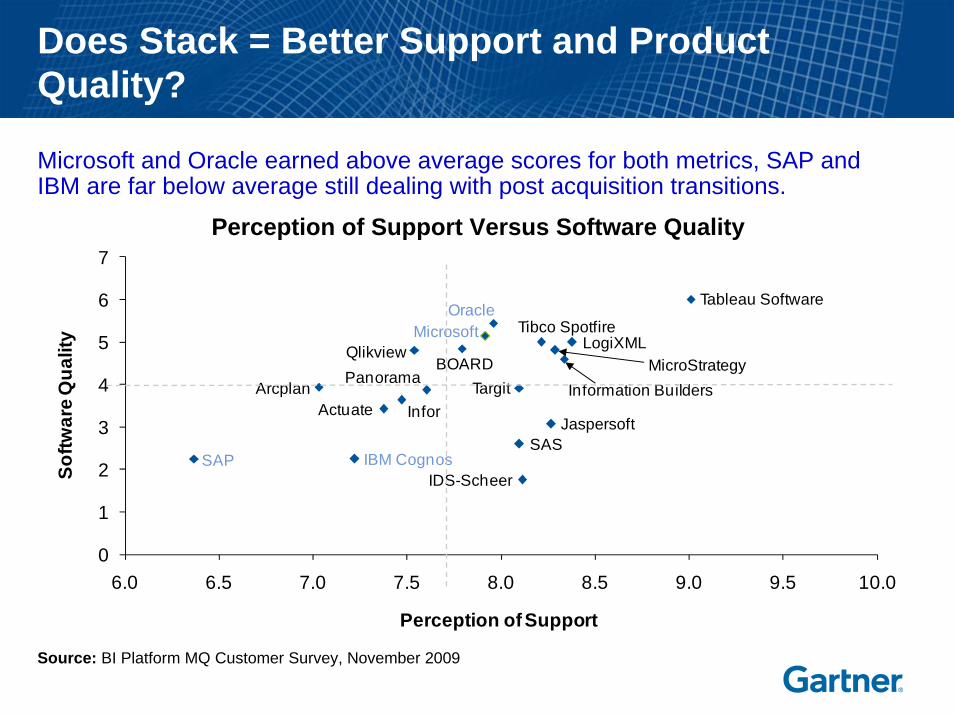
Does Stack = Better Support and Product Quality?
Microsoft and Oracle earned above average scores for both metrics, SAP and IBM are far below average still dealing with post acquisition transitions.
Perception of Support Versus Software Quality
Source: BI Platform MQ Customer Survey, November 2009
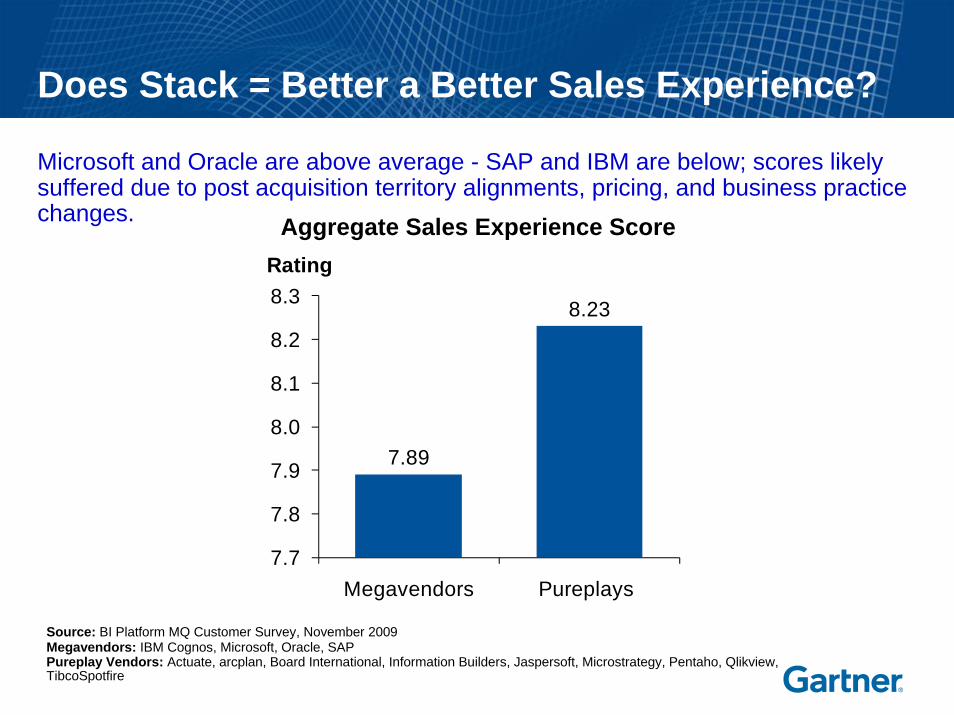
Aggregate Sales Experience Score
Microsoft and Oracle are above average - SAP and IBM are below; scores likely suffered due to post acquisition territory alignments, pricing, and business practice changes.
Does Stack = Better a Better Sales Experience?
Megavendors: IBM Cognos, Microsoft, Oracle, SAPPureplay Vendors: Actuate, arcplan, Board International, Information Builders, Jaspersoft, Microstrategy, Pentaho, Qlikview, TibcoSpotfire
Source: BI Platform MQ Customer Survey, November 2009
7.89
8.23
7.7
7.8
7.9
8.0
8.1
8.2
8.3
Megavendors Pureplays
Rating

Does Stack = Higher BI Success and A More Positive View of Vendor Future?
Paradoxically, like last year, irrespective of overall scores, stack customers have a high view of stack vendor future
Overall BI Platform Success Score Vs View of Vendor Future
Actuate
Arcplan
BOARD
IBM CognosIDS-ScheerInfor
Information Builders
Jaspersoft
LogiXML
Microsoft
MicroStrategy
Oracle
Panorama
Qlikview
SAP
SAS
TableauSoftware
Targit Tibco Spotfire
1.8
2.0
2.2
2.4
2.6
2.8
3.0
3.2
3.4
25 27 29 31 33 35 37
View
of V
endo
r Fut
ure
Overall BI Platform Success Score
Source: BI Platform MQ Customer Survey, November 2009
Actuate
Arcplan
IBM Cognos
Infor
Information Builders
Jaspersoft
LogiXML
Microsoft
MicroStrategy
Oracle Panorama
Qlikview
SAP
SASTableau Software
Tibco Spotfire
0
5
10
15
20
25
30
0 2 4 6 8 10 12 14 16
Adm
ins
Per 1
,000
GB
Admins Per 1,000 Users
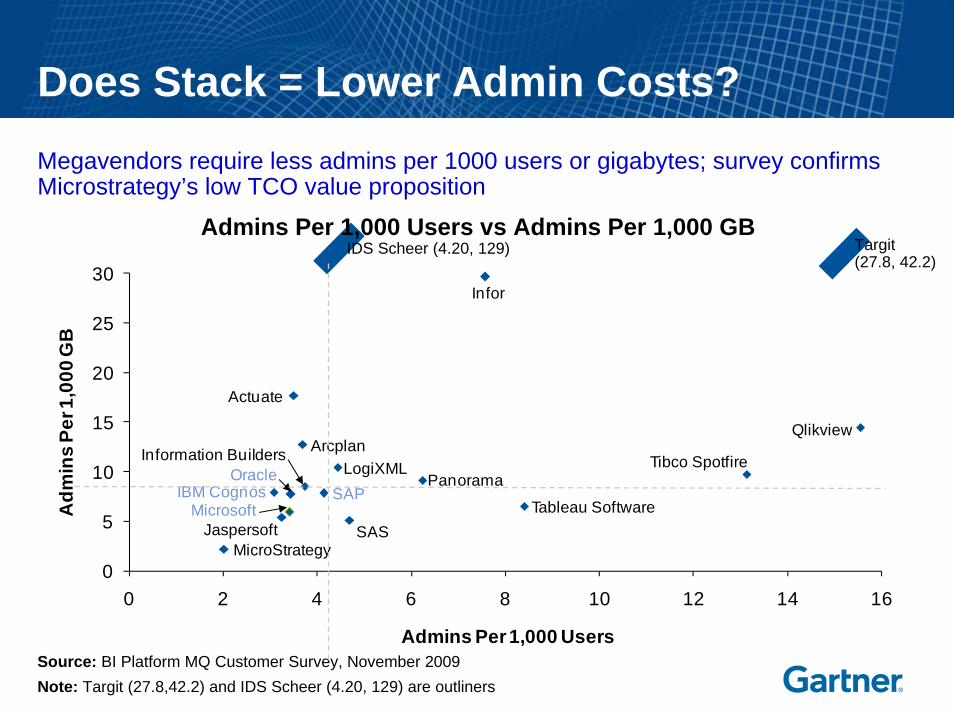
Does Stack = Lower Admin Costs?
Source: BI Platform MQ Customer Survey, November 2009Note: Targit (27.8,42.2) and IDS Scheer (4.20, 129) are outliners
IDS Scheer (4.20, 129) Targit (27.8, 42.2)
Megavendors require less admins per 1000 users or gigabytes; survey confirms Microstrategy’s low TCO value proposition
Admins Per 1,000 Users vs Admins Per 1,000 GB
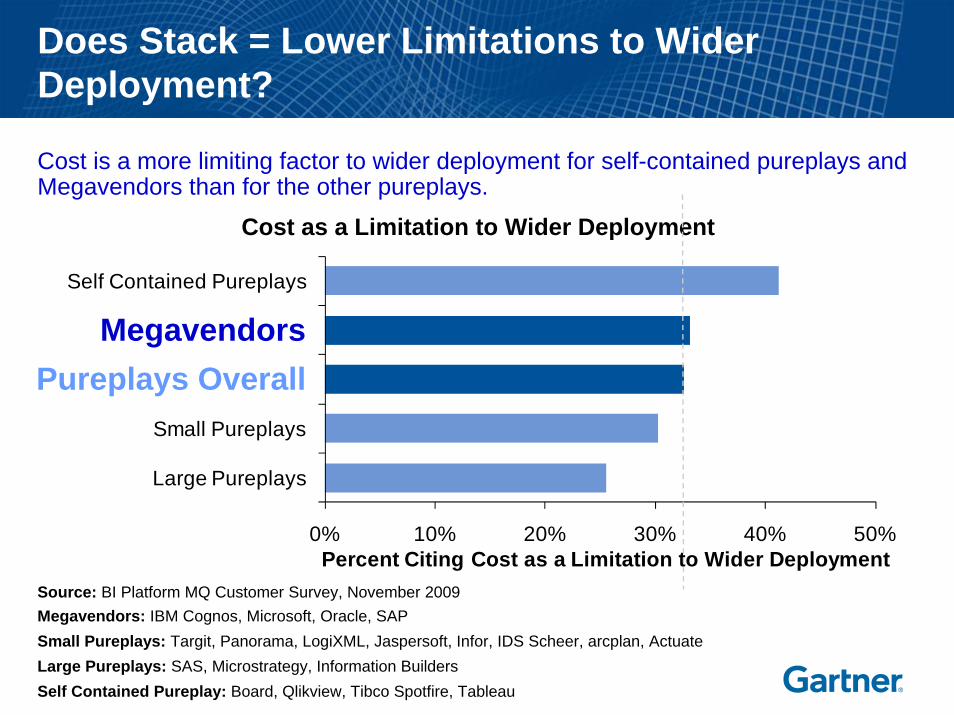
0% 10% 20% 30% 40% 50%
Large Pureplays
Small Pureplays
Pureplays Overall
Megavendors
Self Contained Pureplays
Percent Citing Cost as a Limitation to Wider Deployment
Does Stack = Lower Limitations to Wider Deployment?
Megavendors: IBM Cognos, Microsoft, Oracle, SAPSmall Pureplays: Targit, Panorama, LogiXML, Jaspersoft, Infor, IDS Scheer, arcplan, ActuateLarge Pureplays: SAS, Microstrategy, Information BuildersSelf Contained Pureplay: Board, Qlikview, Tibco Spotfire, Tableau
Source: BI Platform MQ Customer Survey, November 2009
Cost is a more limiting factor to wider deployment for self-contained pureplays and Megavendors than for the other pureplays.
Pureplays OverallMegavendors
Cost as a Limitation to Wider Deployment
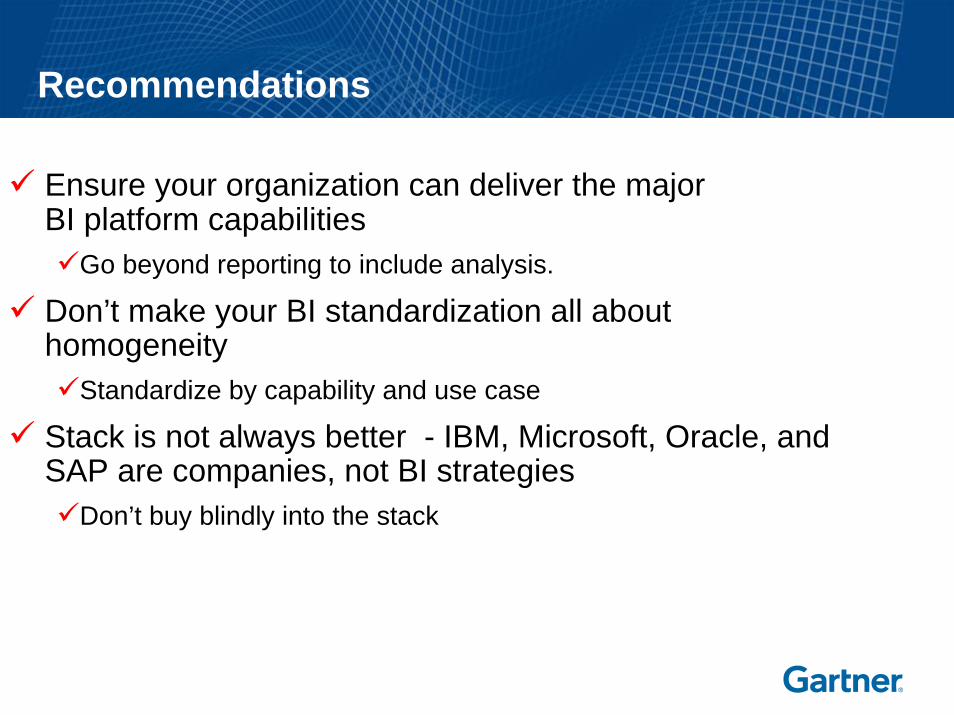
Recommendations
Ensure your organization can deliver the major BI platform capabilities
Go beyond reporting to include analysis.
Don’t make your BI standardization all about homogeneity
Standardize by capability and use case
Stack is not always better - IBM, Microsoft, Oracle, and SAP are companies, not BI strategies
Don’t buy blindly into the stack
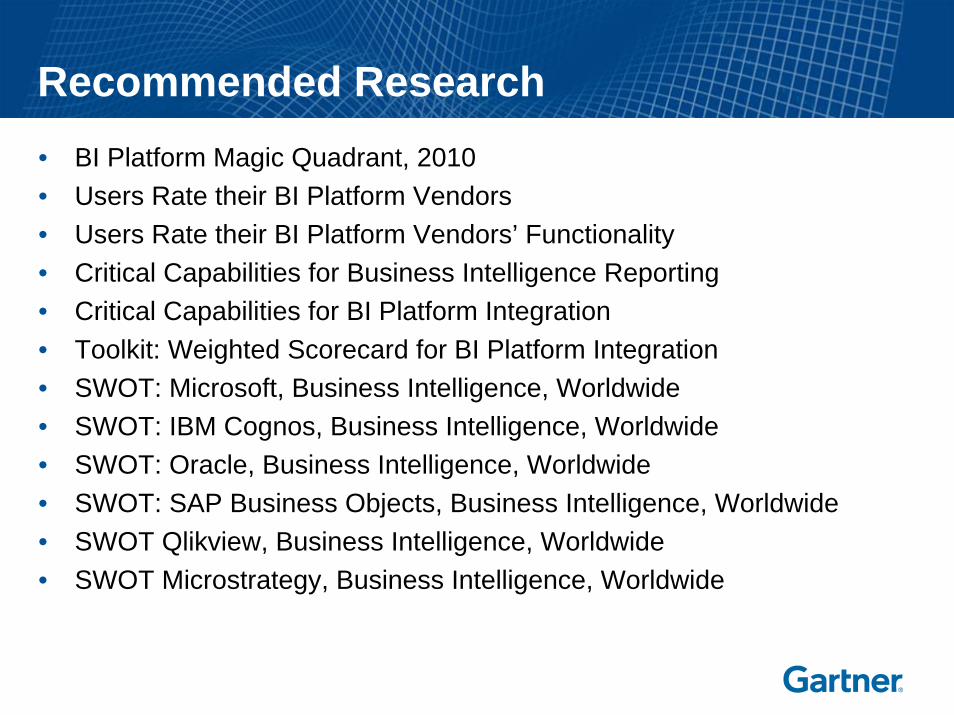
Recommended Research• BI Platform Magic Quadrant, 2010• Users Rate their BI Platform Vendors • Users Rate their BI Platform Vendors’ Functionality • Critical Capabilities for Business Intelligence Reporting• Critical Capabilities for BI Platform Integration• Toolkit: Weighted Scorecard for BI Platform Integration• SWOT: Microsoft, Business Intelligence, Worldwide• SWOT: IBM Cognos, Business Intelligence, Worldwide• SWOT: Oracle, Business Intelligence, Worldwide• SWOT: SAP Business Objects, Business Intelligence, Worldwide• SWOT Qlikview, Business Intelligence, Worldwide• SWOT Microstrategy, Business Intelligence, Worldwide

Thanks for participating! Do you have any questions?
• If you haven’t done so already, please type your questions into the Questions pane.
• We will answer as many of your questions as time permits.
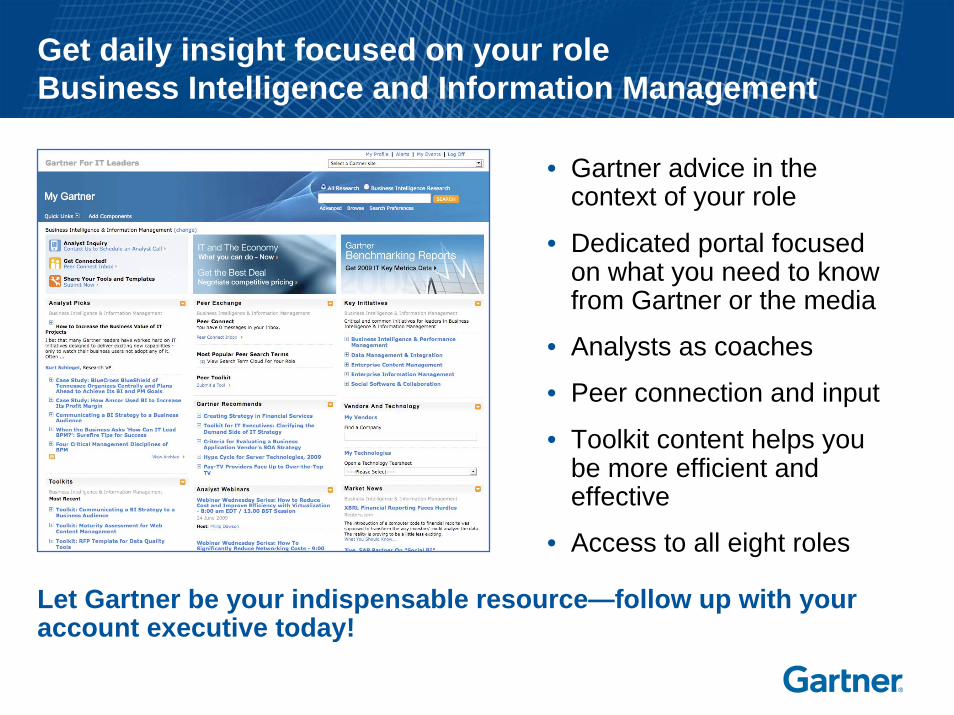
Get daily insight focused on your roleBusiness Intelligence and Information Management
• Gartner advice in the context of your role
• Dedicated portal focused on what you need to know from Gartner or the media
• Analysts as coaches
• Peer connection and input
• Toolkit content helps you be more efficient and effective
• Access to all eight roles
Let Gartner be your indispensable resource—follow up with your account executive today!
Simple steps for increasing the value of today’s webinar experience • Contact your Gartner account executive
(or e-mail [email protected]) with any additional questions or comments.
• Visit gartner.com/webinars for a schedule of upcoming Gartner webinars (plus replays of previous webinars) and share these resources with your colleagues.
• For a complimentary copy of today’s presentation please go to gartner.com/webinars. A copy of the presentation will be available within 24 hours.