using fatigue damage spectrum for accelerated testing … · for accelerated testing with...
TRANSCRIPT
Using Fatigue Damage Spectrum
for Accelerated Testing
with Correlation to End-Use Environment
Tom Achatz, PEGlobal Technical Integration Engineer,
General Motors Company
John VanBaren, PEPresident, Vibration Research Corporation
Todays Presenter: John Van Baren
We will begin shortly!
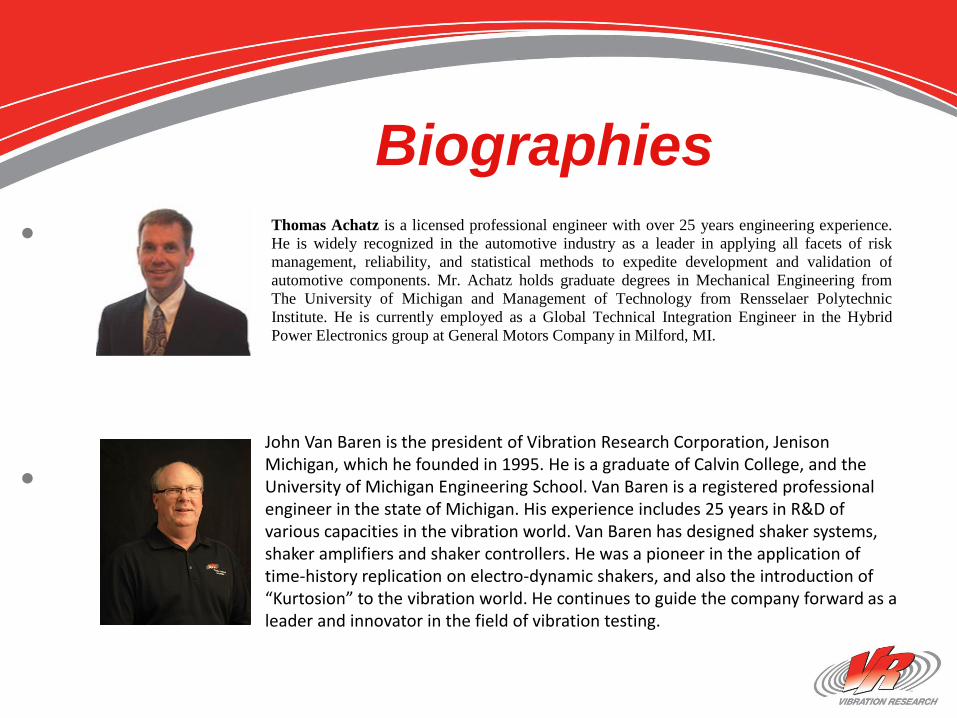
Biographies
•
•
Thomas Achatz is a licensed professional engineer with over 25 years engineering experience.
He is widely recognized in the automotive industry as a leader in applying all facets of risk
management, reliability, and statistical methods to expedite development and validation of
automotive components. Mr. Achatz holds graduate degrees in Mechanical Engineering from
The University of Michigan and Management of Technology from Rensselaer Polytechnic
Institute. He is currently employed as a Global Technical Integration Engineer in the Hybrid
Power Electronics group at General Motors Company in Milford, MI.
John Van Baren is the president of Vibration Research Corporation, Jenison Michigan, which he founded in 1995. He is a graduate of Calvin College, and the University of Michigan Engineering School. Van Baren is a registered professional engineer in the state of Michigan. His experience includes 25 years in R&D of various capacities in the vibration world. Van Baren has designed shaker systems, shaker amplifiers and shaker controllers. He was a pioneer in the application of time-history replication on electro-dynamic shakers, and also the introduction of “Kurtosion” to the vibration world. He continues to guide the company forward as a leader and innovator in the field of vibration testing.
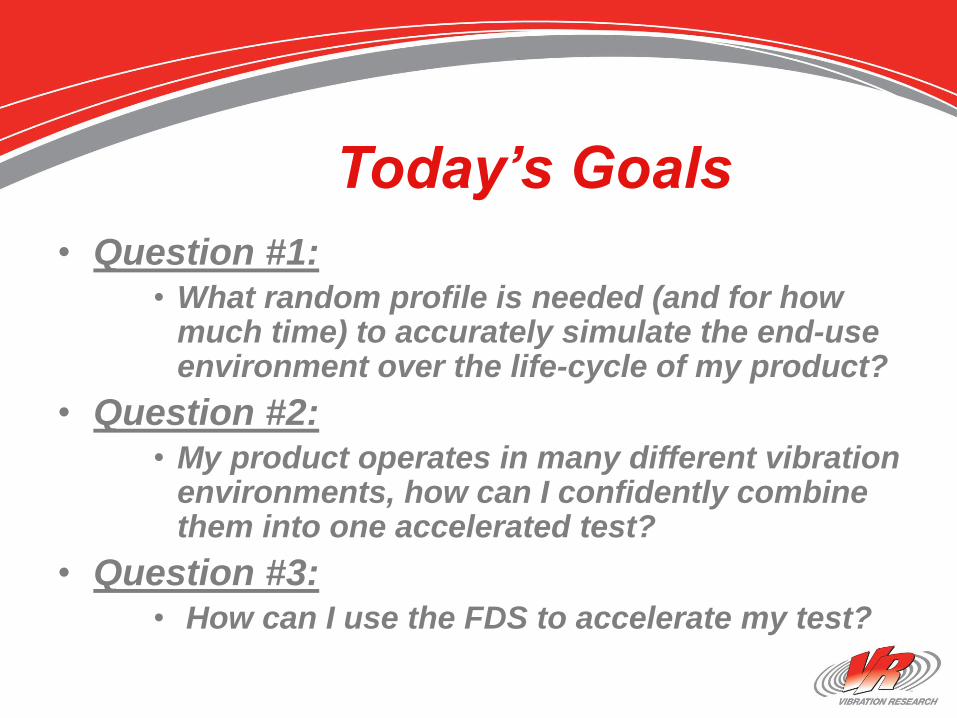
Today’s Goals
• Question #1: • What random profile is needed (and for how
much time) to accurately simulate the end-use environment over the life-cycle of my product?
• Question #2:• My product operates in many different vibration
environments, how can I confidently combine them into one accelerated test?
• Question #3:• How can I use the FDS to accelerate my test?
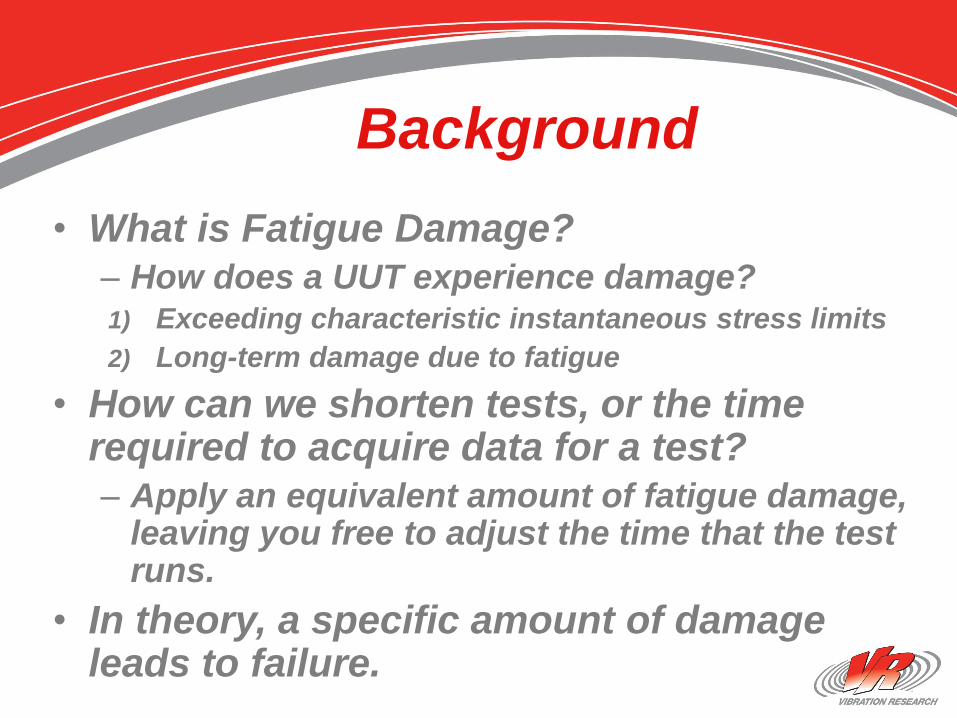
Background
• What is Fatigue Damage?
– How does a UUT experience damage?1) Exceeding characteristic instantaneous stress limits
2) Long-term damage due to fatigue
• How can we shorten tests, or the time required to acquire data for a test?
– Apply an equivalent amount of fatigue damage, leaving you free to adjust the time that the test runs.
• In theory, a specific amount of damage leads to failure.
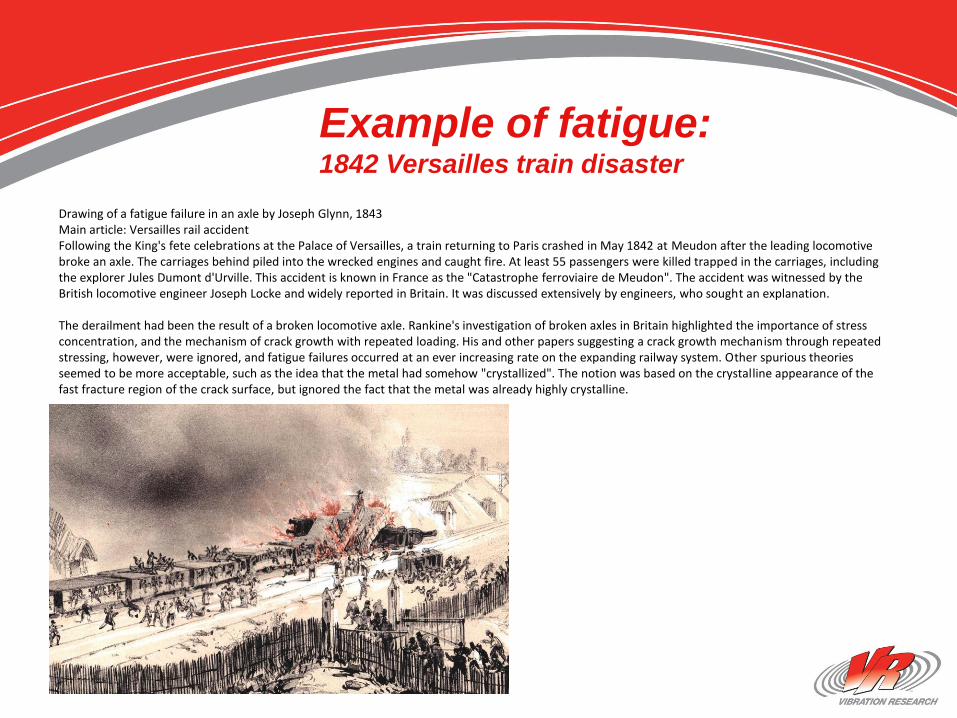
Example of fatigue:1842 Versailles train disaster
Drawing of a fatigue failure in an axle by Joseph Glynn, 1843Main article: Versailles rail accidentFollowing the King's fete celebrations at the Palace of Versailles, a train returning to Paris crashed in May 1842 at Meudon after the leading locomotive broke an axle. The carriages behind piled into the wrecked engines and caught fire. At least 55 passengers were killed trapped in the carriages, including the explorer Jules Dumont d'Urville. This accident is known in France as the "Catastrophe ferroviaire de Meudon". The accident was witnessed by the British locomotive engineer Joseph Locke and widely reported in Britain. It was discussed extensively by engineers, who sought an explanation.
The derailment had been the result of a broken locomotive axle. Rankine's investigation of broken axles in Britain highlighted the importance of stress concentration, and the mechanism of crack growth with repeated loading. His and other papers suggesting a crack growth mechanism through repeated stressing, however, were ignored, and fatigue failures occurred at an ever increasing rate on the expanding railway system. Other spurious theories seemed to be more acceptable, such as the idea that the metal had somehow "crystallized". The notion was based on the crystalline appearance of the fast fracture region of the crack surface, but ignored the fact that the metal was already highly crystalline.
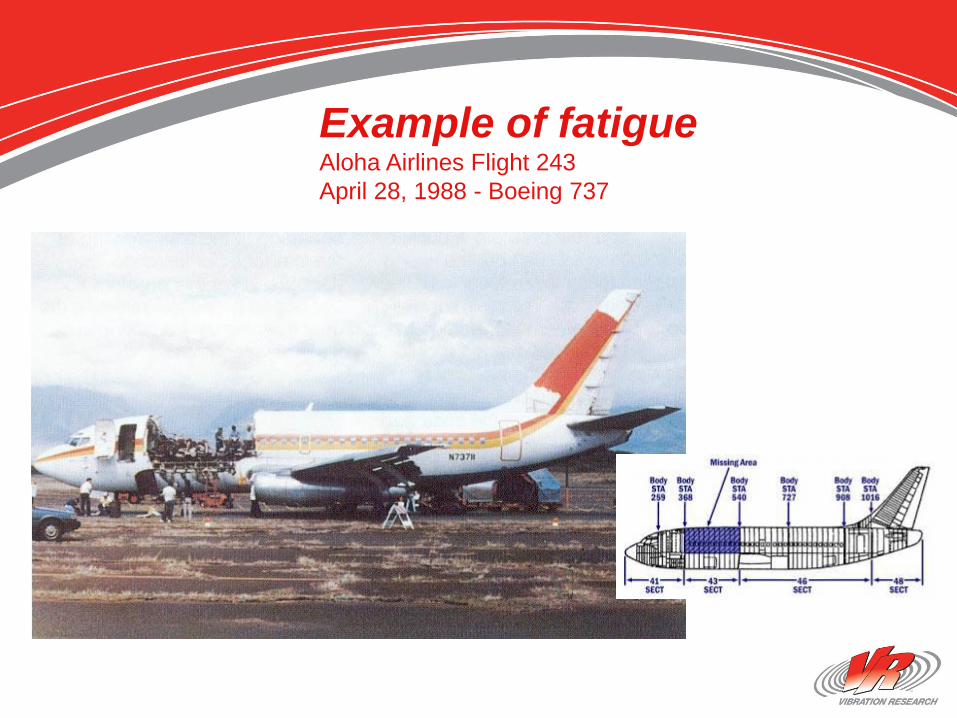
Example of fatigueAloha Airlines Flight 243
April 28, 1988 - Boeing 737
Calculating Fatigue:
S-N Curve, Miner’s Rule
• MIL-STD-810G1 (Method 514.6, Annex A) states that: • “The most commonly used method for calculating a reduction in
test duration is the Miner-Palmgren hypothesis that uses a fatigue-based power law relationship to relate exposure time and amplitude.” This is the case in our fatigue-based import.
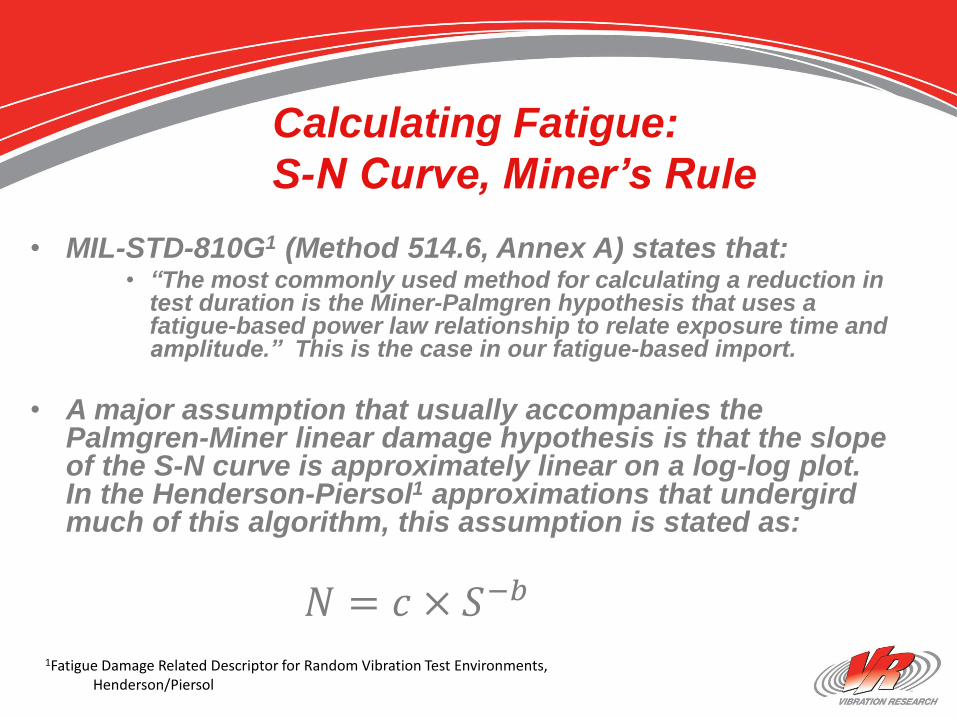
• A major assumption that usually accompanies the Palmgren-Miner linear damage hypothesis is that the slope of the S-N curve is approximately linear on a log-log plot. In the Henderson-Piersol1 approximations that undergird much of this algorithm, this assumption is stated as:
𝑁 = 𝑐 × 𝑆−𝑏
1Fatigue Damage Related Descriptor for Random Vibration Test Environments,Henderson/Piersol
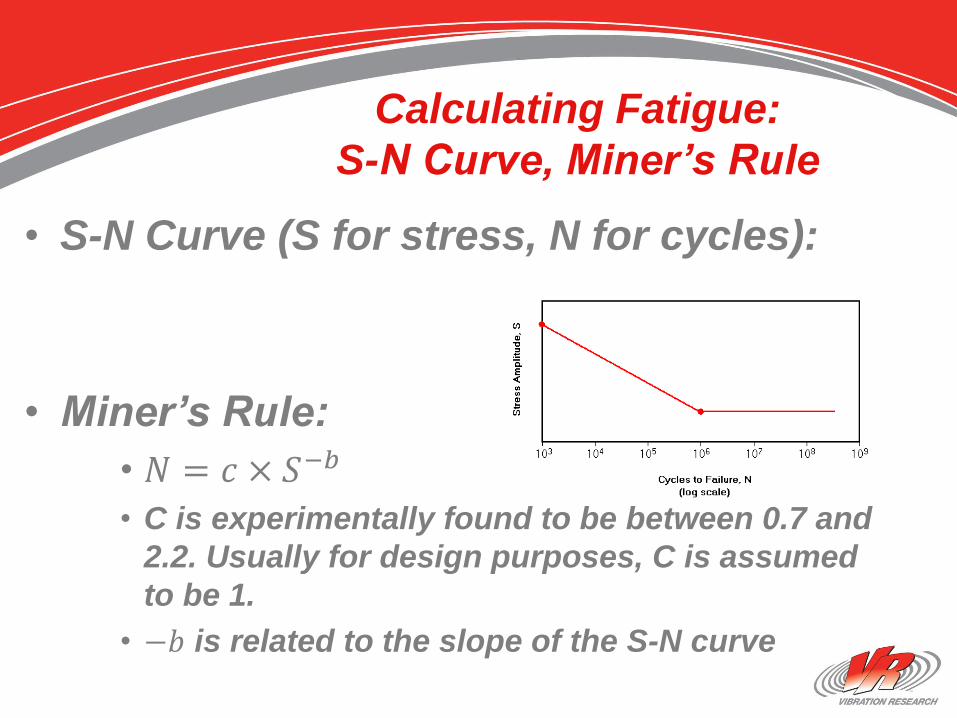
• S-N Curve (S for stress, N for cycles):
• Miner’s Rule:
• 𝑁 = 𝑐 × 𝑆−𝑏
• C is experimentally found to be between 0.7 and
2.2. Usually for design purposes, C is assumed
to be 1.
• −𝑏 is related to the slope of the S-N curve
Calculating Fatigue:
S-N Curve, Miner’s Rule
• http://www.vibrationdata.com/tutorials/
rainflow_counting.pdf
Rainflow Counting Explained
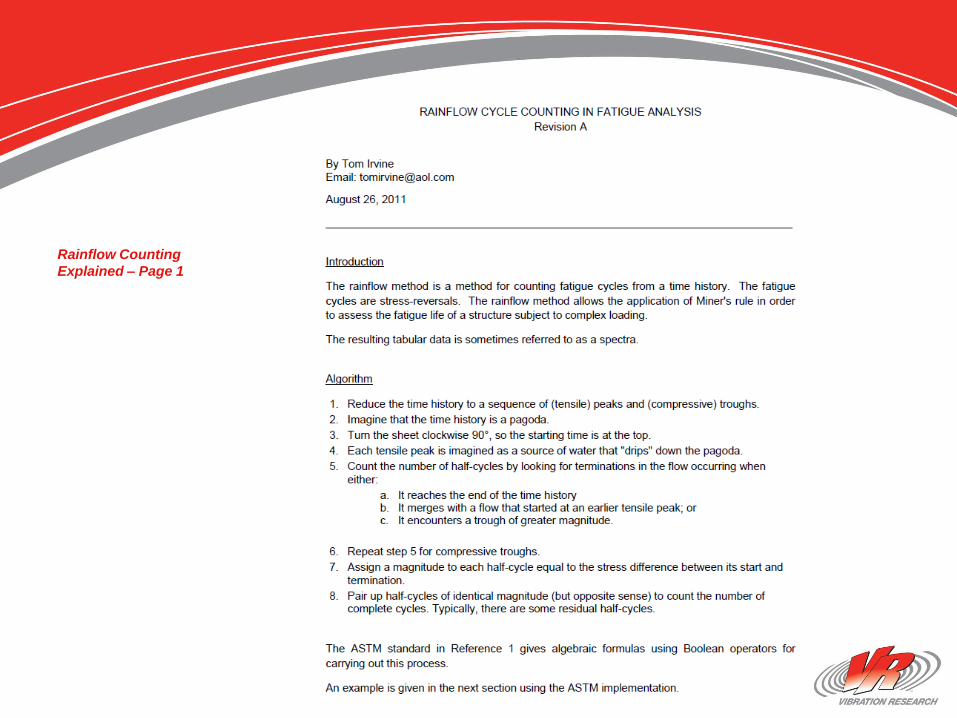
Rainflow Counting
Explained – Page 1
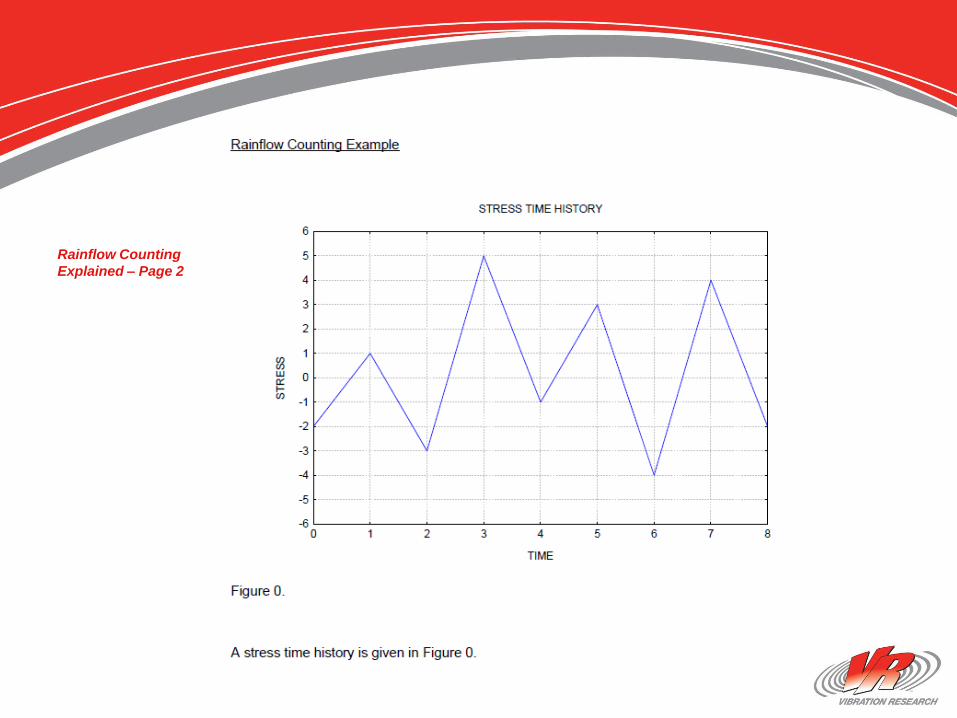
Rainflow Counting
Explained – Page 2
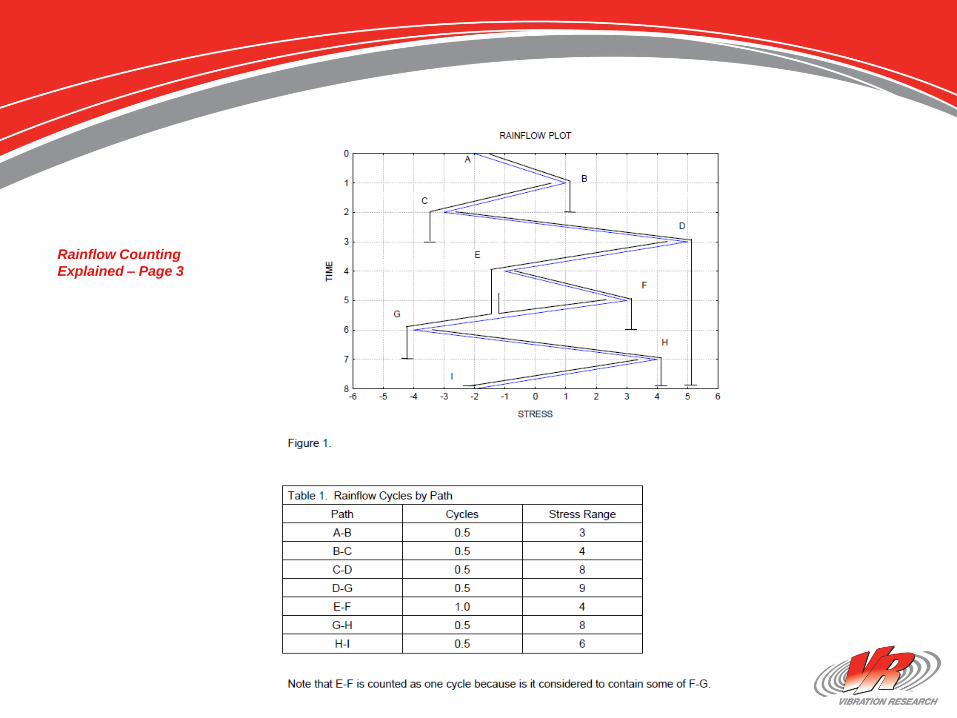
Rainflow Counting
Explained – Page 3
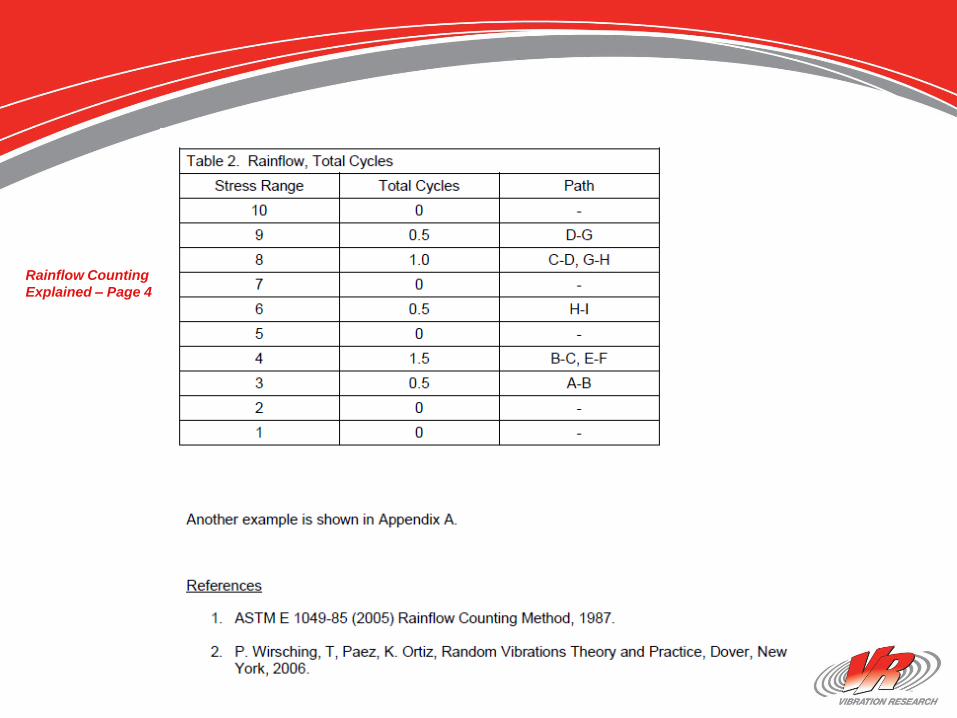
Rainflow Counting
Explained – Page 4
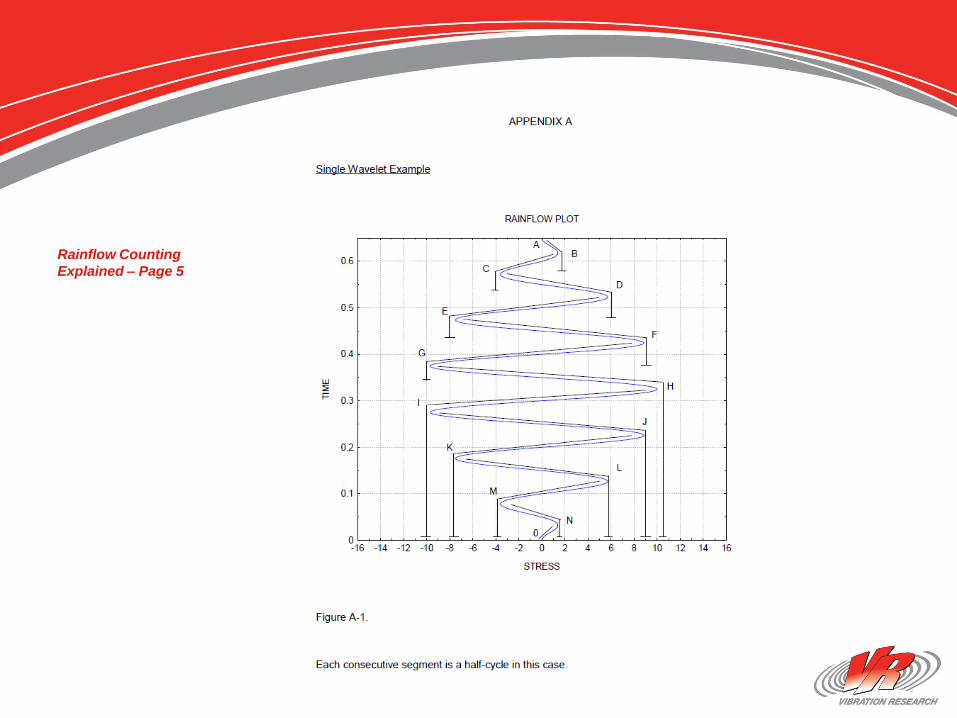
Rainflow Counting
Explained – Page 5
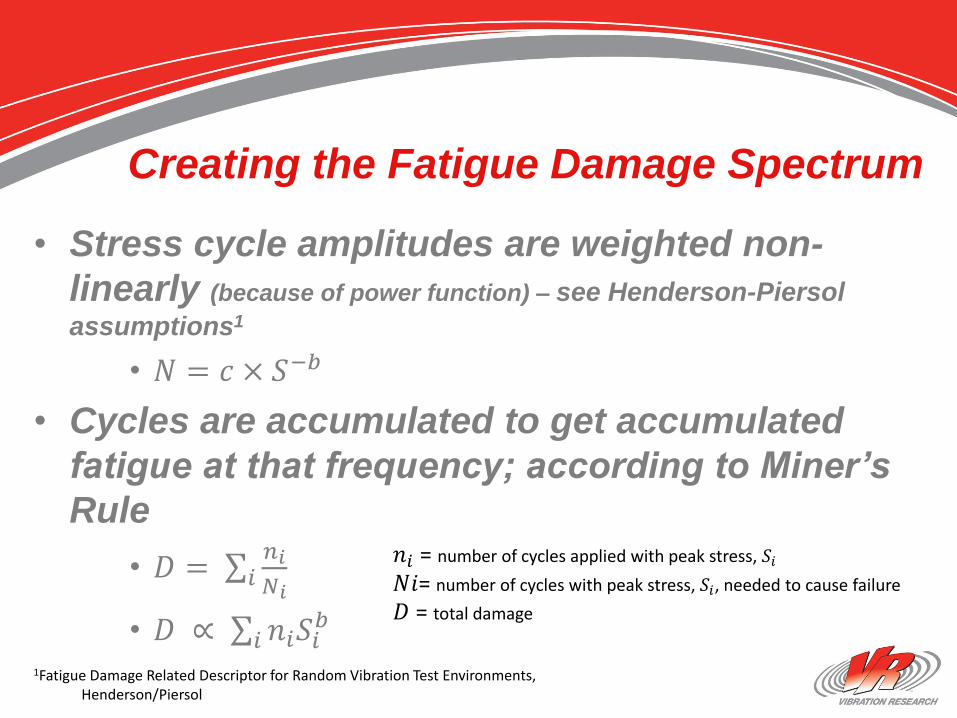
Creating the Fatigue Damage Spectrum
• Stress cycle amplitudes are weighted non-
linearly (because of power function) – see Henderson-Piersol
assumptions1
• 𝑁 = 𝑐 × 𝑆−𝑏
• Cycles are accumulated to get accumulated
fatigue at that frequency; according to Miner’s
Rule
• 𝐷 = 𝑖𝑛𝑖
𝑁𝑖
• 𝐷 ∝ 𝑖 𝑛𝑖𝑆𝑖𝑏
𝑛𝑖 = number of cycles applied with peak stress, 𝑆𝑖
𝑁𝑖= number of cycles with peak stress, 𝑆𝑖, needed to cause failure
𝐷 = total damage
1Fatigue Damage Related Descriptor for Random Vibration Test Environments,Henderson/Piersol
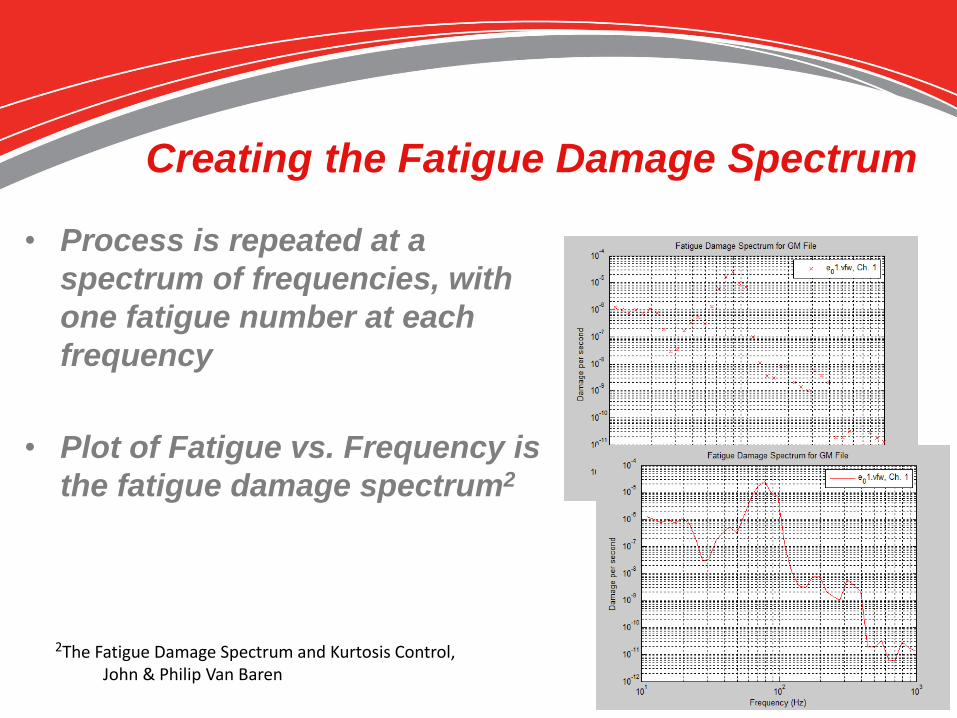
• Process is repeated at a
spectrum of frequencies, with
one fatigue number at each
frequency
• Plot of Fatigue vs. Frequency is
the fatigue damage spectrum2
18
2The Fatigue Damage Spectrum and Kurtosis Control,John & Philip Van Baren
Creating the Fatigue Damage Spectrum
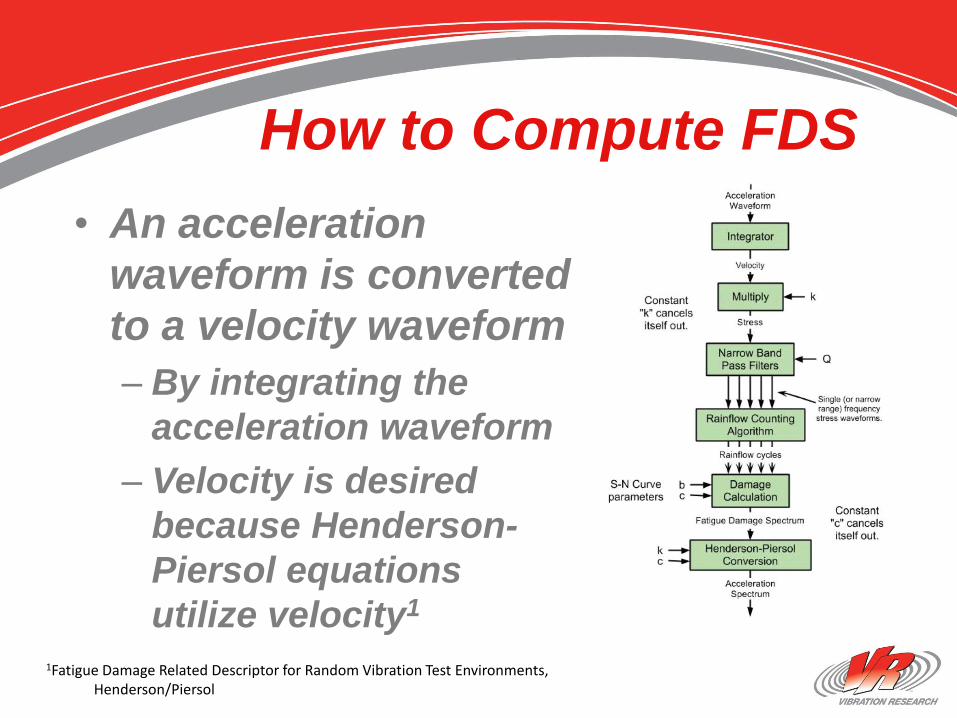
How to Compute FDS
• An acceleration
waveform is converted
to a velocity waveform
– By integrating the
acceleration waveform
– Velocity is desired
because Henderson-
Piersol equations
utilize velocity1
1Fatigue Damage Related Descriptor for Random Vibration Test Environments,Henderson/Piersol
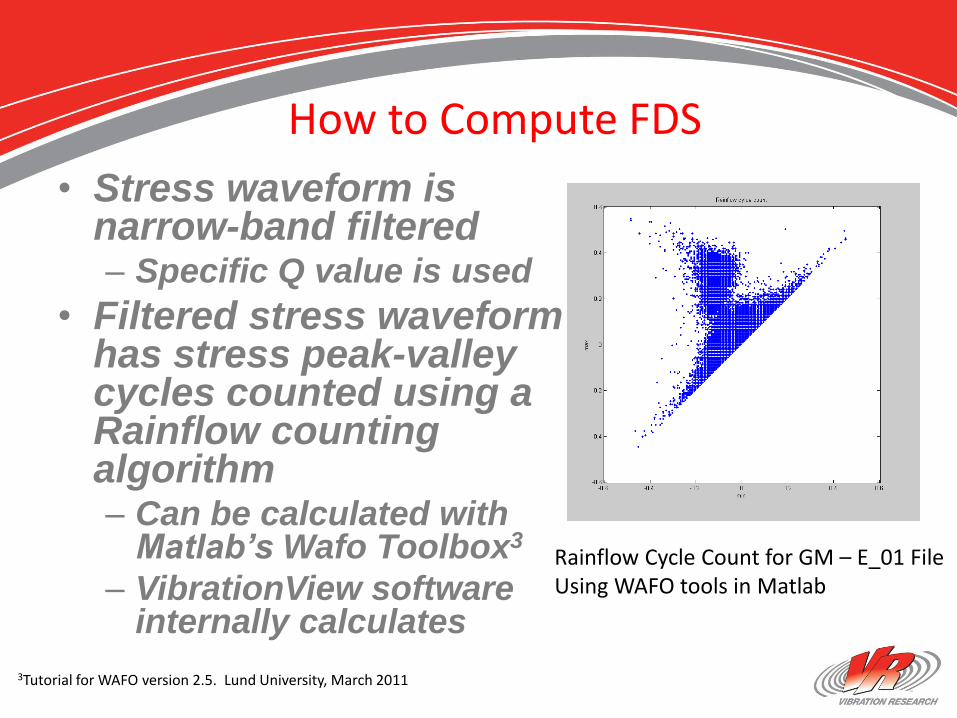
• Stress waveform is narrow-band filtered– Specific Q value is used
• Filtered stress waveform has stress peak-valley cycles counted using a Rainflow counting algorithm – Can be calculated with
Matlab’s Wafo Toolbox3
– VibrationView software internally calculates
Rainflow Cycle Count for GM – E_01 FileUsing WAFO tools in Matlab
3Tutorial for WAFO version 2.5. Lund University, March 2011
How to Compute FDS
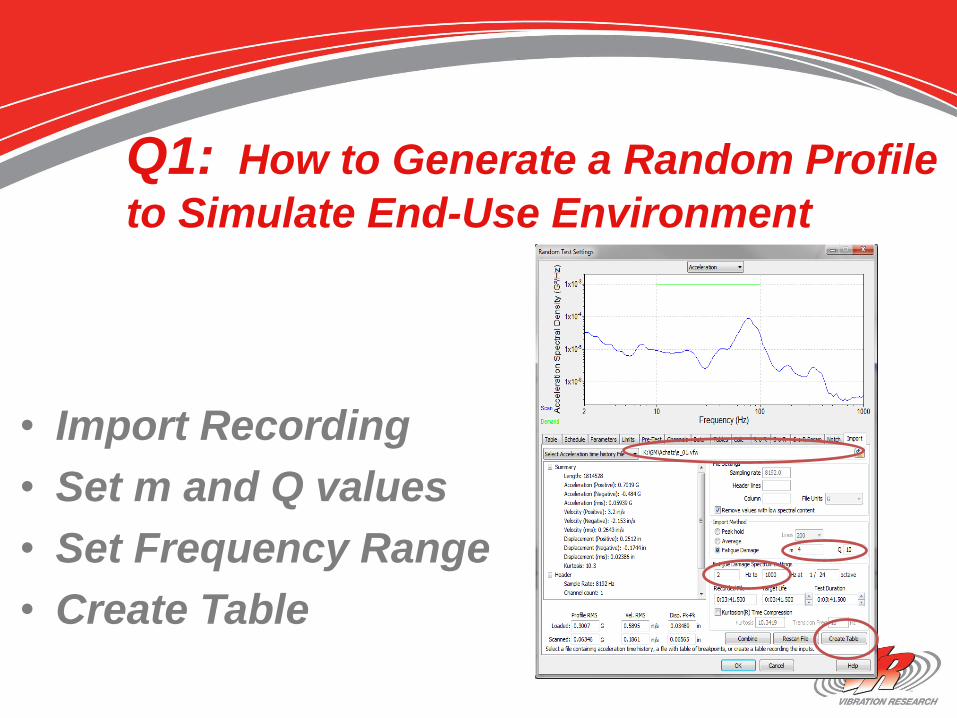
Q1: How to Generate a Random Profile
to Simulate End-Use Environment
• Import Recording
• Set m and Q values
• Set Frequency Range
• Create Table
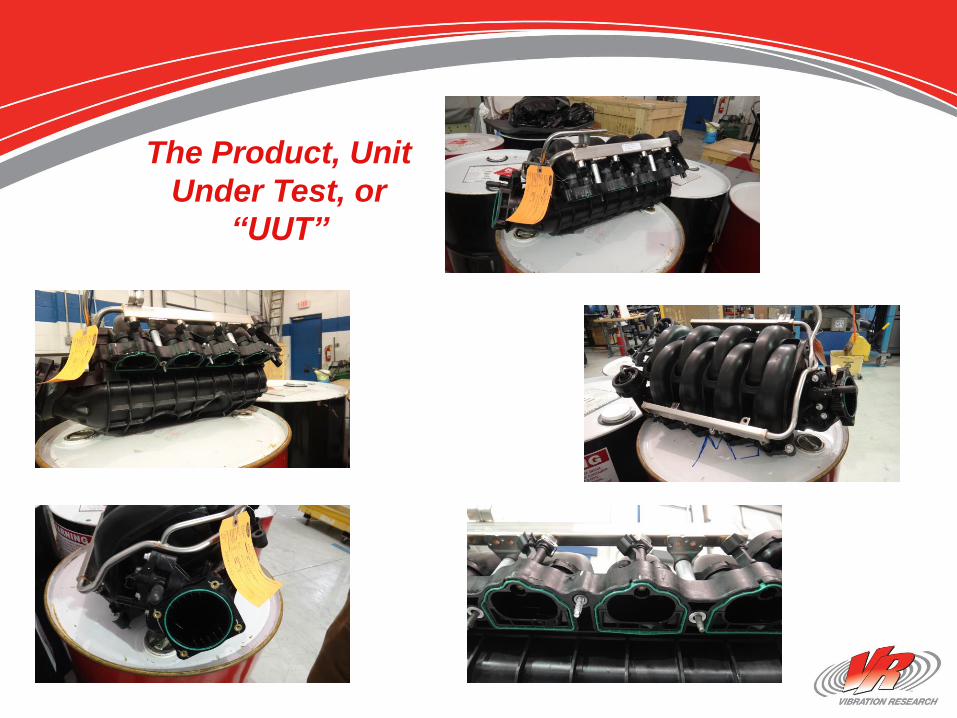
The Product, Unit
Under Test, or
“UUT”
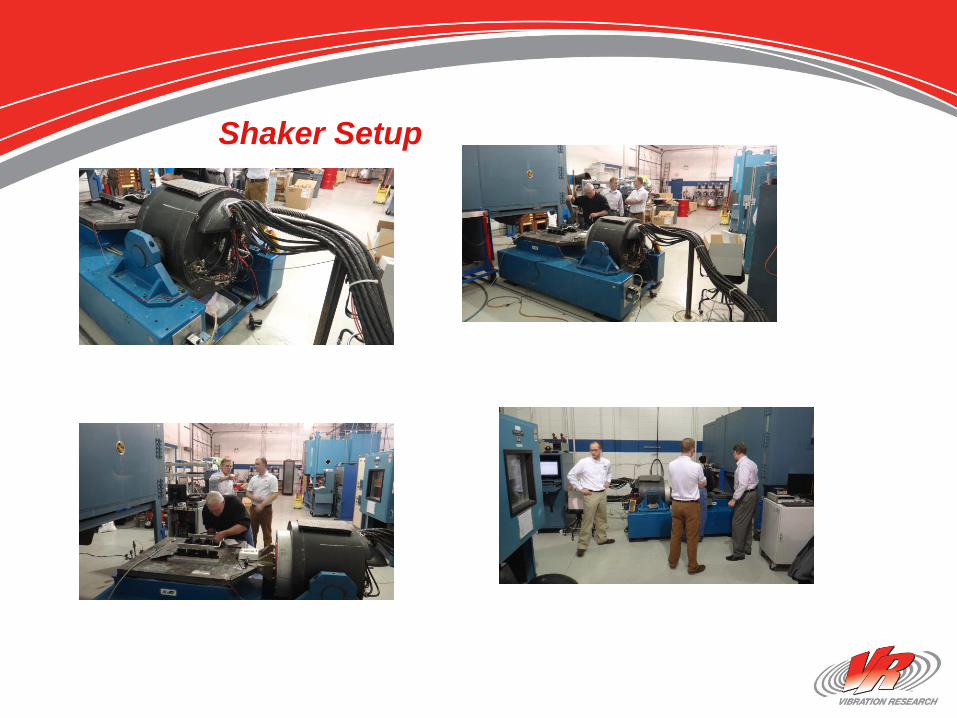
Shaker Setup
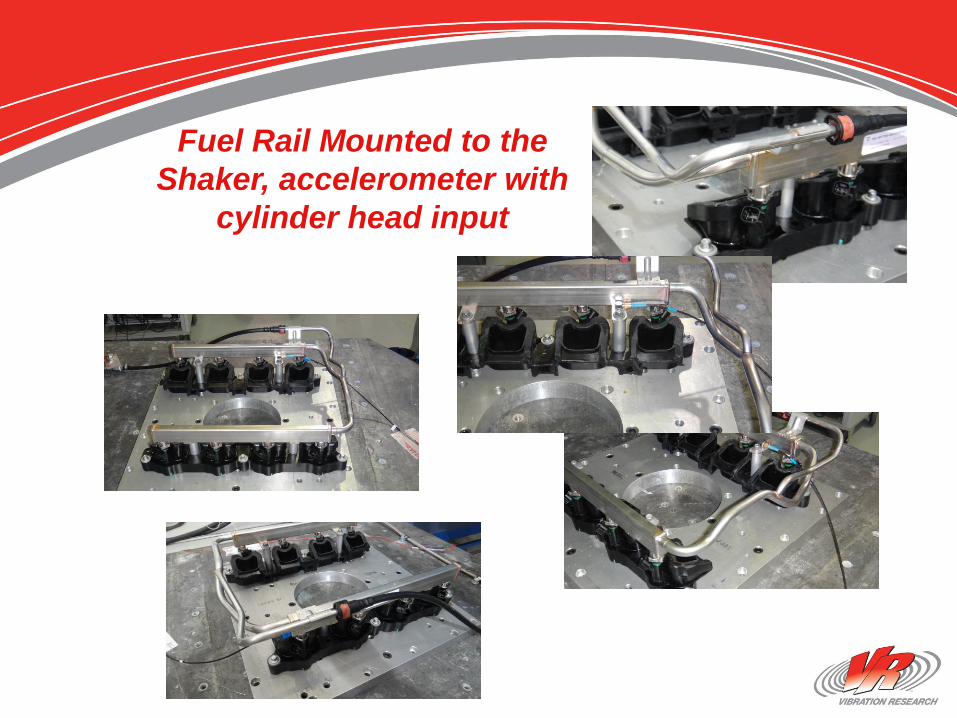
Fuel Rail Mounted to the
Shaker, accelerometer with
cylinder head input
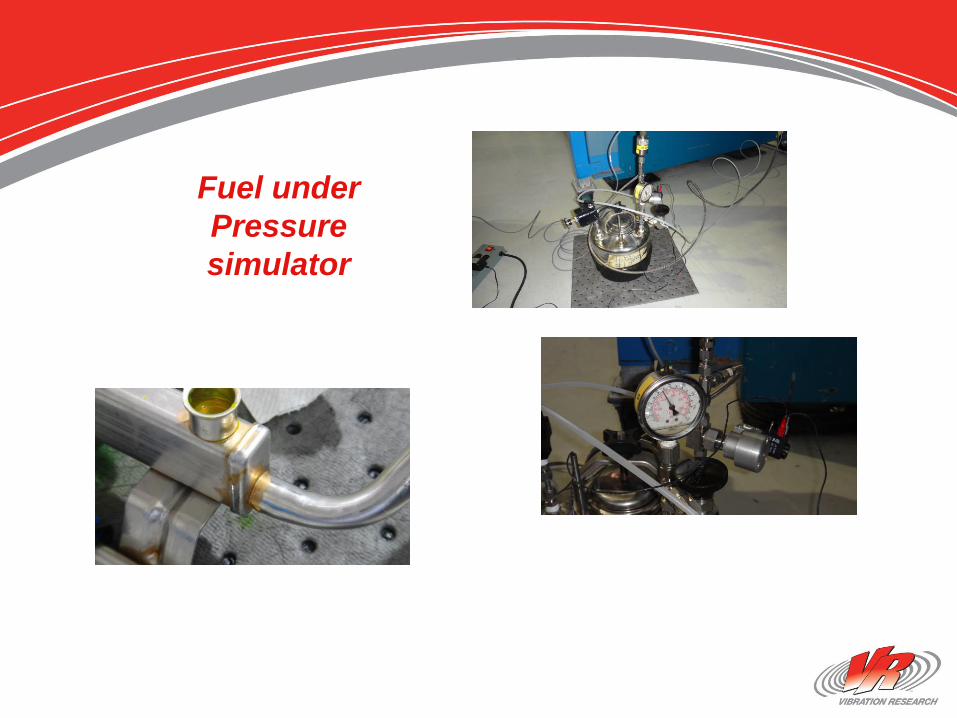
Fuel under
Pressure
simulator
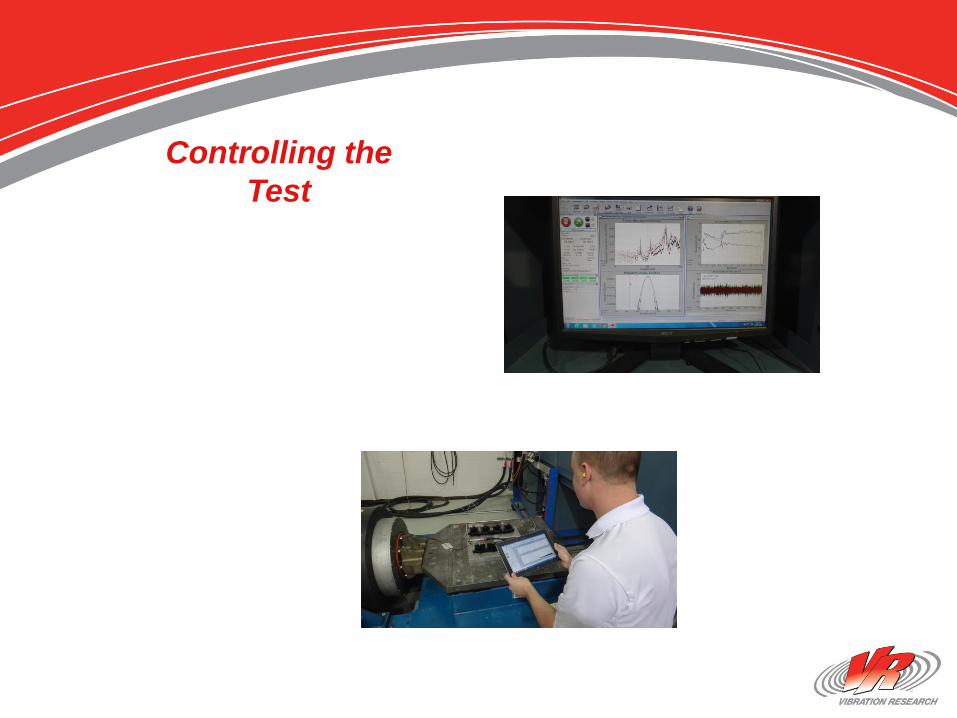
Controlling the
Test
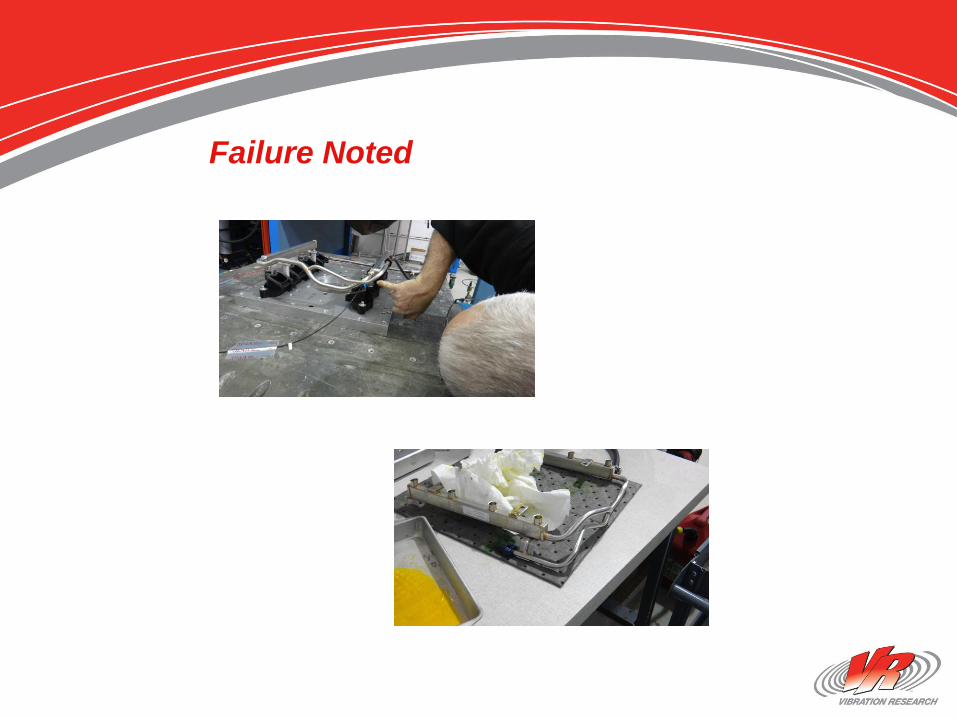
Failure Noted
• Engine Run up data (2:21):
• http://www.screencast.com/t/lKG9CvumG
•
• FDS import and random profile generation process (4:46):
• http://www.screencast.com/t/IgRZX2YR
•
• These two files are also found on our web site, in slightly lower
resolution:
• http://www.vibrationresearch.com/fds.html
Illustration Videos
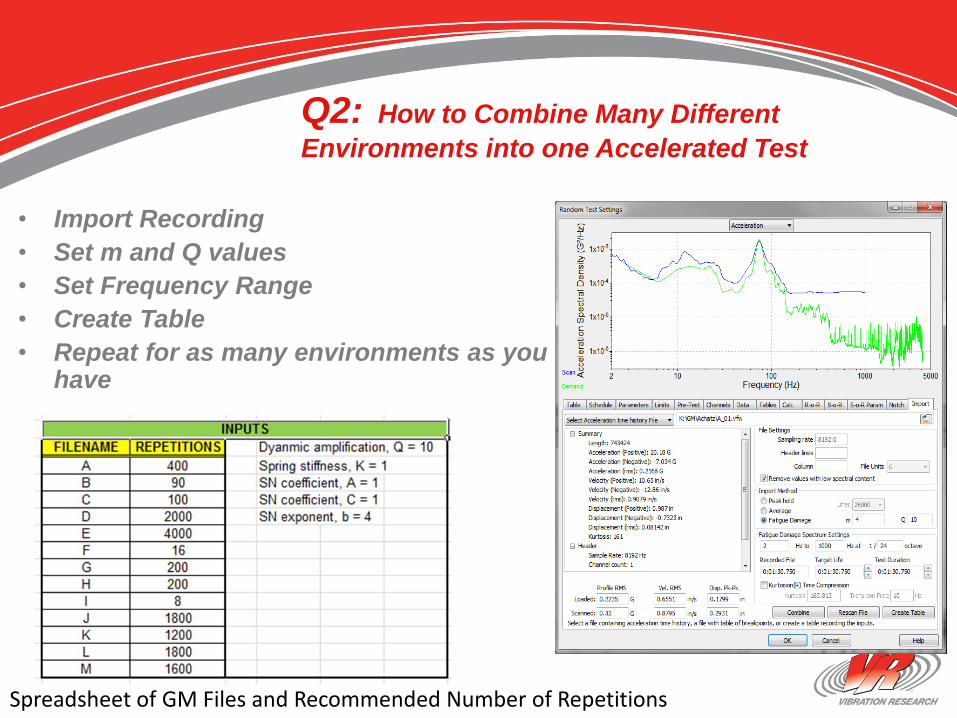
Q2: How to Combine Many Different
Environments into one Accelerated Test
• Import Recording
• Set m and Q values
• Set Frequency Range
• Create Table
• Repeat for as many environments as you have
Spreadsheet of GM Files and Recommended Number of Repetitions
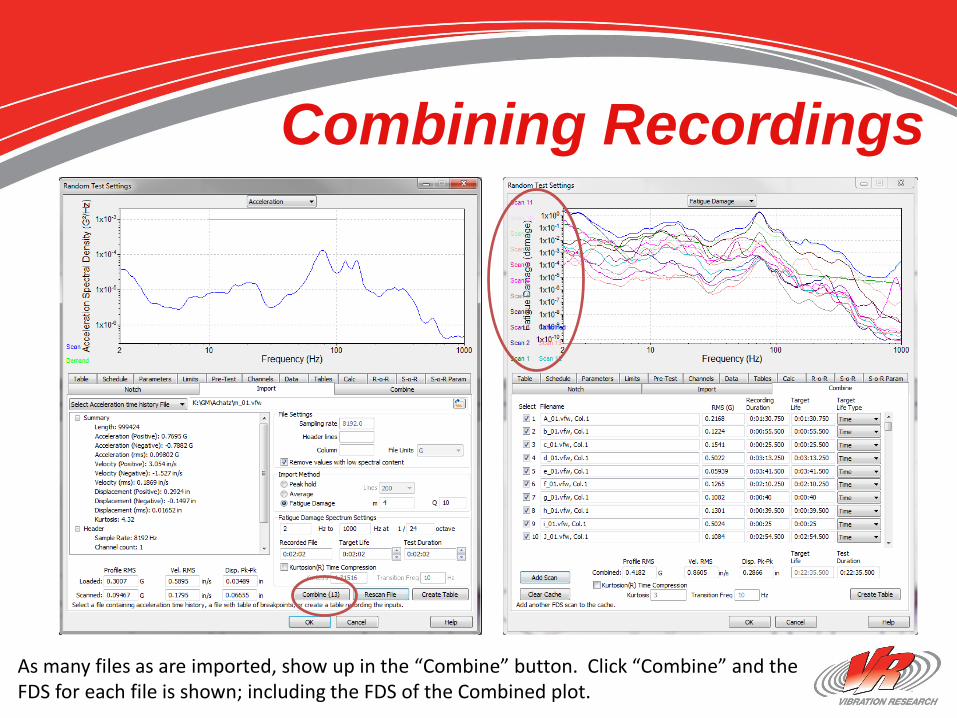
Combining Recordings
As many files as are imported, show up in the “Combine” button. Click “Combine” and the FDS for each file is shown; including the FDS of the Combined plot.
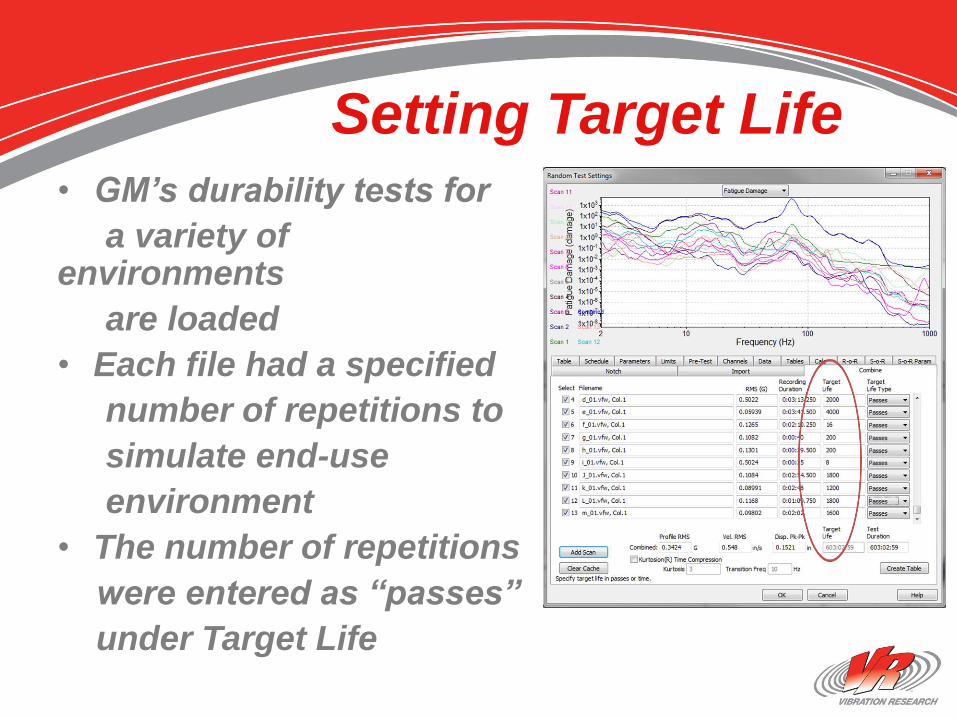
Setting Target Life• GM’s durability tests for
a variety of environments
are loaded
• Each file had a specified
number of repetitions to
simulate end-use
environment
• The number of repetitions
were entered as “passes”
under Target Life
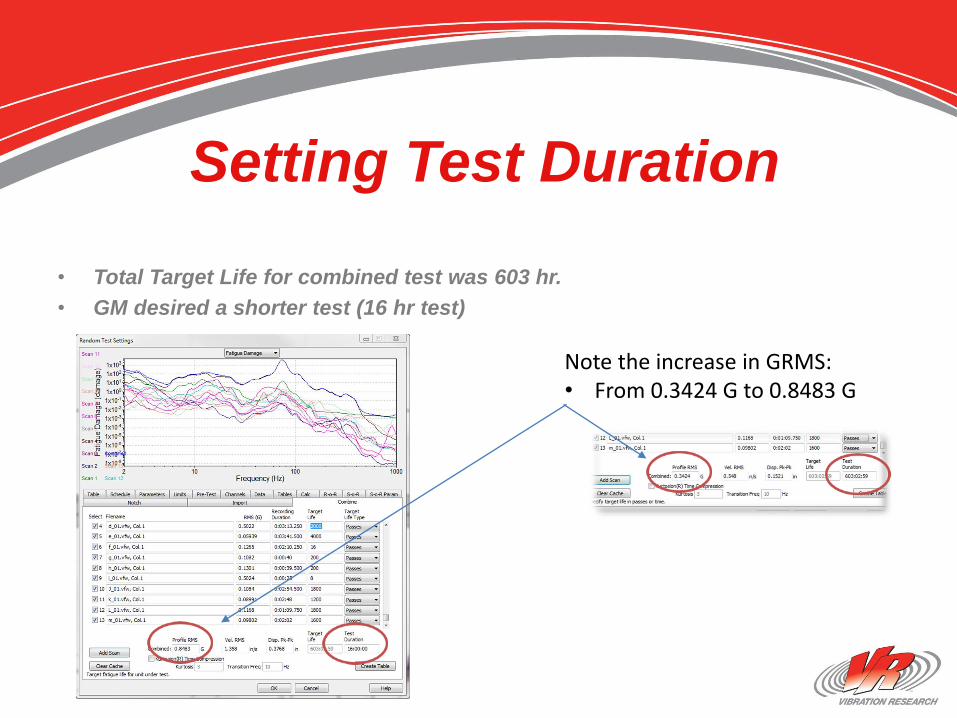
Setting Test Duration
• Total Target Life for combined test was 603 hr.
• GM desired a shorter test (16 hr test)
Note the increase in GRMS:• From 0.3424 G to 0.8483 G

Q3: How to Use FDS to Accelerate a Test
• Accelerate a test:
– Use FDS
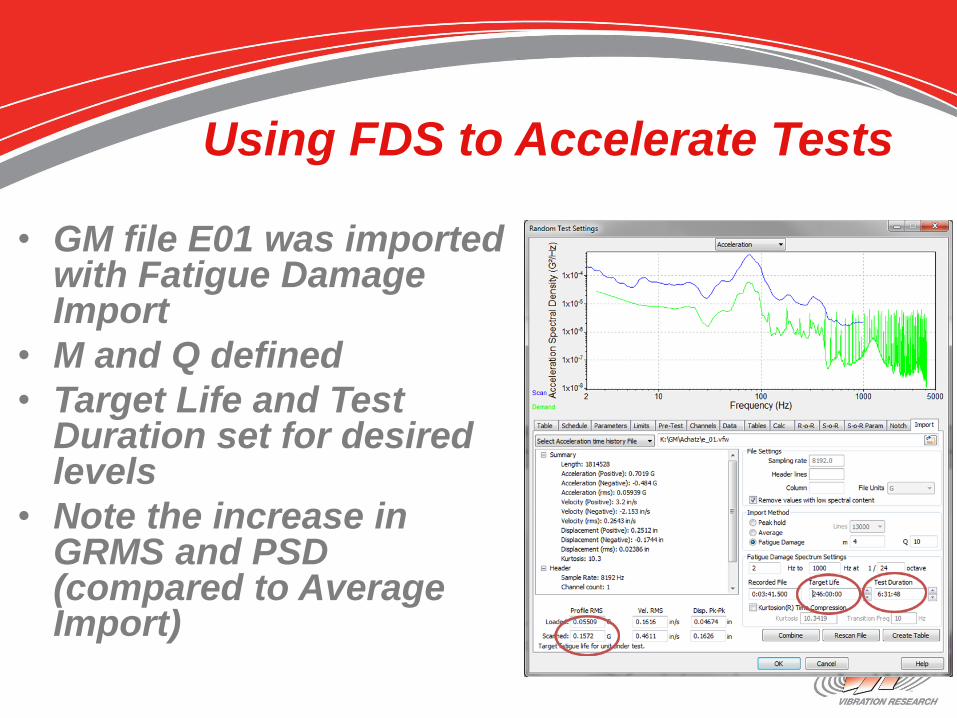
Using FDS to Accelerate Tests
• GM file E01 was imported with Fatigue Damage Import
• M and Q defined
• Target Life and Test Duration set for desired levels
• Note the increase in GRMS and PSD (compared to Average Import)
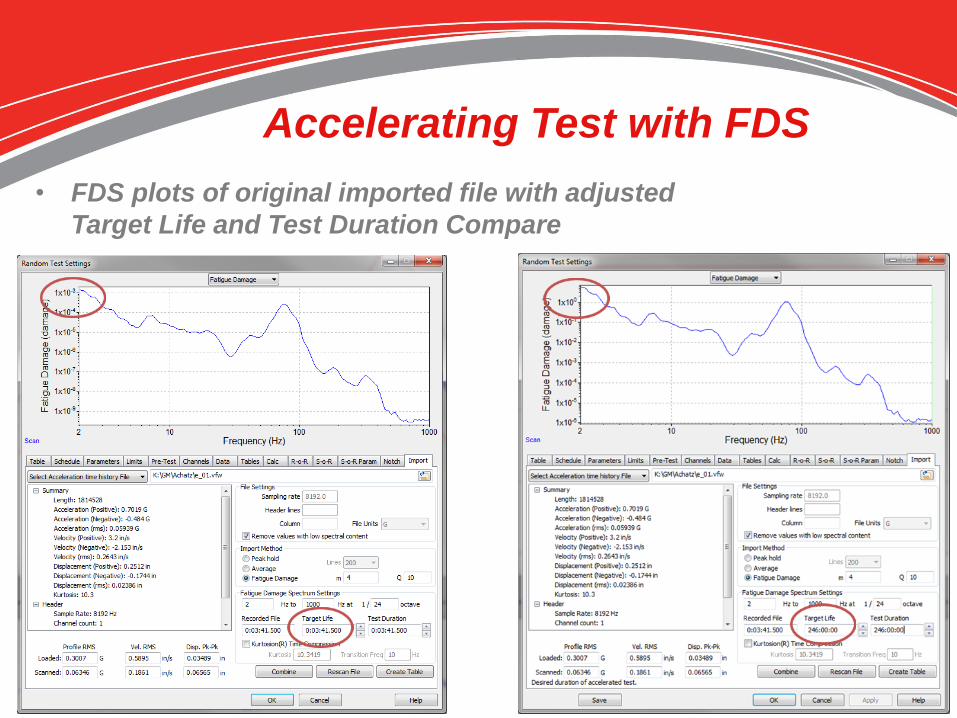
Accelerating Test with FDS
• FDS plots of original imported file with adjusted
Target Life and Test Duration Compare
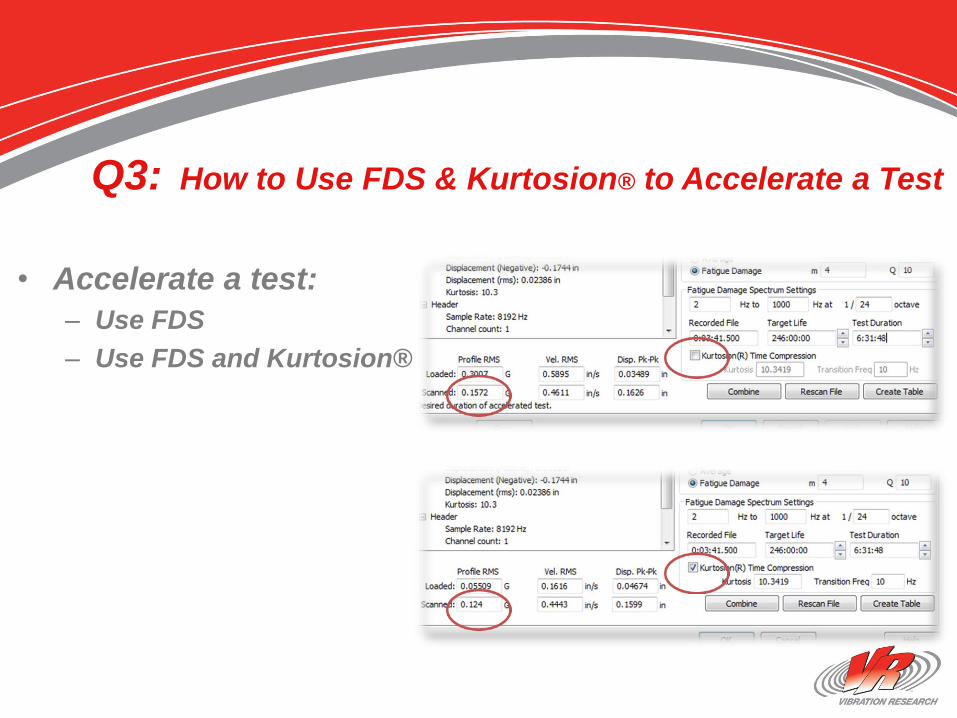
Q3: How to Use FDS & Kurtosion® to Accelerate a Test
• Accelerate a test:
– Use FDS
– Use FDS and Kurtosion®

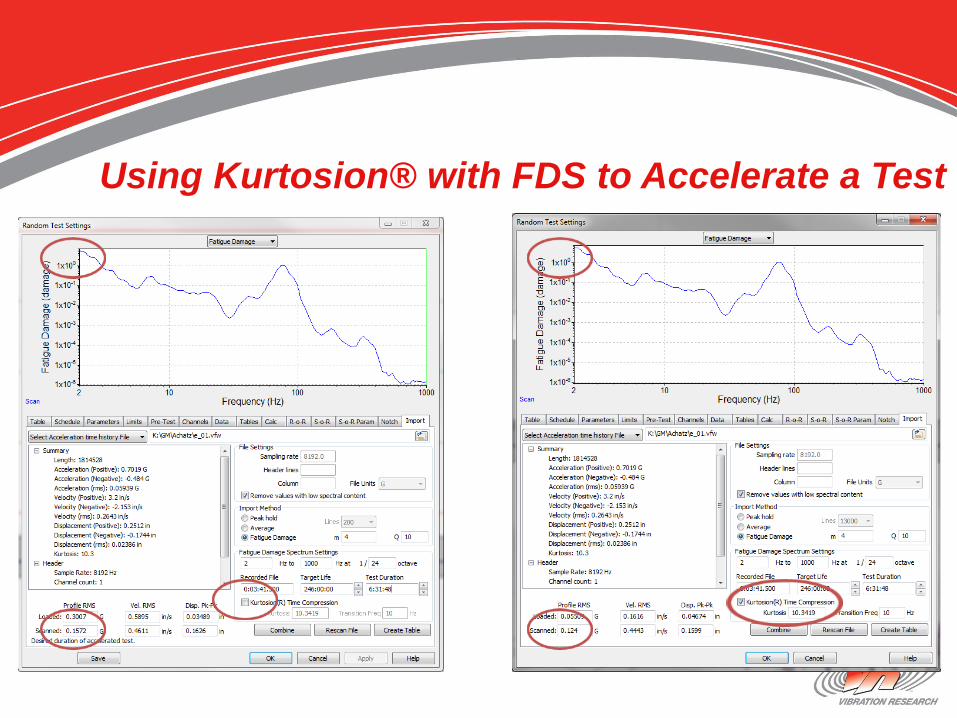
Using Kurtosion® with FDS to Accelerate a Test
• Original Fatigue Damage Import assumes
Gaussian distribution. Converting the FDS back
to a PSD (through Henderson-Piersol equations)
assumes Gaussian
• Kurtosion® can be added to Fatigue Damage
Import to further accelerate test
• Kurtosion® will provide the same amount of total
fatigue damage, but do so in a faster time
(because large peaks are restored to the test)
Using Kurtosion® with FDS to Accelerate a Test
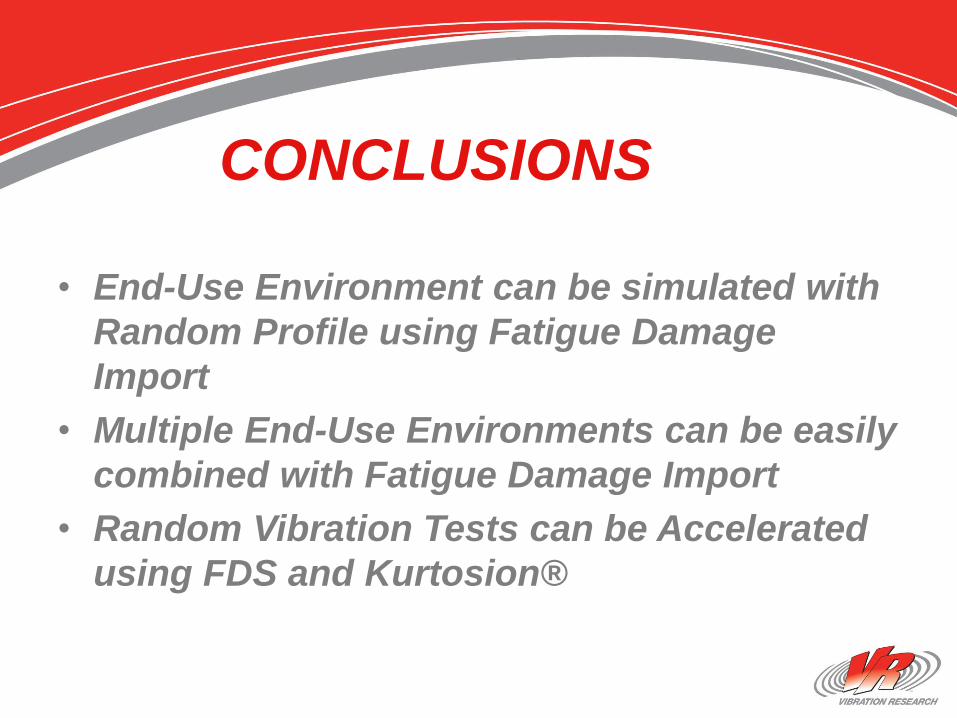
CONCLUSIONS
• End-Use Environment can be simulated with
Random Profile using Fatigue Damage
Import
• Multiple End-Use Environments can be easily
combined with Fatigue Damage Import
• Random Vibration Tests can be Accelerated
using FDS and Kurtosion®
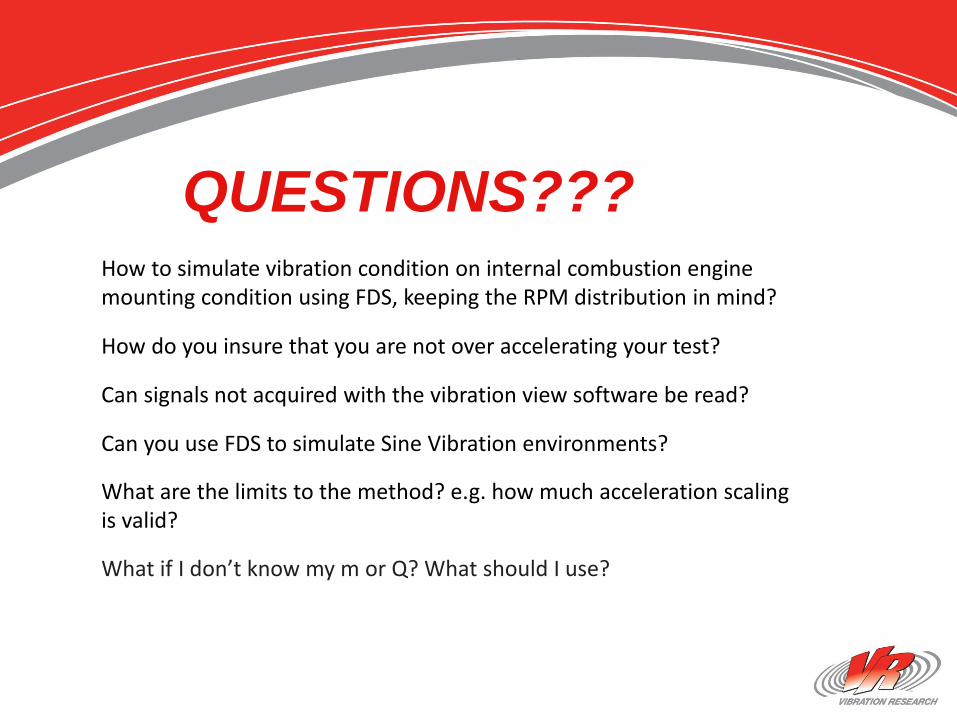
QUESTIONS???How to simulate vibration condition on internal combustion engine mounting condition using FDS, keeping the RPM distribution in mind?
How do you insure that you are not over accelerating your test?
Can signals not acquired with the vibration view software be read?
Can you use FDS to simulate Sine Vibration environments?
What are the limits to the method? e.g. how much acceleration scaling is valid?
What if I don’t know my m or Q? What should I use?
QUESTIONS???Is it expected that the higher value of Kurtosis, say 6-9 is attenuated
back to 3 during testing?
Can the software tell you if your shaker won't be able to handle
the kurtosis?
What is the default transition frequency resolution?

QUESTIONS???
If you would like answers to any of these questions feel free to email us or give us a call and we would be more than willing to help out.
Website Registration
• Go to
http://www.vibrationresearch.com/forums/register.php?do=signup
• In the sign up form, please do not include “HTTPS” in your company’s
website
• To obtain a copy of these Slides:
E-mail: [email protected]
• Tech Support: Ph: 616-669-3028
E-Mail: [email protected]
• Visit Us Online at: www.vibrationresearch.com
• Next Webinar: March 5, 2015 Topic: v.2015 VibrationVIEW Software
Highlights
Thank You for Attending!