using environmental constraints to formulate low-impact poultry feeds
TRANSCRIPT
lable at ScienceDirect
Journal of Cleaner Production 28 (2012) 215e224
Contents lists avai
Journal of Cleaner Production
journal homepage: www.elsevier .com/locate/ jc lepro
Using environmental constraints to formulate low-impact poultry feeds
T.T.H. Nguyen a,c,d,*, Isabelle Bouvarel a, Paul Ponchant b, Hayo M.G. van der Werf c,d
a ITAVI, Centre INRA Tours, 37380 Nouzilly, Franceb ITAVI, Zoopôle Beaucemaine, 22440 Ploufragan, Francec INRA, UMR1069, Soil Agro and hydroSystem, 35000 Rennes, FrancedAgrocampus Ouest, UMR1069, Soil Agro and hydroSystem, 35000 Rennes, France
a r t i c l e i n f o
Article history:Received 9 November 2010Received in revised form25 June 2011Accepted 28 June 2011Available online 6 July 2011
Keywords:Eutrophication potentialClimate changeEnvironmental constraintsFeed formulationPoultry feed
* Corresponding author. INRA Clermont-Ferrand63122 Saint-Genés-Champanelle, France. Tel.: þ33 4742 73.
E-mail address: Thi-Tuyet-Hanh.Nguyen@clermon
0959-6526/$ e see front matter � 2011 Elsevier Ltd.doi:10.1016/j.jclepro.2011.06.029
a b s t r a c t
With the aim of reducing the environmental impacts of poultry feed, a database of the impacts of feedcomponents destined for formulation was constructed using the Life Cycle Assessment (LCA) method. Weused linear programming to create least cost feed formulas for fast-growing broiler (FGB), slow-growingbroiler (SGB, i.e. quality label), laying hen and for three contrasting feed-cost situations (January 2006,December 2007 and March 2009). We focused on Eutrophication Potential (EP, a regional impact) andClimate Change (CC, a global impact) which were constraints to formulate low-impact poultry feed. Theeffects of using these constraints on feed cost and the use of feed components were investigated fora feed production plant in Bretagne (western France). Environmental impacts of poultry feed increasedwith the energy and protein content of the formula and were affected by the relative costs of feedcomponents. FGB formulas had the highest impacts, followed by formulas for SGB and laying hens. Thesearch for a minimum level of EP and CC of the formula decreased its impacts by 1e8% and by 1e12%respectively, and increased its cost by 2e8%, depending on the type of feed and the feed-cost situation.Impact reduction was obtained by partial substitution of soybean meal and cereals by rapeseed meal,grain legumes and co-products (wheat bran, gluten). Furthermore, 70% of the potential reduction of theEP and CC impacts could be obtained at a modest (0.5e4%) increase in the cost of the formulas. Someother ways to reduce feed impacts were explored, such as taking into account the geographic origin ofmaize crops and adopting a modified regulatory constraint for SGB formulas. It is important to continuethis study by taking into account the whole life cycle of poultry production.
� 2011 Elsevier Ltd. All rights reserved.
1. Introduction
French poultry production is the fifth largest in the world,following poultry production in the United States, China, Brazil andMexico, and the largest in the European Union with 1.85 milliontonnes of carcass equivalent in 2008 (ITAVI, 2010). According to theFrench government statistics for agriculture (AGRESTE Primeur,2007), poultry feed accounted for 40% (8.44 million tonnes) oftotal concentrate feed production in France. Poultry consumesconcentrated feed rich inprotein and energy, containing ingredientssuch as cereals (wheat, maize) and soybeanmeal. Generally, poultryproduction depends on feed imported from outside the farm.
Life cycle assessment (LCA) is a method for integral assessmentof the environmental impacts of products, processes or services byincluding all phases of the life cycle (ISO, 2006a,b). The potential
/Theix, UR1213 Herbivores,3 62 40 93; fax: þ33 473 62
t.inra.fr (T.T.H. Nguyen).
All rights reserved.
environmental impacts of a product are assessed by quantifyingand evaluating the resources consumed, such as land or fossil fuels,and the emissions to the environment, such as ammonia ormethane, at all stages of its life cycle (Guinée et al., 2002). Using theLCA approach from cradle to farm gate, feed production has beenidentified as one of the major contributors to the environmentalimpacts (50e85% for climate change, 64e97% for eutrophicationpotential, 70e96% for energy use) of animal production systems(Basset-Mens and van der Werf, 2005; Eriksson et al., 2005;Pelletier, 2008; Cederberg et al., 2009; Boggia et al., 2010). Linearprogramming is used by feeding experts to formulate commercialfeed rations for animals. The traditional linear programming modelaims to find the least cost combination of ingredients satisfyinga specific level of nutritional requirements and regulatoryconstraints. The question is whether there are feed formulationstrategies, in a specific feed-cost situation, which can reduceenvironmental impacts of concentrate feed for poultry.
The aims of this study are (1) to assess the environmentalimpacts of poultry feed formulas using an LCA database of feed
T.T.H. Nguyen et al. / Journal of Cleaner Production 28 (2012) 215e224216
components and a linear programming tool for three contrastingfeed-cost situations and (2) to analyze the effects of using envi-ronmental constraints to formulate low-impact poultry feeds onfeed cost and the use of feed components.
2. Materials and methods
2.1. LCA of poultry feed ingredients
Feed formulation is based on the characteristics of feed ingre-dients at the entrance of the feed mill. Thus, this study assesses theimpacts of feed formulas as the mix of feed ingredients at theentrance of the feed mill and does not deal with the entire life cycleof poultry feed. The crop production on the farm, the subsequentdrying and processing (e.g. extraction of oil), and the transport offeed components to the feed mill were included. Processing at feedmill (grinding, pelleting) was not included. The functional unitsused were “1 kg of feed ingredient delivered at the feed mill” and“1 kg of amix of feed ingredients corresponding to a feed formula atthe gate of the feed mill”. Upstream process concerning resourceuse and emissions associated with the production and delivery ofinputs for crop production (manufactured fertilisers, pesticides,agricultural machinery, diesel), fieldwork processes and delivery ofcrop products to the feed mill were from the Ecoinvent database,version 2.0 (Nemecek and Kägi, 2007).
We assumed that atmospheric CO2 absorbed by the cropbiomass will be emitted in the short-term by livestock or humanswho will consume crop products. We therefore did not consideratmospheric CO2 uptake in the crop biomass.
2.1.1. Crop productionThe period considered for crops produced in France begins
before the soil preparation for the crop in question and ends beforethe soil preparation for the next cash crop. This period may includea catch crop. Inputs used and cultivation management were basedon a recent survey of agricultural practices (AGRESTE, 2006). Use ofagricultural machinery was expressed as kg of machinery per ha.Values were calculated by allocating total machine weightaccording to the hours of use for 1 ha compared to the total hours ofuse over the life of themachinery. Yield levels were averages for the
Table 1Main inputs used, dry matter yield (except for palm fruit) and nitrate-N leached for thMalaysia).
Crop Nmanufactured
Nmanure
P2O5 (triplesuperphosphate)
K2O (potassiumchloride)
CaO
kg/ha kg/ha kg/ha kg/ha kg/ha
Wheat FR 165 10 26 24 167Maize FR 150 50 57 63 167MaizeAquitaine
189 46 67 85 167
MaizeMidi-Pyrénées
188 23 70 65 167
MaizePoitou-Charentes
169 29 48 43 167
MaizePays dela Loire
92 114 26 0 167
Maize Centre 155 24 62 60 167Maize Bretagne 32 210 29 0 167
Peas FR 0 0 44 69 167Faba bean FR 0 0 26 39 167Rapeseed FR 165 16 50 50 167Sunflower FR 39 27 34 40 167Soybean BR 5.5 1.3 80 80 518Palm ML 104 0 70 204 43
a Data for all crops concern a one-year period, except for soybean, where data are forb Yield on fresh weight of palm fresh fruit brunches.
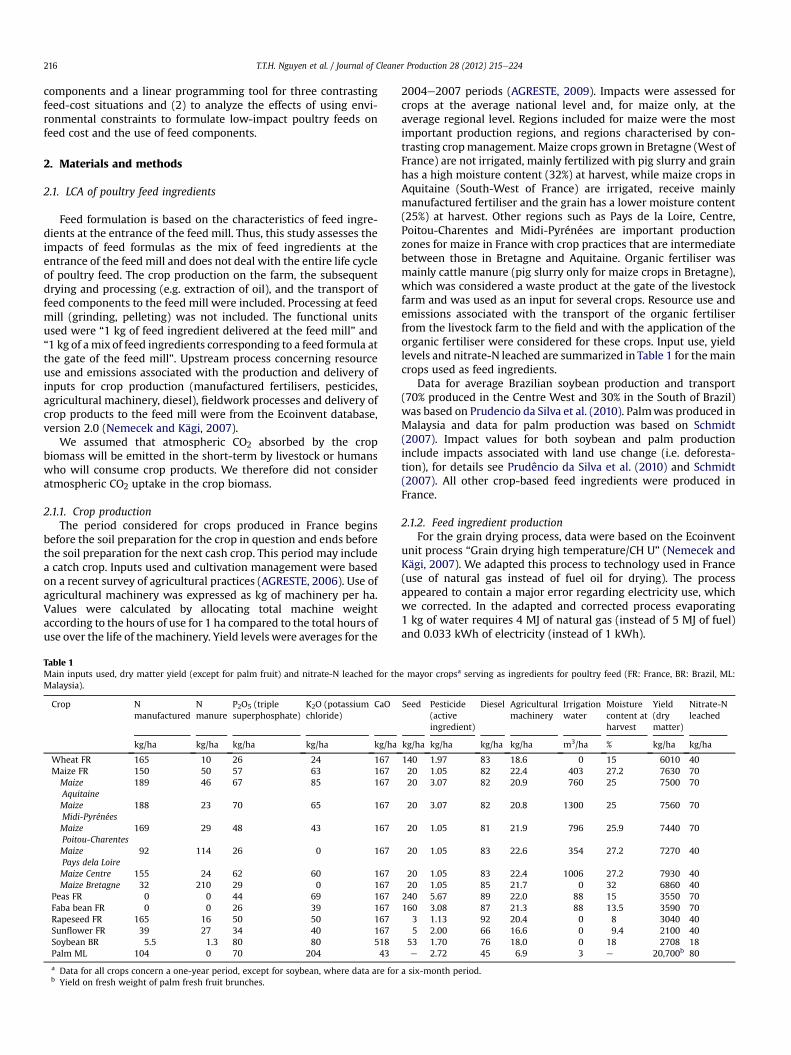
2004e2007 periods (AGRESTE, 2009). Impacts were assessed forcrops at the average national level and, for maize only, at theaverage regional level. Regions included for maize were the mostimportant production regions, and regions characterised by con-trasting cropmanagement. Maize crops grown in Bretagne (West ofFrance) are not irrigated, mainly fertilized with pig slurry and grainhas a high moisture content (32%) at harvest, while maize crops inAquitaine (South-West of France) are irrigated, receive mainlymanufactured fertiliser and the grain has a lower moisture content(25%) at harvest. Other regions such as Pays de la Loire, Centre,Poitou-Charentes and Midi-Pyrénées are important productionzones for maize in France with crop practices that are intermediatebetween those in Bretagne and Aquitaine. Organic fertiliser wasmainly cattle manure (pig slurry only for maize crops in Bretagne),which was considered a waste product at the gate of the livestockfarm and was used as an input for several crops. Resource use andemissions associated with the transport of the organic fertiliserfrom the livestock farm to the field and with the application of theorganic fertiliser were considered for these crops. Input use, yieldlevels and nitrate-N leached are summarized in Table 1 for themaincrops used as feed ingredients.
Data for average Brazilian soybean production and transport(70% produced in the Centre West and 30% in the South of Brazil)was based on Prudencio da Silva et al. (2010). Palmwas produced inMalaysia and data for palm production was based on Schmidt(2007). Impact values for both soybean and palm productioninclude impacts associated with land use change (i.e. deforesta-tion), for details see Prudêncio da Silva et al. (2010) and Schmidt(2007). All other crop-based feed ingredients were produced inFrance.
2.1.2. Feed ingredient productionFor the grain drying process, data were based on the Ecoinvent
unit process “Grain drying high temperature/CH U” (Nemecek andKägi, 2007). We adapted this process to technology used in France(use of natural gas instead of fuel oil for drying). The processappeared to contain a major error regarding electricity use, whichwe corrected. In the adapted and corrected process evaporating1 kg of water requires 4 MJ of natural gas (instead of 5 MJ of fuel)and 0.033 kWh of electricity (instead of 1 kWh).
e mayor cropsa serving as ingredients for poultry feed (FR: France, BR: Brazil, ML:
Seed Pesticide(activeingredient)
Diesel Agriculturalmachinery
Irrigationwater
Moisturecontent atharvest
Yield(drymatter)
Nitrate-Nleached
kg/ha kg/ha kg/ha kg/ha m3/ha % kg/ha kg/ha
140 1.97 83 18.6 0 15 6010 4020 1.05 82 22.4 403 27.2 7630 7020 3.07 82 20.9 760 25 7500 70
20 3.07 82 20.8 1300 25 7560 70
20 1.05 81 21.9 796 25.9 7440 70
20 1.05 83 22.6 354 27.2 7270 40
20 1.05 83 22.4 1006 27.2 7930 4020 1.05 85 21.7 0 32 6860 40
240 5.67 89 22.0 88 15 3550 70160 3.08 87 21.3 88 13.5 3590 70
3 1.13 92 20.4 0 8 3040 405 2.00 66 16.6 0 9.4 2100 40
53 1.70 76 18.0 0 18 2708 18e 2.72 45 6.9 3 e 20,700b 80
a six-month period.
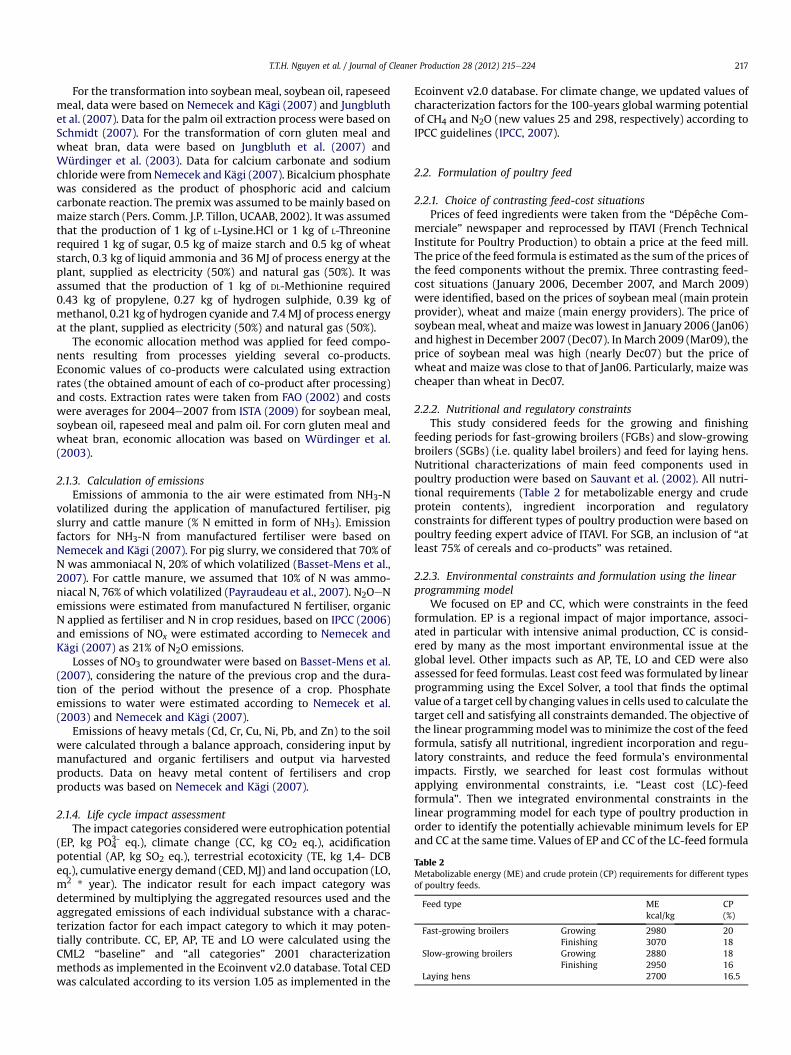
Table 2Metabolizable energy (ME) and crude protein (CP) requirements for different typesof poultry feeds.
Feed type MEkcal/kg
CP(%)
Fast-growing broilers Growing 2980 20Finishing 3070 18
Slow-growing broilers Growing 2880 18Finishing 2950 16
Laying hens 2700 16.5
T.T.H. Nguyen et al. / Journal of Cleaner Production 28 (2012) 215e224 217
For the transformation into soybean meal, soybean oil, rapeseedmeal, data were based on Nemecek and Kägi (2007) and Jungbluthet al. (2007). Data for the palm oil extraction process were based onSchmidt (2007). For the transformation of corn gluten meal andwheat bran, data were based on Jungbluth et al. (2007) andWürdinger et al. (2003). Data for calcium carbonate and sodiumchloride were fromNemecek and Kägi (2007). Bicalcium phosphatewas considered as the product of phosphoric acid and calciumcarbonate reaction. The premix was assumed to bemainly based onmaize starch (Pers. Comm. J.P. Tillon, UCAAB, 2002). It was assumedthat the production of 1 kg of L-Lysine.HCl or 1 kg of L-Threoninerequired 1 kg of sugar, 0.5 kg of maize starch and 0.5 kg of wheatstarch, 0.3 kg of liquid ammonia and 36 MJ of process energy at theplant, supplied as electricity (50%) and natural gas (50%). It wasassumed that the production of 1 kg of DL-Methionine required0.43 kg of propylene, 0.27 kg of hydrogen sulphide, 0.39 kg ofmethanol, 0.21 kg of hydrogen cyanide and 7.4MJ of process energyat the plant, supplied as electricity (50%) and natural gas (50%).
The economic allocation method was applied for feed compo-nents resulting from processes yielding several co-products.Economic values of co-products were calculated using extractionrates (the obtained amount of each of co-product after processing)and costs. Extraction rates were taken from FAO (2002) and costswere averages for 2004e2007 from ISTA (2009) for soybean meal,soybean oil, rapeseed meal and palm oil. For corn gluten meal andwheat bran, economic allocation was based on Würdinger et al.(2003).
2.1.3. Calculation of emissionsEmissions of ammonia to the air were estimated from NH3-N
volatilized during the application of manufactured fertiliser, pigslurry and cattle manure (% N emitted in form of NH3). Emissionfactors for NH3-N from manufactured fertiliser were based onNemecek and Kägi (2007). For pig slurry, we considered that 70% ofN was ammoniacal N, 20% of which volatilized (Basset-Mens et al.,2007). For cattle manure, we assumed that 10% of N was ammo-niacal N, 76% of which volatilized (Payraudeau et al., 2007). N2OeNemissions were estimated from manufactured N fertiliser, organicN applied as fertiliser and N in crop residues, based on IPCC (2006)and emissions of NOx were estimated according to Nemecek andKägi (2007) as 21% of N2O emissions.
Losses of NO3 to groundwater were based on Basset-Mens et al.(2007), considering the nature of the previous crop and the dura-tion of the period without the presence of a crop. Phosphateemissions to water were estimated according to Nemecek et al.(2003) and Nemecek and Kägi (2007).
Emissions of heavy metals (Cd, Cr, Cu, Ni, Pb, and Zn) to the soilwere calculated through a balance approach, considering input bymanufactured and organic fertilisers and output via harvestedproducts. Data on heavy metal content of fertilisers and cropproducts was based on Nemecek and Kägi (2007).
2.1.4. Life cycle impact assessmentThe impact categories considered were eutrophication potential
(EP, kg PO43- eq.), climate change (CC, kg CO2 eq.), acidification
potential (AP, kg SO2 eq.), terrestrial ecotoxicity (TE, kg 1,4- DCBeq.), cumulative energy demand (CED, MJ) and land occupation (LO,m2 * year). The indicator result for each impact category wasdetermined by multiplying the aggregated resources used and theaggregated emissions of each individual substance with a charac-terization factor for each impact category to which it may poten-tially contribute. CC, EP, AP, TE and LO were calculated using theCML2 “baseline” and “all categories” 2001 characterizationmethods as implemented in the Ecoinvent v2.0 database. Total CEDwas calculated according to its version 1.05 as implemented in the
Ecoinvent v2.0 database. For climate change, we updated values ofcharacterization factors for the 100-years global warming potentialof CH4 and N2O (new values 25 and 298, respectively) according toIPCC guidelines (IPCC, 2007).
2.2. Formulation of poultry feed
2.2.1. Choice of contrasting feed-cost situationsPrices of feed ingredients were taken from the “Dépêche Com-
merciale” newspaper and reprocessed by ITAVI (French TechnicalInstitute for Poultry Production) to obtain a price at the feed mill.The price of the feed formula is estimated as the sum of the prices ofthe feed components without the premix. Three contrasting feed-cost situations (January 2006, December 2007, and March 2009)were identified, based on the prices of soybean meal (main proteinprovider), wheat and maize (main energy providers). The price ofsoybeanmeal, wheat andmaizewas lowest in January 2006 (Jan06)and highest in December 2007 (Dec07). InMarch 2009 (Mar09), theprice of soybean meal was high (nearly Dec07) but the price ofwheat and maize was close to that of Jan06. Particularly, maize wascheaper than wheat in Dec07.
2.2.2. Nutritional and regulatory constraintsThis study considered feeds for the growing and finishing
feeding periods for fast-growing broilers (FGBs) and slow-growingbroilers (SGBs) (i.e. quality label broilers) and feed for laying hens.Nutritional characterizations of main feed components used inpoultry production were based on Sauvant et al. (2002). All nutri-tional requirements (Table 2 for metabolizable energy and crudeprotein contents), ingredient incorporation and regulatoryconstraints for different types of poultry production were based onpoultry feeding expert advice of ITAVI. For SGB, an inclusion of “atleast 75% of cereals and co-products” was retained.
2.2.3. Environmental constraints and formulation using the linearprogramming model
We focused on EP and CC, which were constraints in the feedformulation. EP is a regional impact of major importance, associ-ated in particular with intensive animal production, CC is consid-ered by many as the most important environmental issue at theglobal level. Other impacts such as AP, TE, LO and CED were alsoassessed for feed formulas. Least cost feed was formulated by linearprogramming using the Excel Solver, a tool that finds the optimalvalue of a target cell by changing values in cells used to calculate thetarget cell and satisfying all constraints demanded. The objective ofthe linear programmingmodel was to minimize the cost of the feedformula, satisfy all nutritional, ingredient incorporation and regu-latory constraints, and reduce the feed formula’s environmentalimpacts. Firstly, we searched for least cost formulas withoutapplying environmental constraints, i.e. “Least cost (LC)-feedformula”. Then we integrated environmental constraints in thelinear programming model for each type of poultry production inorder to identify the potentially achievable minimum levels for EPand CC at the same time. Values of EP and CC of the LC-feed formula
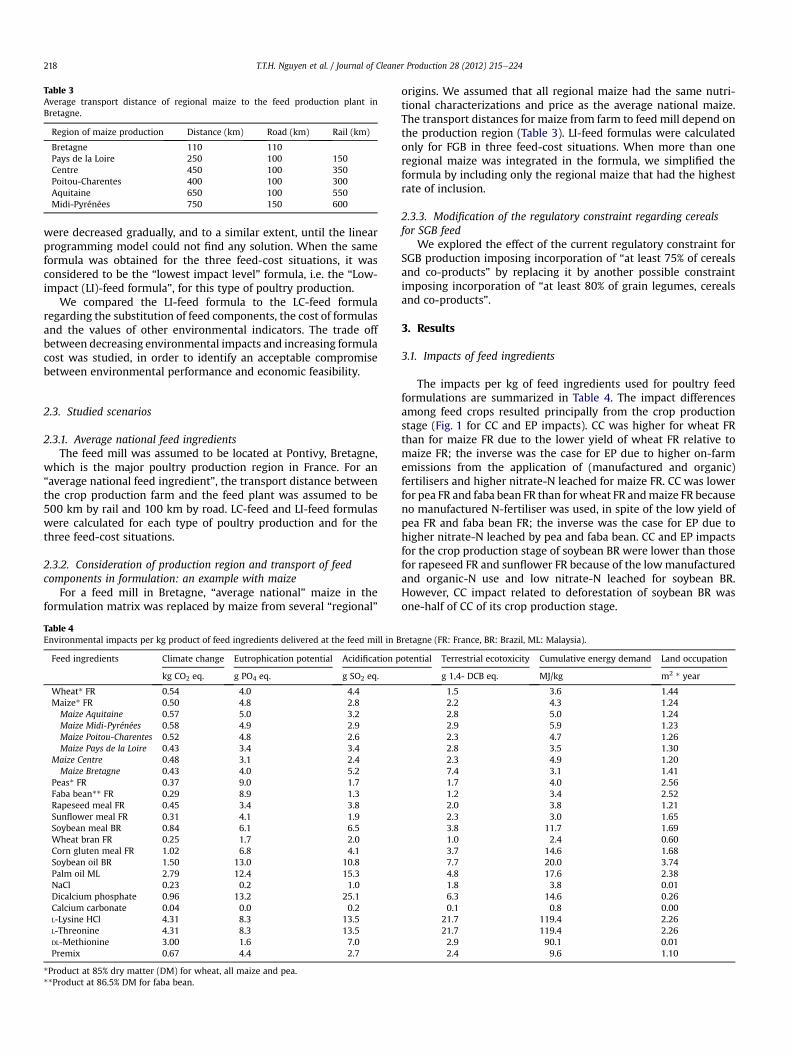
Table 3Average transport distance of regional maize to the feed production plant inBretagne.
Region of maize production Distance (km) Road (km) Rail (km)
Bretagne 110 110Pays de la Loire 250 100 150Centre 450 100 350Poitou-Charentes 400 100 300Aquitaine 650 100 550Midi-Pyrénées 750 150 600
T.T.H. Nguyen et al. / Journal of Cleaner Production 28 (2012) 215e224218
were decreased gradually, and to a similar extent, until the linearprogramming model could not find any solution. When the sameformula was obtained for the three feed-cost situations, it wasconsidered to be the “lowest impact level” formula, i.e. the “Low-impact (LI)-feed formula”, for this type of poultry production.
We compared the LI-feed formula to the LC-feed formularegarding the substitution of feed components, the cost of formulasand the values of other environmental indicators. The trade offbetween decreasing environmental impacts and increasing formulacost was studied, in order to identify an acceptable compromisebetween environmental performance and economic feasibility.
2.3. Studied scenarios
2.3.1. Average national feed ingredientsThe feed mill was assumed to be located at Pontivy, Bretagne,
which is the major poultry production region in France. For an“average national feed ingredient”, the transport distance betweenthe crop production farm and the feed plant was assumed to be500 km by rail and 100 km by road. LC-feed and LI-feed formulaswere calculated for each type of poultry production and for thethree feed-cost situations.
2.3.2. Consideration of production region and transport of feedcomponents in formulation: an example with maize
For a feed mill in Bretagne, “average national” maize in theformulation matrix was replaced by maize from several “regional”
Table 4Environmental impacts per kg product of feed ingredients delivered at the feed mill in B
Feed ingredients Climate change Eutrophication potential Acidification p
kg CO2 eq. g PO4 eq. g SO2 eq.
Wheat* FR 0.54 4.0 4.4Maize* FR 0.50 4.8 2.8Maize Aquitaine 0.57 5.0 3.2Maize Midi-Pyrénées 0.58 4.9 2.9Maize Poitou-Charentes 0.52 4.8 2.6Maize Pays de la Loire 0.43 3.4 3.4
Maize Centre 0.48 3.1 2.4Maize Bretagne 0.43 4.0 5.2
Peas* FR 0.37 9.0 1.7Faba bean** FR 0.29 8.9 1.3Rapeseed meal FR 0.45 3.4 3.8Sunflower meal FR 0.31 4.1 1.9Soybean meal BR 0.84 6.1 6.5Wheat bran FR 0.25 1.7 2.0Corn gluten meal FR 1.02 6.8 4.1Soybean oil BR 1.50 13.0 10.8Palm oil ML 2.79 12.4 15.3NaCl 0.23 0.2 1.0Dicalcium phosphate 0.96 13.2 25.1Calcium carbonate 0.04 0.0 0.2L-Lysine HCl 4.31 8.3 13.5L-Threonine 4.31 8.3 13.5DL-Methionine 3.00 1.6 7.0Premix 0.67 4.4 2.7
*Product at 85% dry matter (DM) for wheat, all maize and pea.**Product at 86.5% DM for faba bean.
origins. We assumed that all regional maize had the same nutri-tional characterizations and price as the average national maize.The transport distances for maize from farm to feed mill depend onthe production region (Table 3). LI-feed formulas were calculatedonly for FGB in three feed-cost situations. When more than oneregional maize was integrated in the formula, we simplified theformula by including only the regional maize that had the highestrate of inclusion.
2.3.3. Modification of the regulatory constraint regarding cerealsfor SGB feed
We explored the effect of the current regulatory constraint forSGB production imposing incorporation of “at least 75% of cerealsand co-products” by replacing it by another possible constraintimposing incorporation of “at least 80% of grain legumes, cerealsand co-products”.
3. Results
3.1. Impacts of feed ingredients
The impacts per kg of feed ingredients used for poultry feedformulations are summarized in Table 4. The impact differencesamong feed crops resulted principally from the crop productionstage (Fig. 1 for CC and EP impacts). CC was higher for wheat FRthan for maize FR due to the lower yield of wheat FR relative tomaize FR; the inverse was the case for EP due to higher on-farmemissions from the application of (manufactured and organic)fertilisers and higher nitrate-N leached for maize FR. CC was lowerfor pea FR and faba bean FR than for wheat FR andmaize FR becauseno manufactured N-fertiliser was used, in spite of the low yield ofpea FR and faba bean FR; the inverse was the case for EP due tohigher nitrate-N leached by pea and faba bean. CC and EP impactsfor the crop production stage of soybean BR were lower than thosefor rapeseed FR and sunflower FR because of the lowmanufacturedand organic-N use and low nitrate-N leached for soybean BR.However, CC impact related to deforestation of soybean BR wasone-half of CC of its crop production stage.
retagne (FR: France, BR: Brazil, ML: Malaysia).
otential Terrestrial ecotoxicity Cumulative energy demand Land occupation
g 1,4- DCB eq. MJ/kg m2 * year
1.5 3.6 1.442.2 4.3 1.242.8 5.0 1.242.9 5.9 1.232.3 4.7 1.262.8 3.5 1.302.3 4.9 1.207.4 3.1 1.411.7 4.0 2.561.2 3.4 2.522.0 3.8 1.212.3 3.0 1.653.8 11.7 1.691.0 2.4 0.603.7 14.6 1.687.7 20.0 3.744.8 17.6 2.381.8 3.8 0.016.3 14.6 0.260.1 0.8 0.00
21.7 119.4 2.2621.7 119.4 2.262.9 90.1 0.012.4 9.6 1.10
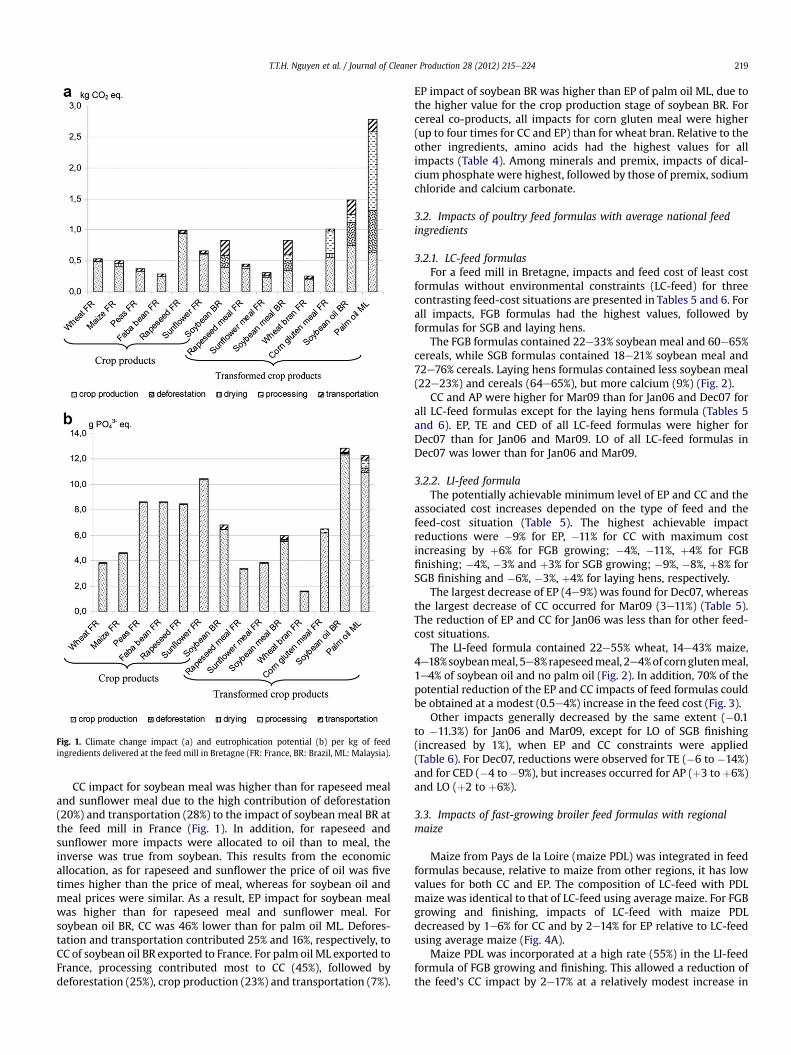
Fig. 1. Climate change impact (a) and eutrophication potential (b) per kg of feedingredients delivered at the feed mill in Bretagne (FR: France, BR: Brazil, ML: Malaysia).
T.T.H. Nguyen et al. / Journal of Cleaner Production 28 (2012) 215e224 219
CC impact for soybean meal was higher than for rapeseed mealand sunflower meal due to the high contribution of deforestation(20%) and transportation (28%) to the impact of soybean meal BR atthe feed mill in France (Fig. 1). In addition, for rapeseed andsunflower more impacts were allocated to oil than to meal, theinverse was true from soybean. This results from the economicallocation, as for rapeseed and sunflower the price of oil was fivetimes higher than the price of meal, whereas for soybean oil andmeal prices were similar. As a result, EP impact for soybean mealwas higher than for rapeseed meal and sunflower meal. Forsoybean oil BR, CC was 46% lower than for palm oil ML. Defores-tation and transportation contributed 25% and 16%, respectively, toCC of soybean oil BR exported to France. For palm oil ML exported toFrance, processing contributed most to CC (45%), followed bydeforestation (25%), crop production (23%) and transportation (7%).
EP impact of soybean BR was higher than EP of palm oil ML, due tothe higher value for the crop production stage of soybean BR. Forcereal co-products, all impacts for corn gluten meal were higher(up to four times for CC and EP) than for wheat bran. Relative to theother ingredients, amino acids had the highest values for allimpacts (Table 4). Among minerals and premix, impacts of dical-cium phosphate were highest, followed by those of premix, sodiumchloride and calcium carbonate.
3.2. Impacts of poultry feed formulas with average national feedingredients
3.2.1. LC-feed formulasFor a feed mill in Bretagne, impacts and feed cost of least cost
formulas without environmental constraints (LC-feed) for threecontrasting feed-cost situations are presented in Tables 5 and 6. Forall impacts, FGB formulas had the highest values, followed byformulas for SGB and laying hens.
The FGB formulas contained 22e33% soybean meal and 60e65%cereals, while SGB formulas contained 18e21% soybean meal and72e76% cereals. Laying hens formulas contained less soybean meal(22e23%) and cereals (64e65%), but more calcium (9%) (Fig. 2).
CC and AP were higher for Mar09 than for Jan06 and Dec07 forall LC-feed formulas except for the laying hens formula (Tables 5and 6). EP, TE and CED of all LC-feed formulas were higher forDec07 than for Jan06 and Mar09. LO of all LC-feed formulas inDec07 was lower than for Jan06 and Mar09.
3.2.2. LI-feed formulaThe potentially achievable minimum level of EP and CC and the
associated cost increases depended on the type of feed and thefeed-cost situation (Table 5). The highest achievable impactreductions were �9% for EP, �11% for CC with maximum costincreasing by þ6% for FGB growing; �4%, �11%, þ4% for FGBfinishing; �4%, �3% and þ3% for SGB growing; �9%, �8%, þ8% forSGB finishing and �6%, �3%, þ4% for laying hens, respectively.
The largest decrease of EP (4e9%) was found for Dec07, whereasthe largest decrease of CC occurred for Mar09 (3e11%) (Table 5).The reduction of EP and CC for Jan06 was less than for other feed-cost situations.
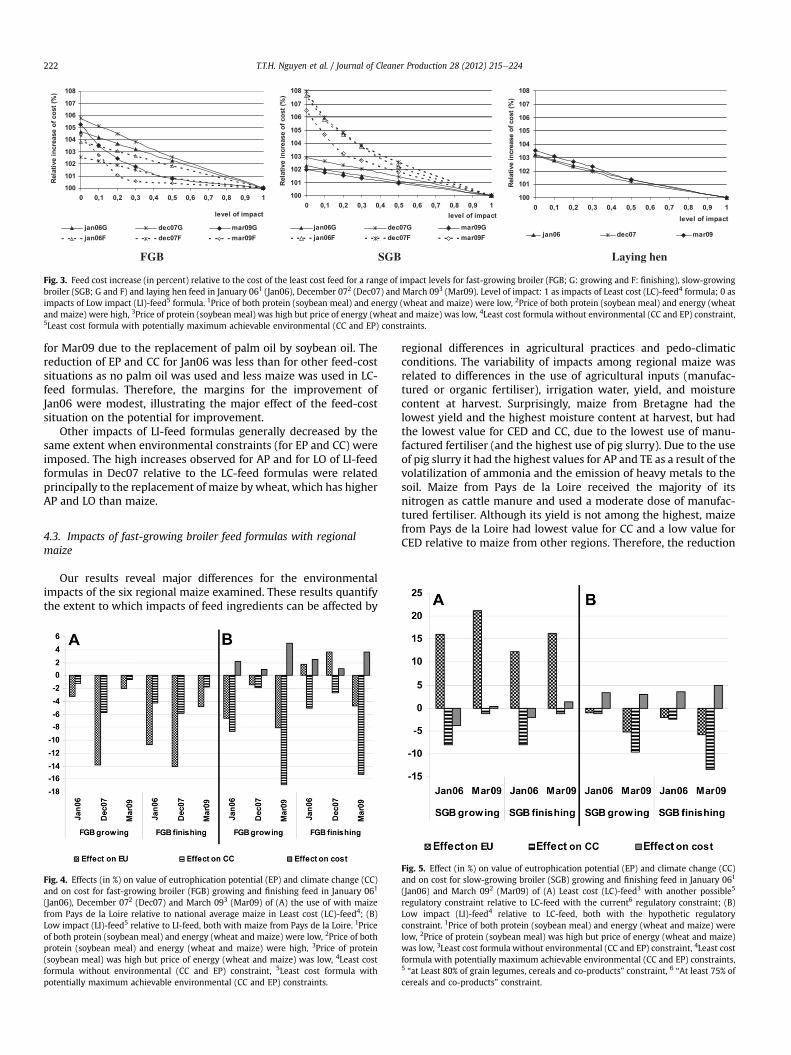
The LI-feed formula contained 22e55% wheat, 14e43% maize,4e18%soybeanmeal, 5e8%rapeseedmeal, 2e4%of cornglutenmeal,1e4% of soybean oil and no palm oil (Fig. 2). In addition, 70% of thepotential reduction of the EP and CC impacts of feed formulas couldbe obtained at a modest (0.5e4%) increase in the feed cost (Fig. 3).
Other impacts generally decreased by the same extent (�0.1to �11.3%) for Jan06 and Mar09, except for LO of SGB finishing(increased by 1%), when EP and CC constraints were applied(Table 6). For Dec07, reductions were observed for TE (�6 to �14%)and for CED (�4 to �9%), but increases occurred for AP (þ3 toþ6%)and LO (þ2 to þ6%).
3.3. Impacts of fast-growing broiler feed formulas with regionalmaize
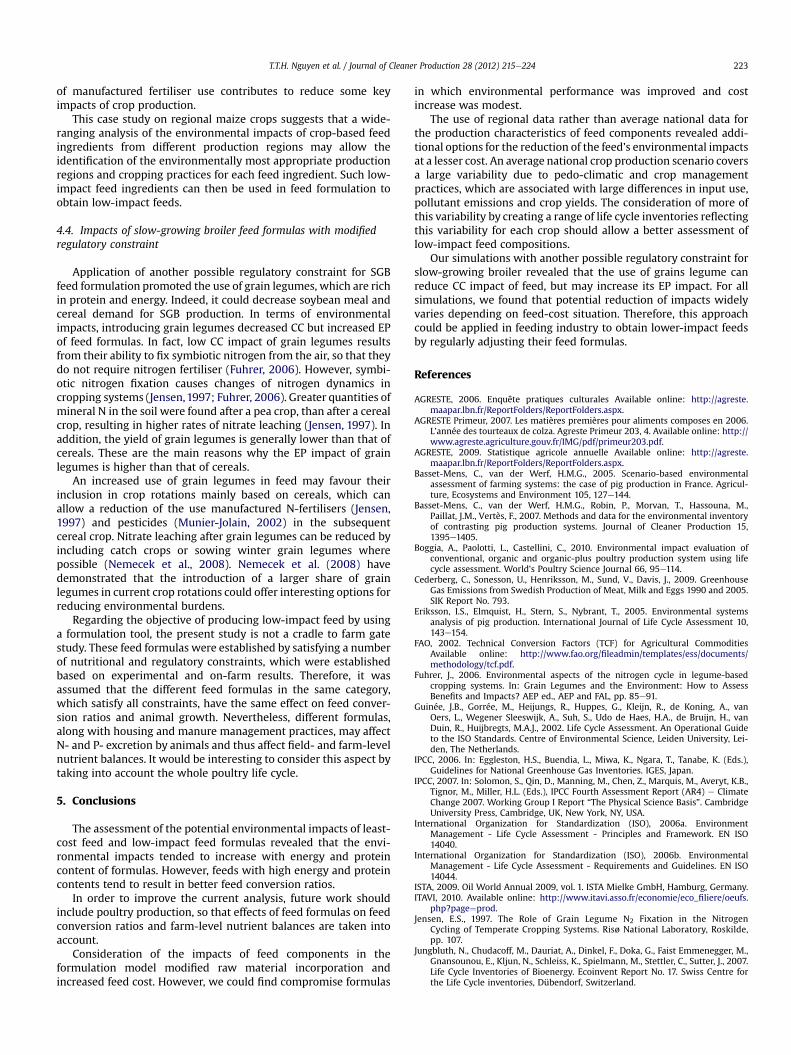
Maize from Pays de la Loire (maize PDL) was integrated in feedformulas because, relative to maize from other regions, it has lowvalues for both CC and EP. The composition of LC-feed with PDLmaize was identical to that of LC-feed using average maize. For FGBgrowing and finishing, impacts of LC-feed with maize PDLdecreased by 1e6% for CC and by 2e14% for EP relative to LC-feedusing average maize (Fig. 4A).
Maize PDL was incorporated at a high rate (55%) in the LI-feedformula of FGB growing and finishing. This allowed a reduction ofthe feed’s CC impact by 2e17% at a relatively modest increase in

Table 5Climate change (CC), eutrophication potential (EP) and cost of Least cost (LC)-feeda and Low impact (LI)-feedb formulas of fast-growing broiler (FGB) growing and finishing,slow-growing broiler (SGB) growing and finishing and laying hens in three feed-cost situations (January 06c, December 07d, march 09e) with national average feed ingredients.
Climate change, kg CO2 eq./kg Eutrophication potential, g PO4 eq./kg Feed costf, V/kg
LC-feed LI-feed LC-feed LI-feed LC-feed LI-feed
Jan06 Dec07 Mar09 Jan06 Dec07 Mar09 Jan06 Dec07 Mar09 Jan06 Dec07 Mar09
FGB growing 0.67 0.66 0.73 0.65 5.2 5.5 5.2 5.0 0.17 0.28 0.21 0.17 0.30 0.22FGB finishing 0.65 0.64 0.71 0.63 5.3 5.4 5.3 5.2 0.16 0.28 0.20 0.17 0.28 0.21SGB growing 0.62 0.61 0.63 0.61 4.8 4.9 4.8 4.7 0.15 0.27 0.19 0.16 0.27 0.19SGB finishing 0.61 0.59 0.64 0.59 4.7 5.0 4.7 4.6 0.15 0.26 0.18 0.16 0.28 0.19Laying hens 0.58 0.57 0.58 0.56 4.5 4.6 4.5 4.3 0.14 0.25 0.17 0.15 0.25 0.18
a Least cost formula without environmental (CC and EP) constraint.b Least cost formula with potentially maximum achievable environmental (CC and EP) constraints.c Price of both protein (soybean meal) and energy (wheat and maize) were low.d Price of both protein (soybean meal) and energy (wheat and maize) were high.e Price of protein (soybean meal) was high but price of energy (wheat and maize) was low.f Feed cost without premix.
T.T.H. Nguyen et al. / Journal of Cleaner Production 28 (2012) 215e224220
cost (1e5%) as compared to the LC-feed formula with maize PDL(Fig. 4B). However, the reduction for EP impact of this comparisonwas not always obtained and largely depends on feed-cost situation(from �8 to þ4%; Fig. 4B).
3.4. Impacts of slow-growing broiler feed formulas with modifiedregulatory constraint
The use of a modified regulatory constraint for the SGB (growingand finishing) feed formulation increased the incorporation ofgrain legumes in the LC-feed formula by 15e22%, decreased the useof soybean meal by 10e15% and of maize by 0e13% (data notshown). These substitutions of feed components reduced CC by1e8% but increased EP by 12e21%, relative to the LC-feed formulawith the current constraint (Fig. 5A). The effect of the LC-feedformula with the new constraint on the feed-cost variedfrom �3.8 to 1.4% compared to the LC-feed formula with currentconstraint (Fig. 5A).
Applying the modified regulatory constraint decreased theimpacts of the LI-feed by 1e6% for EP and by 1e13% for CC, whilethe cost increased by 3e5% relative to the LC-feed (Fig. 5B).
4. Discussion
4.1. Impacts of “LC-feed” formulas
Most research on the environmental impacts of livestockproduction found that feed production was a major contributor theimpacts of the cradle to farm gate livestock production system(Basset-Mens and van der Werf, 2005; Eriksson et al., 2005;
Table 6Acidification potential, terrestrial ecotoxicity, cumulative energy demand and land occubroiler (FGB) growing and finishing, slow-growing broiler (SGB) growing and finishing awith national average feed ingredients.
Acidification potential, g SO2 eq./kg Terrestrial ecotoxicity, g 1,4- DCeq./kg
LC-feed LI-feed LC-feed LI-
Jan 06 Dec 07 Mar 09 Jan 06 Dec 07 Mar 09
FGB growing 5.3 4.7 5.6 5.0 2.6 2.9 2.5 2.5FGB finishing 4.7 4.5 5.1 4.5 2.7 2.8 2.5 2.7SGB growing 4.8 4.5 4.8 4.7 2.3 2.4 2.3 2.3SGB finishing 4.7 4.2 4.8 4.3 2.3 2.5 2.2 2.2Laying hens 4.5 4.2 4.5 4.3 2.2 2.3 2.2 2.1
a Least cost formula without environmental (CC and EP) constraint.b Least cost formula with potentially maximum achievable environmental (CC and EPc Price of both protein (soybean meal) and energy (wheat and maize) were low.d Price of both protein (soybean meal) and energy (wheat and maize) were high.e Price of protein (soybean meal) was high but price of energy (wheat and maize) wa
Pelletier, 2008; Cederberg et al., 2009; Boggia et al., 2010). Ourresults present the potential impacts of poultry feed at the feedmillgate, associated with the production and delivery of feed ingredi-ents to the feed mill. It is difficult to compare our results withprevious studies for all impact categories due to the limited pub-lished data on poultry feed. Concerning CC and CED, our results areslightly higher than literature results of feed at the poultry farm(entrance) gate from Sweden (data for CC only, Cederberg et al.,2009) and US (Pelletier, 2008). The composition of broiler andlaying hen feeds reported in the literature (Cederberg et al., 2009;Pelletier, 2008) was similar to our LC-feed, i.e. mainly based oncereals (wheat, maize, barley) and soybean or soybean meal.Nevertheless, our values for CC and CED impacts at the feed millgate for French maize were one and a half time higher, for Braziliansoybean meal were three times higher than those reported for USmaize and US soybeanmeal, respectively (Pelletier, 2008). This maybe due to differences in input use and crop practices as well as yield,emissions on the field for crop production, processing and trans-portation between studies. In particular, impact differencesbetween US and BR soybean meal were partly due to high contri-bution of deforestation and transportation for soybean meal BR tothe feed mill gate in France.
Metabolizable energy and crude protein requirements per kg offeed were highest for FGB, followed by SGB and laying hens(Table 2). Therefore, the laying hen feed formulas had lower cerealsand soybeanmeal content than other feed types and higher calciumcontent to satisfy nutrient requirements for egg creation. Conse-quently, the laying hen feed formulas had the lowest impactscompared to FGB and SGB formulas. The FGB formulas had highersoybean meal contents and lower cereals contents than SGB
pation of Least cost (LC)-feeda and Low impact (LI)-feedb formulas of fast-growingnd laying hens in three feed-cost situations (January 06c, December 07d, march 09e)
B Cumulative energy demand, MJ/kg Land occupation, m2 * year/kg
feed LC-feed LI-feed LC-feed LI-feed
Jan 06 Dec 07 Mar 09 Jan 06 Dec 07 Mar 09
7.3 7.6 7.3 7.0 1.54 1.44 1.51 1.507.1 7.2 6.9 6.9 1.48 1.44 1.52 1.446.3 6.3 6.3 6.1 1.43 1.40 1.43 1.436.0 6.2 6.0 5.7 1.44 1.36 1.42 1.445.8 6.1 5.8 5.5 1.36 1.31 1.36 1.34
) constraints.
s low.
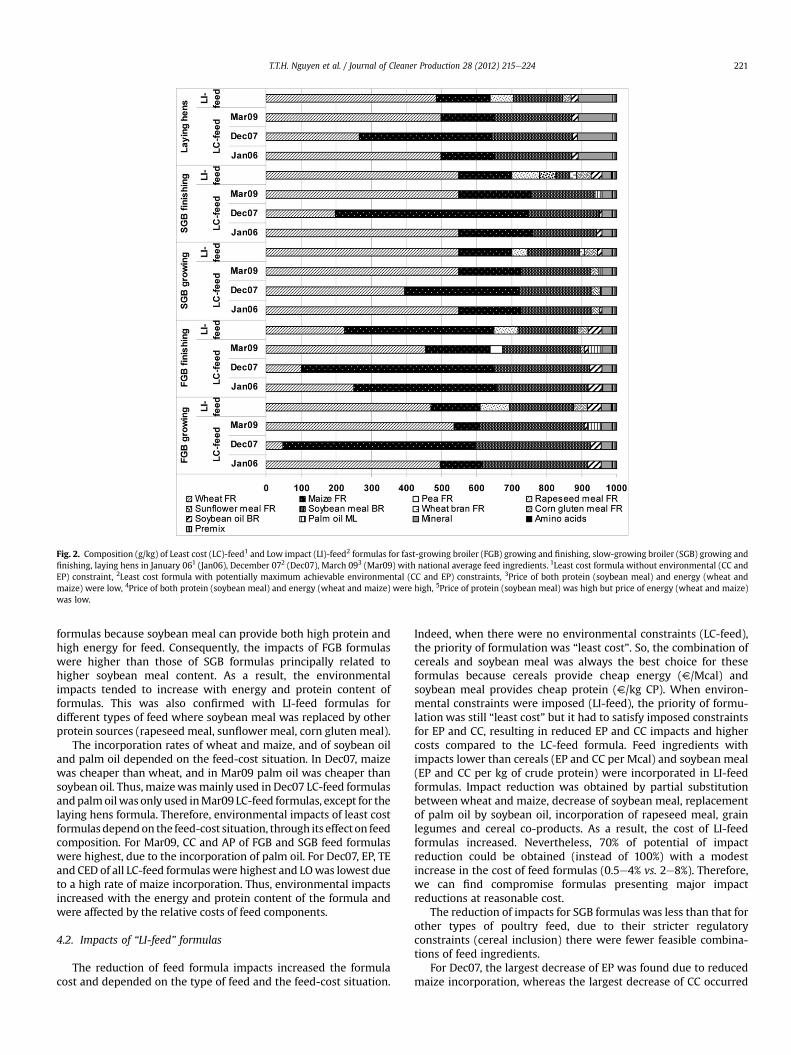
Fig. 2. Composition (g/kg) of Least cost (LC)-feed1 and Low impact (LI)-feed2 formulas for fast-growing broiler (FGB) growing and finishing, slow-growing broiler (SGB) growing andfinishing, laying hens in January 061 (Jan06), December 072 (Dec07), March 093 (Mar09) with national average feed ingredients. 1Least cost formula without environmental (CC andEP) constraint, 2Least cost formula with potentially maximum achievable environmental (CC and EP) constraints, 3Price of both protein (soybean meal) and energy (wheat andmaize) were low, 4Price of both protein (soybean meal) and energy (wheat and maize) were high, 5Price of protein (soybean meal) was high but price of energy (wheat and maize)was low.
T.T.H. Nguyen et al. / Journal of Cleaner Production 28 (2012) 215e224 221
formulas because soybean meal can provide both high protein andhigh energy for feed. Consequently, the impacts of FGB formulaswere higher than those of SGB formulas principally related tohigher soybean meal content. As a result, the environmentalimpacts tended to increase with energy and protein content offormulas. This was also confirmed with LI-feed formulas fordifferent types of feed where soybean meal was replaced by otherprotein sources (rapeseed meal, sunflower meal, corn gluten meal).
The incorporation rates of wheat and maize, and of soybean oiland palm oil depended on the feed-cost situation. In Dec07, maizewas cheaper than wheat, and in Mar09 palm oil was cheaper thansoybean oil. Thus,maizewasmainly used in Dec07 LC-feed formulasandpalmoilwas only used inMar09 LC-feed formulas, except for thelaying hens formula. Therefore, environmental impacts of least costformulas dependon the feed-cost situation, through its effecton feedcomposition. For Mar09, CC and AP of FGB and SGB feed formulaswere highest, due to the incorporation of palm oil. For Dec07, EP, TEand CED of all LC-feed formulas were highest and LOwas lowest dueto a high rate of maize incorporation. Thus, environmental impactsincreased with the energy and protein content of the formula andwere affected by the relative costs of feed components.
4.2. Impacts of “LI-feed” formulas
The reduction of feed formula impacts increased the formulacost and depended on the type of feed and the feed-cost situation.
Indeed, when there were no environmental constraints (LC-feed),the priority of formulation was “least cost”. So, the combination ofcereals and soybean meal was always the best choice for theseformulas because cereals provide cheap energy (V/Mcal) andsoybean meal provides cheap protein (V/kg CP). When environ-mental constraints were imposed (LI-feed), the priority of formu-lation was still “least cost” but it had to satisfy imposed constraintsfor EP and CC, resulting in reduced EP and CC impacts and highercosts compared to the LC-feed formula. Feed ingredients withimpacts lower than cereals (EP and CC per Mcal) and soybean meal(EP and CC per kg of crude protein) were incorporated in LI-feedformulas. Impact reduction was obtained by partial substitutionbetween wheat and maize, decrease of soybean meal, replacementof palm oil by soybean oil, incorporation of rapeseed meal, grainlegumes and cereal co-products. As a result, the cost of LI-feedformulas increased. Nevertheless, 70% of potential of impactreduction could be obtained (instead of 100%) with a modestincrease in the cost of feed formulas (0.5e4% vs. 2e8%). Therefore,we can find compromise formulas presenting major impactreductions at reasonable cost.
The reduction of impacts for SGB formulas was less than that forother types of poultry feed, due to their stricter regulatoryconstraints (cereal inclusion) there were fewer feasible combina-tions of feed ingredients.
For Dec07, the largest decrease of EP was found due to reducedmaize incorporation, whereas the largest decrease of CC occurred
100
101
102
103
104
105
106
107
108
0 0,1 0,2 0,3 0,4 0,5 0,6 0,7 0,8 0,9 1
level of impact
Relative in
crease o
f co
st (%
)
jan06G dec07G mar09G
jan06F dec07F mar09F
100
101
102
103
104
105
106
107
108
0 0,1 0,2 0,3 0,4 0,5 0,6 0,7 0,8 0,9 1
level of impact
Relative in
crease o
f co
st (%
)
jan06G dec07G mar09G
jan06F dec07F mar09F
100
101
102
103
104
105
106
107
108
0 0,1 0,2 0,3 0,4 0,5 0,6 0,7 0,8 0,9 1
level of impact
Relative in
crease o
f co
st (%
)
jan06 dec07 mar09
nehgniyaLBGSBGF
Fig. 3. Feed cost increase (in percent) relative to the cost of the least cost feed for a range of impact levels for fast-growing broiler (FGB; G: growing and F: finishing), slow-growingbroiler (SGB; G and F) and laying hen feed in January 061 (Jan06), December 072 (Dec07) and March 093 (Mar09). Level of impact: 1 as impacts of Least cost (LC)-feed4 formula; 0 asimpacts of Low impact (LI)-feed5 formula. 1Price of both protein (soybean meal) and energy (wheat and maize) were low, 2Price of both protein (soybean meal) and energy (wheatand maize) were high, 3Price of protein (soybean meal) was high but price of energy (wheat and maize) was low, 4Least cost formula without environmental (CC and EP) constraint,5Least cost formula with potentially maximum achievable environmental (CC and EP) constraints.
T.T.H. Nguyen et al. / Journal of Cleaner Production 28 (2012) 215e224222
for Mar09 due to the replacement of palm oil by soybean oil. Thereduction of EP and CC for Jan06 was less than for other feed-costsituations as no palm oil was used and less maize was used in LC-feed formulas. Therefore, the margins for the improvement ofJan06 were modest, illustrating the major effect of the feed-costsituation on the potential for improvement.
Other impacts of LI-feed formulas generally decreased by thesame extent when environmental constraints (for EP and CC) wereimposed. The high increases observed for AP and for LO of LI-feedformulas in Dec07 relative to the LC-feed formulas were relatedprincipally to the replacement of maize by wheat, which has higherAP and LO than maize.
4.3. Impacts of fast-growing broiler feed formulas with regionalmaize
Our results reveal major differences for the environmentalimpacts of the six regional maize examined. These results quantifythe extent to which impacts of feed ingredients can be affected by
Fig. 4. Effects (in %) on value of eutrophication potential (EP) and climate change (CC)and on cost for fast-growing broiler (FGB) growing and finishing feed in January 061
(Jan06), December 072 (Dec07) and March 093 (Mar09) of (A) the use of with maizefrom Pays de la Loire relative to national average maize in Least cost (LC)-feed4; (B)Low impact (LI)-feed5 relative to LI-feed, both with maize from Pays de la Loire. 1Priceof both protein (soybean meal) and energy (wheat and maize) were low, 2Price of bothprotein (soybean meal) and energy (wheat and maize) were high, 3Price of protein(soybean meal) was high but price of energy (wheat and maize) was low, 4Least costformula without environmental (CC and EP) constraint, 5Least cost formula withpotentially maximum achievable environmental (CC and EP) constraints.
regional differences in agricultural practices and pedo-climaticconditions. The variability of impacts among regional maize wasrelated to differences in the use of agricultural inputs (manufac-tured or organic fertiliser), irrigation water, yield, and moisturecontent at harvest. Surprisingly, maize from Bretagne had thelowest yield and the highest moisture content at harvest, but hadthe lowest value for CED and CC, due to the lowest use of manu-factured fertiliser (and the highest use of pig slurry). Due to the useof pig slurry it had the highest values for AP and TE as a result of thevolatilization of ammonia and the emission of heavy metals to thesoil. Maize from Pays de la Loire received the majority of itsnitrogen as cattle manure and used a moderate dose of manufac-tured fertiliser. Although its yield is not among the highest, maizefrom Pays de la Loire had lowest value for CC and a low value forCED relative to maize from other regions. Therefore, the reduction
Fig. 5. Effect (in %) on value of eutrophication potential (EP) and climate change (CC)and on cost for slow-growing broiler (SGB) growing and finishing feed in January 061
(Jan06) and March 092 (Mar09) of (A) Least cost (LC)-feed3 with another possible5
regulatory constraint relative to LC-feed with the current6 regulatory constraint; (B)Low impact (LI)-feed4 relative to LC-feed, both with the hypothetic regulatoryconstraint. 1Price of both protein (soybean meal) and energy (wheat and maize) werelow, 2Price of protein (soybean meal) was high but price of energy (wheat and maize)was low, 3Least cost formula without environmental (CC and EP) constraint, 4Least costformula with potentially maximum achievable environmental (CC and EP) constraints,5 “at Least 80% of grain legumes, cereals and co-products” constraint, 6 “At least 75% ofcereals and co-products” constraint.
T.T.H. Nguyen et al. / Journal of Cleaner Production 28 (2012) 215e224 223
of manufactured fertiliser use contributes to reduce some keyimpacts of crop production.
This case study on regional maize crops suggests that a wide-ranging analysis of the environmental impacts of crop-based feedingredients from different production regions may allow theidentification of the environmentally most appropriate productionregions and cropping practices for each feed ingredient. Such low-impact feed ingredients can then be used in feed formulation toobtain low-impact feeds.
4.4. Impacts of slow-growing broiler feed formulas with modifiedregulatory constraint
Application of another possible regulatory constraint for SGBfeed formulation promoted the use of grain legumes, which are richin protein and energy. Indeed, it could decrease soybean meal andcereal demand for SGB production. In terms of environmentalimpacts, introducing grain legumes decreased CC but increased EPof feed formulas. In fact, low CC impact of grain legumes resultsfrom their ability to fix symbiotic nitrogen from the air, so that theydo not require nitrogen fertiliser (Fuhrer, 2006). However, symbi-otic nitrogen fixation causes changes of nitrogen dynamics incropping systems (Jensen,1997; Fuhrer, 2006). Greater quantities ofmineral N in the soil were found after a pea crop, than after a cerealcrop, resulting in higher rates of nitrate leaching (Jensen, 1997). Inaddition, the yield of grain legumes is generally lower than that ofcereals. These are the main reasons why the EP impact of grainlegumes is higher than that of cereals.
An increased use of grain legumes in feed may favour theirinclusion in crop rotations mainly based on cereals, which canallow a reduction of the use manufactured N-fertilisers (Jensen,1997) and pesticides (Munier-Jolain, 2002) in the subsequentcereal crop. Nitrate leaching after grain legumes can be reduced byincluding catch crops or sowing winter grain legumes wherepossible (Nemecek et al., 2008). Nemecek et al. (2008) havedemonstrated that the introduction of a larger share of grainlegumes in current crop rotations could offer interesting options forreducing environmental burdens.
Regarding the objective of producing low-impact feed by usinga formulation tool, the present study is not a cradle to farm gatestudy. These feed formulas were established by satisfying a numberof nutritional and regulatory constraints, which were establishedbased on experimental and on-farm results. Therefore, it wasassumed that the different feed formulas in the same category,which satisfy all constraints, have the same effect on feed conver-sion ratios and animal growth. Nevertheless, different formulas,along with housing and manure management practices, may affectN- and P- excretion by animals and thus affect field- and farm-levelnutrient balances. It would be interesting to consider this aspect bytaking into account the whole poultry life cycle.
5. Conclusions
The assessment of the potential environmental impacts of least-cost feed and low-impact feed formulas revealed that the envi-ronmental impacts tended to increase with energy and proteincontent of formulas. However, feeds with high energy and proteincontents tend to result in better feed conversion ratios.
In order to improve the current analysis, future work shouldinclude poultry production, so that effects of feed formulas on feedconversion ratios and farm-level nutrient balances are taken intoaccount.
Consideration of the impacts of feed components in theformulation model modified raw material incorporation andincreased feed cost. However, we could find compromise formulas
in which environmental performance was improved and costincrease was modest.
The use of regional data rather than average national data forthe production characteristics of feed components revealed addi-tional options for the reduction of the feed’s environmental impactsat a lesser cost. An average national crop production scenario coversa large variability due to pedo-climatic and crop managementpractices, which are associated with large differences in input use,pollutant emissions and crop yields. The consideration of more ofthis variability by creating a range of life cycle inventories reflectingthis variability for each crop should allow a better assessment oflow-impact feed compositions.
Our simulations with another possible regulatory constraint forslow-growing broiler revealed that the use of grains legume canreduce CC impact of feed, but may increase its EP impact. For allsimulations, we found that potential reduction of impacts widelyvaries depending on feed-cost situation. Therefore, this approachcould be applied in feeding industry to obtain lower-impact feedsby regularly adjusting their feed formulas.
References
AGRESTE, 2006. Enquête pratiques culturales Available online: http://agreste.maapar.lbn.fr/ReportFolders/ReportFolders.aspx.
AGRESTE Primeur, 2007. Les matières premières pour aliments composes en 2006.L’année des tourteaux de colza. Agreste Primeur 203, 4. Available online: http://www.agreste.agriculture.gouv.fr/IMG/pdf/primeur203.pdf.
AGRESTE, 2009. Statistique agricole annuelle Available online: http://agreste.maapar.lbn.fr/ReportFolders/ReportFolders.aspx.
Basset-Mens, C., van der Werf, H.M.G., 2005. Scenario-based environmentalassessment of farming systems: the case of pig production in France. Agricul-ture, Ecosystems and Environment 105, 127e144.
Basset-Mens, C., van der Werf, H.M.G., Robin, P., Morvan, T., Hassouna, M.,Paillat, J.M., Vertès, F., 2007. Methods and data for the environmental inventoryof contrasting pig production systems. Journal of Cleaner Production 15,1395e1405.
Boggia, A., Paolotti, L., Castellini, C., 2010. Environmental impact evaluation ofconventional, organic and organic-plus poultry production system using lifecycle assessment. World’s Poultry Science Journal 66, 95e114.
Cederberg, C., Sonesson, U., Henriksson, M., Sund, V., Davis, J., 2009. GreenhouseGas Emissions from Swedish Production of Meat, Milk and Eggs 1990 and 2005.SIK Report No. 793.
Eriksson, I.S., Elmquist, H., Stern, S., Nybrant, T., 2005. Environmental systemsanalysis of pig production. International Journal of Life Cycle Assessment 10,143e154.
FAO, 2002. Technical Conversion Factors (TCF) for Agricultural CommoditiesAvailable online: http://www.fao.org/fileadmin/templates/ess/documents/methodology/tcf.pdf.
Fuhrer, J., 2006. Environmental aspects of the nitrogen cycle in legume-basedcropping systems. In: Grain Legumes and the Environment: How to AssessBenefits and Impacts? AEP ed., AEP and FAL, pp. 85e91.
Guinée, J.B., Gorrée, M., Heijungs, R., Huppes, G., Kleijn, R., de Koning, A., vanOers, L., Wegener Sleeswijk, A., Suh, S., Udo de Haes, H.A., de Bruijn, H., vanDuin, R., Huijbregts, M.A.J., 2002. Life Cycle Assessment. An Operational Guideto the ISO Standards. Centre of Environmental Science, Leiden University, Lei-den, The Netherlands.
IPCC, 2006. In: Eggleston, H.S., Buendia, L., Miwa, K., Ngara, T., Tanabe, K. (Eds.),Guidelines for National Greenhouse Gas Inventories. IGES, Japan.
IPCC, 2007. In: Solomon, S., Qin, D., Manning, M., Chen, Z., Marquis, M., Averyt, K.B.,Tignor, M., Miller, H.L. (Eds.), IPCC Fourth Assessment Report (AR4) e ClimateChange 2007. Working Group I Report “The Physical Science Basis”. CambridgeUniversity Press, Cambridge, UK, New York, NY, USA.
International Organization for Standardization (ISO), 2006a. EnvironmentManagement - Life Cycle Assessment - Principles and Framework. EN ISO14040.
International Organization for Standardization (ISO), 2006b. EnvironmentalManagement - Life Cycle Assessment - Requirements and Guidelines. EN ISO14044.
ISTA, 2009. Oil World Annual 2009, vol. 1. ISTA Mielke GmbH, Hamburg, Germany.ITAVI, 2010. Available online: http://www.itavi.asso.fr/economie/eco_filiere/oeufs.
php?page¼prod.Jensen, E.S., 1997. The Role of Grain Legume N2 Fixation in the Nitrogen
Cycling of Temperate Cropping Systems. Risø National Laboratory, Roskilde,pp. 107.
Jungbluth, N., Chudacoff, M., Dauriat, A., Dinkel, F., Doka, G., Faist Emmenegger, M.,Gnansounou, E., Kljun, N., Schleiss, K., Spielmann, M., Stettler, C., Sutter, J., 2007.Life Cycle Inventories of Bioenergy. Ecoinvent Report No. 17. Swiss Centre forthe Life Cycle inventories, Dübendorf, Switzerland.

T.T.H. Nguyen et al. / Journal of Cleaner Production 28 (2012) 215e224224
Munier-Jolain, N., 2002. The long-term impact of grain legumes on the environ-ment: possibilities for reducing herbicides. Grain Legumes 36, 16e17.
Nemecek, T., Heil, A., Huguenin, O., Meier, S., Erzinger, S., Blaser, S., Dux, D.,Zimmermann, A., 2003. Life Cycle Inventories of Agricultural ProductionSystems. Final report ecoinvent 2000 No. 15. FAL Reckenholz, FAT Tänikon,Swiss Centre for Life Cycle Inventories, Dübendorf, Switzerland.
Nemecek, T., Kägi, T., 2007. Life Cycle Inventories of Swiss and European Agricul-tural Production Systems. Final Report Ecoinvent No. 15. Agroscope ReckenholzTaenikon Research Station ART, Swiss Centre for life cycle inventories, Zurichand Dübendorf, Switzerland.
Nemecek, T., von Richthofen, J.S., Dubois, G., Casta, P., Charles, R., Pahl, H., 2008.Environmental impacts of introducing grain legumes into European croprotations. European Journal Agronomy 28, 380e393.
Payraudeau, S., van der Werf, H.M.G., Vertès, F., 2007. Analysis of the uncertaintyassociated with the estimation of nitrogen losses from farming systems. Agri-cultural Systems 94, 416e430.
Pelletier, N., 2008. Environmental performance in the US broiler poultry sector: lifecycle energy use and greenhouse gas, ozone depleting, acidifying and eutro-phying emissions. Agricultural Systems 98, 67e73.
Prudêncio da Silva, V., van der Werf, H.M.G., Spies, A., Soares, S.R., 2010. Variabilityin environmental impacts of Brazilian soybean according to crop productionand transport scenarios. Journal of Environmental Management 91, 1831e1839.
Sauvant, D., Perez, J.M., Tran, G., 2002. Tables de composition et de valeur nutritivedes matières premières destinées aux animaux d’élevage. Institut National de laRecherche Agronomique, Paris.
Schmidt, J.H., 2007. Life assessment of rapeseed oil and palm oil. Ph.D. thesis, Part 3:Life cycle inventory of rapeseed oil and palm oil. Departement of Developmentand Planning, Aalborg University.
Würdinger, E., Roth, U., Wegener, A., Peche, R., 2003. Kunststoffe aus Nachwach-senden Rohstoffen: Vergleichende ökobilanz für Loose-fill-Packmittel ausStärke bzw. In: BifA, IFEU, Flo-Pak (Eds.), Aus Polystyrol: Final Report Pro-jektförderung: Deutsche Bundesstiftung Umwelt.