using discontinuities for stratigraphic correlation ees 450 dec. 12, 2013 dr. marta clepper
TRANSCRIPT

Using discontinuities for stratigraphic correlation
EES 450Dec. 12, 2013
Dr. Marta Clepper
Discontinuity surfaces
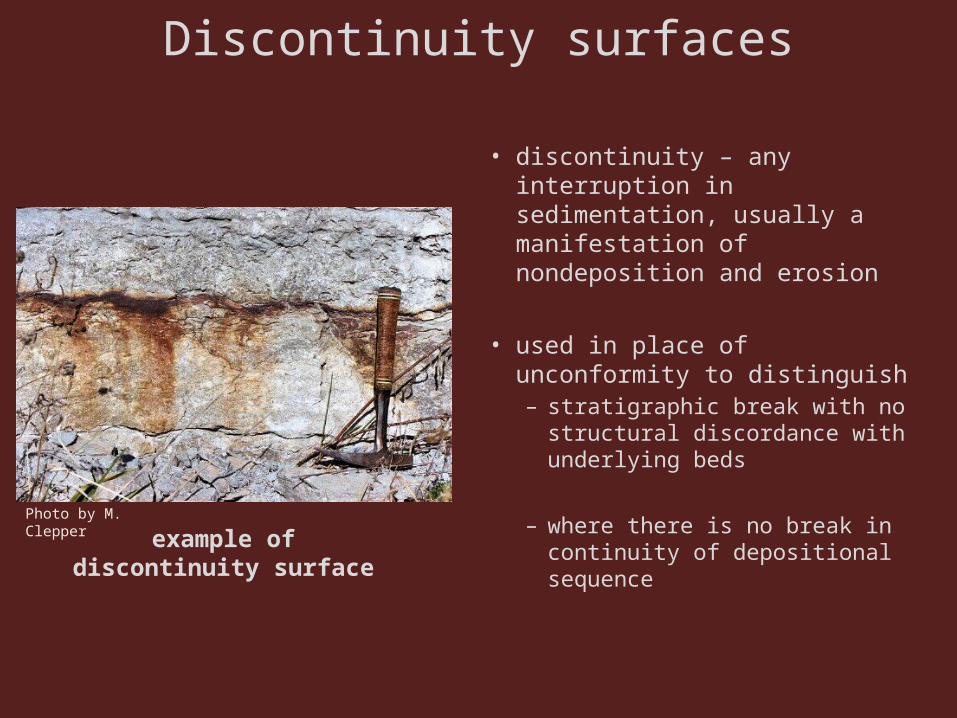
• discontinuity – any interruption in sedimentation, usually a manifestation of nondeposition and erosion
• used in place of unconformity to distinguish – stratigraphic break with no
structural discordance with underlying beds
– where there is no break in continuity of depositional sequence
example of discontinuity surfacePhoto by M. Clepper
example of discontinuity surface
Discontinuity surfaces
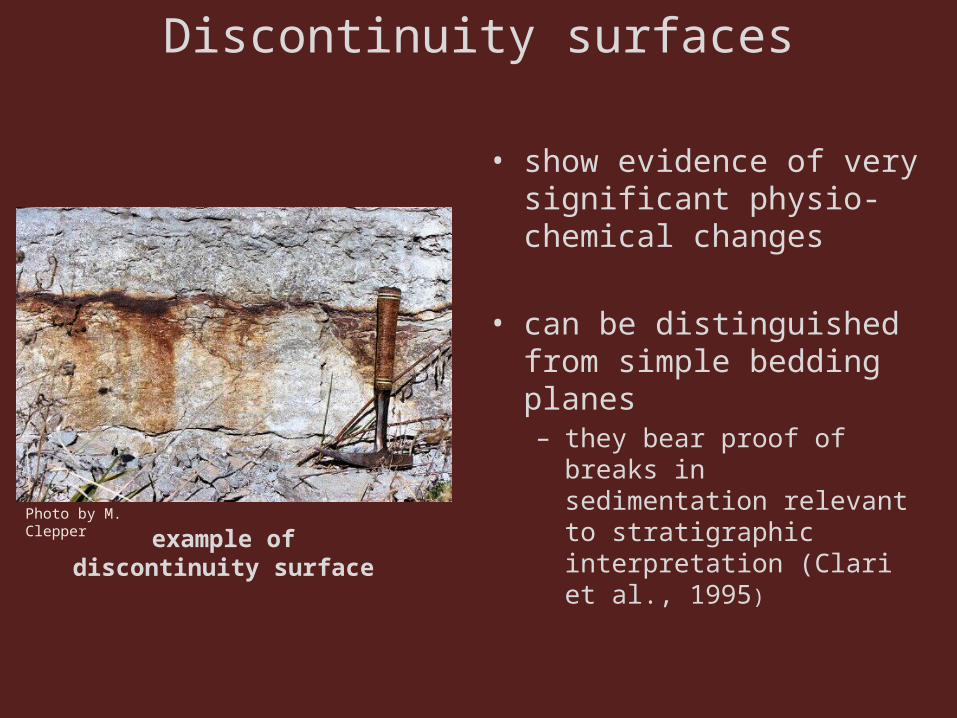
• show evidence of very significant physio-chemical changes
• can be distinguished from simple bedding planes – they bear proof of breaks in
sedimentation relevant to stratigraphic interpretation (Clari et al., 1995)Photo by M. Clepper
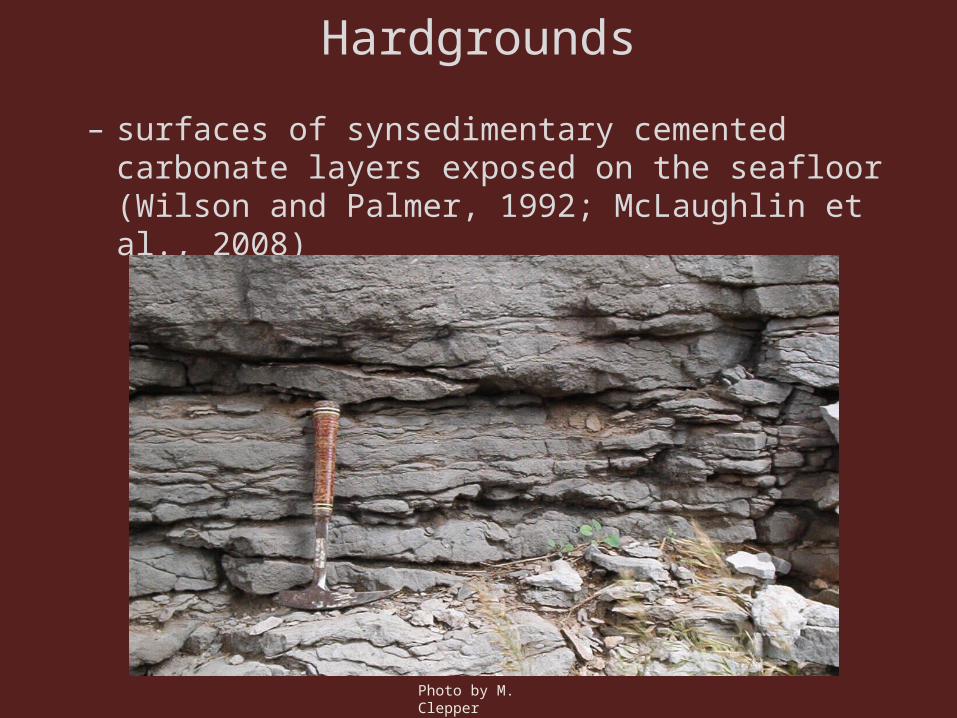
Hardgrounds
– surfaces of synsedimentary cemented carbonate layers exposed on the seafloor (Wilson and Palmer, 1992; McLaughlin et al., 2008)
Photo by M. Clepper
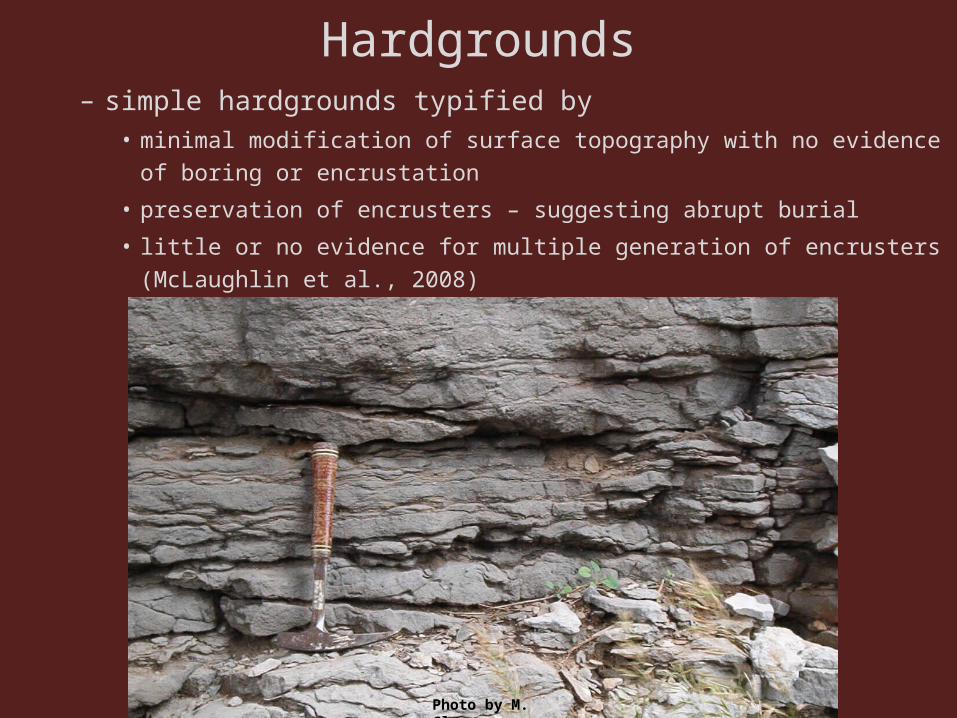
Hardgrounds– simple hardgrounds typified by
• minimal modification of surface topography with no evidence of boring or encrustation
• preservation of encrusters – suggesting abrupt burial
• little or no evidence for multiple generation of encrusters (McLaughlin et al., 2008)
Photo by M. Clepper
Hardgrounds
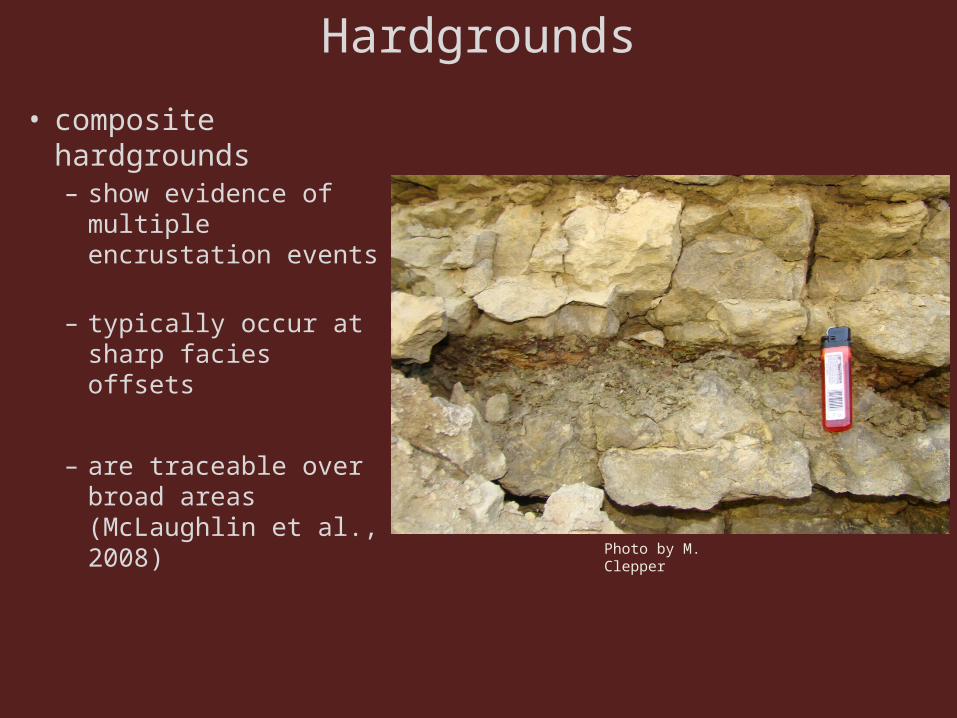
• composite hardgrounds– show evidence of
multiple encrustation events
– typically occur at sharp facies offsets
– are traceable over broad areas (McLaughlin et al., 2008)
Photo by M. Clepper
• Authigenic mineral crusts• rich in iron (limonite), glauconite, and phosphate
• authigenic mineral crusts have a lateral and stratigraphic distribution similar to composite hardgrounds
• associated with condensation
• upwelling brings cold, mineral-rich waters onto buildup– low-pressure, high temperature environment allows
precipitation of minerals– cold waters restrict carbonate deposition
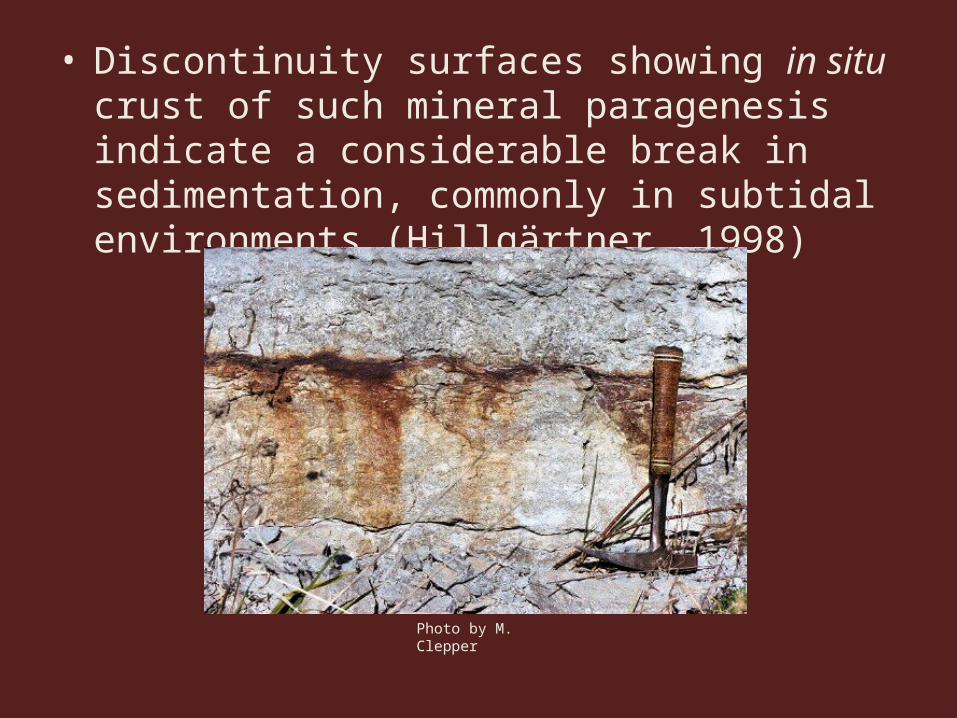
• Discontinuity surfaces showing in situ crust of such mineral paragenesis indicate a considerable break in sedimentation, commonly in subtidal environments (Hillgärtner, 1998)
Photo by M. Clepper

• Any one exposure of the Lexington Limestone may exhibit a few tens to more than a hundred such surfaces, some of which may be mineralized, bored or encrusted.
– Each of these • obviously represents a small break in the normal continuity of deposition, • and most are not correlatable beyond the exposure in which they occur.
Photo by M. Clepper
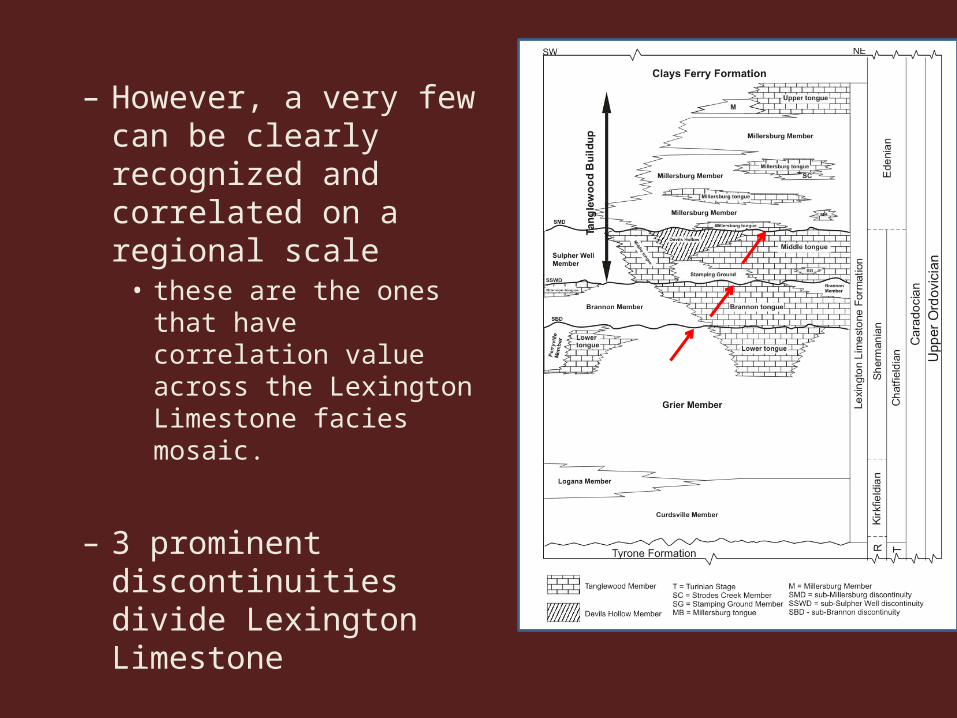
– However, a very few can be clearly recognized and correlated on a regional scale• these are the ones that have
correlation value across the Lexington Limestone facies mosaic.
– 3 prominent discontinuities divide Lexington Limestone
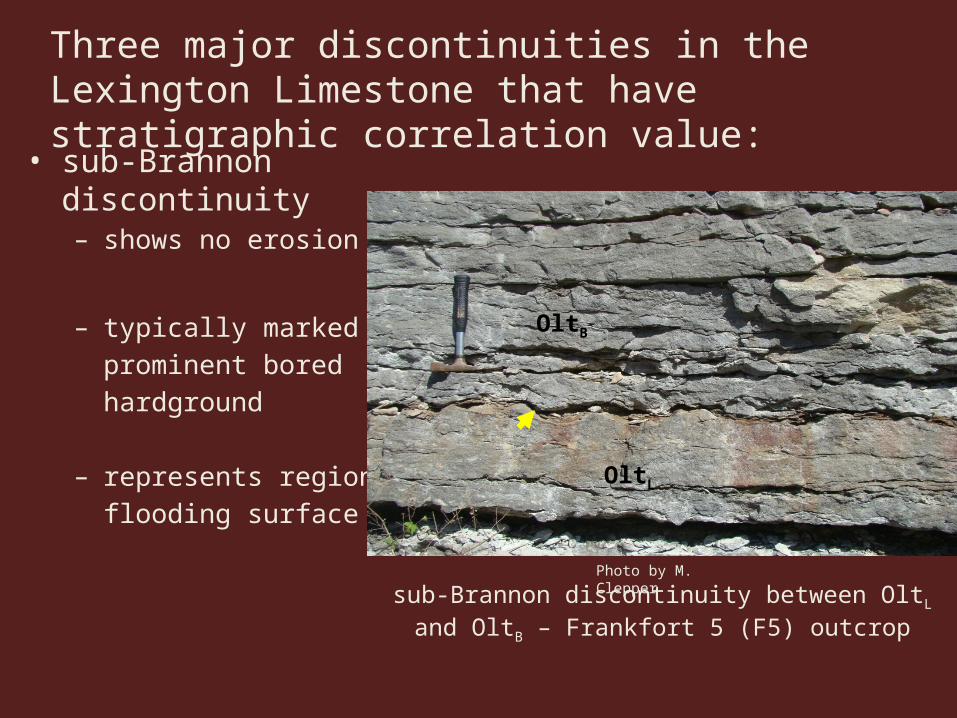
Three major discontinuities in the Lexington Limestone that have stratigraphic correlation value:
• sub-Brannon discontinuity
– shows no erosion
– typically marked byprominent boredhardground
– represents regional flooding surface OltL
OltB
sub-Brannon discontinuity between OltL and OltB – Frankfort 5 (F5) outcrop
Photo by M. Clepper

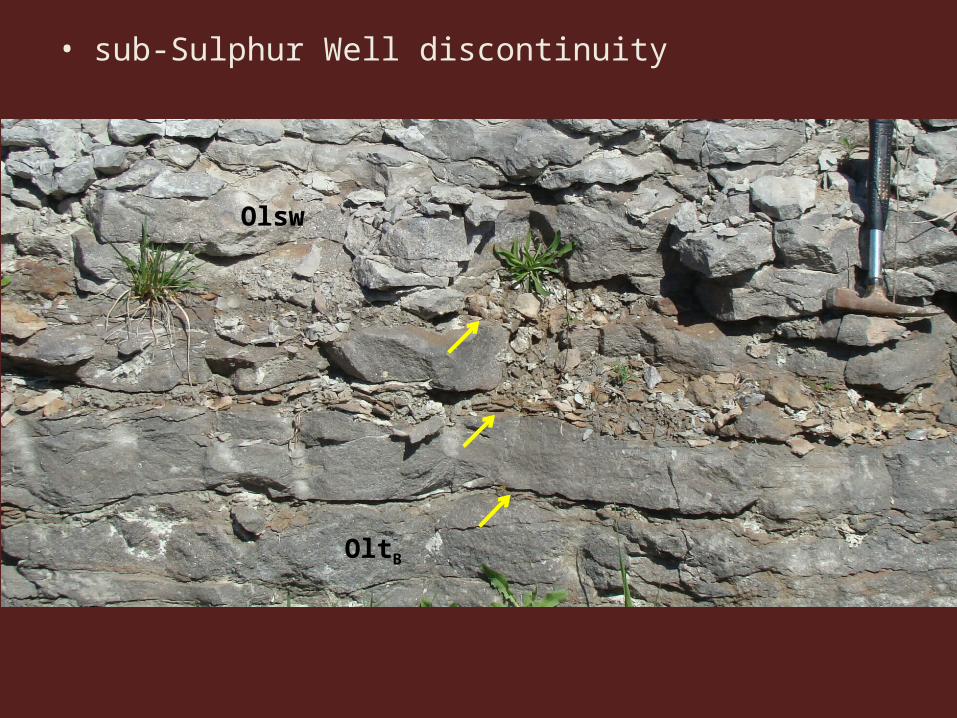
Three major discontinuities in the Lexington Limestone that have stratigraphic correlation value:
• sub-Sulphur Well discontinuity– pyritized, phosphatized
corrosion surface
– consists of 2-3 prominent hardgrounds within 2 ft of each other
– can be traced westward into the Sebree Trough (Hohman, 1998)
OltB
Olsw
sub-Sulphur Well discontinuity between OltB and Olsw – Frankfort 5 (F5) outcrop
Photo by M. Clepper
• sub-Sulphur Well discontinuity
OltB
Olsw
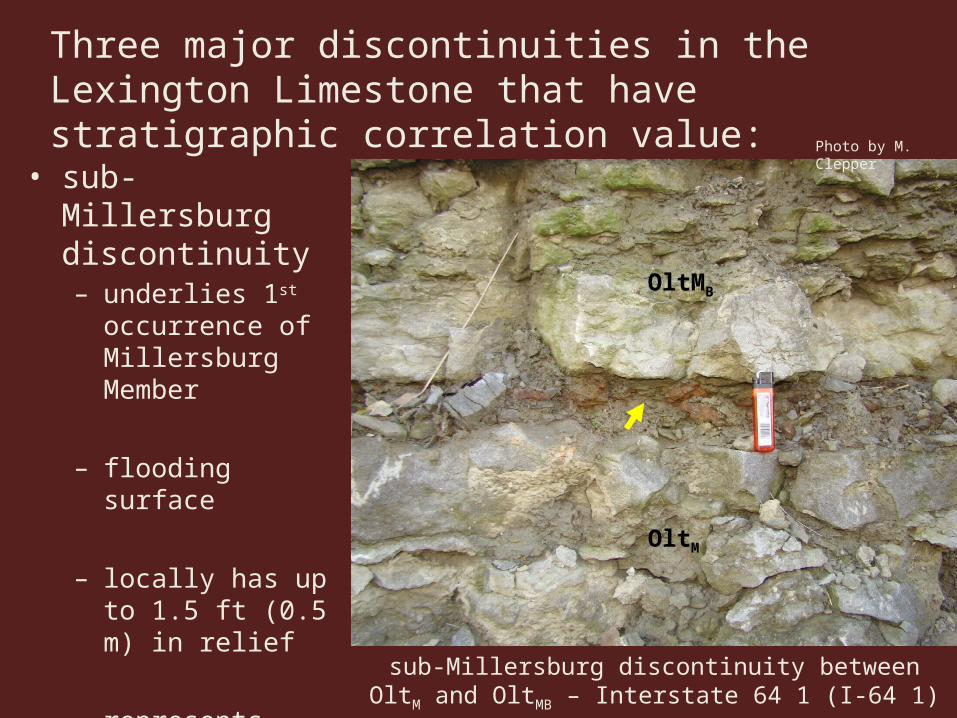
Three major discontinuities in the Lexington Limestone that have stratigraphic correlation value:
• sub- Millersburg discontinuity– underlies 1st
occurrence of Millersburg Member
– flooding surface
– locally has up to 1.5 ft (0.5 m) in relief
– represents time of major transgression
OltM
OltMB
sub-Millersburg discontinuity between OltM and OltMB – Interstate 64 1 (I-64 1) outcrop
Photo by M. Clepper
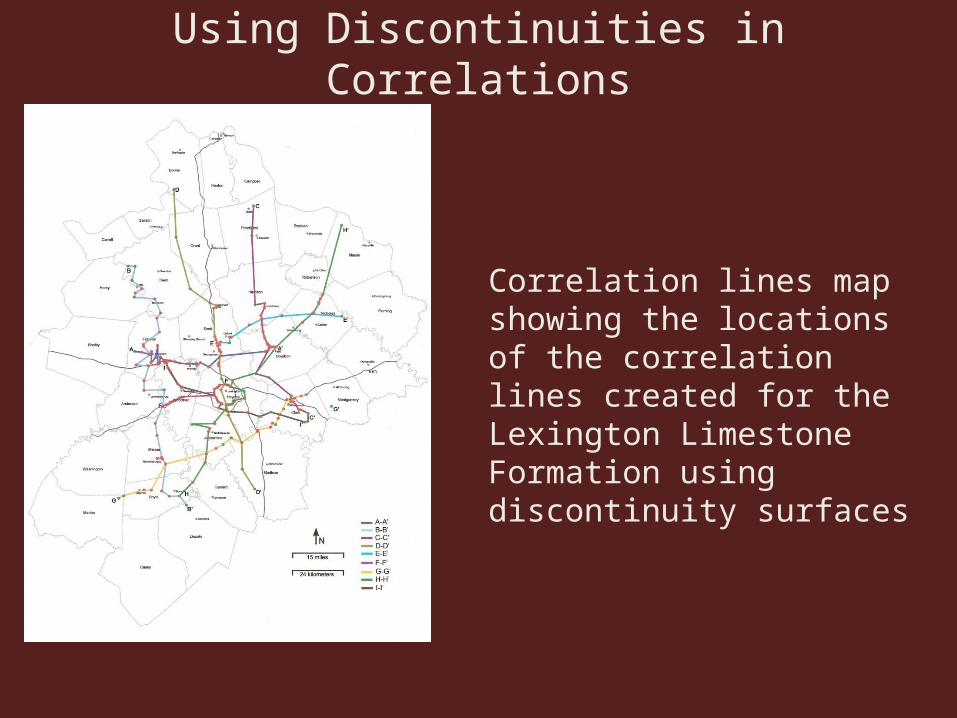
Using Discontinuities in Correlations
Correlation lines map showing the locations of the correlation lines created for the Lexington Limestone Formation using discontinuity surfaces
Using Discontinuities in Correlations
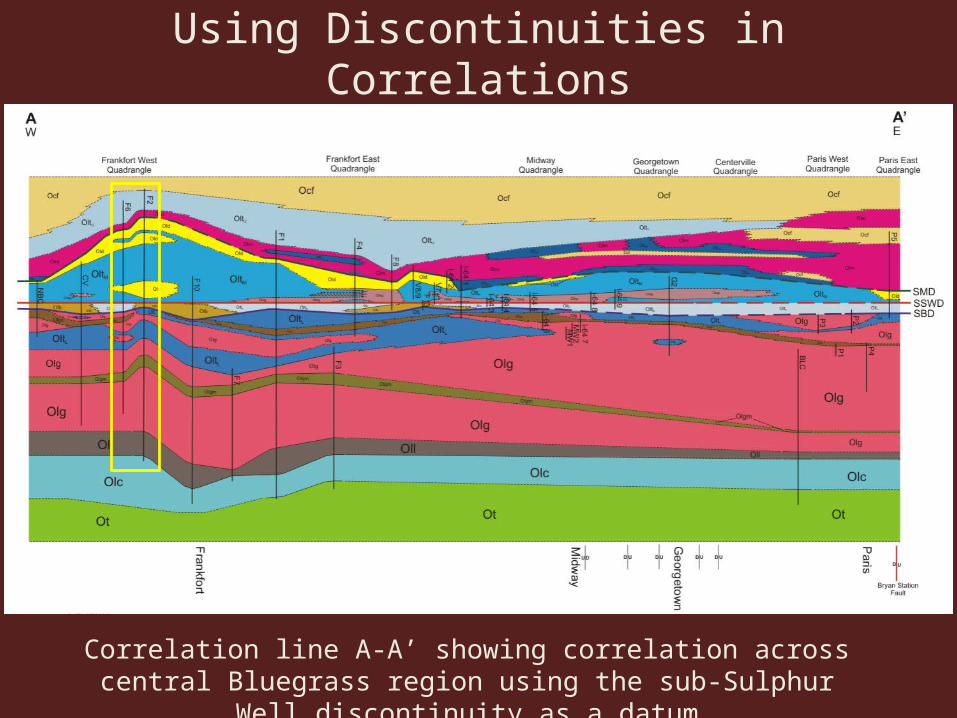
Correlation line A-A’ showing correlation across central Bluegrass region using the sub-Sulphur Well discontinuity as a datum
Using Discontinuities in Correlations
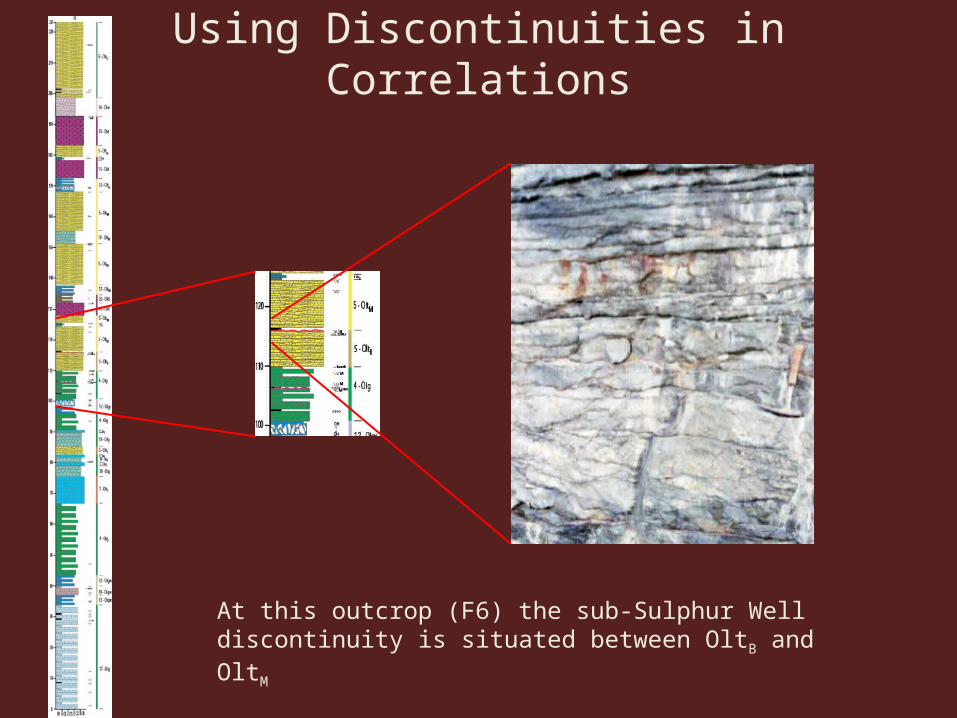
At this outcrop (F6) the sub-Sulphur Well discontinuity is situated between OltB and OltM
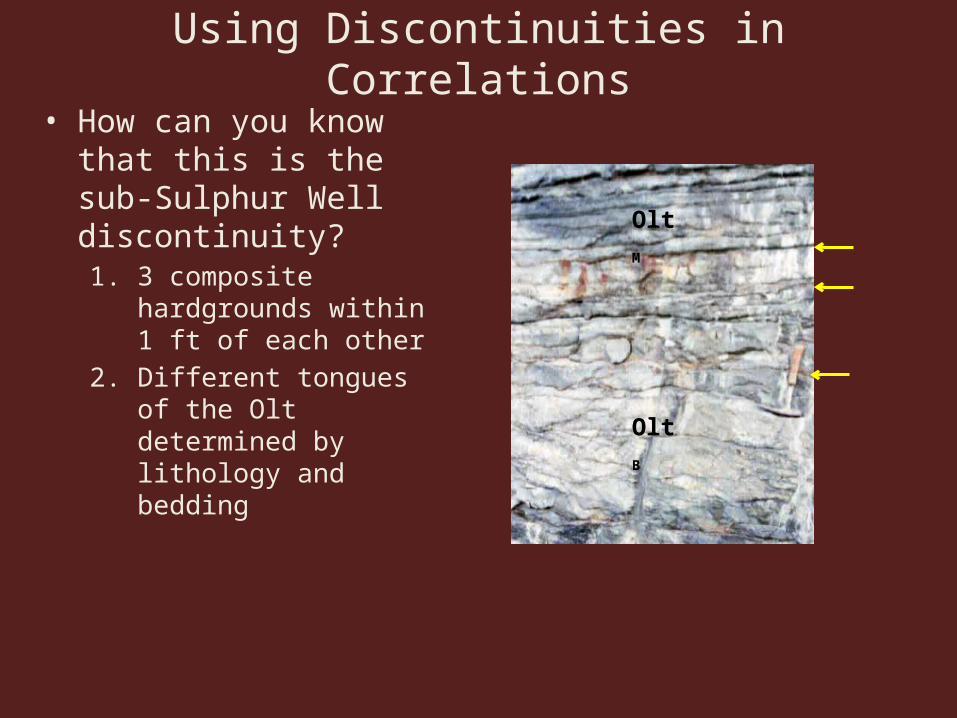
Using Discontinuities in Correlations• How can you know that this
is the sub-Sulphur Well discontinuity?1. 3 composite hardgrounds
within 1 ft of each other2. Different tongues of the Olt
determined by lithology and bedding
OltM
OltB
Using Discontinuities in Correlations
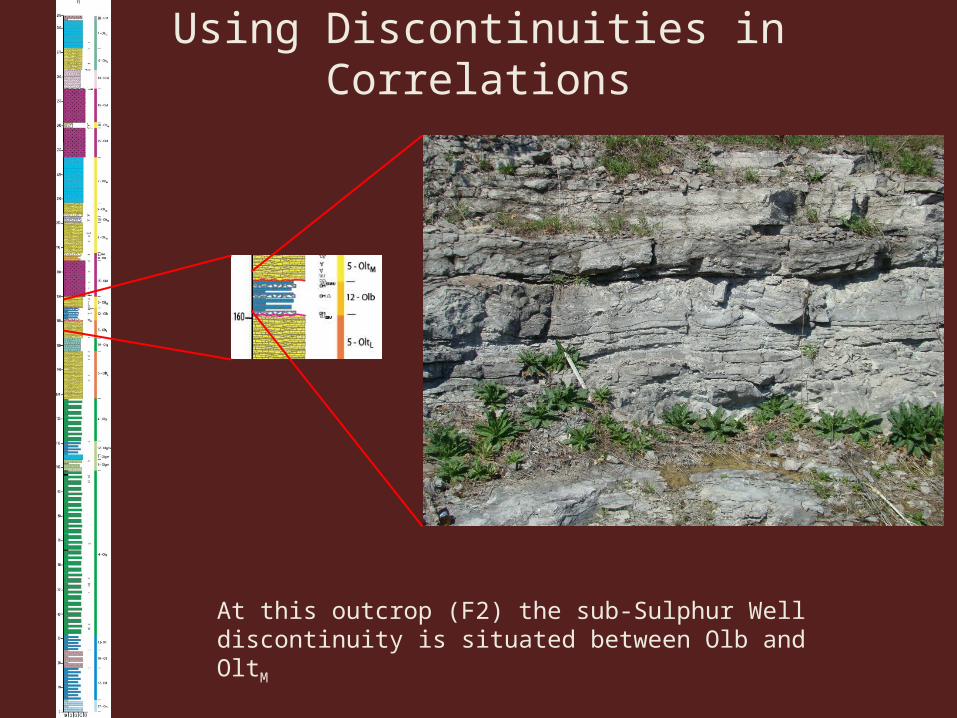
At this outcrop (F2) the sub-Sulphur Well discontinuity is situated between Olb and OltM

Using Discontinuities in Correlations
Correlation line A-A’ showing correlation across central Bluegrass region using the sub-Sulphur Well discontinuity as a datum

F2F6
CV
Conclusions• With careful analysis, discontinuity surfaces can be identified
within a stratigraphic section and if they can be traced over large areas, they can prove to be a useful tool in correlation of stratigraphic units.
• In the case of the Lexington Limestone, features that helped to identify these surfaces were– approximate stratigraphic position– the nature of the surface(s) – extent of erosion
• While discontinuity surfaces alone are not enough to fully interpret complex units like the Lexington Limestone, using them in concert with other data, such as facies identification and isotope analysis can be very beneficial.