using archived data to generate transit performance measures
DESCRIPTION
Using Archived Data to Generate Transit Performance Measures. 82nd Annual Meeting Transportation Research Board January 13, 2003. Robert L. Bertini Department of Civil & Environmental Engineering Ahmed El-Geneidy School of Urban Studies and Planning Portland State University. - PowerPoint PPT PresentationTRANSCRIPT

82nd Annual MeetingTransportation Research BoardJanuary 13, 2003
Robert L. BertiniDepartment of Civil & Environmental Engineering
Ahmed El-GeneidySchool of Urban Studies and Planning
Portland State University
Using Archived Data to Generate
Transit Performance Measures
Using Archived Data to Generate
Transit Performance Measures
2
Let Knowledge Serve the City
Problem StatementProblem StatementProblem StatementProblem Statement
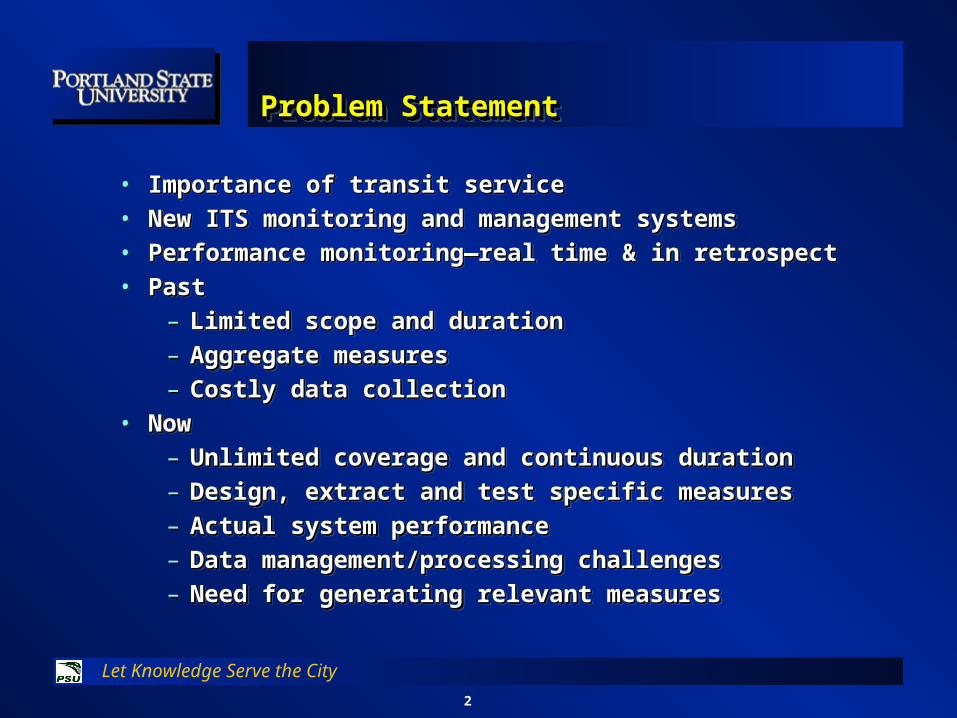
• Importance of transit serviceImportance of transit service• New ITS monitoring and management systemsNew ITS monitoring and management systems• Performance monitoring—real time & in retrospectPerformance monitoring—real time & in retrospect• PastPast
– Limited scope and durationLimited scope and duration– Aggregate measuresAggregate measures– Costly data collectionCostly data collection
• NowNow– Unlimited coverage and continuous durationUnlimited coverage and continuous duration– Design, extract and test specific measuresDesign, extract and test specific measures– Actual system performanceActual system performance– Data management/processing challengesData management/processing challenges– Need for generating relevant measuresNeed for generating relevant measures
3
Let Knowledge Serve the City
ObjectivesObjectivesObjectivesObjectives
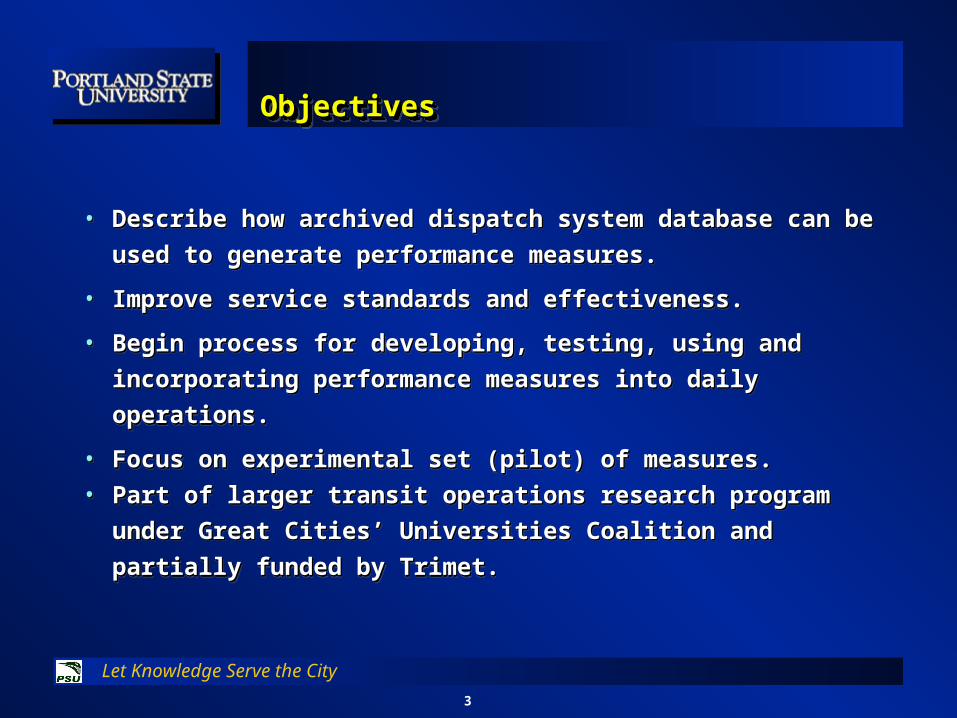
• Describe how archived dispatch system database can be Describe how archived dispatch system database can be
used to generate performance measures.used to generate performance measures.
• Improve service standards and effectiveness.Improve service standards and effectiveness.
• Begin process for developing, testing, using and Begin process for developing, testing, using and
incorporating performance measures into daily incorporating performance measures into daily
operations.operations.
• Focus on experimental set (pilot) of measures.Focus on experimental set (pilot) of measures.• Part of larger transit operations research program under Part of larger transit operations research program under
Great Cities’ Universities Coalition and partially funded Great Cities’ Universities Coalition and partially funded
by Trimet.by Trimet.

4
Let Knowledge Serve the City
FrameworkFrameworkFrameworkFramework
Cost E
ffective
ness
Cost E
ffective
nessC
ost
Effi
ciency
Cost
Effi
ciency
Service EffectivenessService Effectiveness
Service InputsService InputsLabor, Capital, FuelLabor, Capital, Fuel
Service ConsumptionService ConsumptionPax, Pax-Miles, RevenuePax, Pax-Miles, Revenue
Service OutputsService OutputsVeh-Hrs, Veh-MilesVeh-Hrs, Veh-Miles
5
Let Knowledge Serve the City
Performance MeasuresPerformance MeasuresPerformance MeasuresPerformance Measures
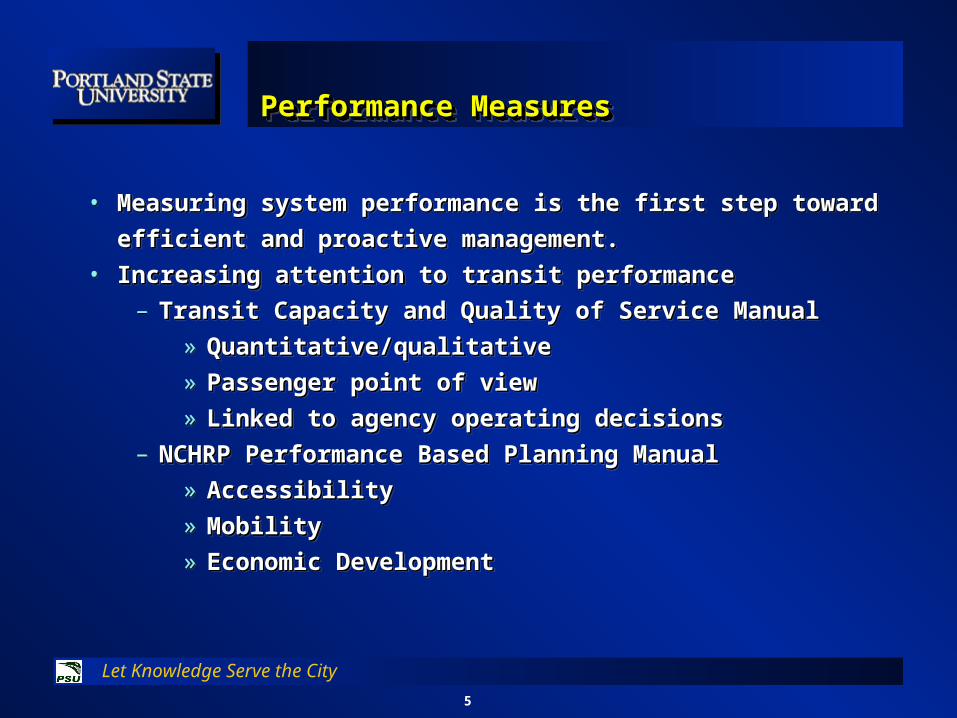
• Measuring system performance is the first step toward Measuring system performance is the first step toward
efficient and proactive management.efficient and proactive management.• Increasing attention to transit performanceIncreasing attention to transit performance
– Transit Capacity and Quality of Service ManualTransit Capacity and Quality of Service Manual» Quantitative/qualitativeQuantitative/qualitative» Passenger point of viewPassenger point of view» Linked to agency operating decisionsLinked to agency operating decisions
– NCHRP Performance Based Planning ManualNCHRP Performance Based Planning Manual» AccessibilityAccessibility» MobilityMobility» Economic DevelopmentEconomic Development

6
Let Knowledge Serve the City
Improve ReliabilityImprove ReliabilityImprove ReliabilityImprove Reliability
• Reduce variability of system performance Reduce variability of system performance
– DelayDelay
– Travel time Travel time
• Attract more ridersAttract more riders
• Reduce operations costsReduce operations costs
• Increase productivityIncrease productivity
• Link to service standardsLink to service standards

7
Let Knowledge Serve the City
8
Let Knowledge Serve the City
DataDataDataData
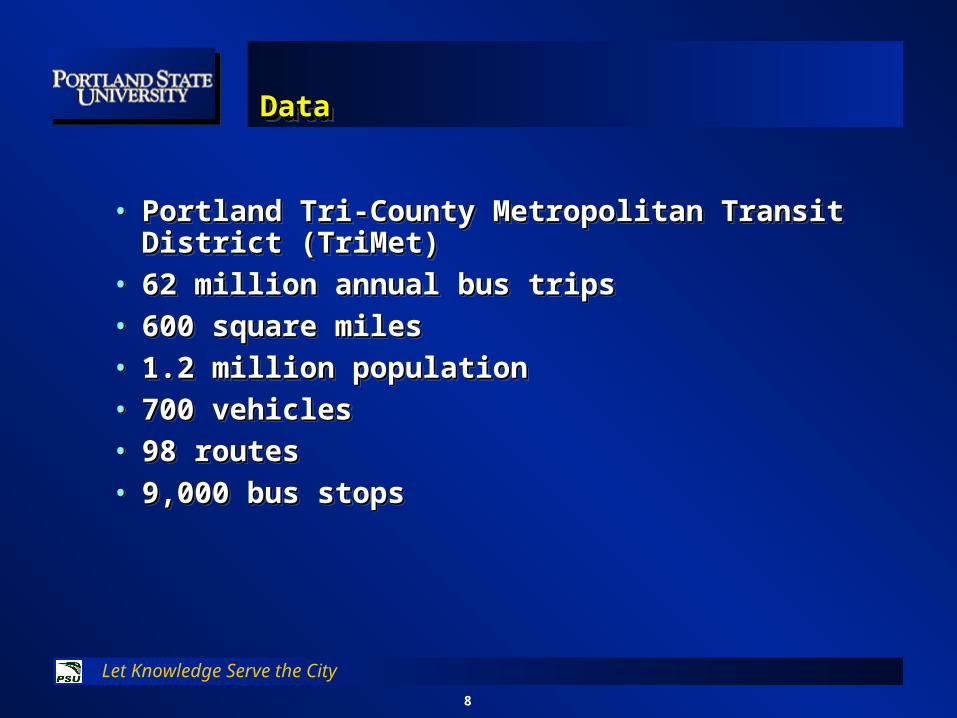
• Portland Tri-County Metropolitan Transit Portland Tri-County Metropolitan Transit District (TriMet)District (TriMet)
• 62 million annual bus trips62 million annual bus trips• 600 square miles600 square miles• 1.2 million population1.2 million population• 700 vehicles700 vehicles• 98 routes98 routes• 9,000 bus stops9,000 bus stops

9
Let Knowledge Serve the City
TriMet Bus Dispatch SystemTriMet Bus Dispatch SystemTriMet Bus Dispatch SystemTriMet Bus Dispatch System
• Bus Dispatch System (BDS) tracks bus location and Bus Dispatch System (BDS) tracks bus location and schedule adherence.schedule adherence.
• Automatic vehicle location (AVL) using global Automatic vehicle location (AVL) using global positioning system (GPS).positioning system (GPS).
• Automatic passenger counters (APCs) on most Automatic passenger counters (APCs) on most vehicles.vehicles.
Smart Bus Concept
10
Let Knowledge Serve the City
TriMet Bus Dispatch SystemTriMet Bus Dispatch SystemTriMet Bus Dispatch SystemTriMet Bus Dispatch System
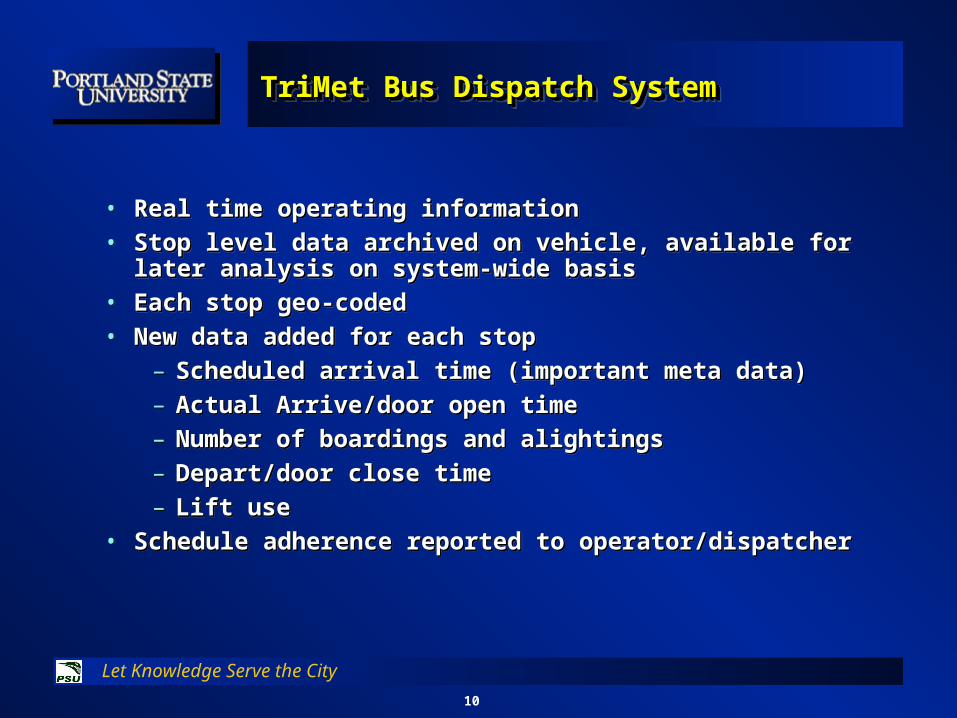
• Real time operating informationReal time operating information• Stop level data archived on vehicle, available for later Stop level data archived on vehicle, available for later
analysis on system-wide basisanalysis on system-wide basis• Each stop geo-codedEach stop geo-coded• New data added for each stopNew data added for each stop
– Scheduled arrival time (important meta data)Scheduled arrival time (important meta data)– Actual Arrive/door open timeActual Arrive/door open time– Number of boardings and alightingsNumber of boardings and alightings– Depart/door close timeDepart/door close time– Lift useLift use
• Schedule adherence reported to operator/dispatcherSchedule adherence reported to operator/dispatcher

11
Let Knowledge Serve the City

12
Let Knowledge Serve the City
Transit Performance Measures (TPMs)Transit Performance Measures (TPMs)Transit Performance Measures (TPMs)Transit Performance Measures (TPMs)
System System
Route Route
SegmentSegment
PointPoint
System System
Route Route
SegmentSegment
PointPoint

13
Let Knowledge Serve the City
System Level TPMsSystem Level TPMsSystem Level TPMsSystem Level TPMs
• System level TPMs can include all data System level TPMs can include all data procesed for external reporting:procesed for external reporting:– RidershipRidership– BoardingsBoardings– RevenueRevenue– Expenditures of the overall system. Expenditures of the overall system.
• Route level measures can be aggregated Route level measures can be aggregated over the entire transit network. over the entire transit network.

14
Let Knowledge Serve the City
Route Level TPMsRoute Level TPMsRoute Level TPMsRoute Level TPMs
• Time distribution between trip time and Time distribution between trip time and layover timelayover time
• Route 12 during one weekday of service Route 12 during one weekday of service (January 24, 2002). (January 24, 2002).
• At the route level, using the archived BDS At the route level, using the archived BDS data, it is possible to create a daily report for data, it is possible to create a daily report for each route. each route.
• Need to control layover time (non-revenue)Need to control layover time (non-revenue)• One day 9% of time at layoversOne day 9% of time at layovers

15
Let Knowledge Serve the City
Route Level Performance MeasuresRoute Level Performance MeasuresRoute Level Performance MeasuresRoute Level Performance Measures
Dwell9%
Stop Circle with Dwells17%
Non-stop Circle with Dwells21%
Stop Circle with no Dwells9%
Non-stop Circle with no Dwells35%
Layovers5%
Stop Circle with Layovers4%
layovers and Stop circles
9%
Dwell Stop Circle with Dwells Non-stop Circle with Dwells Stop Circle with no Dwells
Non-stop Circle with no Dwells Layovers Stop Circle with Layovers

16
Let Knowledge Serve the City
Route Level TPMsRoute Level TPMsRoute Level TPMsRoute Level TPMs
• Daily report for Route 14Daily report for Route 14• Actual/scheduled hours of serviceActual/scheduled hours of service• Actual/scheduled tripsActual/scheduled trips• Actual/scheduled milesActual/scheduled miles• Actual/scheduled layoverActual/scheduled layover• Passengers carriedPassengers carried• Boardings/alightingsBoardings/alightings• Dwell time analysisDwell time analysis• DelayDelay• Average passenger loadAverage passenger load• Passengers per milePassengers per mile• Scheduled/actual speedScheduled/actual speed• Number of operatorsNumber of operators
• Inbound/outboundInbound/outbound• Peak/offpeakPeak/offpeak• Study longitudinally over many days/yearsStudy longitudinally over many days/years
702446Number of operators
11.111.310.9Average speed mile/hour
11.712.011.3Average scheduled speed mile/hour
14.810.38.9Number of passengers per mile
116.780.173.2Average passenger load during the trip
15,8758,3317,544Total boarding and alighting
7,9374,1653,772Number of passengers carried
1,650.3806.8843.6Number of actual miles operated
1,677.2862.4814.8Number of scheduled miles
207104103Number of actual trips
212107105Number of scheduled trips
0131440557101872Scheduled hours of service
2853148401571483777Hours of service
Seconds
Minutes
Hours
Seconds
Minutes
Hours
Seconds
Minutes
Hours
TotalOutboundInbound
17
Let Knowledge Serve the City
Route Level TPMs: Transit AvailabilityRoute Level TPMs: Transit AvailabilityRoute Level TPMs: Transit AvailabilityRoute Level TPMs: Transit Availability
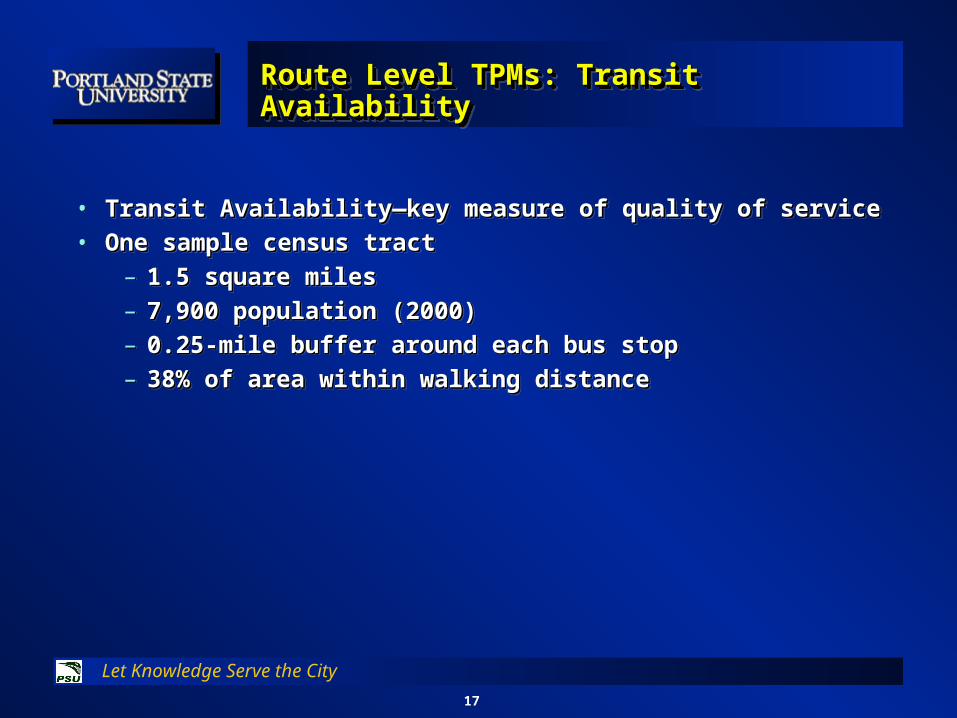
• Transit Availability—key measure of quality of serviceTransit Availability—key measure of quality of service• One sample census tractOne sample census tract
– 1.5 square miles1.5 square miles– 7,900 population (2000)7,900 population (2000)– 0.25-mile buffer around each bus stop0.25-mile buffer around each bus stop– 38% of area within walking distance38% of area within walking distance

18
Let Knowledge Serve the City
Route Level TPMsRoute Level TPMsRoute Level TPMsRoute Level TPMs

19
Let Knowledge Serve the City
Route Level TPMs: SpeedRoute Level TPMs: SpeedRoute Level TPMs: SpeedRoute Level TPMs: Speed
Transit Operating Transit Operating SpeedSpeed
• Important for passenger Important for passenger attractiveness and attractiveness and operating efficiencyoperating efficiency
• Observe how speed Observe how speed varies with time and varies with time and spacespace
• Example using Example using instantaneous instantaneous speed/location for speed/location for express bus on freeway express bus on freeway corridor (highlights corridor (highlights bottleneck)bottleneck)
20
Let Knowledge Serve the City
Route Level TPMs: SpeedRoute Level TPMs: SpeedRoute Level TPMs: SpeedRoute Level TPMs: Speed
0
2
4
6
8
10
12
14
4:48:00 5:24:00 6:00:00 6:36:00 7:12:00 7:48:00 8:24:00 9:00:00 9:36:00 10:12:00
Time
Dis
tan
ce (
Km
)
Speed and Speed and travel timetravel time
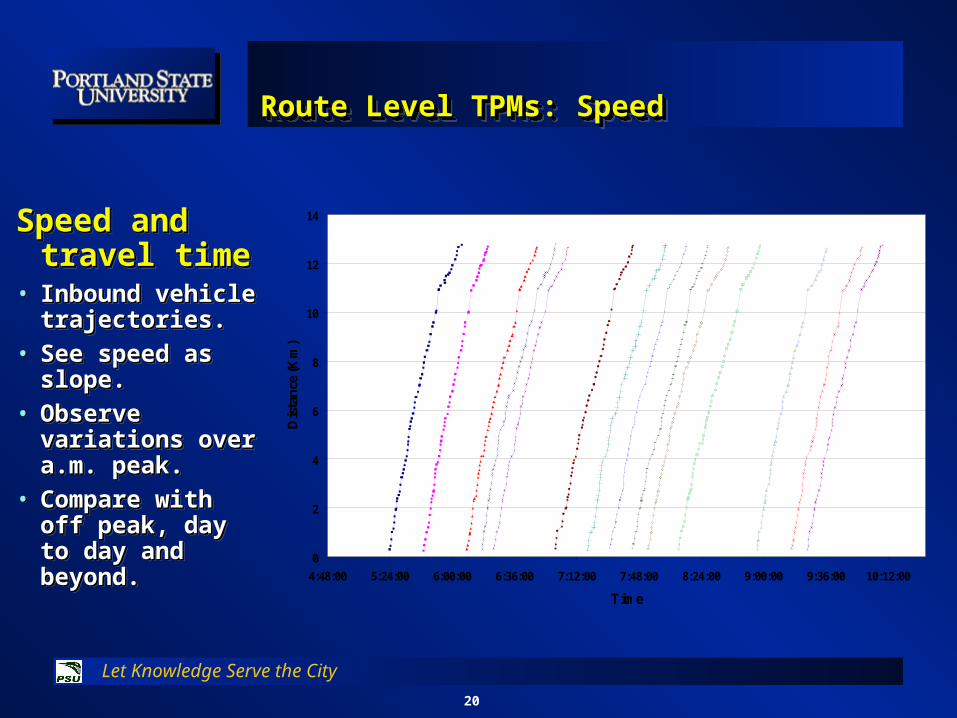
• Inbound vehicle Inbound vehicle trajectories.trajectories.
• See speed as See speed as slope.slope.
• Observe Observe variations over variations over a.m. peak.a.m. peak.
• Compare with Compare with off peak, day to off peak, day to day and beyond.day and beyond.
Speed and Speed and travel timetravel time
• Inbound vehicle Inbound vehicle trajectories.trajectories.
• See speed as See speed as slope.slope.
• Observe Observe variations over variations over a.m. peak.a.m. peak.
• Compare with Compare with off peak, day to off peak, day to day and beyond.day and beyond.

21
Let Knowledge Serve the City
Route Level TPMs: SpeedRoute Level TPMs: SpeedRoute Level TPMs: SpeedRoute Level TPMs: Speed
0
5
10
15
20
25
0 1 2 3 4 5 6 7 8 9 10 11 12 13 14 15 16 17 18 19 20 21 22 23 24
Time
Ave
rage
Sp
eed
Inbound Outbound
Speed and Speed and travel timetravel time
• Inbound and Inbound and outbound outbound averages for averages for Route 14 by Route 14 by service period.service period.
• 17.3 mph 17.3 mph inbound.inbound.
• 15.9 mph 15.9 mph outbound.outbound.
• Compare over Compare over time/system.time/system.
Speed and Speed and travel timetravel time
• Inbound and Inbound and outbound outbound averages for averages for Route 14 by Route 14 by service period.service period.
• 17.3 mph 17.3 mph inbound.inbound.
• 15.9 mph 15.9 mph outbound.outbound.
• Compare over Compare over time/system.time/system.
22
Let Knowledge Serve the City
Route Level TPMs: Schedule AdherenceRoute Level TPMs: Schedule AdherenceRoute Level TPMs: Schedule AdherenceRoute Level TPMs: Schedule Adherence
0
200
400
600
800
1000
1200
1400
1600
1800
2000
-7 -6 -5 -4 -3 -2 -1 0 1 2 3 4 5 6 7 8 9 10 11 12 13 14 15
Minutes
Nu
mb
er o
f O
bse
rvat
ion
s
Inbound Outbound
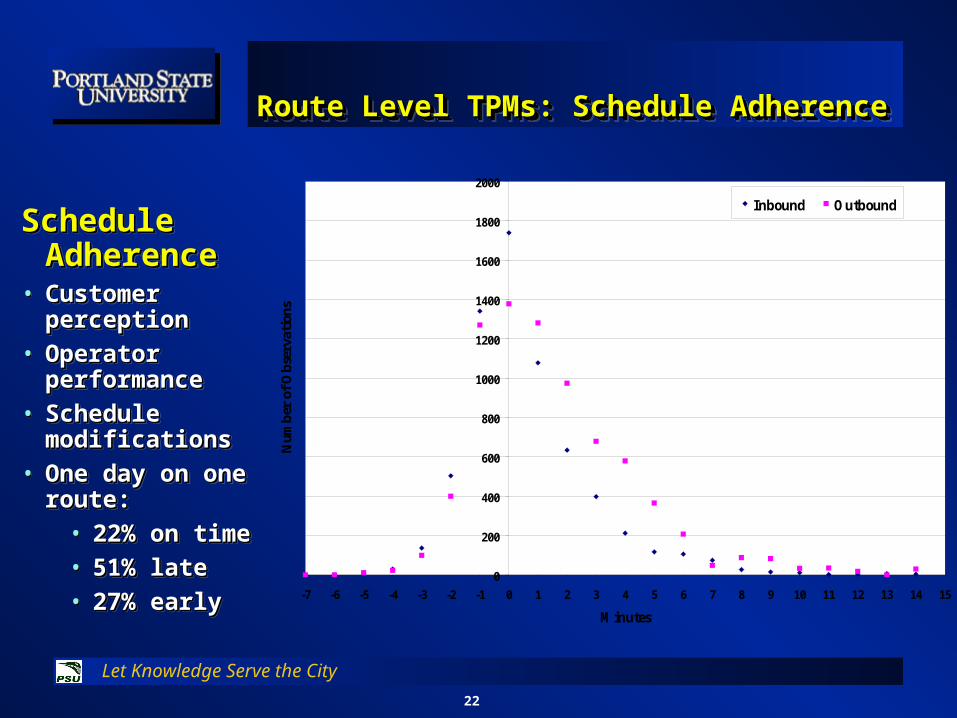
Schedule Schedule AdherenceAdherence
• Customer Customer perceptionperception
• Operator Operator performanceperformance
• Schedule Schedule modificationsmodifications
• One day on one One day on one route:route:
• 22% on time22% on time• 51% late51% late• 27% early27% early
Schedule Schedule AdherenceAdherence
• Customer Customer perceptionperception
• Operator Operator performanceperformance
• Schedule Schedule modificationsmodifications
• One day on one One day on one route:route:
• 22% on time22% on time• 51% late51% late• 27% early27% early

23
Let Knowledge Serve the City
Route Level TPMs: Dwell TimeRoute Level TPMs: Dwell TimeRoute Level TPMs: Dwell TimeRoute Level TPMs: Dwell Time
0
50
100
150
200
250
300
350
400
Nu
mb
er o
f P
asse
nge
rs
0
1000
2000
3000
4000
5000
6000
Tot
al D
wel
l Tim
e
On Off Dwell
Downtown
Dwell timeDwell time• Passenger Passenger
movement vs. movement vs. dwell timedwell time
• One route, one One route, one day.day.
• Connect high Connect high passenger passenger movements with movements with delays.delays.
• Consider Consider boarding boarding improvements improvements and fare and fare payment payment systemssystems

24
Let Knowledge Serve the City
Segment Level TPMsSegment Level TPMsSegment Level TPMsSegment Level TPMs
Key Segments of Important RoutesKey Segments of Important Routes• Apply route level TPMsApply route level TPMs
• Study high passenger movement areas on Route 12Study high passenger movement areas on Route 12
• Connect land use/densityConnect land use/density
• Compare stop activity with populationCompare stop activity with population
• High passenger movement occurs at transfer points High passenger movement occurs at transfer points
with high proportion of commercial useswith high proportion of commercial uses

25
Let Knowledge Serve the City
Segment Level Performance Segment Level Performance MeasuresMeasuresSegment Level Performance Segment Level Performance MeasuresMeasures

26
Let Knowledge Serve the City
Point Level TPMs: HeadwayPoint Level TPMs: HeadwayPoint Level TPMs: HeadwayPoint Level TPMs: Headway
0
5
10
15
20
25
15:21:36 15:36:00 15:50:24 16:04:48 16:19:12 16:33:36 16:48:00 17:02:24 17:16:48 17:31:12
Time
Num
ber
of
Bu
ses
Pas
sin
g T
hro
ugh
th
e S
top
0
2
4
6
8
10
12
Num
ber
of
Pas
sen
gers
Actual Scheduled Passengers
0
5
10
15
20
25
15:21:36 15:36:00 15:50:24 16:04:48 16:19:12 16:33:36 16:48:00 17:02:24 17:16:48 17:31:12
Time
Nu
mb
er o
f B
use
s P
assi
ng
Th
rou
gh t
he
Sto
p
0
2
4
6
8
10
12
Num
ber
of
Pas
sen
gers
Actual Scheduled Passengers
• Cumulative Cumulative scheduled and scheduled and actual for one actual for one stop.stop.
• See arrival rate See arrival rate as slope.as slope.
• Observe delay Observe delay between two between two functions.functions.
• Passenger Passenger movements also movements also shown.shown.
• Control Control bunching.bunching.
On-time On-time performanceperformanceOn-time On-time performanceperformance
27
Let Knowledge Serve the City
Conclusion Conclusion Conclusion Conclusion
• Shift from relying on few, general, aggregate measures Shift from relying on few, general, aggregate measures to detailed, specific measures.to detailed, specific measures.
• Challenges in data collection deployment and archiving—Challenges in data collection deployment and archiving—demonstration of value.demonstration of value.
• Difficulties in converting large quantities of data into Difficulties in converting large quantities of data into meaningful, useful information.meaningful, useful information.
• Connections to service standards.Connections to service standards.• Importance of performance measurement for planning, Importance of performance measurement for planning,
system design/modification and operations.system design/modification and operations.• Support development of TCQSM.Support development of TCQSM.• Experiment with new TPMs and track them over time.Experiment with new TPMs and track them over time.• Introduce into daily operations environment.Introduce into daily operations environment.

28
Let Knowledge Serve the City
AcknowledgementsAcknowledgementsAcknowledgementsAcknowledgements
Steve Callas, TriMet Steve Callas, TriMet
Thomas Kimpel, Center for Urban Studies Thomas Kimpel, Center for Urban Studies
James Strathman, Center for Urban StudiesJames Strathman, Center for Urban Studies
Great Cities Universities CoalitionGreat Cities Universities Coalition
Steve Callas, TriMet Steve Callas, TriMet
Thomas Kimpel, Center for Urban Studies Thomas Kimpel, Center for Urban Studies
James Strathman, Center for Urban StudiesJames Strathman, Center for Urban Studies
Great Cities Universities CoalitionGreat Cities Universities Coalition

29
Let Knowledge Serve the City
Thank You!Thank You!Thank You!Thank You!