using analytics to manage sales and build customer ... · manage sales and build customer...
TRANSCRIPT

USING ANALYTICS TO
MANAGE SALES AND BUILD
CUSTOMER SATISFACTION
ANTTI SYVÄNIEMI
CHIEF EXECUTIVE OFFICER
HOUSTON ANALYTICS LTD

Antti Syväniemi 20.11.2013© Houston Analytics Ltd 2
Know your
customers to
manage
sales and
satisfaction
Using
Analytics to
Bridge
Strategy with
action
The Seven
keys for
using
analytics
Is Analytics
Really
Needed?

IS ANALYTICS REALLY
NEEDED?

FRAGMENTED
PRODUCT AND MEDIA CONSUMPTION
Antti Syväniemi 20.11.2013
Fragmenting consumption leads to lower SKU penetrations
Product penetrations
Growing amount of
SKU’s and channels
lowers the penetration
of individual products
© Houston Analytics Ltd 4

ELECRIFICATION AND INTERNATIONALISATION
Antti Syväniemi 20.11.2013© Houston Analytics Ltd 5

EXPLOSION OF INFORMATION VOLUMES
Antti Syväniemi 20.11.2013
Trends Customers Competitors Weather
© Houston Analytics Ltd 6

NEW WORLD – GOOD OLD WAYS?
• Fragmentation of product and media consumption
together with electrification and explosion of data
volumes has increased need for analytics driven
integrated marketing
• To be able to survive in this new era companies need to
learn how to identify the variating needs of the customer
and to use this insight to create continuous intelligent
customer dialogue
© Houston Analytics Ltd Antti Syväniemi 20.11.2013 7
Old tricks have lost their power in the world of
fragmented and polarized consumption!

KNOW YOUR CUSTOMERS TO
MANAGE SALES AND
SATISFACTION

THE NEW ERA OF MARKETING
MEASUREMENT
© Houston Analytics Ltd Antti Syväniemi 20.11.2013 9
© Exakti Intelligence Ltd 2012
• Traditional assumption”Half of the marketing efforts are useless!
Just wish we knew which half!”
• Measured facta) “62% of the seconds/content of the TV-
ads do not affect consumers at all.
b) 24% of the seconds/content has a
negative impact.
c) Only 14% of the seconds/content
affect as wanted”

Antti Syväniemi 20.11.2013
PREDICTED SALES POTENTIAL AS A BASIS
FOR REDEFINED MARKETING PROCESS
Passive/
Non customers
( Share of wallet
low )
To gain new
customers
Predicted Share Of Wallet and Sales potential
Customer
recruiting
programs for
central customer
groups
Occasional customers
( Share of wallet
average )
Upgrade the customer
relationship
Occasion related
programs (e.g. moving
the address)
Passive /
Non customers
present state
Goals
Activities
Occasional
customers
Committed customers
( Share of wallet
average )
Loyal customers
( Share of wallet
high )
Strengthen the
customer relationship
by relevant offers
Additional and cross sales programs
Loyalty programs
Committed customers
Strengthen the
customer relationship
by relevant offers
© Houston Analytics Ltd 10
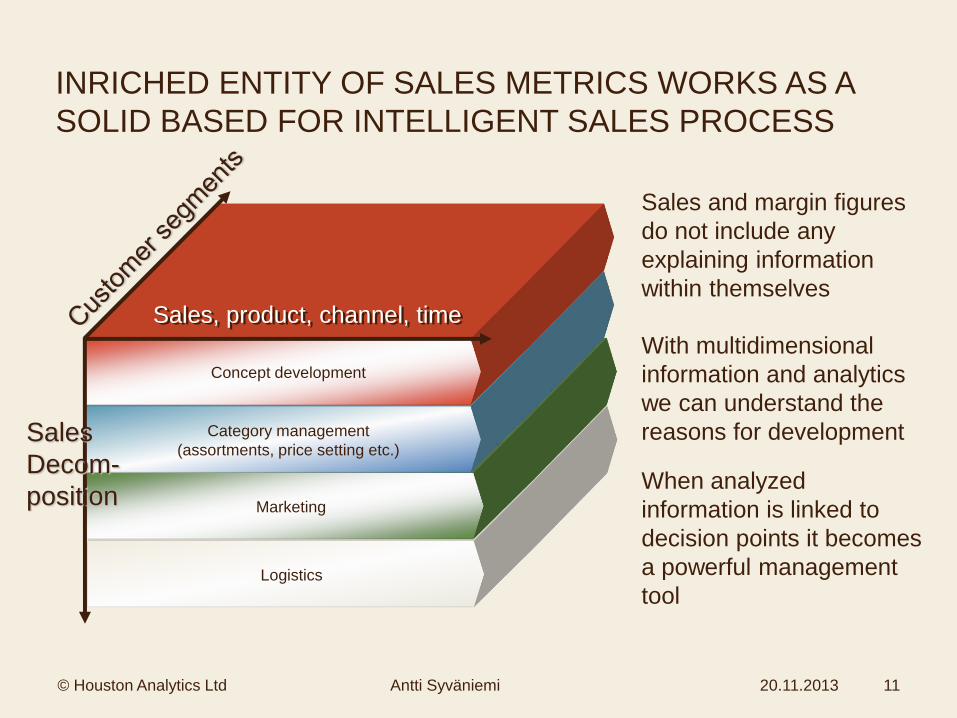
Logistics
Marketing
Category management
(assortments, price setting etc.)
Concept development
Sales, product, channel, time
Sales
Decom-
position
Sales, product, channel, time
Antti Syväniemi 20.11.2013
Sales and margin figures
do not include any
explaining information
within themselves
When analyzed
information is linked to
decision points it becomes
a powerful management
tool
With multidimensional
information and analytics
we can understand the
reasons for development
© Houston Analytics Ltd 11
INRICHED ENTITY OF SALES METRICS WORKS AS A
SOLID BASED FOR INTELLIGENT SALES PROCESS
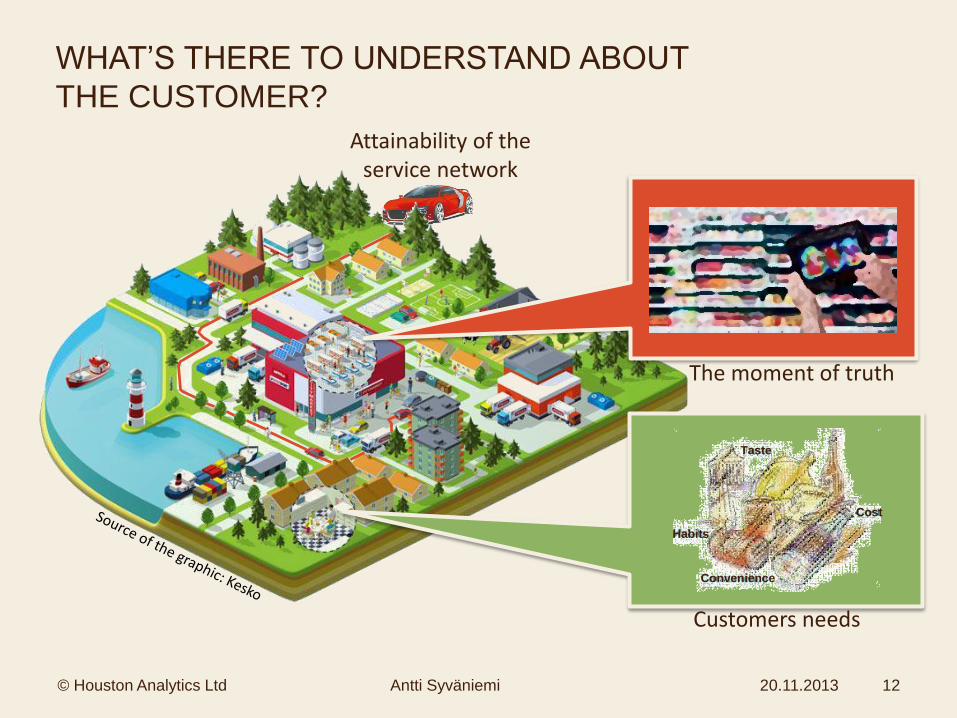
WHAT’S THERE TO UNDERSTAND ABOUT
THE CUSTOMER?
Antti Syväniemi 20.11.2013
The moment of truth
Customers needs
Attainability of the service network
© Houston Analytics Ltd 12
Convenience
Habits
Taste
Cost

Antti Syväniemi 20.11.2013
ANALYTICS CAN BE USED TO BOTH REVEAL THE
CUSTOMER DYNAMICS AND TO PREDICT POTENTIAL
Insight of present customer base
• Who are your most valuable
customers?
• What is their sales and profit share?
• What products or services they use
and why?
• What part of your customer base has
more sales potential? How can you
reach them?
Market and customer potential
• Who are the most potential
customers for your business?
• Who are your competitors
customers?
• What products or services they use
and why?
• How can you reach them?
© Houston Analytics Ltd 13
USING ANALYTICS TO BRIDGE
THE GAP BETWEEN
STRATEGY AND ACTIONS

WITH ANALYTICS IT’S POSSIBLE TO SYNCHRONIZE
THE DIFFERENT INFORMATION AREAS
© Houston Analytics Ltd Antti Syväniemi 20.11.2013 15
Synchronized customer,
market and process insight
Geographical
information
SKU & POS
data
Market
research
In-Site
behavior
National &
Customer
registers
Neural
marketing
Click streams
Various sources
of Big Data
Internet and
Social media

Antti Syväniemi 20.11.2013
AT ITS BEST ANALYTICS CAN CREATE A COMMON
LANGUAGE FOR THE WHOLE ORGANISATION
© Houston Analytics Ltd 16
2. The process entity
1. The chain concept or brand portfolio
• Definitions, emphasis and goals
WhatTo whom How Where
4. Influence of data and
metrics
Same information entity
for both defining the
strategy and aligning it with
everyday processes
Target groups’ location and
mobility
Target groups’ buying
behavior (Receipt and traffic
metrics)
Target groups’ preferences
and price elasticity
Target groups’ campaign
reactivity and media usage
Target groups’ shopping
times, volumes and sales
spikes
Location
Assortment
Service
Price
Site and warehouse logistics
Replenishment planning
Marketing and sales
When
Site location
Fraud detection
Category management
(incl. both product and service assortments)
Advertisement
Campaigns
Availability
Freshness
3. Data warehouse…………………………• Purchase, search and customer information
• External databases (e.g. trend and market data)
A
n
a
l
y
s
i
s
C
u
s
t
o
m
e
r
s
v
i
s
i
t
s
C
u
s
t
o
m
e
r
s
p
u
r
c
h
a
s
e
s
Antti Syväniemi 20.11.2013
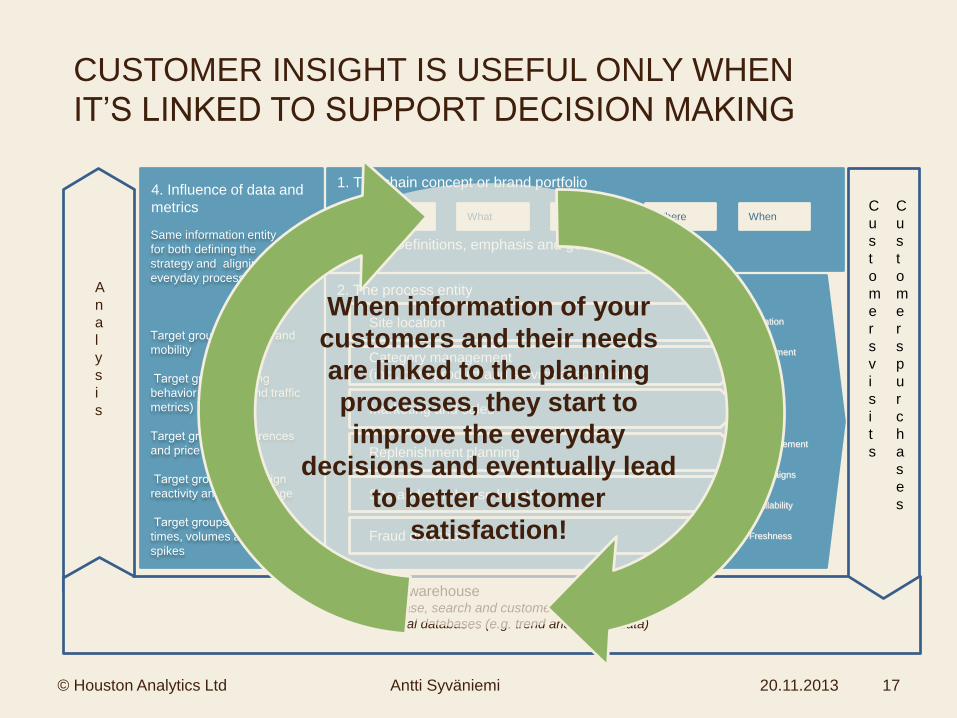
CUSTOMER INSIGHT IS USEFUL ONLY WHEN
IT’S LINKED TO SUPPORT DECISION MAKING
© Houston Analytics Ltd 17
2. The process entity
1. The chain concept or brand portfolio
• Definitions, emphasis and goals
WhatTo whom How Where
4. Influence of data and
metrics
Same information entity
for both defining the
strategy and aligning it with
everyday processes
Target groups’ location and
mobility
Target groups’ buying
behavior (Receipt and traffic
metrics)
Target groups’ preferences
and price elasticity
Target groups’ campaign
reactivity and media usage
Target groups’ shopping
times, volumes and sales
spikes
Location
Assortment
Service
Price
Site and warehouse logistics
Replenishment planning
Marketing and sales
When
Site location
Fraud detection
Category management
(incl. both product and service assortments)
Advertisement
Campaigns
Availability
Freshness
3. Data warehouse…………………………• Purchase, search and customer information
• External databases (e.g. trend and market data)
A
n
a
l
y
s
i
s
C
u
s
t
o
m
e
r
s
v
i
s
i
t
s
C
u
s
t
o
m
e
r
s
p
u
r
c
h
a
s
e
s
When information of your
customers and their needs
are linked to the planning
processes, they start to
improve the everyday
decisions and eventually lead
to better customer
satisfaction!
Campaign period
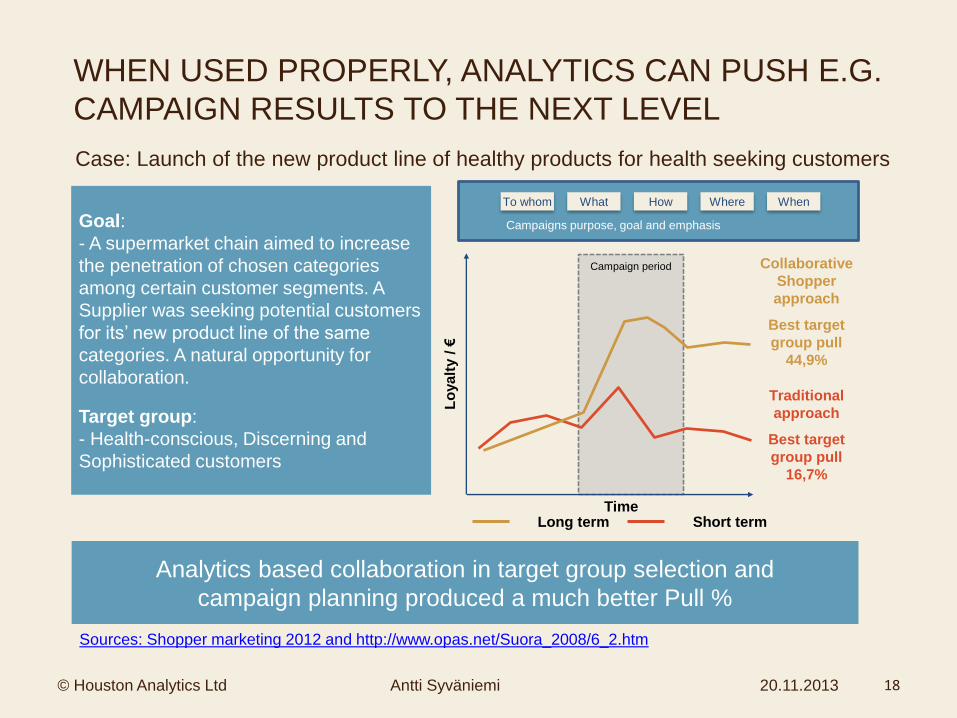
WHEN USED PROPERLY, ANALYTICS CAN PUSH E.G.
CAMPAIGN RESULTS TO THE NEXT LEVEL
Lo
ya
lty /
€
TimeLong term Short term
Collaborative
Shopper
approach
Best target
group pull
44,9%
Traditional
approach
Best target
group pull
16,7%
Analytics based collaboration in target group selection and
campaign planning produced a much better Pull %
© Houston Analytics Ltd Antti Syväniemi 20.11.2013
Sources: Shopper marketing 2012 and http://www.opas.net/Suora_2008/6_2.htm
Goal:
- A supermarket chain aimed to increase
the penetration of chosen categories
among certain customer segments. A
Supplier was seeking potential customers
for its’ new product line of the same
categories. A natural opportunity for
collaboration.
Target group:
- Health-conscious, Discerning and
Sophisticated customers
Case: Launch of the new product line of healthy products for health seeking customers
18
Campaigns purpose, goal and emphasis
WhatTo whom How Where When

THE SEVEN KEYS FOR
USING ANALYTICS
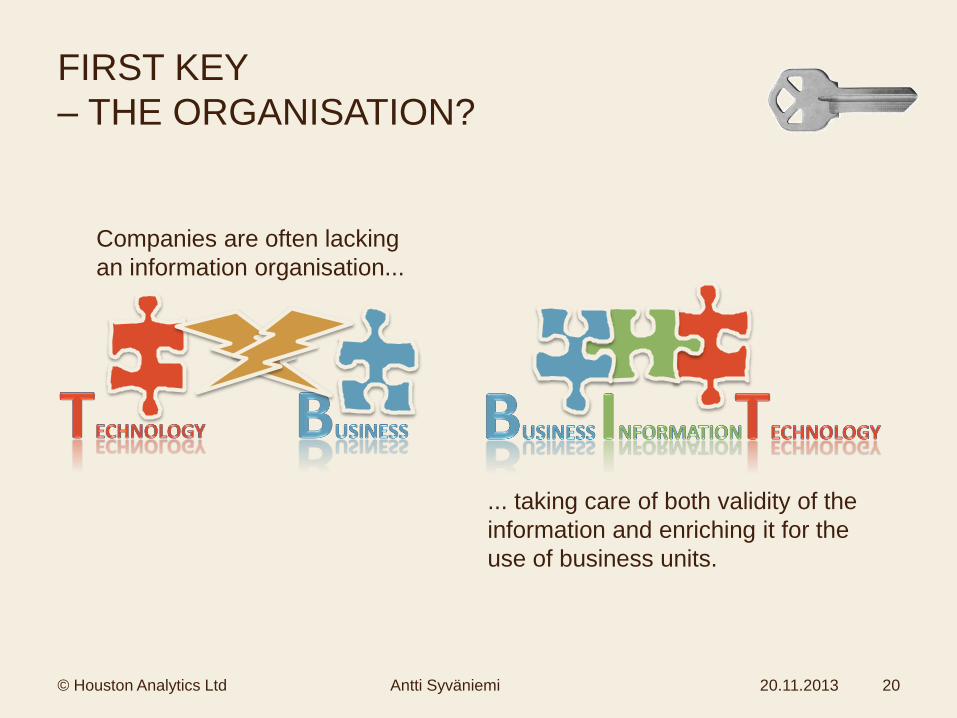
FIRST KEY
– THE ORGANISATION?
Antti Syväniemi 20.11.2013© Houston Analytics Ltd 20
Companies are often lacking
an information organisation...
... taking care of both validity of the
information and enriching it for the
use of business units.
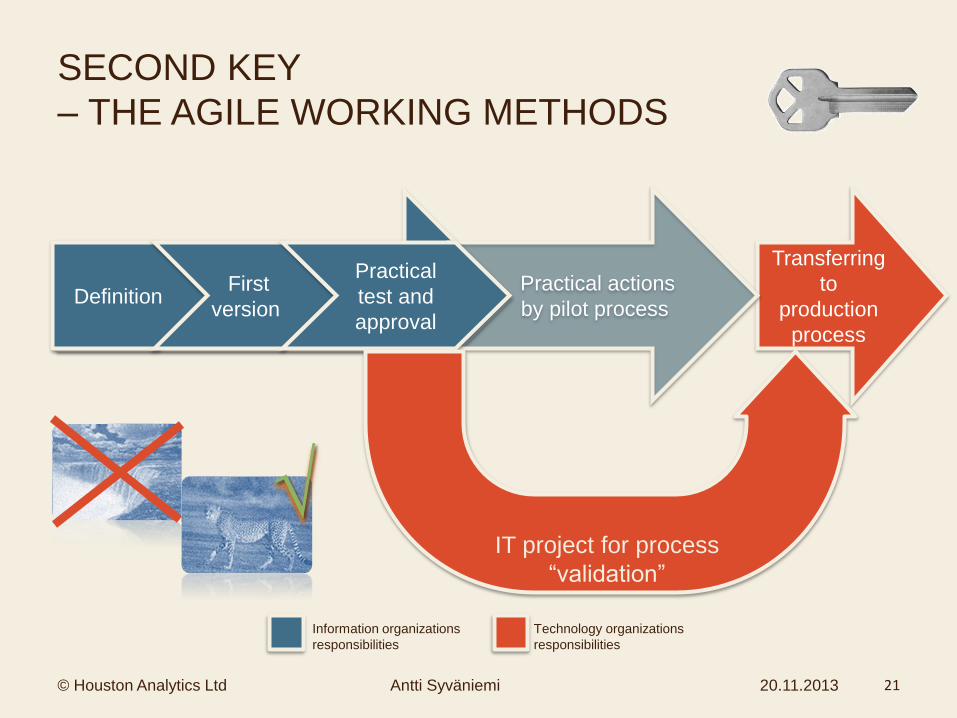
Transferring
to
production
process
Antti Syväniemi 20.11.2013
Practical actions
by pilot processDefinition
First
version
Practical
test and
approval
IT project for process
“validation”
Information organizations
responsibilities
Technology organizations
responsibilities
√
© Houston Analytics Ltd
SECOND KEY
– THE AGILE WORKING METHODS
21

Antti Syväniemi 20.11.2013
Summarized data
+
=
+
=
Detail level data
Algorythm
Predicting
THIRD KEY
– DETAIL LEVEL OF THE DATA
© Houston Analytics Ltd 22
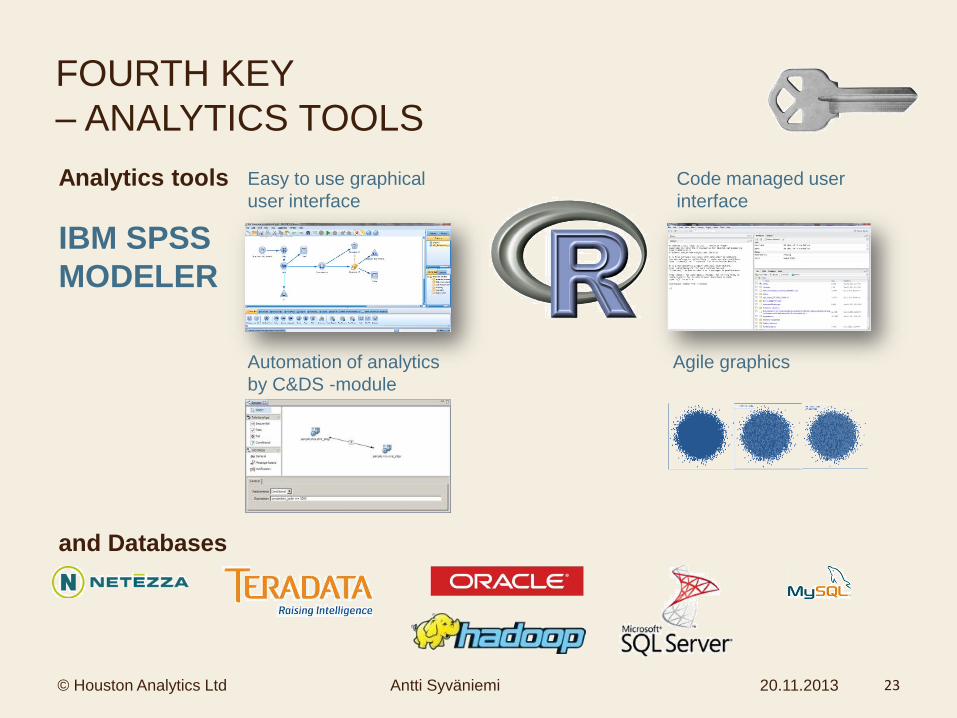
Antti Syväniemi 20.11.2013© Houston Analytics Ltd 23
Analytics tools
IBM SPSS
MODELER
FOURTH KEY
– ANALYTICS TOOLS
Easy to use graphical
user interface
Code managed user
interface
Automation of analytics
by C&DS -module
Agile graphics
and Databases
Antti Syväniemi 20.11.2013
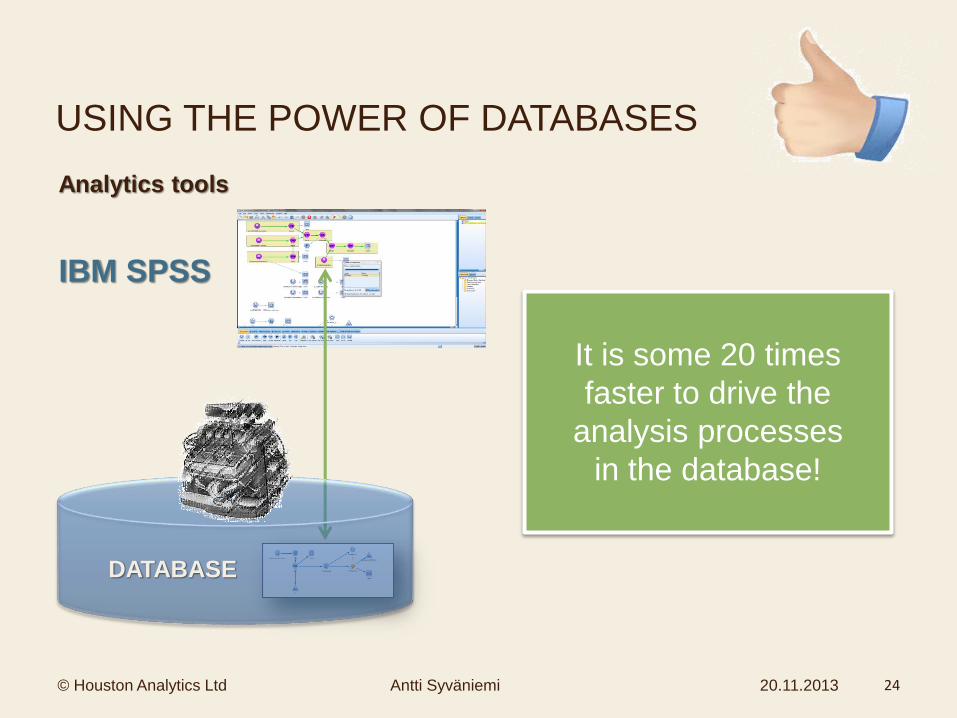
USING THE POWER OF DATABASES
DATABASE
It is some 20 times
faster to drive the
analysis processes
in the database!
IBM SPSS
Analytics tools
© Houston Analytics Ltd 24
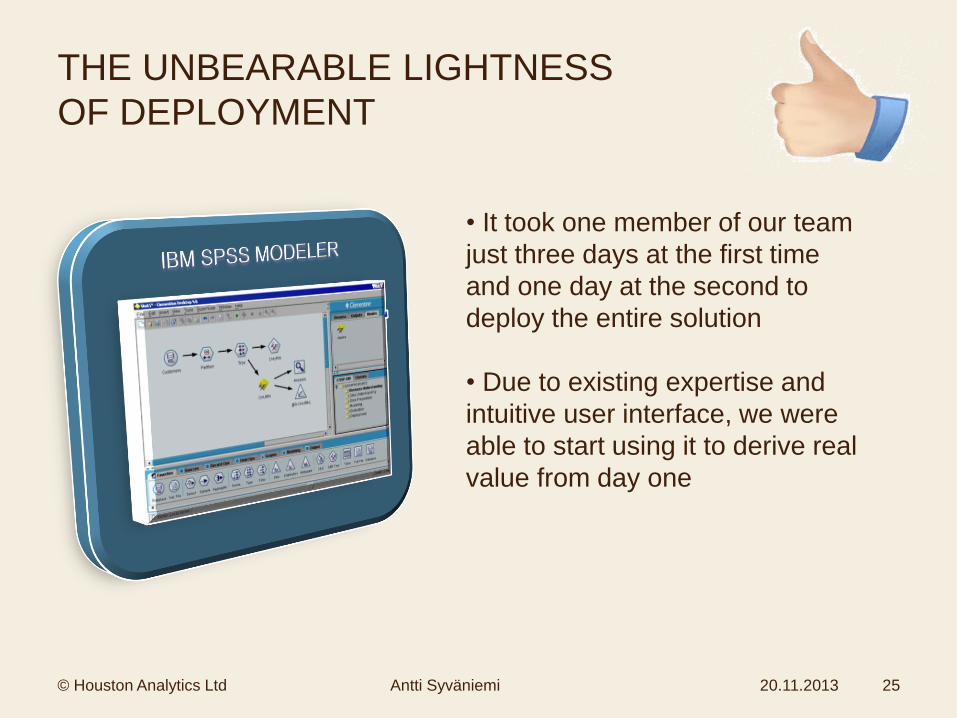
THE UNBEARABLE LIGHTNESS
OF DEPLOYMENT
• It took one member of our team
just three days at the first time
and one day at the second to
deploy the entire solution
• Due to existing expertise and
intuitive user interface, we were
able to start using it to derive real
value from day one
Antti Syväniemi 20.11.2013© Houston Analytics Ltd 25

FIFT KEY- FULL SYSTEM RIGHTS
TO READ AND WRITE THE DATA
Antti Syväniemi 20.11.2013
CRISP
%
V- Read and write 8 min
- Result calculation 1,34 s
- Calculation 17 h
- No results
Two ways
© Houston Analytics Ltd 26

Antti Syväniemi 20.11.2013
Databases
Predictive analytics and optimization tools(BAO)
ERP
CRM
POS
CLOSING THE LOOP
Marketing and sales
Assortment and price setting
Strategy
www
Market research
© Houston Analytics Ltd 27
Management
processes and tools
Data-
warehouse
Predictions and
optimization
Data sources/
Operational
systems
SIXTH KEY
- USER FRIENDLY RESULTS

SIXTH KEY
- USER FRIENDLY RESULTS
© Houston Analytics Ltd Antti Syväniemi 20.11.2013 28
450
9022
490
750
IBM SPSS
User friendly analytics views let business decision makers focus on their decision tasks instead of information cathering and report building

Antti Syväniemi 20.11.2013
SEVENTH KEY
- THE HOLISTIC WAY OF USING ANALYTICS
© Houston Analytics Ltd 29
2. The process entity
1. The chain or brand portfolio
• Definitions, emphasis and goals
WhatTo whom How Where
4. Influence of data and
metrics
Same information entity
for both defining the
strategy and aligning it with
everyday processes
Target groups’ location and
mobility
Target groups’ buying
behavior (Receipt and traffic
metrics)
Target groups’ preferences
and price elasticity
Target groups’ campaign
reactivity and media usage
Target groups’ shopping
times, volumes and sales
spikes
Location
Assortment
Service
Price
Site and warehouse logistics
Replenishment planning
Marketing and sales
When
Site location
Fraud detection
Category management
(incl. both product and service assortments)
Advertisement
Campaigns
Availability
Freshness
3. Data warehouse…………………………• Purchase, search and customer information
• External databases (e.g. trend and market data)
A
n
a
l
y
s
i
s
C
u
s
t
o
m
e
r
s
v
i
s
i
t
s
C
u
s
t
o
m
e
r
s
p
u
r
c
h
a
s
e
s

KEYS FOR ANALYTICS BASED
MANAGEMENT
• Nominate an information responsible role (CAO) for organization
• Try analytics (in agile way) in different processes
• Gather and store the data in most detailed level
• Invest into BAO tools
• Give analysts full rights for their tools
• Make it easy for end users to use analytics results
• Use analytics to create a common language for the organization
Antti Syväniemi 20.11.2013
A Company who chooses analytics as a strategic emphasis can
become an analytics competitor within just couple years
© Houston Analytics Ltd 30

HOUSTON ANALYTICS
D o n ’ t p a n i c .
HOUSTON ANALYTICS
Antti Syväniemi
CEO
Houston Analytics Ltd
+358 50 387 5971
www.houston-analytics.com
@syvaniem