usiminas presentation 3q12ri.usiminas.com/enu/3846/3q12_apresentao_ri.pdfautomotiva usiminas steel...
TRANSCRIPT
Usiminas Presentation
3Q12
Clique para
editar o texto
mestre
Usiminas and its
Business Units
Operational and
Financial
Highlights
Market
Overview
2
Agenda
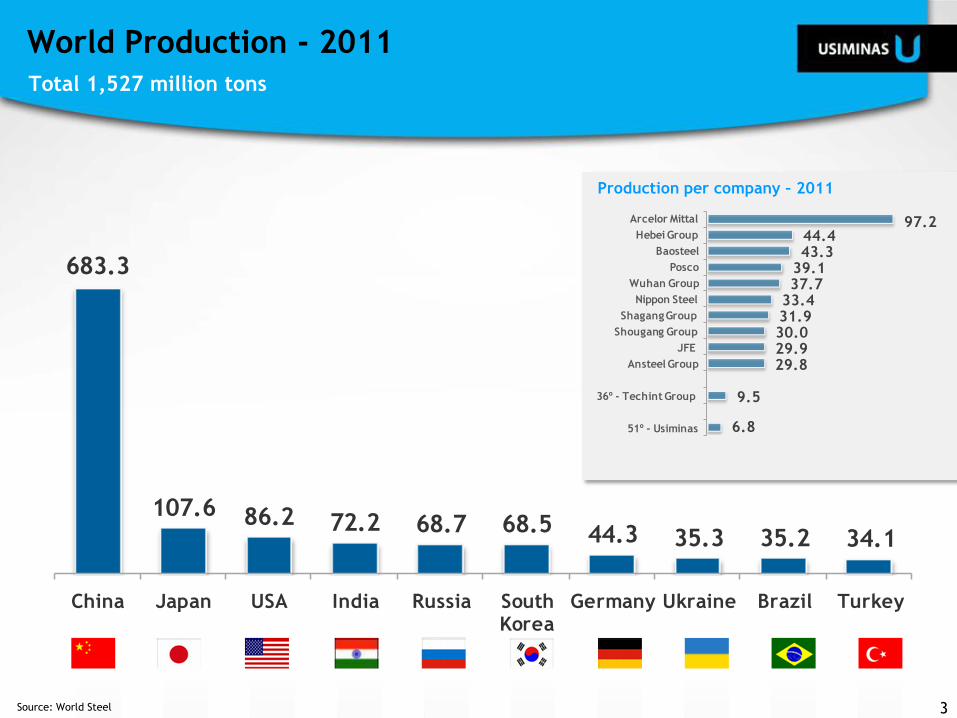
Total 1,527 million tons
Source: World Steel
683.3
107.6 86.2 72.2 68.7 68.5 44.3 35.3 35.2 34.1
China Japan USA India Russia South Korea
Germany Ukraine Brazil Turkey
Production per company – 2011
97.2 44.4 43.3
39.1 37.7
33.4 31.9 30.0 29.9 29.8
9.5
6.8
Arcelor Mittal
Hebei Group
Baosteel
Posco
Wuhan Group
Nippon Steel
Shagang Group
Shougang Group
JFE
Ansteel Group
36º - Techint Group
51º - Usiminas
World Production - 2011
3
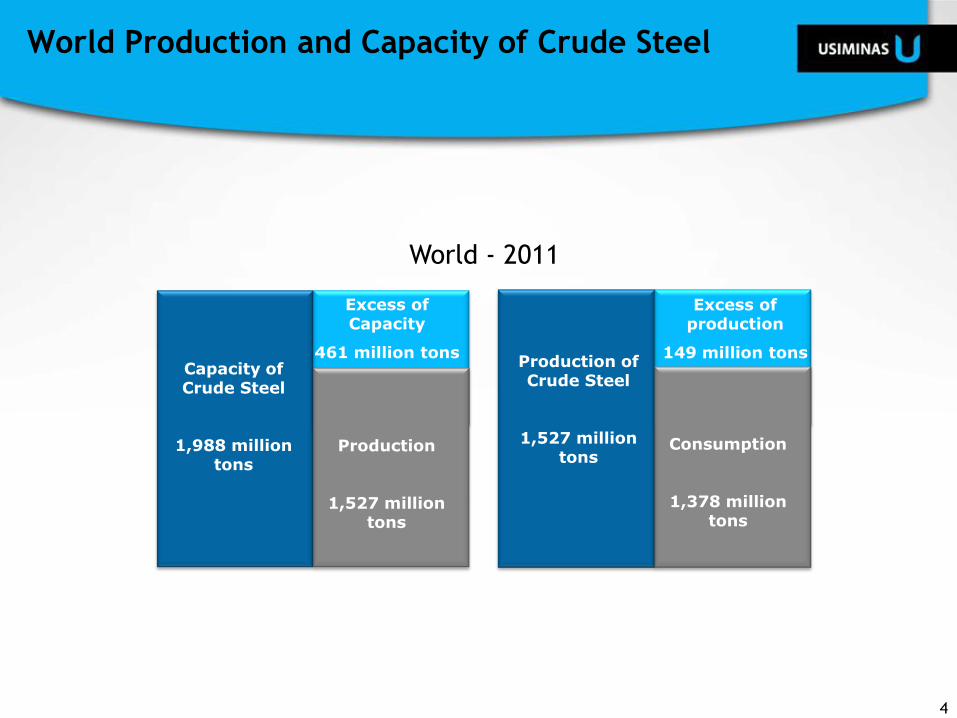
Capacity of Crude Steel
1,988 million tons
Excess of Capacity
461 million tons
Production
1,527 million tons
Production of Crude Steel
1,527 million tons
Excess of production
149 million tons
Consumption
1,378 million tons
World - 2011
World Production and Capacity of Crude Steel
4
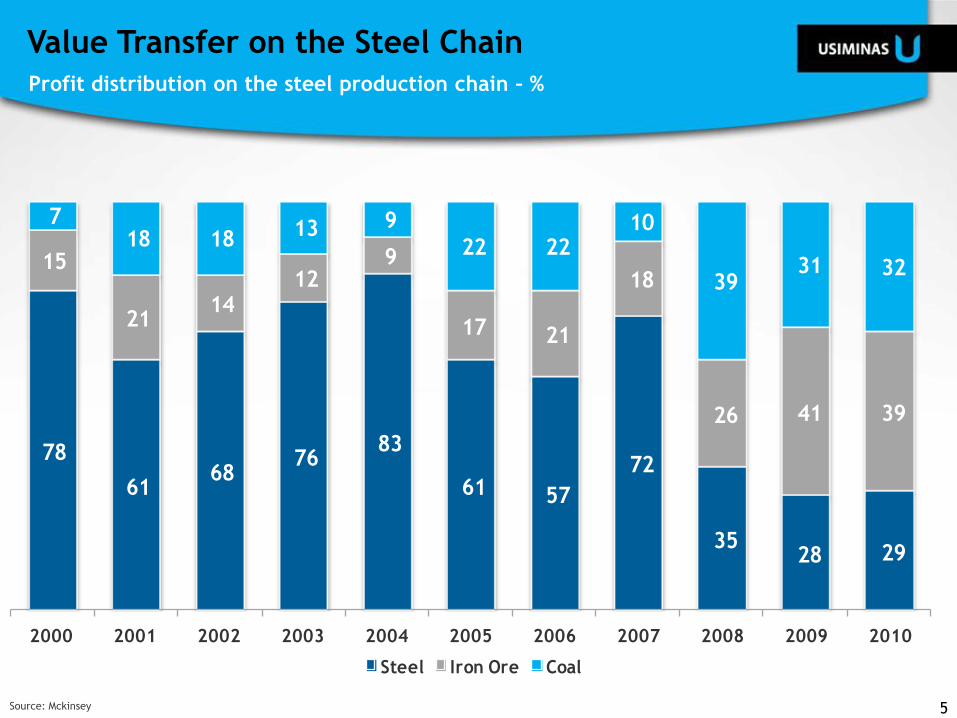
78
61 68
76 83
61 57
72
35 28 29
15
21 14
12 9
17 21
18
26 41 39
7 18 18 13 9
22 22 10
39 31 32
2000 2001 2002 2003 2004 2005 2006 2007 2008 2009 2010
Steel Iron Ore Coal
Source: Mckinsey
Profit distribution on the steel production chain – %
Value Transfer on the Steel Chain
5
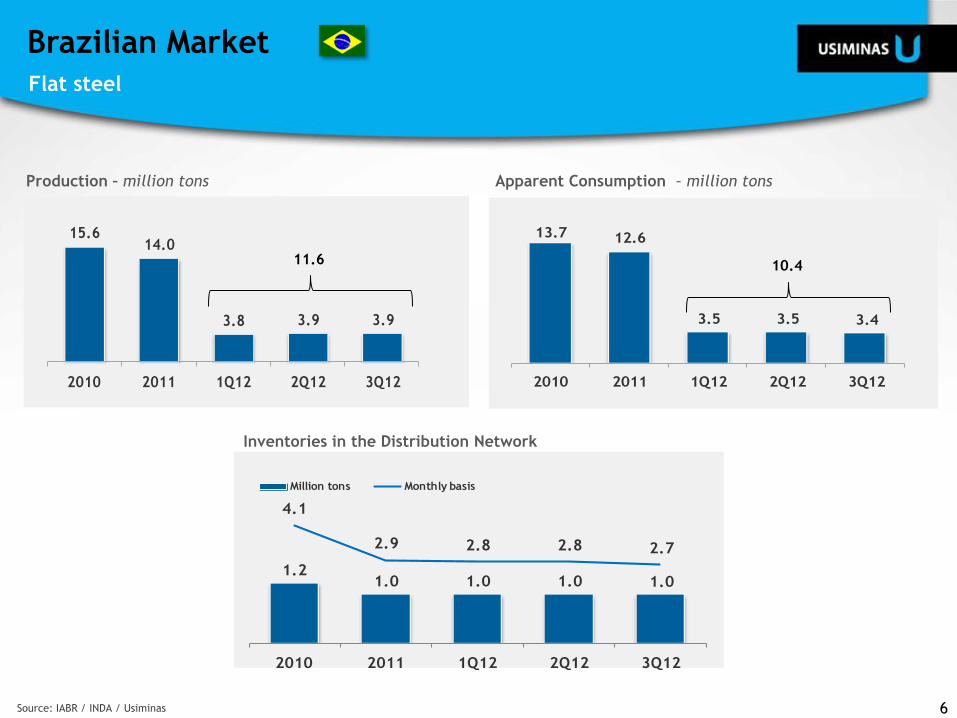
Production – million tons
Source: IABR / INDA / Usiminas
Inventories in the Distribution Network
Apparent Consumption – million tons
15.614.0
3.8 3.9 3.9
2010 2011 1Q12 2Q12 3Q12
13.7 12.6
3.5 3.5 3.4
2010 2011 1Q12 2Q12 3Q12
1.21.0 1.0 1.0 1.0
4.1
2.9 2.8 2.8 2.7
2010 2011 1Q12 2Q12 3Q12
Million tons Monthly basis
Flat steel
Brazilian Market
6
11.6 10.4
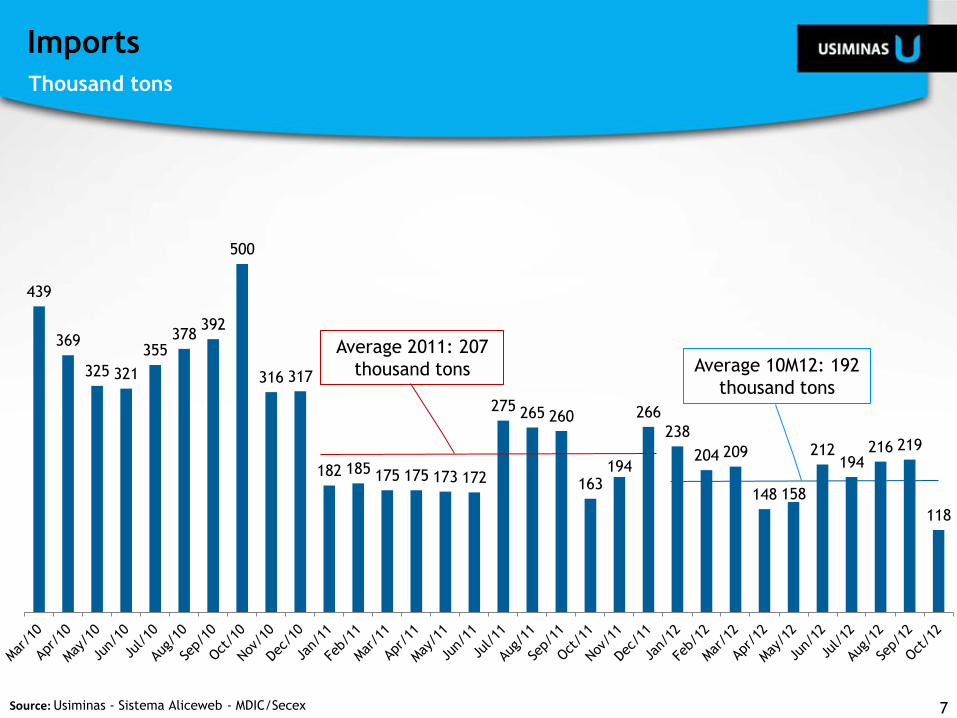
439
369
325 321
355 378
392
500
316 317
182 185 175 175 173 172
275 265 260
163 194
266
238
204 209
148 158
212 194
216 219
118
Source: Usiminas - Sistema Aliceweb - MDIC/Secex
Average 2011: 207
thousand tons Average 10M12: 192
thousand tons
Thousand tons
Imports
7
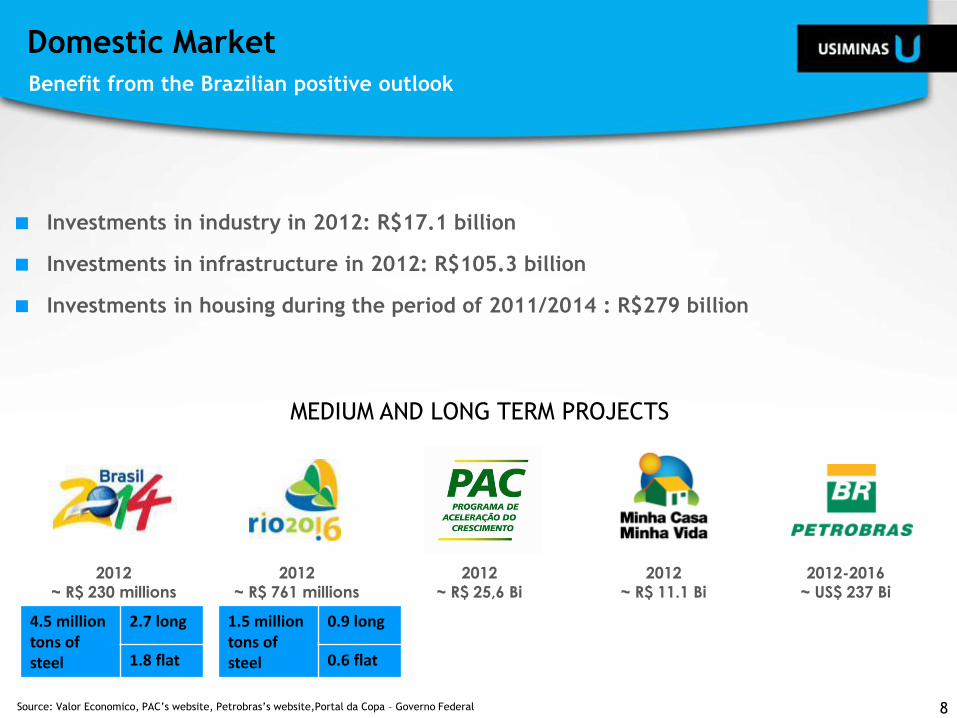
Investments in industry in 2012: R$17.1 billion
Investments in infrastructure in 2012: R$105.3 billion
Investments in housing during the period of 2011/2014 : R$279 billion
MEDIUM AND LONG TERM PROJECTS
2012-2016
~ US$ 237 Bi
2012
~ R$ 761 millions
2012
~ R$ 230 millions
Source: Valor Economico, PAC’s website, Petrobras’s website,Portal da Copa – Governo Federal
2012
~ R$ 25,6 Bi
2012
~ R$ 11.1 Bi
4.5 million tons of steel
2.7 long
1.8 flat
1.5 million tons of steel
0.9 long
0.6 flat
Benefit from the Brazilian positive outlook
Domestic Market
8
Clique para
editar o texto
mestre
Usiminas and its
Business Units
Operational and
Financial
Highlights
Market
Overview
Agenda
9
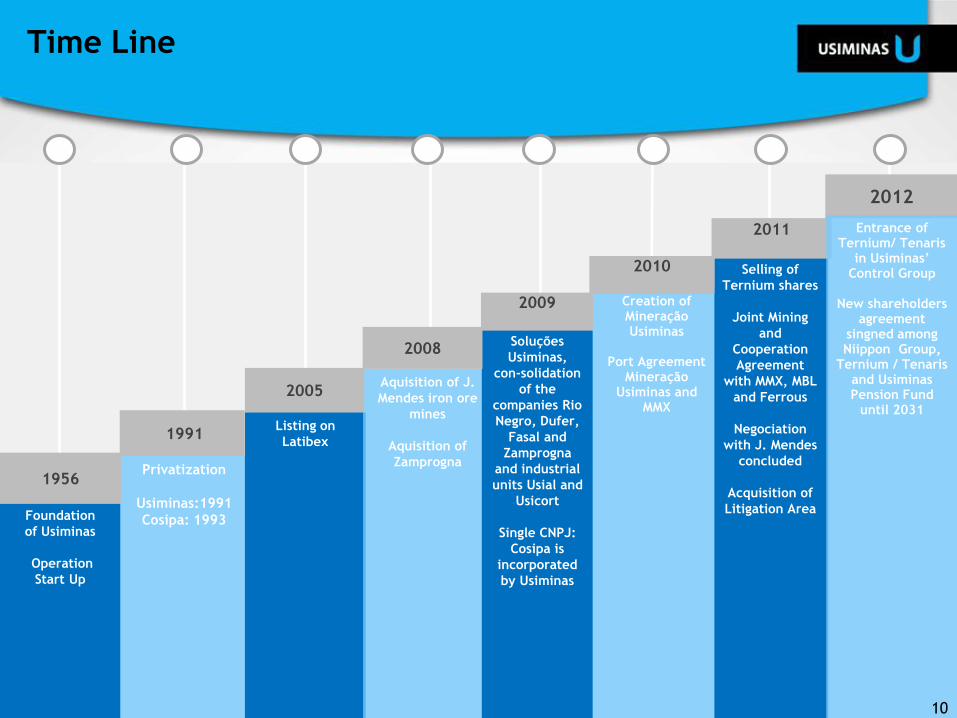
Foundation
of Usiminas
Operation
Start Up
Privatization
Usiminas:1991
Cosipa: 1993
Listing on
Latibex
Aquisition of J.
Mendes iron ore
mines
Aquisition of
Zamprogna
Soluções
Usiminas,
con-solidation
of the
companies Rio
Negro, Dufer,
Fasal and
Zamprogna
and industrial
units Usial and
Usicort
Single CNPJ:
Cosipa is
incorporated
by Usiminas
Creation of Mineração Usiminas
Port Agreement
Mineração Usiminas and
MMX
Selling of
Ternium shares
Joint Mining
and
Cooperation
Agreement
with MMX, MBL
and Ferrous
Negociation
with J. Mendes
concluded
Acquisition of
Litigation Area
1956
1991
2005
2008
2009
2010
2011
2012
Entrance of Ternium/ Tenaris
in Usiminas’ Control Group
New shareholders
agreement singned among Niippon Group,
Ternium / Tenaris and Usiminas Pension Fund
until 2031
Time Line
10
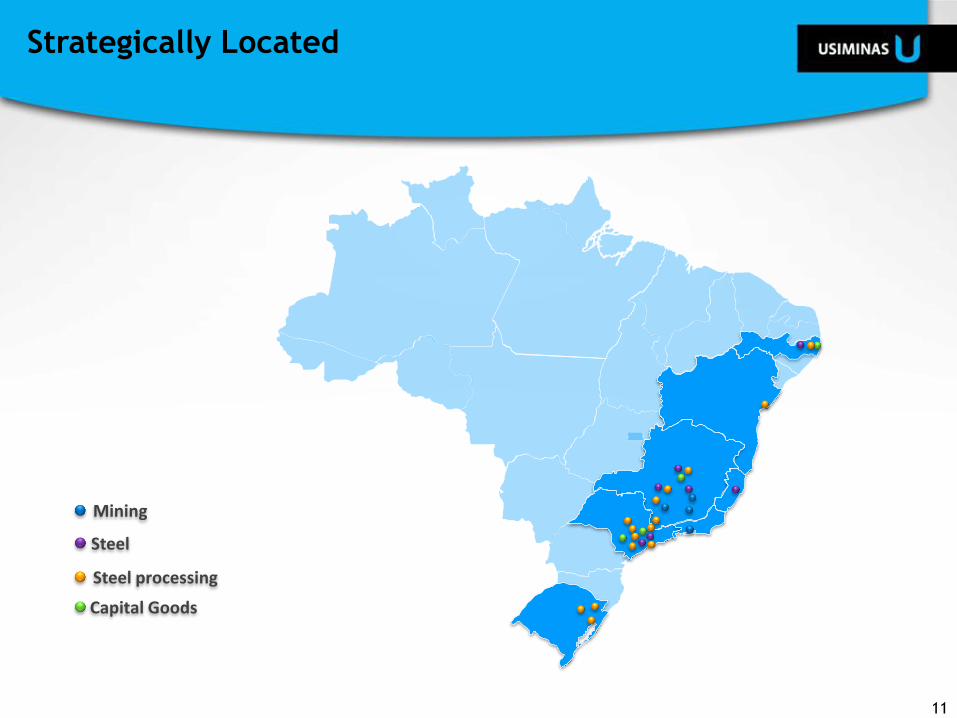
Mining
Steel
Steel processing
Capital Goods
Strategically Located
11
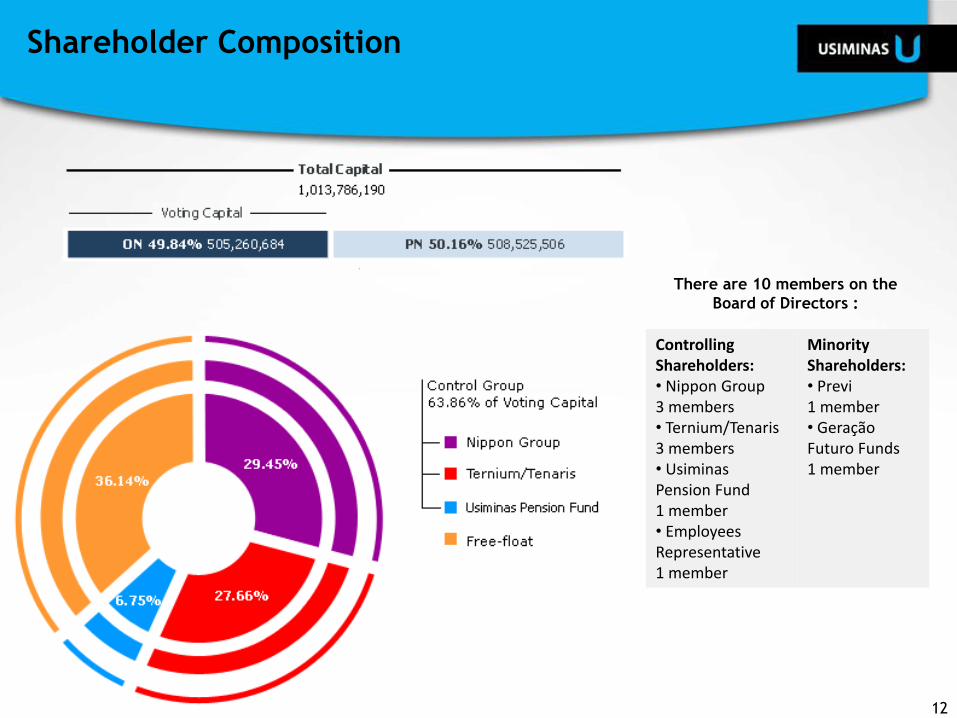
Shareholder Composition
12
Controlling Shareholders: • Nippon Group 3 members • Ternium/Tenaris 3 members • Usiminas Pension Fund 1 member • Employees Representative 1 member
Minority Shareholders: • Previ 1 member • Geração Futuro Funds 1 member
There are 10 members on the
Board of Directors :
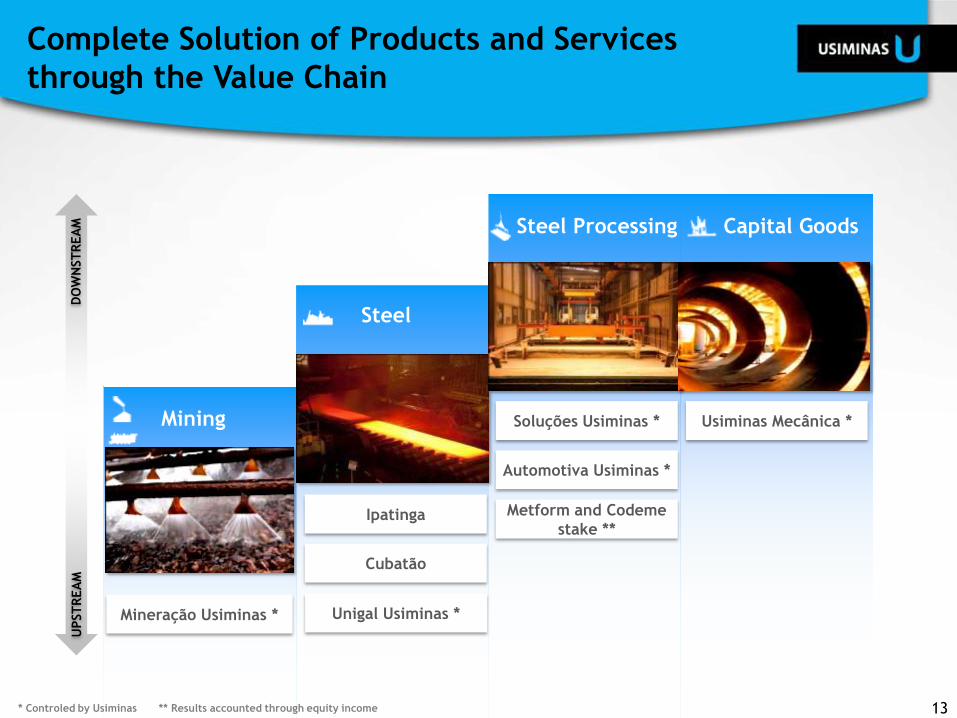
Mining
Steel
Steel Processing Capital Goods
UPST
REA
M
DO
WN
ST
REA
M
* Controled by Usiminas ** Results accounted through equity income
Ipatinga
Automotiva Usiminas *
Metform and Codeme
stake **
Cubatão
Unigal Usiminas * Mineração Usiminas *
Soluções Usiminas * Usiminas Mecânica *
Complete Solution of Products and Services
through the Value Chain
13
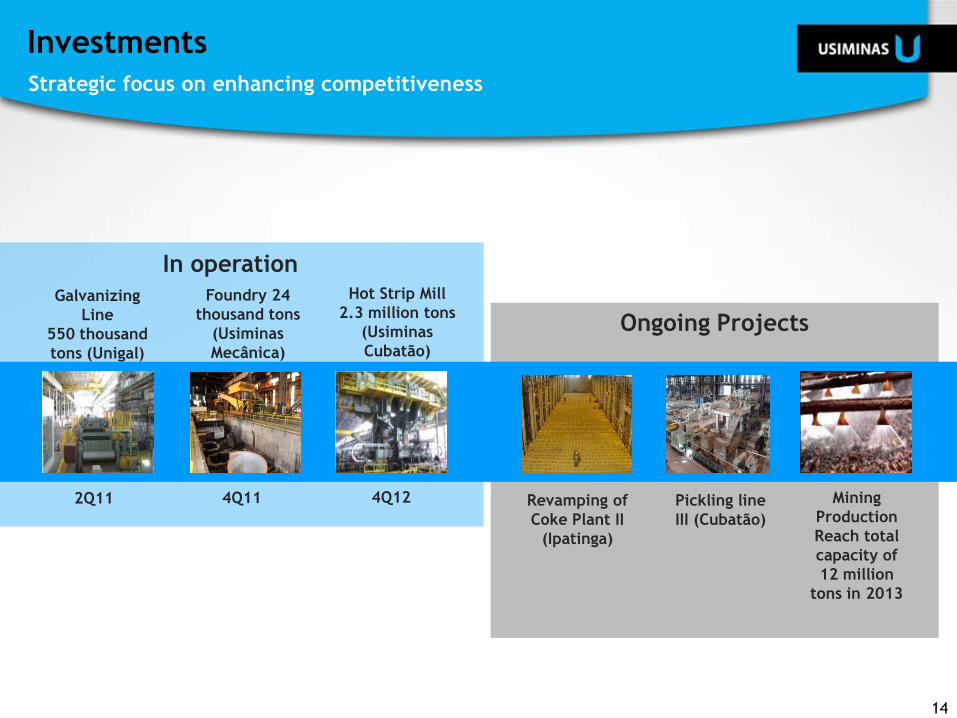
Ongoing Projects
Galvanizing
Line
550 thousand
tons (Unigal)
Hot Strip Mill
2.3 million tons
(Usiminas
Cubatão)
Mining
Production
Reach total
capacity of
12 million
tons in 2013
In operation
2Q11
Foundry 24
thousand tons
(Usiminas
Mecânica)
4Q11 4Q12 Pickling line
III (Cubatão)
Revamping of
Coke Plant II
(Ipatinga)
Investments
14
Strategic focus on enhancing competitiveness
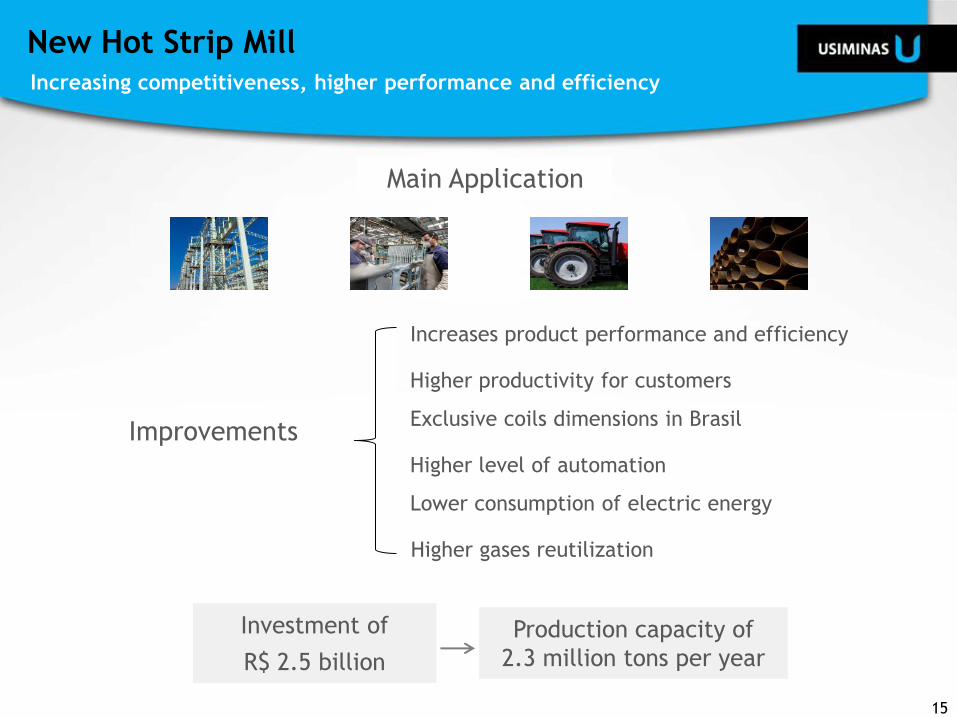
Increasing competitiveness, higher performance and efficiency
New Hot Strip Mill
Investment of
R$ 2.5 billion
Production capacity of
2.3 million tons per year
Increases product performance and efficiency
Higher productivity for customers
Exclusive coils dimensions in Brasil
Higher level of automation
Lower consumption of electric energy
Higher gases reutilization
Improvements
Main Application
15
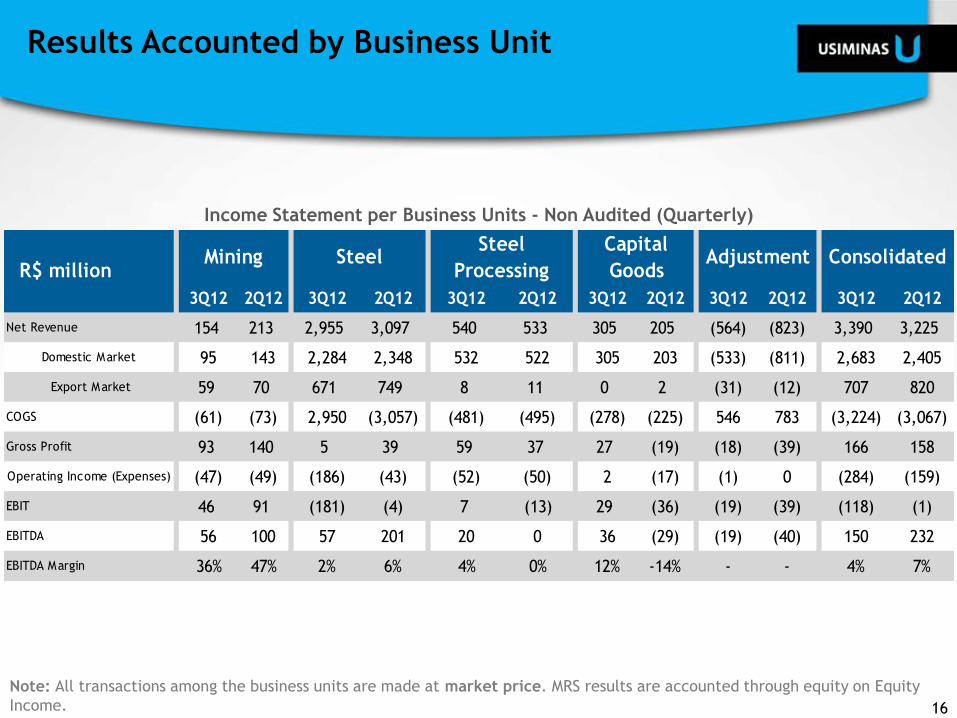
Income Statement per Business Units - Non Audited (Quarterly)
Note: All transactions among the business units are made at market price. MRS results are accounted through equity on Equity
Income.
R$ million
3Q12 2Q12 3Q12 2Q12 3Q12 2Q12 3Q12 2Q12 3Q12 2Q12 3Q12 2Q12
Net Revenue 154 213 2,955 3,097 540 533 305 205 (564) (823) 3,390 3,225
Domestic Market 95 143 2,284 2,348 532 522 305 203 (533) (811) 2,683 2,405
Export Market 59 70 671 749 8 11 0 2 (31) (12) 707 820
COGS (61) (73) 2,950 (3,057) (481) (495) (278) (225) 546 783 (3,224) (3,067)
Gross Profit 93 140 5 39 59 37 27 (19) (18) (39) 166 158
Operating Income (Expenses) (47) (49) (186) (43) (52) (50) 2 (17) (1) 0 (284) (159)
EBIT 46 91 (181) (4) 7 (13) 29 (36) (19) (39) (118) (1)
EBITDA 56 100 57 201 20 0 36 (29) (19) (40) 150 232
EBITDA Margin 36% 47% 2% 6% 4% 0% 12% -14% - - 4% 7%
Mining SteelSteel
Processing
Capital
GoodsAdjustment Consolidated
Results Accounted by Business Unit
16
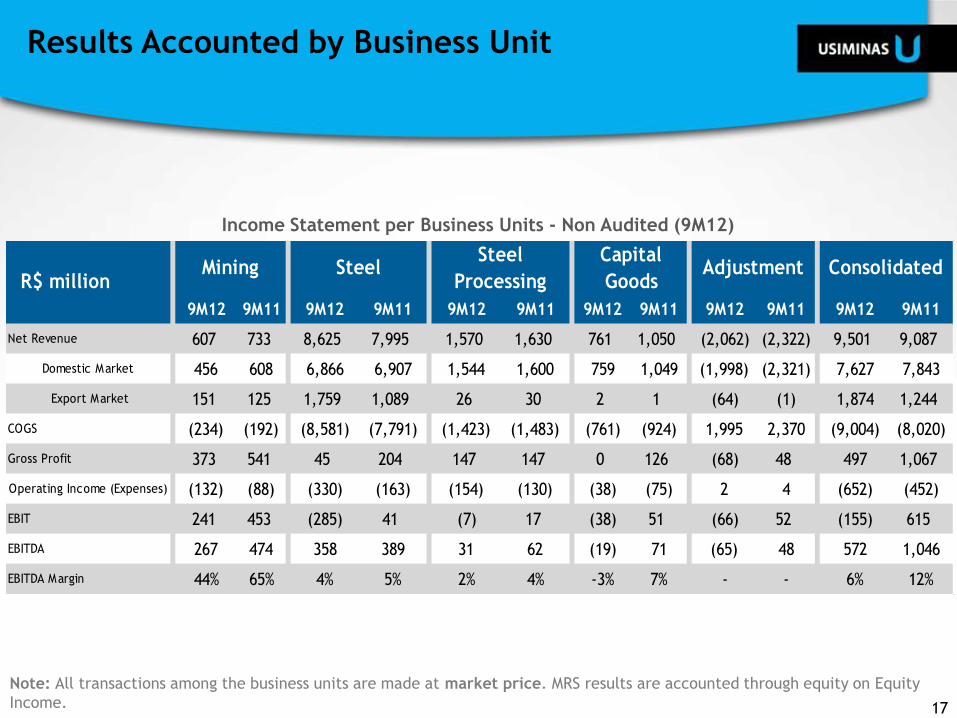
Income Statement per Business Units - Non Audited (9M12)
Note: All transactions among the business units are made at market price. MRS results are accounted through equity on Equity
Income.
R$ million
9M12 9M11 9M12 9M11 9M12 9M11 9M12 9M11 9M12 9M11 9M12 9M11
Net Revenue 607 733 8,625 7,995 1,570 1,630 761 1,050 (2,062) (2,322) 9,501 9,087
Domestic Market 456 608 6,866 6,907 1,544 1,600 759 1,049 (1,998) (2,321) 7,627 7,843
Export Market 151 125 1,759 1,089 26 30 2 1 (64) (1) 1,874 1,244
COGS (234) (192) (8,581) (7,791) (1,423) (1,483) (761) (924) 1,995 2,370 (9,004) (8,020)
Gross Profit 373 541 45 204 147 147 0 126 (68) 48 497 1,067
Operating Income (Expenses) (132) (88) (330) (163) (154) (130) (38) (75) 2 4 (652) (452)
EBIT 241 453 (285) 41 (7) 17 (38) 51 (66) 52 (155) 615
EBITDA 267 474 358 389 31 62 (19) 71 (65) 48 572 1,046
EBITDA Margin 44% 65% 4% 5% 2% 4% -3% 7% - - 6% 12%
Mining SteelSteel
Processing
Capital
GoodsAdjustment Consolidated
Results Accounted by Business Unit
17
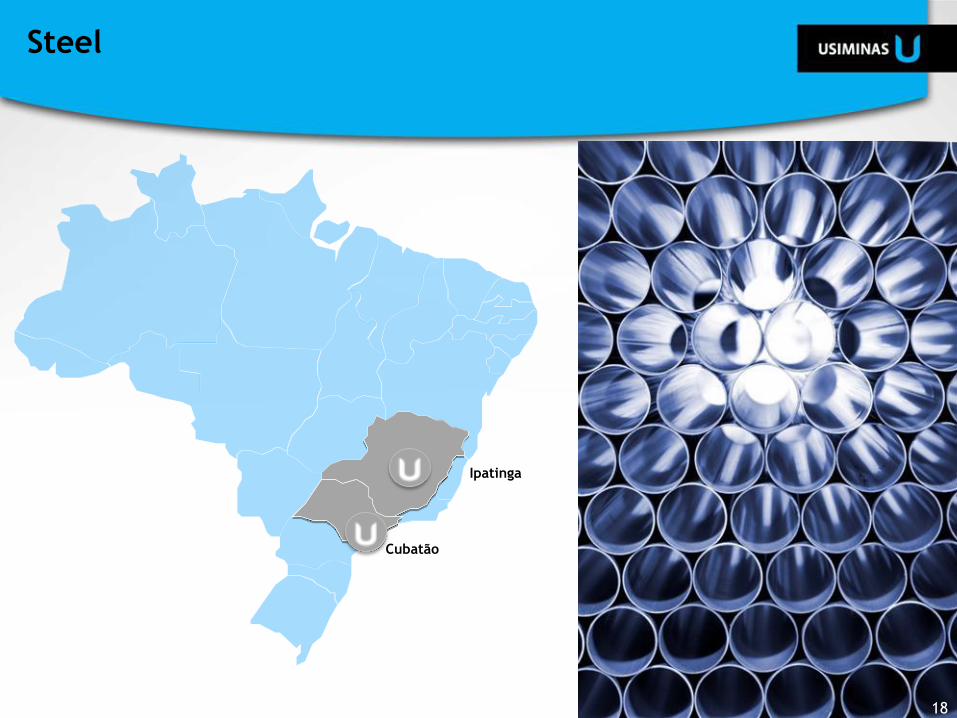
Cubatão
Ipatinga
18
Steel
18
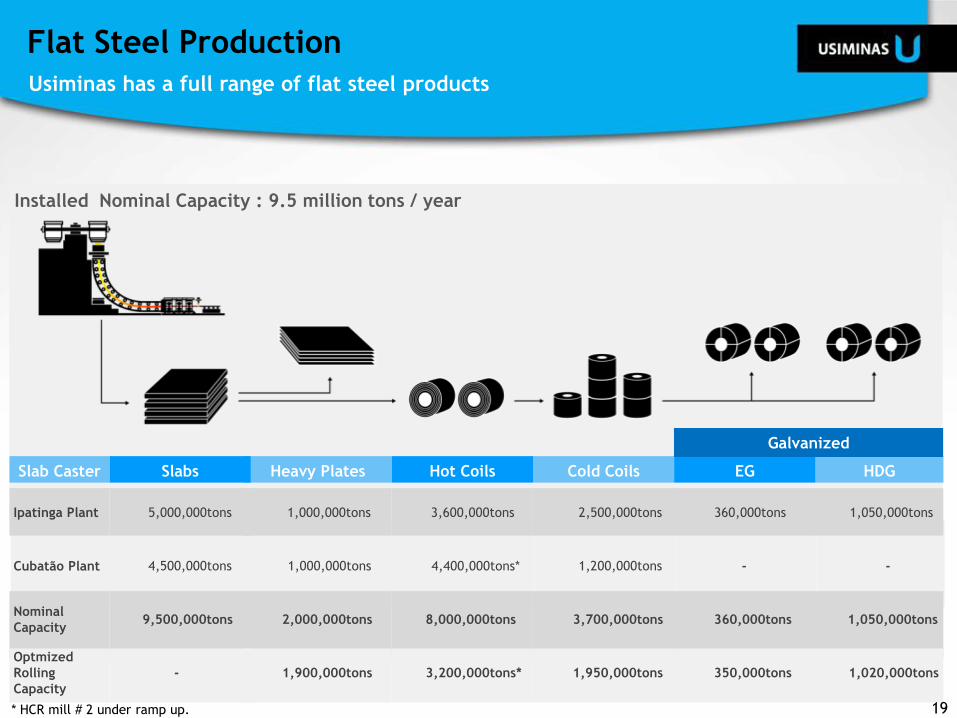
Installed Nominal Capacity : 9.5 million tons / year
Slabs Hot Coils Cold Coils Heavy Plates Slab Caster EG HDG
1,950,000tons
Optmized
Rolling
Capacity
3,200,000tons* 1,900,000tons 1,020,000tons 350,000tons
Cubatão Plant - 1,200,000tons - 4,400,000tons* 1,000,000tons 4,500,000tons
3,700,000tons Nominal
Capacity 8,000,000tons 2,000,000tons 9,500,000tons 1,050,000tons 360,000tons
-
Ipatinga Plant 1,050,000tons 360,000tons 2,500,000tons 3,600,000tons 1,000,000tons 5,000,000tons
Galvanized
* HCR mill # 2 under ramp up.
Usiminas has a full range of flat steel products
Flat Steel Production
19
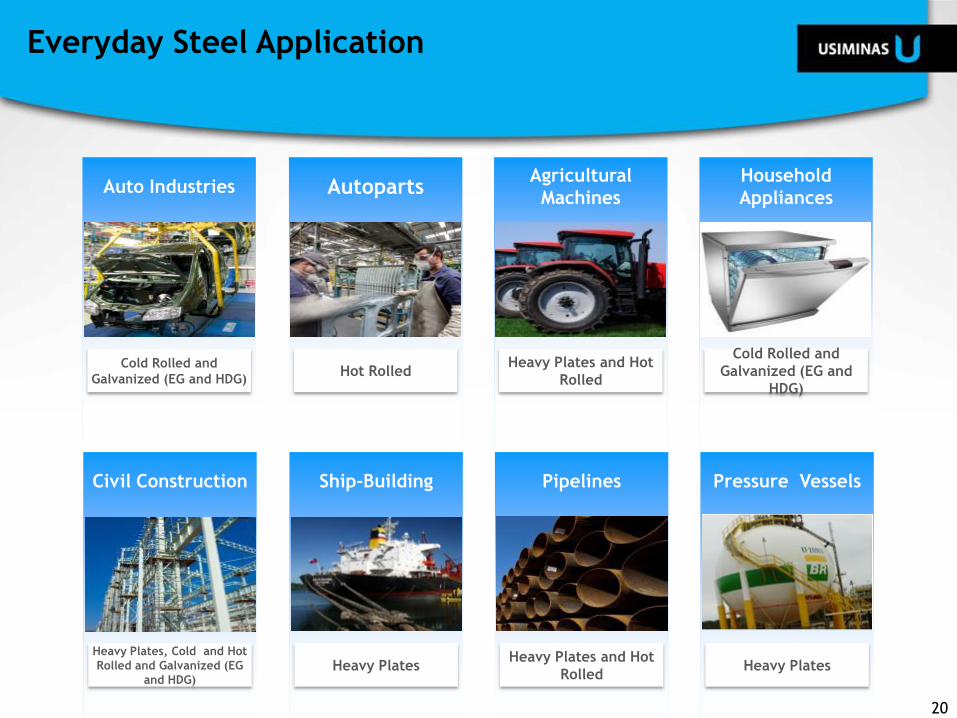
Auto Industries
Cold Rolled and
Galvanized (EG and HDG)
Ship-Building
Heavy Plates
Pipelines
Heavy Plates and Hot
Rolled
Pressure Vessels
Heavy Plates
Agricultural
Machines
Heavy Plates and Hot
Rolled
Civil Construction
Heavy Plates, Cold and Hot
Rolled and Galvanized (EG
and HDG)
Autoparts
Hot Rolled
Household
Appliances
Cold Rolled and
Galvanized (EG and
HDG)
Everyday Steel Application
20
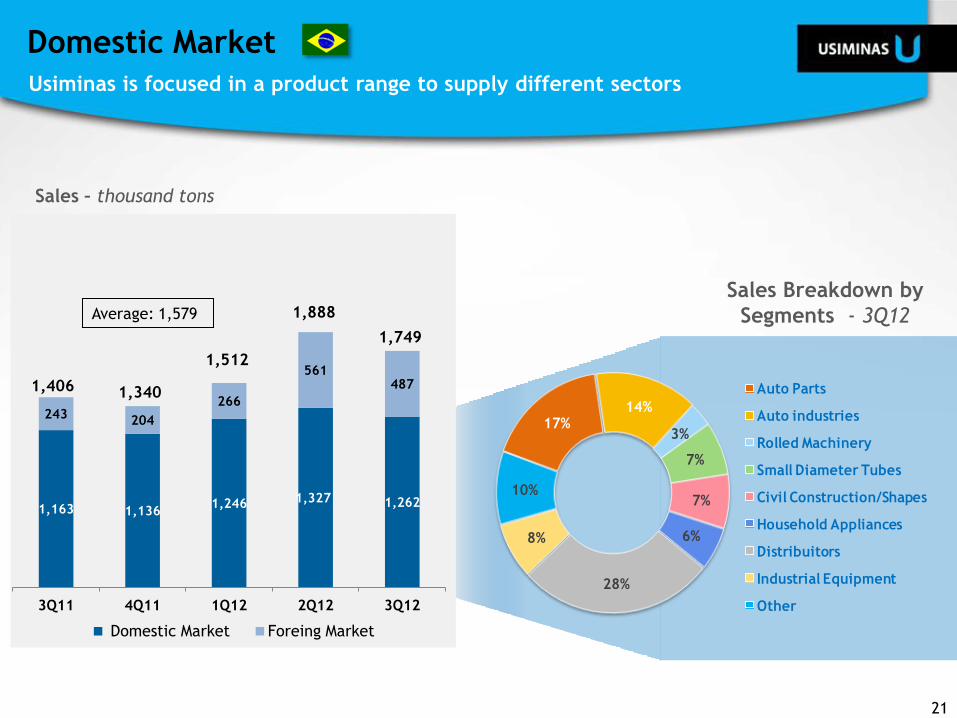
1,163 1,136
1,246 1,327 1,262
243 204
266
561 487
3Q11 4Q11 1Q12 2Q12 3Q12
Domestic Market Foreing Market
1,406
1,512
1,888
1,749
1,340
Sales – thousand tons
Sales Breakdown by
Segments - 3Q12
Domestic Market
Usiminas is focused in a product range to supply different sectors
21
Average: 1,579
17%14%
3%
7%
7%
6%
28%
8%
10%
Auto Parts
Auto industries
Rolled Machinery
Small Diameter Tubes
Civil Construction/Shapes
Household Appliances
Distribuitors
Industrial Equipment
Other
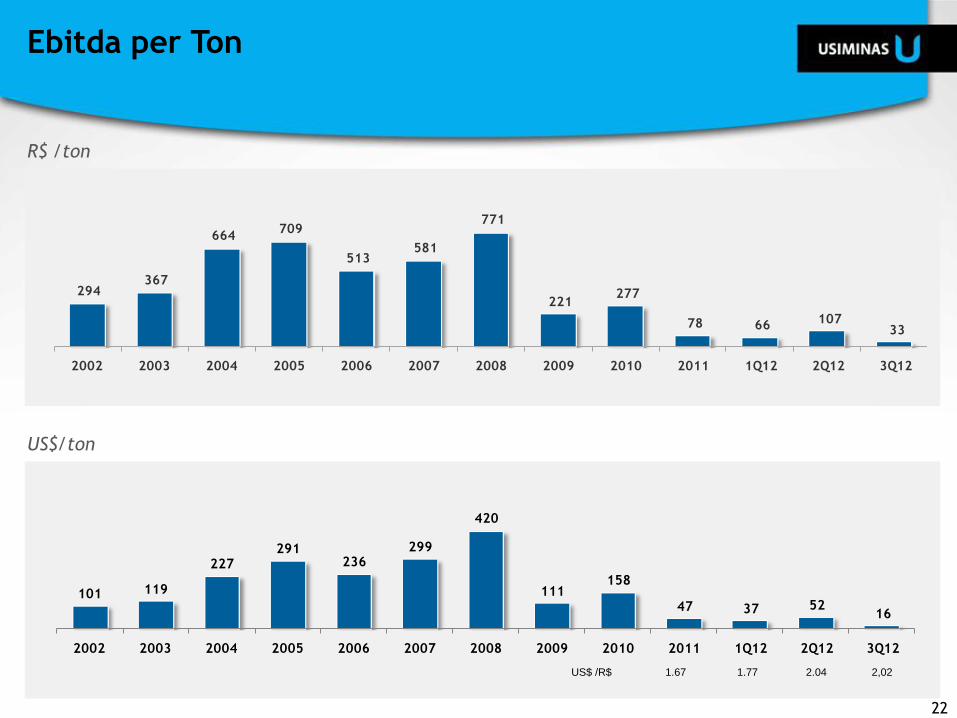
US$/ton
R$ /ton
101 119
227291
236299
420
111158
47 37 5216
2002 2003 2004 2005 2006 2007 2008 2009 2010 2011 1Q12 2Q12 3Q12
294 367
664 709
513 581
771
221 277
78 66 107 33
2002 2003 2004 2005 2006 2007 2008 2009 2010 2011 1Q12 2Q12 3Q12
US$ /R$ 1.67 1.77 2.04 2,02
Ebitda per Ton
22
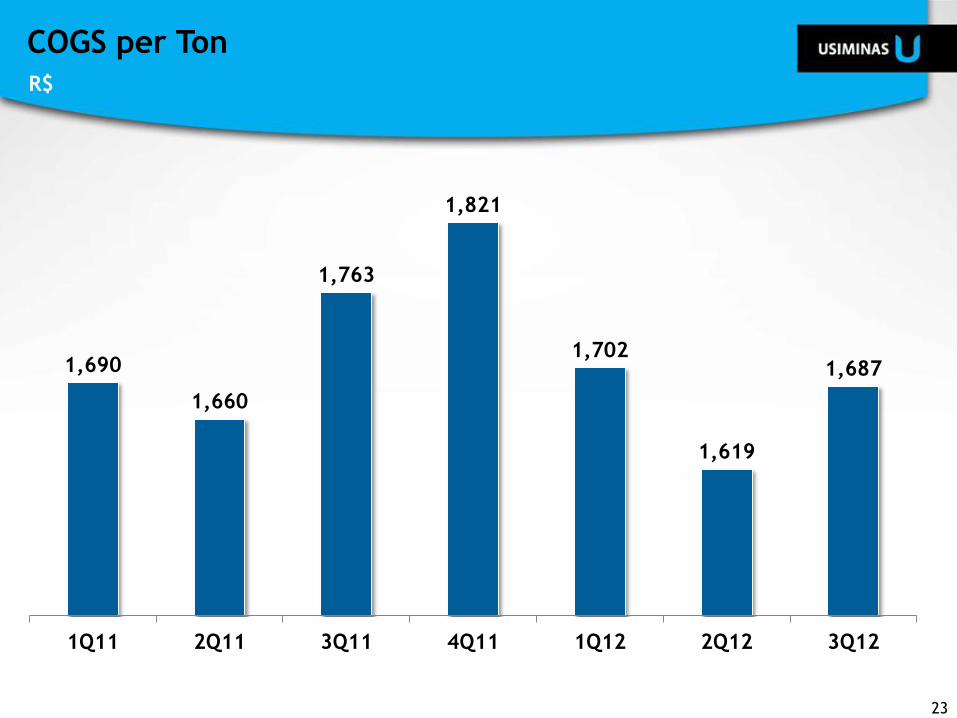
COGS per Ton
1,690
1,660
1,763
1,821
1,702
1,619
1,687
1Q11 2Q11 3Q11 4Q11 1Q12 2Q12 3Q12
R$
23
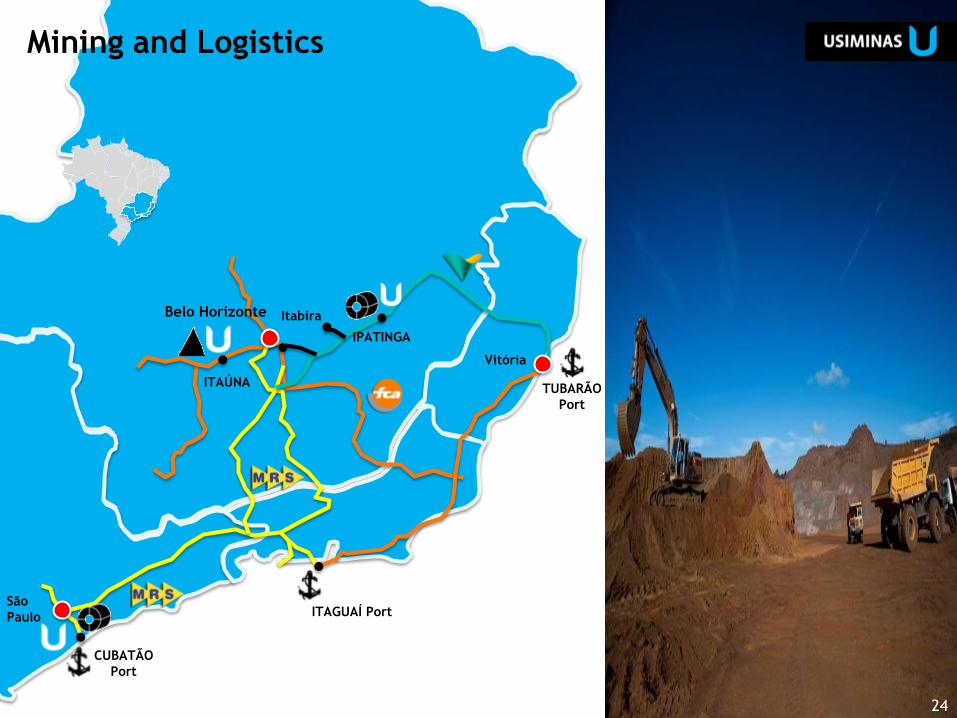
24
Belo Horizonte Itabira
IPATINGA
São
Paulo
ITAÚNA
Vitória
TUBARÃO
Port
ITAGUAÍ Port
CUBATÃO
Port
Mining and Logistics
24
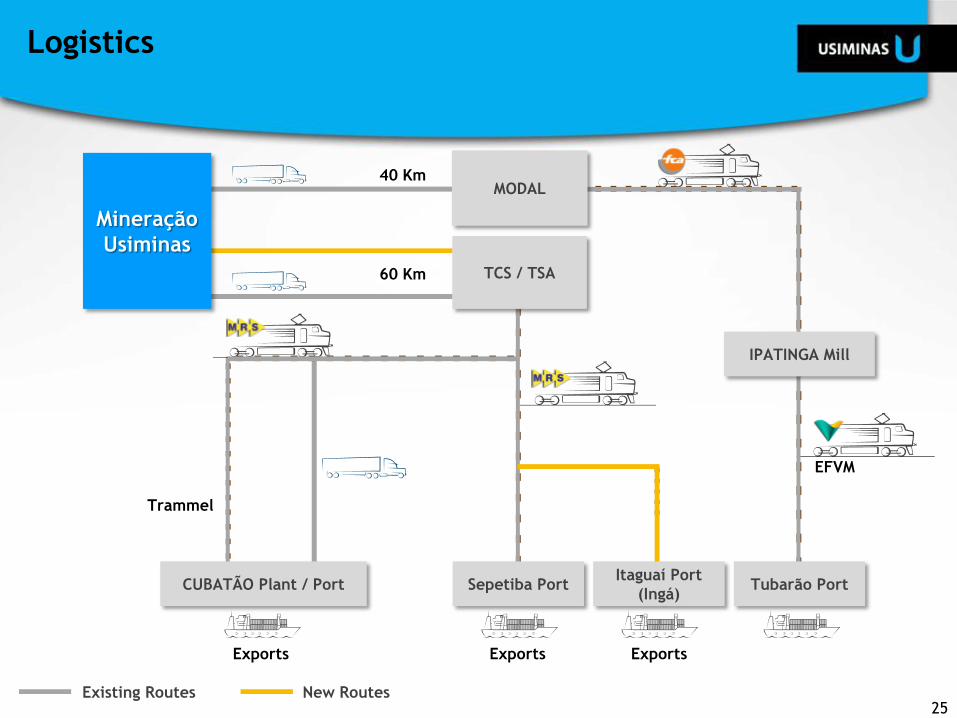
Tubarão Port Itaguaí Port
(Ingá)
MODAL
Mineração
Usiminas
EFVM
Existing Routes
CUBATÃO Plant / Port
New Routes
TCS / TSA
Trammel
Sepetiba Port
Exports Exports Exports
40 Km
60 Km
IPATINGA Mill
Logistics
25
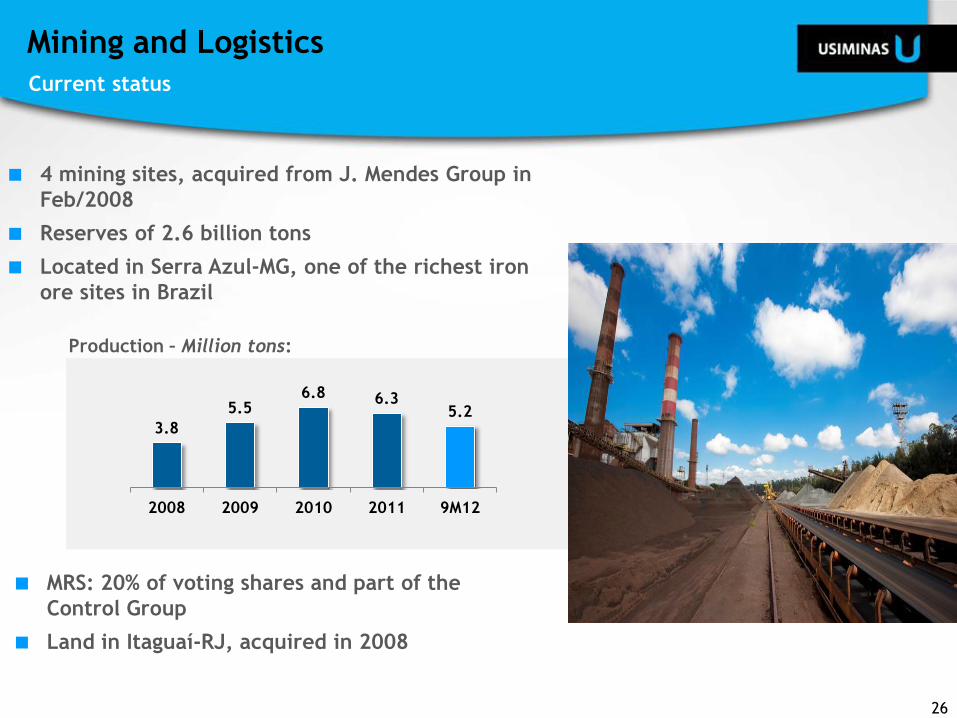
4 mining sites, acquired from J. Mendes Group in
Feb/2008
Reserves of 2.6 billion tons
Located in Serra Azul-MG, one of the richest iron
ore sites in Brazil
MRS: 20% of voting shares and part of the
Control Group
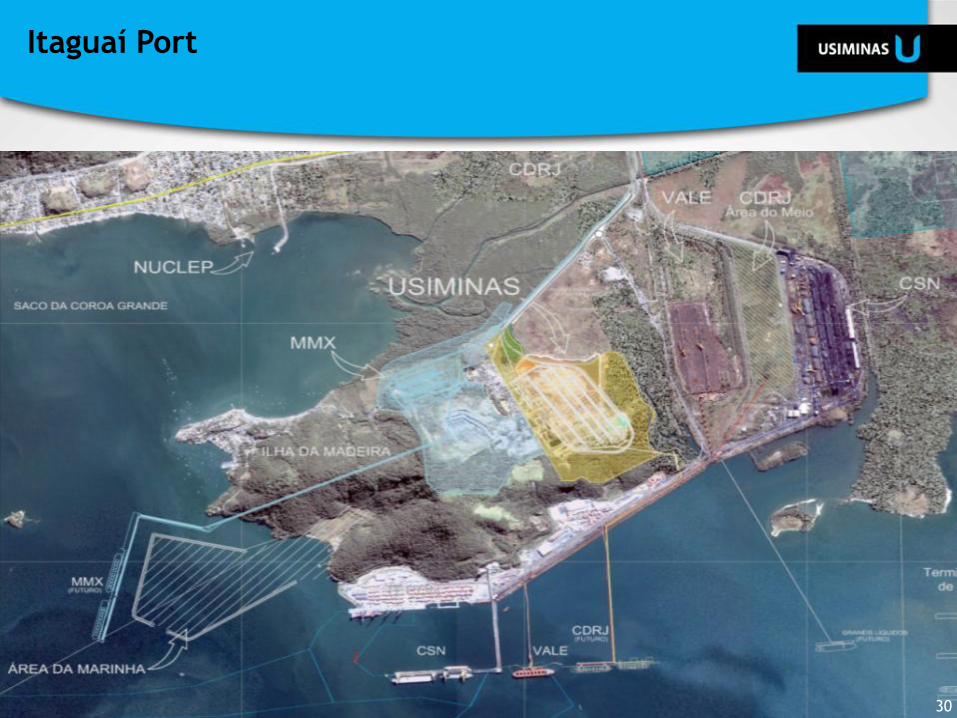
Land in Itaguaí-RJ, acquired in 2008
Production – Million tons:
3.8
5.5 6.8 6.3
5.2
2008 2009 2010 2011 9M12
Mining and Logistics
Current status
26
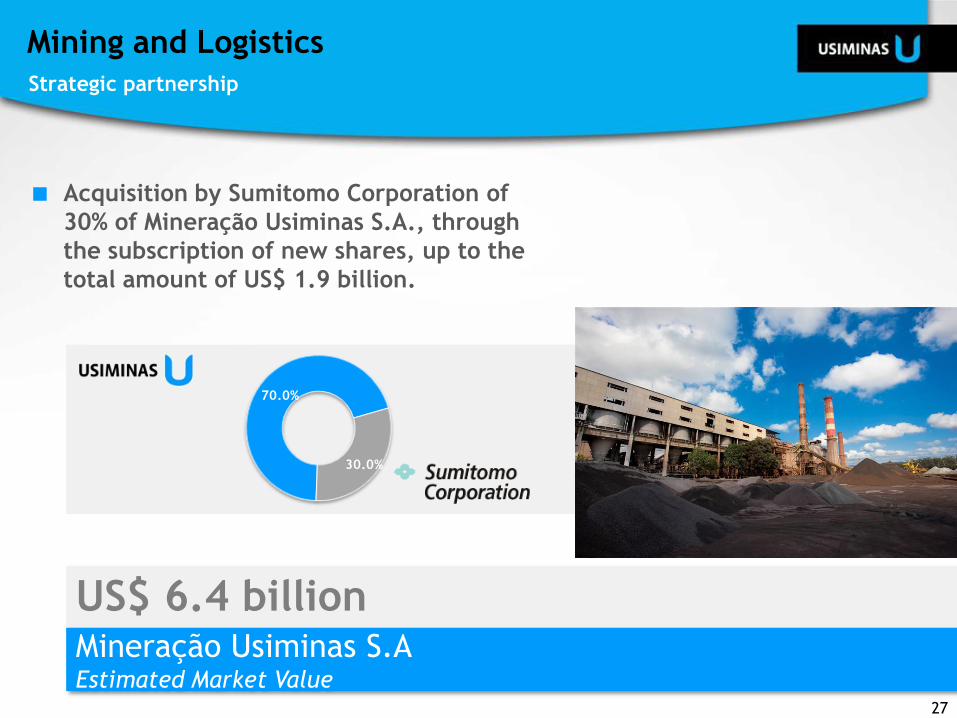
US$ 6.4 billion Mineração Usiminas S.A Estimated Market Value
Acquisition by Sumitomo Corporation of
30% of Mineração Usiminas S.A., through
the subscription of new shares, up to the
total amount of US$ 1.9 billion.
70.0%
30.0%
Mining and Logistics
Strategic partnership
27
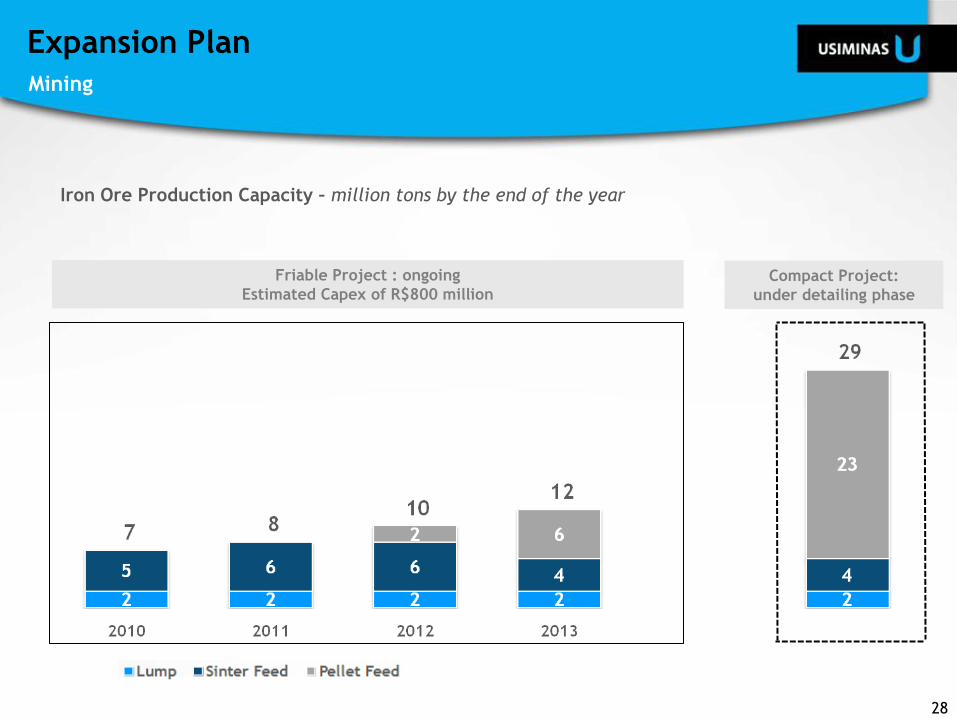
Iron Ore Production Capacity – million tons by the end of the year
Friable Project : ongoing
Estimated Capex of R$800 million Compact Project:
under detailing phase
Expansion Plan
Mining
28
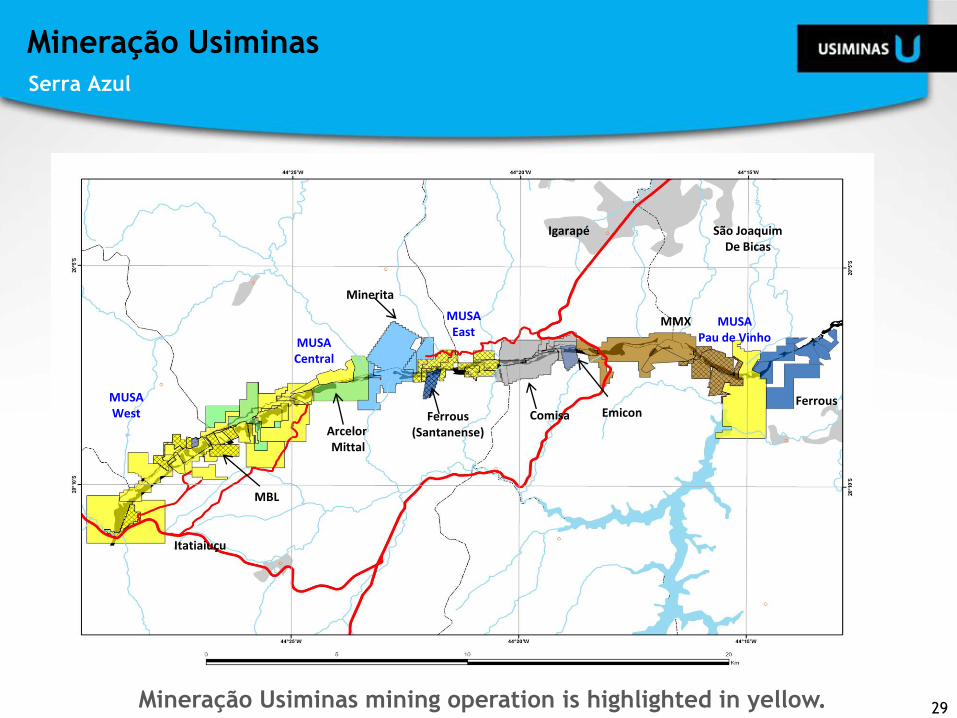
MBL
Arcelor Mittal
Ferrous (Santanense)
Comisa Emicon
MMX
Ferrous
MUSA Pau de Vinho
MUSA East
Minerita
MUSA Central
MUSA West
Itatiaiuçu
Igarapé São Joaquim De Bicas
Mineração Usiminas mining operation is highlighted in yellow.
Mineração Usiminas
Serra Azul
29
30
Itaguaí Port
30
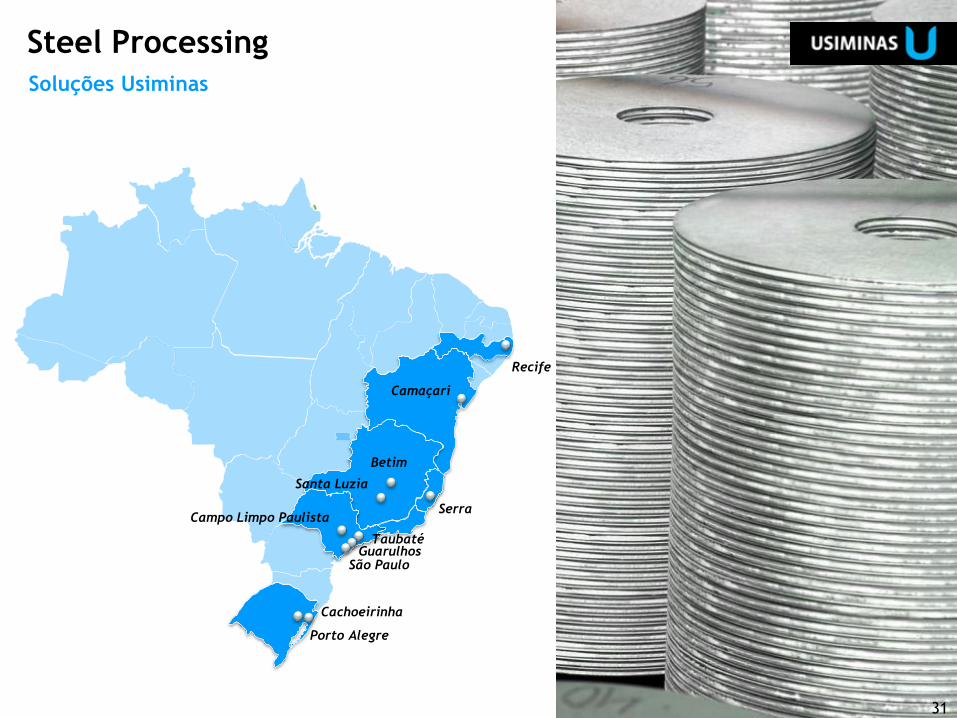
Camaçari
Cachoeirinha
Porto Alegre
Campo Limpo Paulista
São Paulo Guarulhos
Taubaté
Recife
Serra
Betim
Santa Luzia
Steel Processing
Soluções Usiminas
31
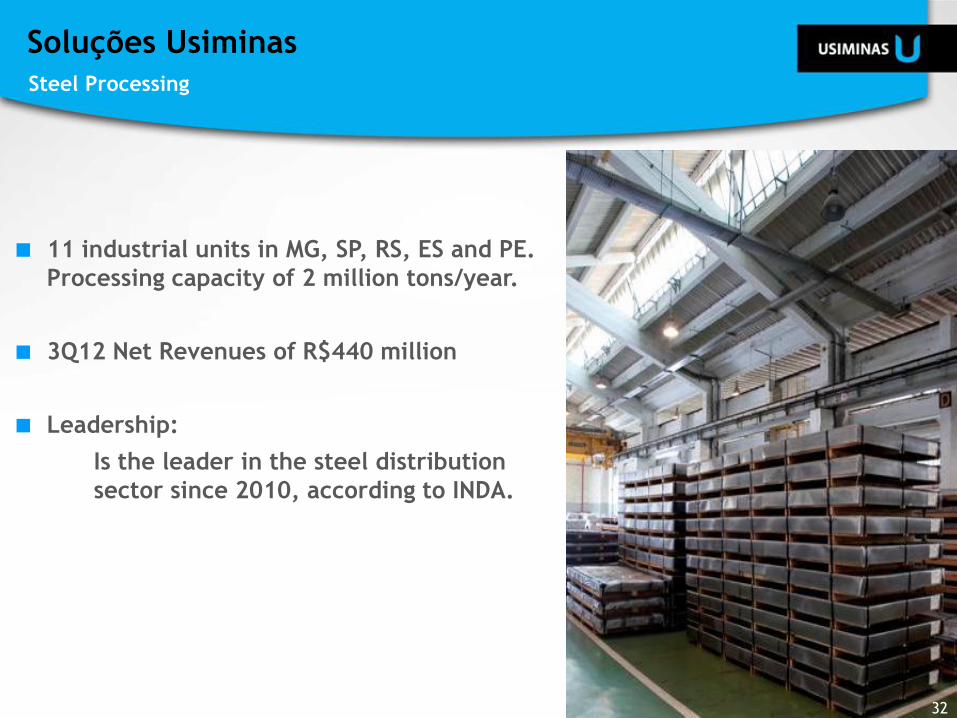
11 industrial units in MG, SP, RS, ES and PE.
Processing capacity of 2 million tons/year.
3Q12 Net Revenues of R$440 million
Leadership:
Is the leader in the steel distribution
sector since 2010, according to INDA.
Soluções Usiminas
Steel Processing
32
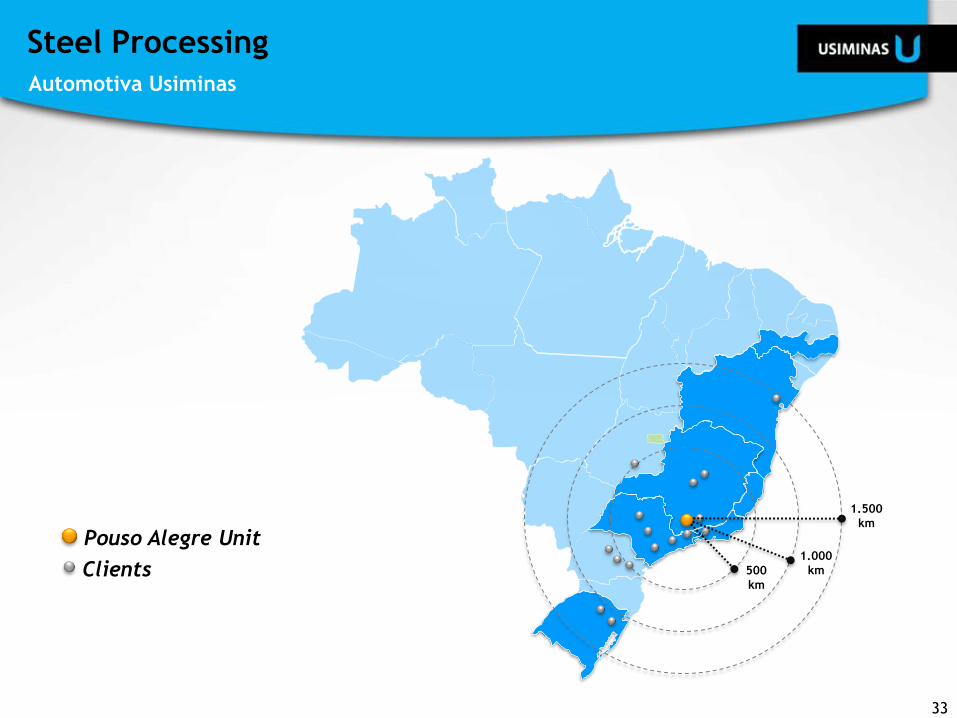
Clients 500
km
1.000
km
1.500
km
Pouso Alegre Unit
Steel Processing
33
Automotiva Usiminas
34
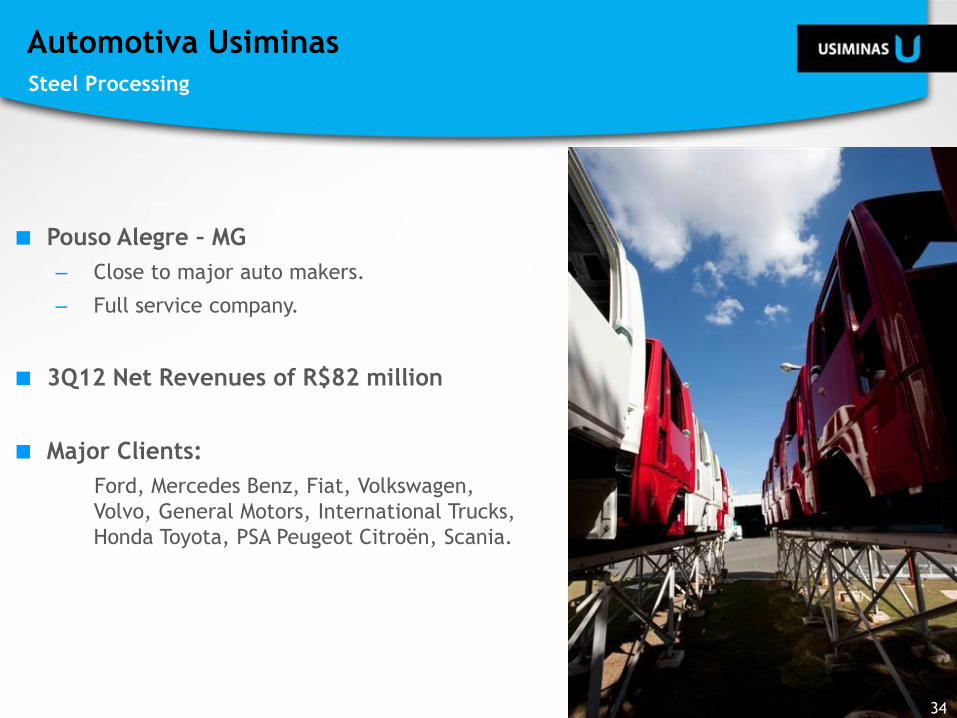
Pouso Alegre – MG
– Close to major auto makers.
– Full service company.
3Q12 Net Revenues of R$82 million
Major Clients:
Ford, Mercedes Benz, Fiat, Volkswagen,
Volvo, General Motors, International Trucks,
Honda Toyota, PSA Peugeot Citroën, Scania.
Automotiva Usiminas
Steel Processing
34
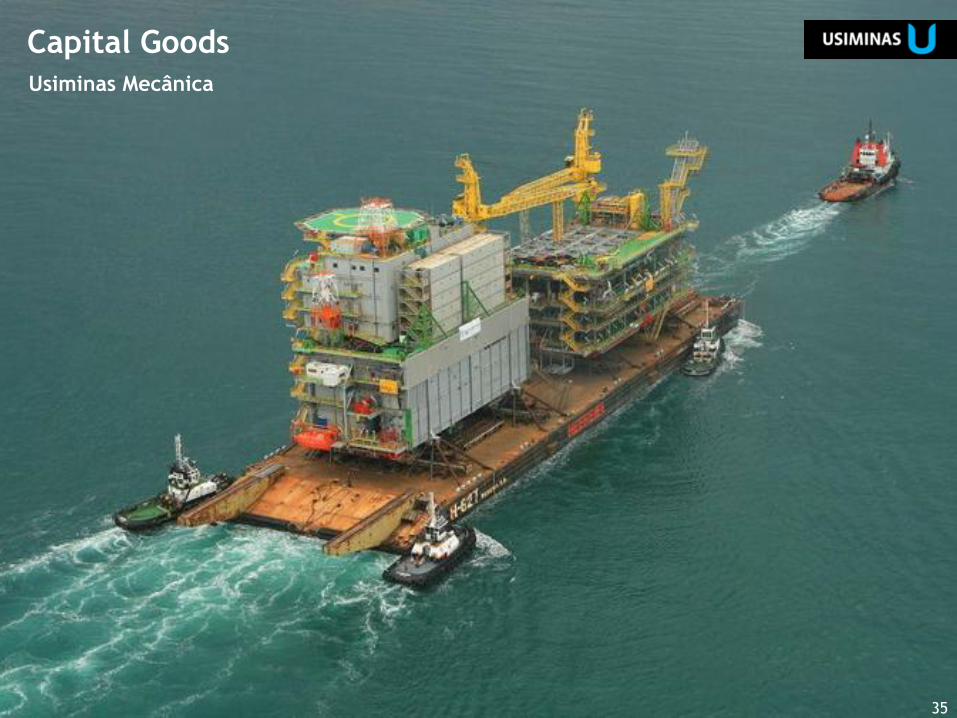
Capital Goods
35
Usiminas Mecânica
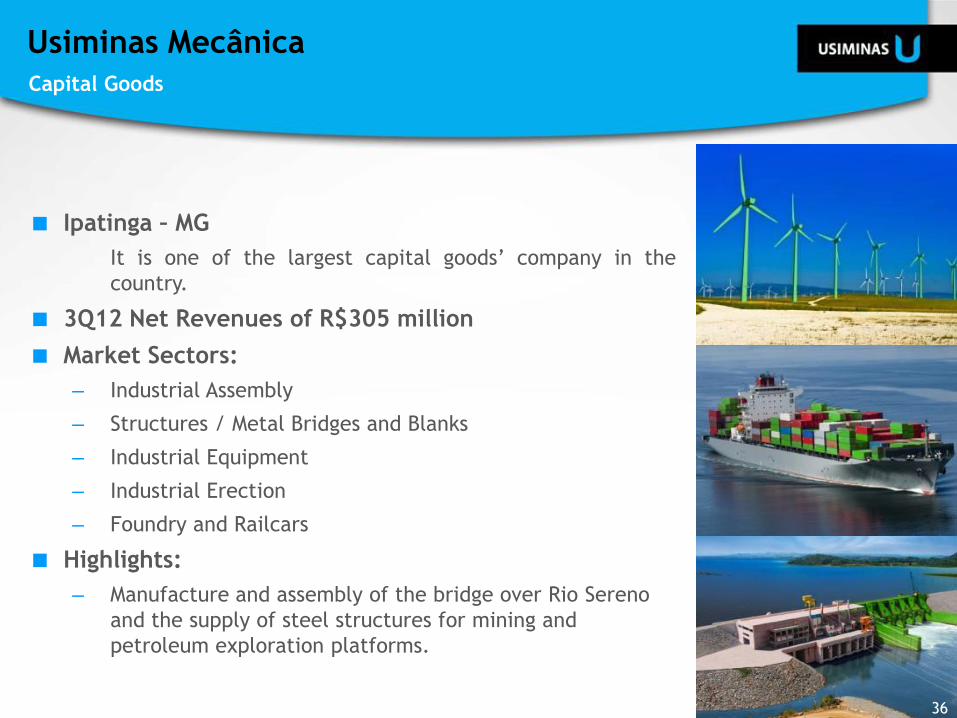
Ipatinga – MG
It is one of the largest capital goods’ company in the
country.
3Q12 Net Revenues of R$305 million
Market Sectors:
– Industrial Assembly
– Structures / Metal Bridges and Blanks
– Industrial Equipment
– Industrial Erection
– Foundry and Railcars
Highlights:
– Manufacture and assembly of the bridge over Rio Sereno
and the supply of steel structures for mining and
petroleum exploration platforms.
Usiminas Mecânica
Capital Goods
36
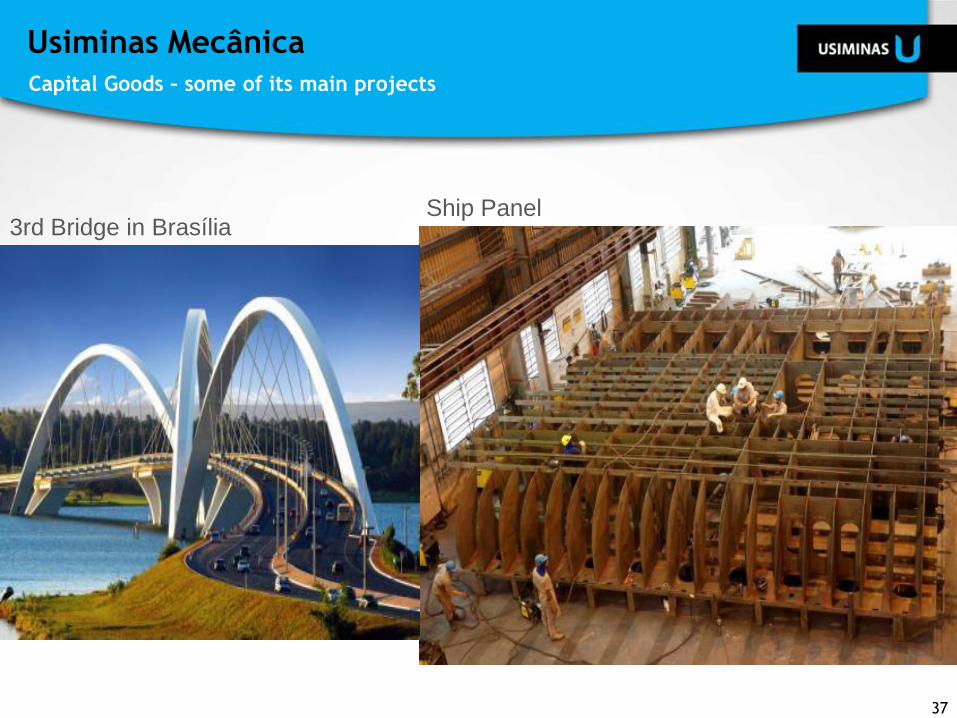
3rd Bridge in Brasília
Usiminas Mecânica
Capital Goods – some of its main projects
37
Ship Panel
Clique para
editar o texto
mestre
Usiminas and its
Business Units
Operational and
Financial
Highlights
Market
Overview
Agenda
38
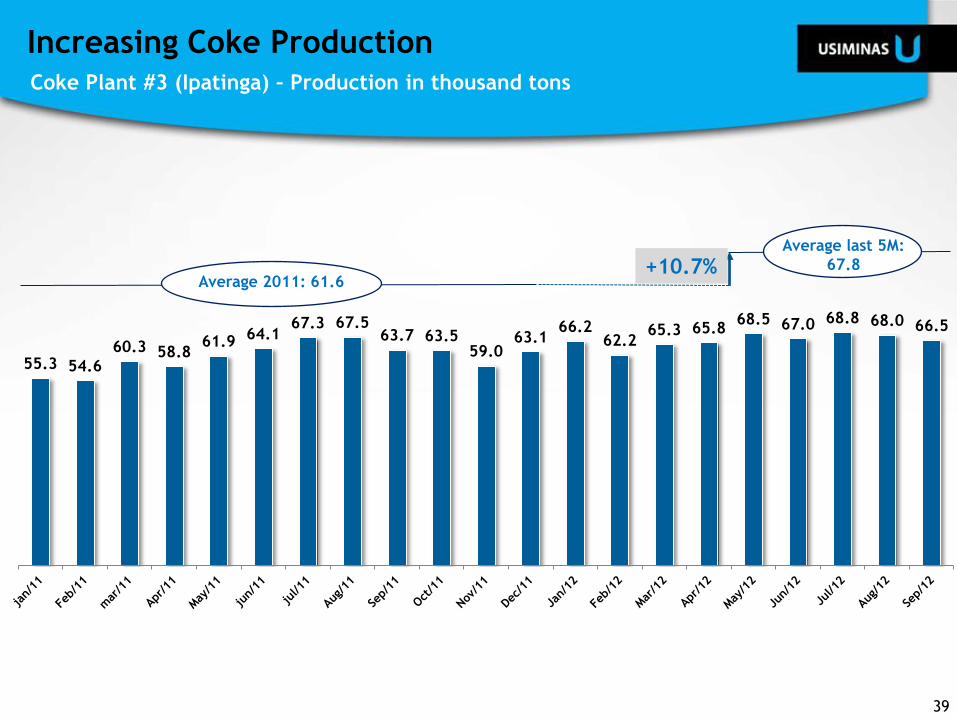
55.3 54.6
60.3 58.8 61.9 64.1
67.3 67.5 63.7 63.5
59.0 63.1
66.2 62.2
65.3 65.8 68.5 67.0 68.8 68.0 66.5
Average last 5M:
67.8
Increasing Coke Production Coke Plant #3 (Ipatinga) – Production in thousand tons
39
Average 2011: 61.6 +10.7%
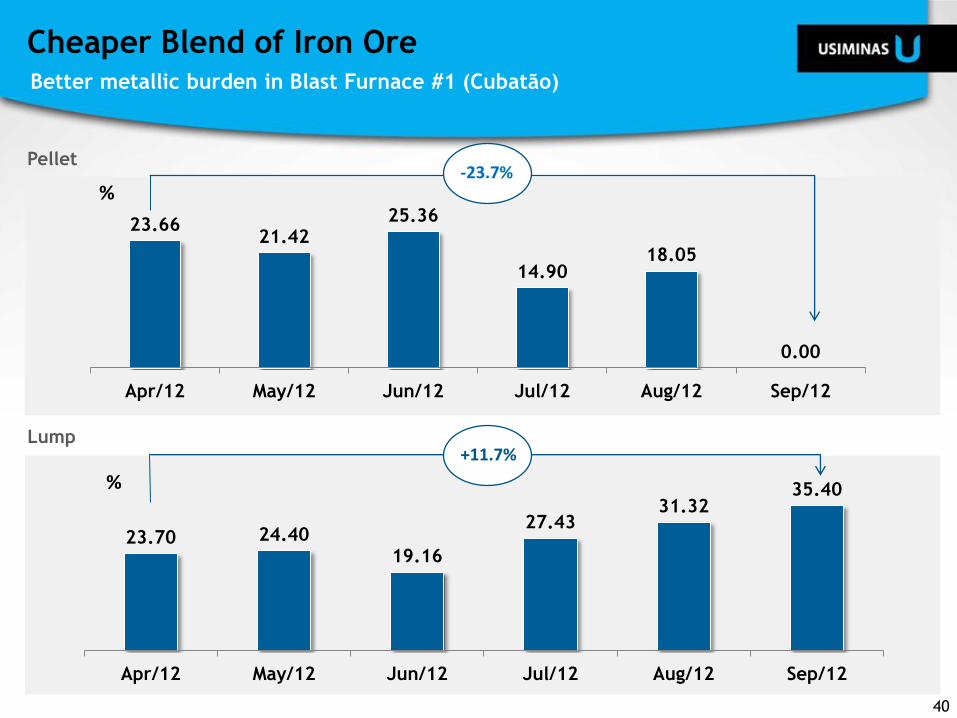
Lump
Pellet
23.66 21.42
25.36
14.90 18.05
0.00
Apr/12 May/12 Jun/12 Jul/12 Aug/12 Sep/12
%
23.70 24.40 19.16
27.43 31.32
35.40
Apr/12 May/12 Jun/12 Jul/12 Aug/12 Sep/12
%
-23.7%
+11.7%
40
Cheaper Blend of Iron Ore Better metallic burden in Blast Furnace #1 (Cubatão)
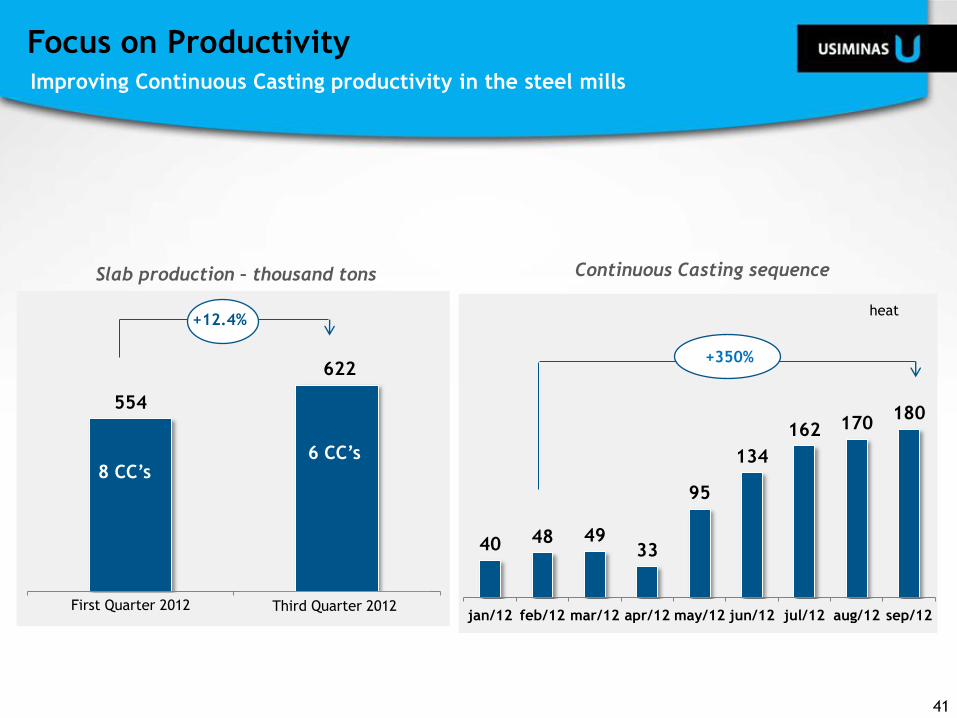
40 48 49 33
95
134
162 170 180
jan/12 feb/12 mar/12 apr/12 may/12 jun/12 jul/12 aug/12 sep/12
Slab production – thousand tons
heat
+350%
554
622
First Quarter 2012 Last two months 2012
8 CC’s 6 CC’s
+12.4%
Focus on Productivity Improving Continuous Casting productivity in the steel mills
41
Continuous Casting sequence
Third Quarter 2012
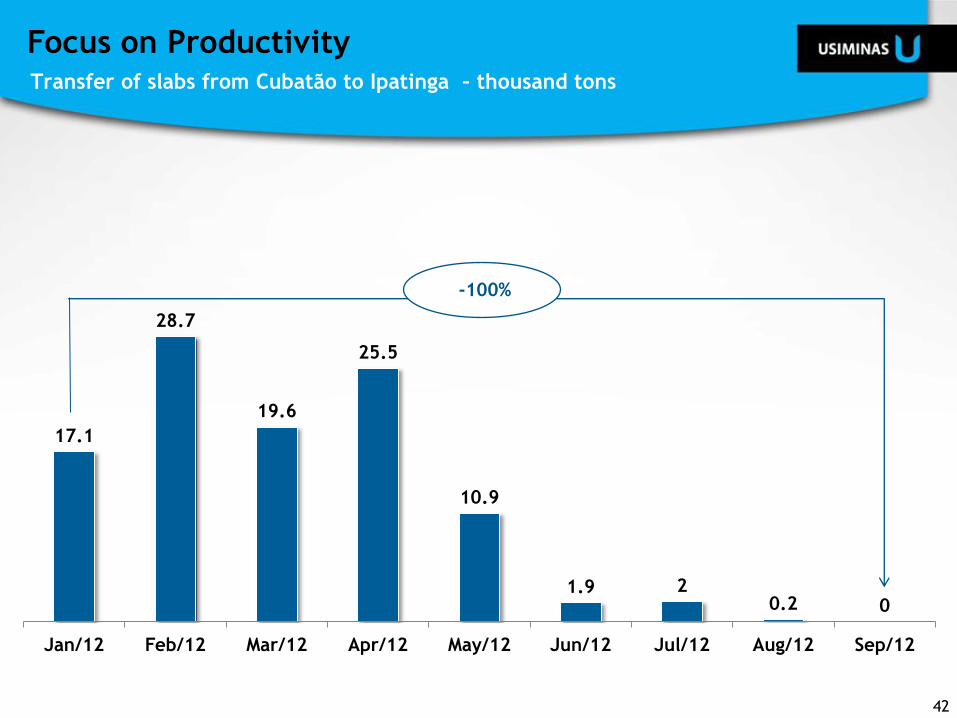
17.1
28.7
19.6
25.5
10.9
1.9 2 0.2 0
Jan/12 Feb/12 Mar/12 Apr/12 May/12 Jun/12 Jul/12 Aug/12 Sep/12
-100%
Transfer of slabs from Cubatão to Ipatinga – thousand tons
42
Focus on Productivity
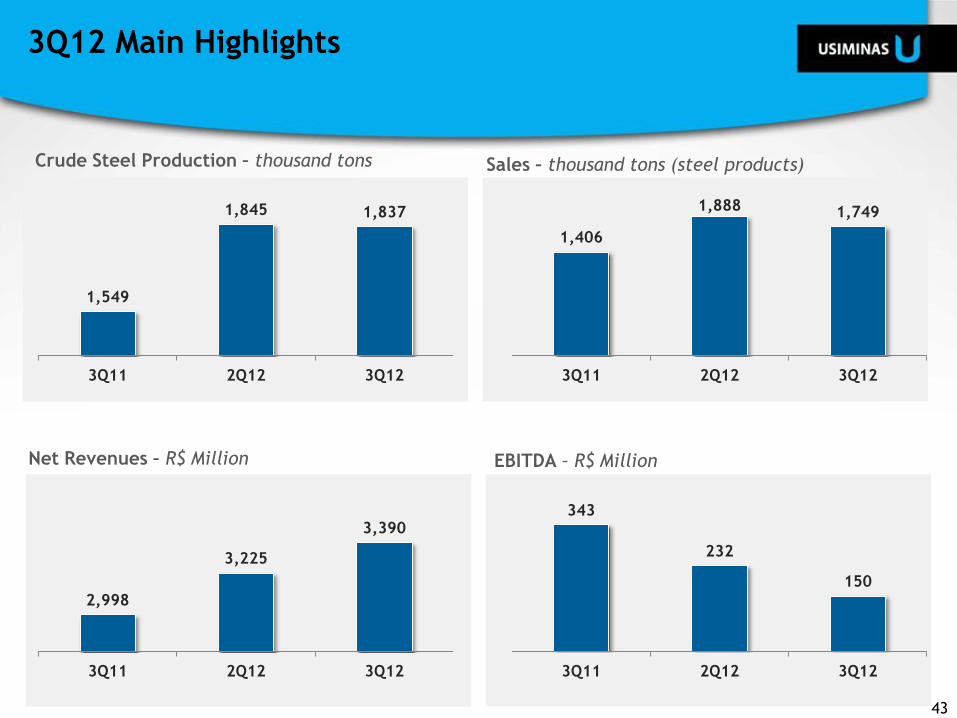
EBITDA – R$ Million
Sales – thousand tons (steel products)
Net Revenues – R$ Million
Crude Steel Production – thousand tons
3Q12 Main Highlights
1,549
1,845 1,837
3Q11 2Q12 3Q12
1,406
1,888 1,749
3Q11 2Q12 3Q12
2,998
3,225
3,390
3Q11 2Q12 3Q12
343
232
150
3Q11 2Q12 3Q12
43
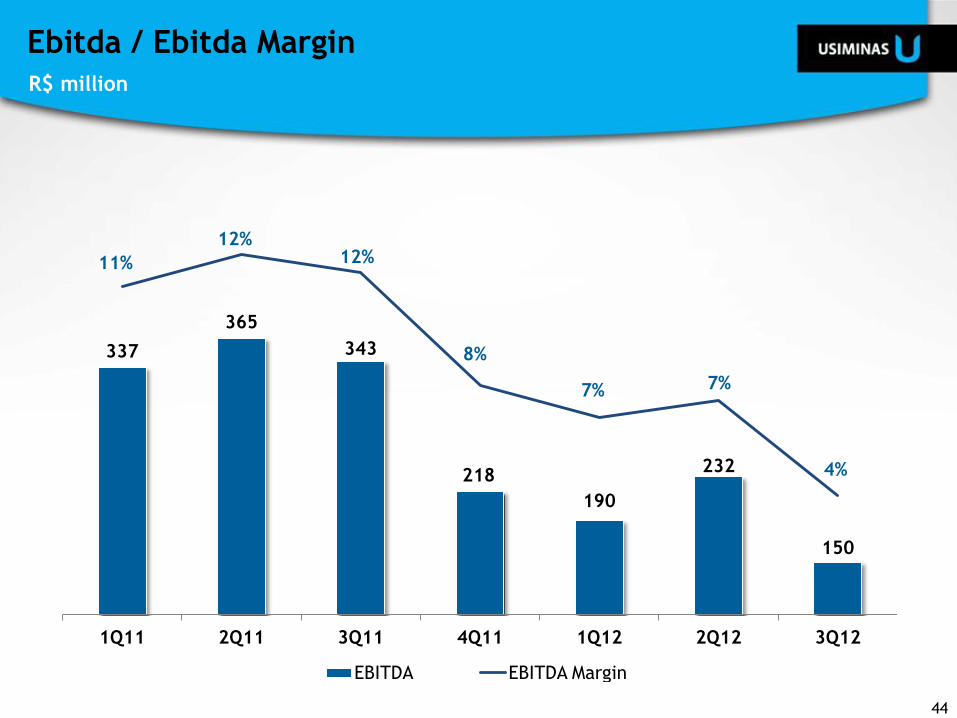
*IFRS
Ebitda / Ebitda Margin
R$ million
337
365
343
218
190
232
150
11%
12% 12%
8%
7% 7%
4%
1Q11 2Q11 3Q11 4Q11 1Q12 2Q12 3Q12
EBITDA EBITDA Margin
44
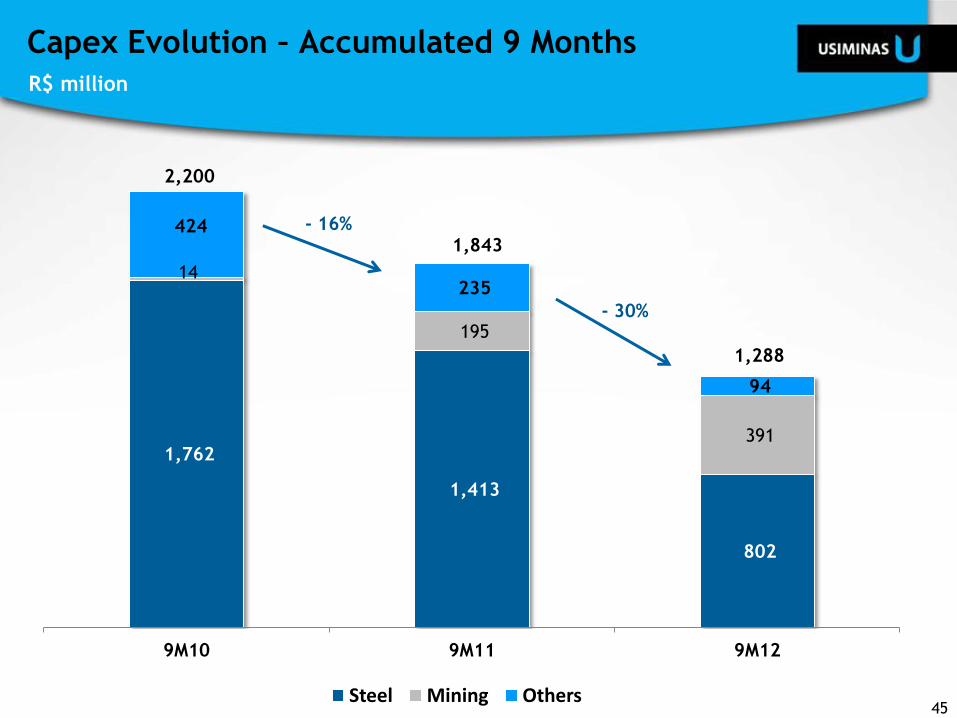
Capex Evolution – Accumulated 9 Months
R$ million
1,762
1,413
802
14
195
391
424
235
94
2,200
1,843
1,288
9M10 9M11 9M12
Steel Mining Others
- 16%
- 30%
45
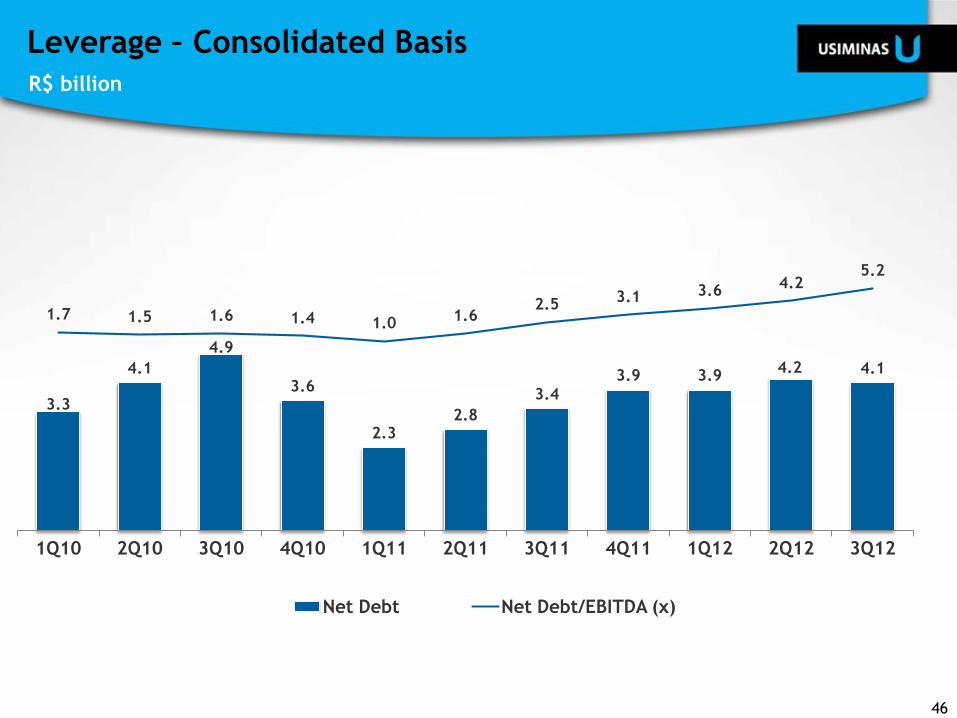
Leverage – Consolidated Basis
R$ billion
46
3.3
4.1
4.9
3.6
2.3 2.8
3.4
3.9 3.9 4.2 4.1
1.7 1.5 1.6 1.4 1.0 1.6 2.5 3.1 3.6 4.2
5.2
1Q10 2Q10 3Q10 4Q10 1Q11 2Q11 3Q11 4Q11 1Q12 2Q12 3Q12
Net Debt Net Debt/EBITDA (x)
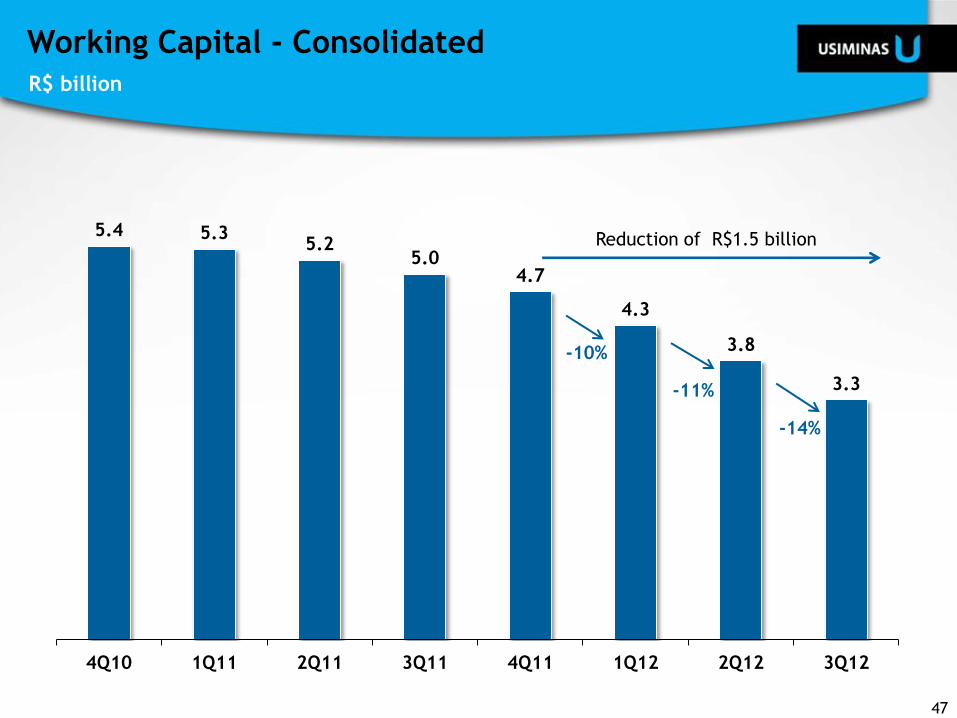
Working Capital - Consolidated
R$ billion
5.4 5.3 5.2
5.0 4.7
4.3
3.8
3.3
4Q10 1Q11 2Q11 3Q11 4Q11 1Q12 2Q12 3Q12
Reduction of R$1.5 billion
-14%
-11%
-10%
47
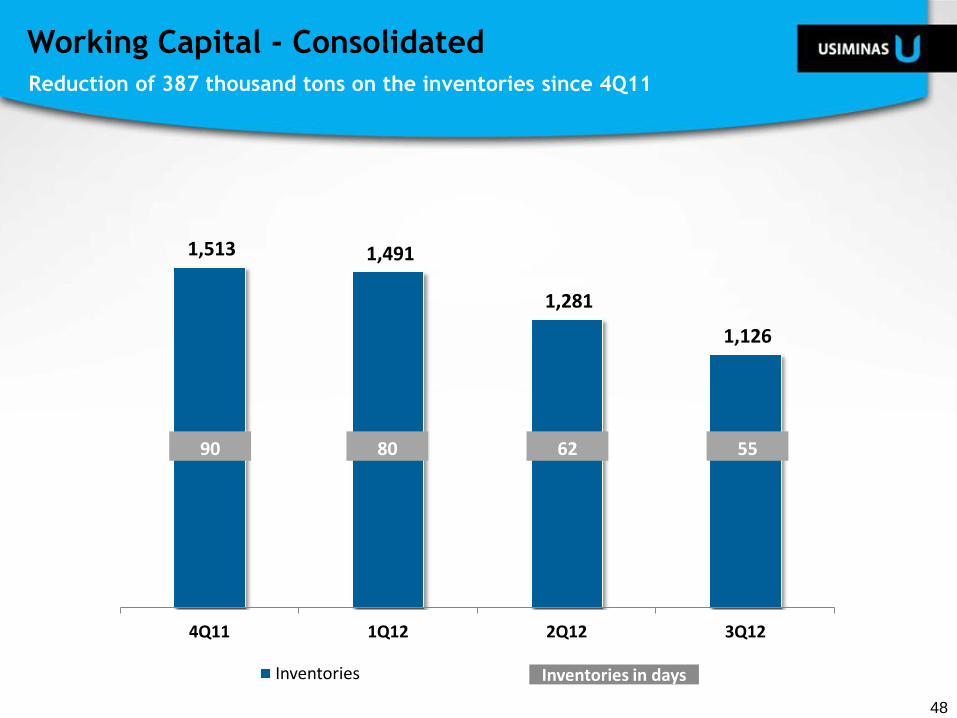
48
1,513 1,491
1,281
1,126
4Q11 1Q12 2Q12 3Q12
Inventories
90 80 62 55
Inventories in days
Working Capital - Consolidated
Reduction of 387 thousand tons on the inventories since 4Q11
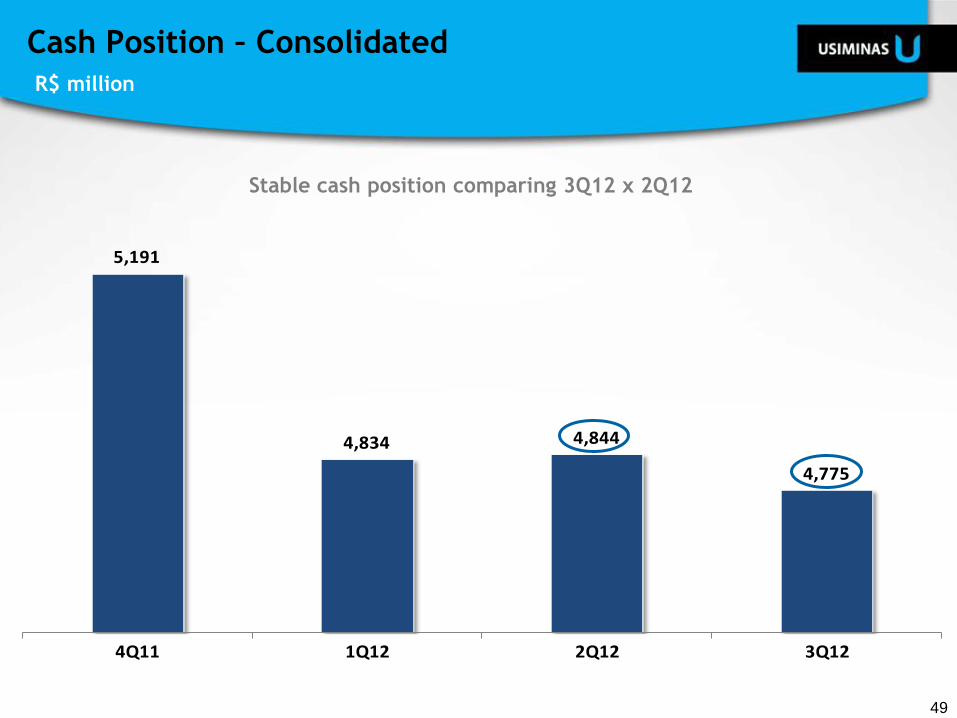
5,191
4,834 4,844
4,775
4Q11 1Q12 2Q12 3Q12
49
Cash Position – Consolidated
R$ million
Stable cash position comparing 3Q12 x 2Q12
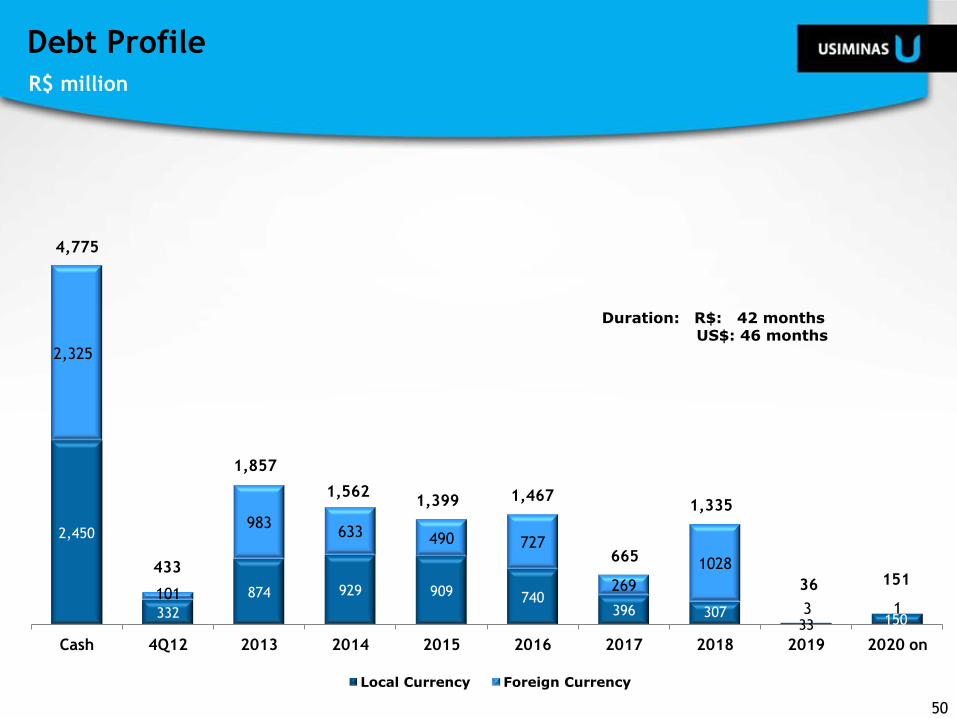
Debt Profile
R$ million
2,450
332
874 929 909 740 396 307
33 150
2,325
101
983 633 490 727
269
1028
3 1
Cash 4Q12 2013 2014 2015 2016 2017 2018 2019 2020 on
Local Currency Foreign Currency
433
4,775
1,857
1,562 1,467
665
1,335
151 36
1,399
Duration: R$: 42 months US$: 46 months
50
Cristina Morgan C. Drumond Head of IR
[email protected] Phone: 55-31-3499.8772
Fax: 55-31-3499.9357
www.usiminas.com/ri
ADR
Level I
Luciana Valadares dos Santos [email protected]
Phone: 55-31-3499.8619
Leonardo Karam Rosa [email protected]
Phone: 55-31-3499.8056
Diogo Dias Gonçalves [email protected]
Phone: 55-31-3499.8710
Declarations relative to business perspectives of the Company, operating and
financial results and projections, and references to the growth of the
Company, constitute mere forecasts and were based on Management’s
expectations in relation to future performance. These expectations are highly
dependent on market behavior, on Brazil’s economic situation, on the
industry and on international markets, and are therefore subject to change.