usgs sampling and analysis plan for 2 test water wells in pavillion, wy
DESCRIPTION
Report issued by the U.S. Geological Survey titled "Sampling and Analysis Plan for the Characterization of Groundwater Quality in Two Monitoring Wells near Pavillion, Wyoming". In June 2010, the U.S. Environmental Protection Agency installed two deep monitoring wells (MW01 and MW02) near Pavillion, Wyoming to study groundwater quality. The U.S Geological Survey, in cooperation with the Wyoming Department of Environmental Quality, designed a plan to collect groundwater data from these monitoring wells. This sampling and analysis plan describes the sampling equipment that will be used, well purging strategy, purge water disposal, sample collection and processing, field and laboratory sample analysis, equipment decontamination, and quality-assurance and quality-control procedures.TRANSCRIPT

Prepared in cooperation with the Wyoming Department of Environmental Quality
Sampling and Analysis Plan for the Characterization of Groundwater Quality in Two Monitoring Wells near Pavillion, Wyoming
Open-File Report 2012–1197
U.S. Department of the Interior U.S. Geological Survey

Sampling and Analysis Plan for the Characterization of Groundwater Quality in Two Monitoring Wells near Pavillion, Wyoming
By Peter R. Wright and Peter B. McMahon
Prepared in cooperation with the Wyoming Department of Environmental Quality
Open-File Report 2012–1197
U.S. Department of the Interior U.S. Geological Survey

U.S. Department of the Interior KEN SALAZAR, Secretary
U.S. Geological Survey Marcia K. McNutt, Director
U.S. Geological Survey, Reston, Virginia: 2012
For product and ordering information: World Wide Web: http://www.usgs.gov/pubprod Telephone: 1-888-ASK-USGS
For more information on the USGS—the Federal source for science about the Earth, its natural and living resources, natural hazards, and the environment: World Wide Web: http://www.usgs.gov Telephone: 1-888-ASK-USGS
Suggested citation: Wright, P.R., and McMahon, P.B., 2012, Sampling and analysis plan for the characterization of groundwater quality in two monitoring wells near Pavillion, Wyoming: U.S. Geological Survey Open-File Report 2012–1197, 90 p.
Any use of trade, product, or firm names is for descriptive purposes only and does not imply endorsement by the U.S. Government.
Although this report is in the public domain, permission must be secured from the individual copyright owners to reproduce any copyrighted material contained within this report.

iv
Contents
Abstract ......................................................................................................................................................................... 1 Introduction .................................................................................................................................................................... 1
Purpose and Scope ................................................................................................................................................... 1 Study Area ................................................................................................................................................................. 2 Background ................................................................................................................................................................ 2 Study Approach ......................................................................................................................................................... 4 Study Organization and Responsibilities .................................................................................................................... 4
Sampling and Analysis Plan .......................................................................................................................................... 4 Documentation ........................................................................................................................................................... 5 Groundwater-Quality Sampling Procedures ............................................................................................................... 6
Preparation ............................................................................................................................................................. 6 Water-Level Measurement ..................................................................................................................................... 7 Instrument Calibration ............................................................................................................................................ 8 Well Purge .............................................................................................................................................................. 8
Well MW01 ......................................................................................................................................................... 9 Well-Purging Procedures ................................................................................................................................ 9
Well MW02 ........................................................................................................................................................11 Sample Collection, Analysis, and Processing ........................................................................................................13 Decontamination ...................................................................................................................................................16
Chain of Custody and Documentation Requirements ...................................................................................................18 Field Logbooks and Other Documentation ................................................................................................................18 Sample Container Labels ..........................................................................................................................................19 Transfer of Custody and Sample Shipment ..............................................................................................................19 Sample Packaging ....................................................................................................................................................20
Quality Assurance and Quality Control .........................................................................................................................20 U.S. Geological Survey Quality-Assurance Program ................................................................................................21 Field Quality Control .................................................................................................................................................22 Laboratory Quality Control ........................................................................................................................................24 Data Management and Reporting .............................................................................................................................24 Data Review ..............................................................................................................................................................24
Health and Safety .........................................................................................................................................................25 References Cited ..........................................................................................................................................................26 Appendix A. Table of chemical analytes, laboratory methods, and laboratory quantitation limits .................................45 Appendix B. Method detection limits and method reporting levels of selected compounds identified by U.S.
Environmental Protection Agency (USEPA) as affecting geochemistry in deep groundwater monitoring wells near Pavillion, Wyoming ..........................................................................................................................................59
Appendix C. Field forms. ..............................................................................................................................................60 Appendix D. List of Groundwater Sampling Equipment and Supplies ..........................................................................78 Appendix E. Job Hazard Analysis .................................................................................................................................79 Appendix F. USGS Central Region Research Drilling Chief’s Project Log for Redevelopment of MW02 .....................87

v
Figures Figure 1. Location of monitoring wells MW01 and MW02 near the town of Pavillion, Wyoming ............................... 3 Figure 2. Cleaning procedures for sampling equipment used to collect samples for analysis of inorganic
and organic constituents ..................................................................................................................... 17 Figure 3. Cleaning procedures for silicon tubing used to collect samples for analysis of inorganic constituents .... 18 Figure 4. Example of a sample container label. ...................................................................................................... 19
Tables Table 1. List of agencies and organizations participating with the technical team and organizational
responsibilities during this study. ......................................................................................................... 31 Table 2. Key organizational responsibilities of on-site personnel. ......................................................................... 31 Table 3. Laboratory analytical methods, approaches, and method references ...................................................... 32 Table 4. List of age dating analytes the U. S. Geological Survey added to sampling that the U.S.
Environmental Protection Agency has not collected and an explanation of their use .......................... 35 Table 5. Water-quality property stabilization criteria and calibration guidelines. .................................................... 37 Table 6. Well-yield data for well MW02 .................................................................................................................. 37 Table 7. Analytical laboratories, laboratory schedules and codes, and applicable field collection and
processing information ........................................................................................................................ 38 Table 8. Schedule for collection of quality-control samples (per sample set) ........................................................ 42 Table 9. Proposed analytical laboratories and contact information ........................................................................ 43 Table 10. Summary of laboratory quality-assurance/quality-control requirements ................................................... 44

vi
Conversion Factors Inch/Pound to SI
Multiply By To obtain Length
inch (in.) 2.54 centimeter (cm)
inch (in.) 25.4 millimeter (mm)
inch (in.) 25,400 micron (µm)
foot (ft) 0.3048 meter (m)
mile (mi) 1.609 Kilometer (km)
Volume ounce, fluid (fl. oz) 0.02957 liter (L)
ounce, fluid (fl. oz) 29.57 milliliter (mL)
gallon (gal) 3.785 liter (L)
gallon (gal) 0.003785 cubic meter (m3)
gallon (gal) 3.785 cubic decimeter (dm3)
Flow rate gallon per minute (gal/min) 0.06309 liter per second (L/s)
gallon per hour (gal/h) 3.785 liter per hour (L/h) Temperature in degrees Celsius (°C) may be converted to degrees Fahrenheit (°F) as follows: °F=(1.8×°C)+32 Horizontal coordinate information is referenced to the North American Datum of 1983 (NAD 83). Specific conductance is given in microsiemens per centimeter at 25 degrees Celsius (µS/cm at 25°C). Concentrations of chemical constituents in water are given either in milligrams per liter (mg/L) or micrograms per liter (µg/L).

vii
Abbreviations and Acronyms > greater than < less than ≤ less than or equal to ± plus or minus ASR Analytical Services Request (U.S. Geological Survey) bls below land surface BQS Branch of Quality Systems (U.S. Geological Survey) δ13C DIC ratio of carbon-13 to carbon-12 in dissolved inorganic carbon relative to the ratio in a reference
standard 14C carbon-14 CoC chain of custody E estimated e-tape electronic water-level indicator GWSI Groundwater Site Inventory (U.S. Geological Survey) GRO gasoline range organics δ2H ratio of hydrogen-2 to hydrogen-1 relative to a reference standard JHA Job Hazard Analysis (U.S. Geological Survey) LRL laboratory reporting level MDL method detection limit MDT Mountain Daylight Time MP measuring point MST Mountain Standard Time NFQA National Field Quality Assurance Program (U.S. Geological Survey) NWIS National Water Information System (U.S. Geological Survey) NWISWeb National Water Information System Web interface (U.S. Geological Survey) NWQL National Water Quality Laboratory (U.S. Geological Survey) δ18O ratio of oxygen-18 to oxygen-16 relative to a reference standard QAPP Quality Assurance Project Plan (U.S. Environmental Protection Agency) QA/QC quality assurance/quality control QC quality control SAP sampling and analysis plan (U.S. Geological Survey) TAL TestAmerica Laboratories TIC tentatively identified compound TNI The NELAC Institute USEPA U.S. Environmental Protection Agency USGS U.S. Geological Survey V value could be affected by contamination VOC volatile organic compound WYDEQ Wyoming Department of Environmental Quality WYWSC Wyoming Water Science Center (U.S. Geological Survey)
1
Sampling and Analysis Plan for the Characterization of Groundwater Quality in Two Monitoring Wells near Pavillion, Wyoming
By Peter R. Wright and Peter B. McMahon
Abstract In June 2010, the U.S. Environmental Protection Agency installed two deep monitoring wells
(MW01 and MW02) near Pavillion, Wyoming to study groundwater quality. The U.S Geological Survey, in cooperation with the Wyoming Department of Environmental Quality, designed a plan to collect groundwater data from these monitoring wells. This sampling and analysis plan describes the sampling equipment that will be used, well purging strategy, purge water disposal, sample collection and processing, field and laboratory sample analysis, equipment decontamination, and quality-assurance and quality-control procedures.
Introduction On December 8, 2011, the U.S. Environmental Protection Agency (USEPA) released the draft
report Investigation of Ground Water Contamination near Pavillion, Wyoming (U.S. Environmental Protection Agency, 2011a) for public review. The draft report describes the analysis of data collected from 2009 to 2011 during an investigation of groundwater near Pavillion, Wyoming, and indicates that groundwater may contain compounds associated with gas production practices. In discussions with the State of Wyoming, the U.S. Geological Survey (USGS), in cooperation with the Wyoming Department of Environmental Quality (WDEQ), agreed to collect additional groundwater-quality data from two USEPA monitoring wells for public dissemination in 2012 and to design a plan for the data collection effort. The data collection effort will proceed only if authorization to access and sample the wells is granted by USEPA and the individual landowners on whose land the wells are located. The purpose of this data collection effort is to provide an independent perspective of the quality of groundwater pumped from two USEPA monitoring wells located near Pavillion, Wyoming. It is anticipated that this data collection effort may become part of a larger groundwater-quality assessment of the Pavillion area.
Purpose and Scope The purpose of this report is to present the USGS sampling and analysis plan (SAP) for the
characterization of groundwater quality in two monitoring wells near Pavillion, Wyoming. As agreed to by USGS and the WYDEQ, this SAP relies on the standard operating policies and procedures of the USGS, specifically, the USGS National Field Manual for the Collection of Water-Quality Data (U.S. Geological Survey, variously dated; “Field Manual”). This SAP defines the standard operating procedures to be used for the collection and processing of groundwater-quality samples pumped from two USEPA monitoring wells near Pavillion, Wyoming. Standard procedures described in this document ensure samples collected in the field and analyzed by the laboratory meet the data needs described herein. This report describes documentation, sampling equipment that will be used, well

2
purging strategy, purge water disposal, sample collection, sample processing, field and laboratory sample analysis, equipment decontamination, and quality-assurance and quality-control (QA/QC) procedures. This report also contains information related to data management, review, and publication, as well as health and safety concerns and procedures.
Study Area The study area is located in west-central Wyoming near the town of Pavillion (fig. 1), which has
a population of 231 people (U.S. Census Bureau, 2010). The local school district is housed in the town of Pavillion. The surrounding agricultural area is sparsely populated and primarily composed of large-acreage irrigated farms. Natural gas development began in the area northeast of Pavillion in the early 1960s, was further developed in the 1980s, and in recent years has been developed by a succession of owner operators. The town of Pavillion and rural households in the area all produce their water supply from wells installed in the Tertiary-age Wind River Formation (James Gores and Associates, 2011).
Background In September 2008, the USEPA initiated a groundwater investigation in response to concerns
from domestic well owners near the town of Pavillion, Wyoming. Well owners complained of changes in well-water taste and odor following hydraulic fracturing at nearby gas production wells. The USEPA investigation, initiated under authority of the Comprehensive Environmental Response, Compensation, and Liability Act (enacted by congress in 1980), included four sampling events (phases I–IV). A brief chronology of USEPA sampling events follows. A detailed sampling chronology is included in the USEPA draft report (U.S. Environmental Protection Agency, 2011a).
During phases I (March 2009) and II (January 2010), methane and diesel-range organics were detected in water from deep domestic wells prompting USEPA to add a new phase. During phase III, USEPA installed “2 deep monitoring wells screened at 233 – 239 meters (MW01) and 293 – 299 meters (MW02) below ground surface, respectively” (765 – 785 feet and 960 – 980 feet, respectively) during June and July 2010 to evaluate these and other constituents in groundwater in the Pavillion area (U.S. Environmental Protection Agency, 2011a, p. xi). Phase III included the sampling of wells MW01 and MW02 (fig. 1). USEPA collected gas (September 2010) and groundwater-quality samples (October 2010) from these wells. During the last sampling event (phase IV, April 2011), wells MW01 and MW02 were resampled to compare with earlier analytical results and expand the analyte list. The USEPA concluded that the groundwater geochemistry in water from wells MW01 and MW02 is distinctive from that of nearby domestic wells (U.S. Environmental Protection Agency, 2011a). For example, the pH measured in water from wells MW01 and MW02 is elevated (11.2–12.0) in comparison to pH measured by USEPA in water from domestic wells (6.9–10.5) (U.S. Environmental Protection Agency, 2011a, Table A1 and A2a.) and to the pH range of 5.3 to 10.0 previously reported for the Wind River Formation (Plafcan and others, 1995). Groundwater-quality results for USEPA phases I through IV are available in the USEPA draft report (U.S. Environmental Protection Agency, 2011a).
According to the USEPA, monitoring wells MW01 and MW02 were installed using primarily mud rotary drilling with blowout prevention. Both wells were screened with 20 ft of 8.5-inch (in.) outside diameter, 4-in. inside diameter prepacked 0.020 slot stainless steel screen and completed to approximately 3.5 ft above the ground surface with 4-in. inside diameter, threaded and coupled, black painted/coated carbon steel casing (figures 6a and 6b in U.S. Environmental Protection Agency, 2011a). Portland cement was used to grout each well from the top of the well screen to land surface. A dedicated submersible 3-horsepower (hp) pump was installed in each well. (U.S. Environmental Protection Agency, 2011a).

3
Figure 1. Location of monitoring wells MW01 and MW02 near the town of Pavillion, Wyoming.

4
Study Approach The approach of this characterization of groundwater quality is to:
• Collect a representative groundwater-quality sample from each of two USEPA monitoring wells and collect quality-control samples using standard USGS sampling protocols;
• Analyze samples collected from each well and quality-control samples for a list of analytes that replicates the USEPA analyte list and uses USEPA-approved methods to the extent possible, including constituents of interest to the State of Wyoming and USGS;
• Review analytical results for environmental and quality-control samples; • Distribute approved environmental results to the public using the USGS National Water
Information System (NWIS) Web interface (NWISWeb), accessible at http://waterdata.usgs.gov/wy/nwis/qw and provide results to Wyoming Department of Environmental Quality (WDEQ); and
• Prepare a USGS Open-File Report describing the sampling and analysis plan that includes data collection, analytical methods, QA/QC procedures, and quality control and analytical results.
Groundwater samples will be collected soon after applicable sections of this SAP have been approved by the Director of the USGS Wyoming Water Science Center (WYWSC) in spring 2012. The USGS will attempt to collect a representative groundwater-quality sample that will include both whole water and filtered water. Sample processing will include filtering with a disposable 0.45-micron filter and addition of preservation additives (such as nitric acid) required for the analytical schedules specified. After all data have been quality reviewed, the approved quantitative water-quality data will be made available to the public through a peer reviewed USGS Data Series Report and NWISWeb.
Study Organization and Responsibilities The study of groundwater quality in two USEPA monitoring wells is the responsibility of the
USGS in cooperation with the State of Wyoming. Several government agencies and organizations have interest in the data being collected during this study. For this reason, a multi-agency technical team was formed to provide the USGS with technical advice during the compilation of this SAP. The agencies and organizations involved with this study, including organizations participating with the technical team, are listed in table 1.
The roles and responsibilities for key on-site personnel involved in this study are listed in table 2. These personnel may be replaced with appropriately qualified personnel, if necessary. The project chief is responsible for ensuring that personnel who do the sample collection have appropriate groundwater-quality training and are cognizant of on-site safety considerations.
Sampling and Analysis Plan Groundwater data will be collected in association with the two USEPA monitoring wells (MW01
and MW02) installed for the USEPA Pavillion, Wyo. groundwater investigation. USEPA scientists will be on-site to collect samples and to assist USGS scientists with well access, pump operation, and collection of split samples. USGS scientists will collect samples to be analyzed for a full suite of target analytes (table 3). Laboratories will be requested to report tentatively identified compounds (TICs) while performing some organic analyses. TICs are compounds detected during analytical testing that are not part of the standard suite of reported analytes and would require additional analytical testing to confirm their presence and quantify their concentration in the sample. TIC analyses provide a qualitative

5
measure of the presence of compounds, and TIC data can be included in reports with sufficient documentation, but will not be stored in the USGS NWIS database. A sufficient number of sample bottles will be collected so that both USGS (including USGS contract laboratories) and USEPA laboratories can perform analyses. This allows for a direct comparison of analytical results without having to qualify differences that could be attributed to different sampling dates.
Several laboratory analyses performed by the USEPA for samples from the deep monitoring wells will not be performed by the USGS because USGS does not have the analytical method available in-house or through contract laboratories such as TestAmerica Laboratories (TAL). These analytes are highlighted in appendixes A and B. Similarly, the laboratories and methods available to USGS do not always provide detection and reporting limits that match USEPA methods. These differences also are provided in appendixes A and B.
Other differences between the USEPA sampling and sampling for the USGS study are the addition of constituents requested by USGS, the State of Wyoming, and representatives from the Wind River Reservation. For example, USGS has added sample-collection and laboratory analyses related to groundwater age dating, which are explained in table 4. The State of Wyoming requested a suite of analyses that relate to their water-quality standards and routine testing (see appendix A). Wind River Reservation representatives requested the addition of radium-226, radium-228, and radon to the list of analytes, which are included in table 3.
In addition to the differences in analyte lists between USGS and USEPA, there is one difference in a method of sample preservation. The USGS is collecting several volatile samples (volatile organic compounds, gasoline range organics, and dissolved hydrocarbon gases) for which the standard method of preservation is the addition of hydrochloric acid until the sample pH < 2.0. USEPA has expressed concern that the addition of hydrochloric acid to the sample matrix will cause a loss of VOCs in the sample. TestAmerica Laboratories is not able to modify methods to accommodate the trisodium phosphate preservative as recommended by USEPA, so the USGS agreed to collect volatile samples both with chemical preservative (hydrochloric acid and iced) and without (iced only).
Data to be collected during this study include information describing the site and well condition, field properties measured during well purging, and final field water-quality measurements. Sample collection, handling, and shipping procedures will be in accordance with laboratory and USGS requirements (U.S. Geological Survey, variously dated). Samples will be handled and shipped in compliance with chain-of-custody requirements (U.S Environmental Protection Agency, 2002).
Documentation Ancillary well site information, site observations, well purging, and field sample collection
information will be documented on field forms and field notes (appendix C). The field data collected as part of this study will be entered into the USGS NWIS database. Much of this data will be accessible at http://waterdata.usgs.gov/wy/nwis/qw. Data entry will be timely, accurate, and quality assured.
Ancillary data that comply with the National Groundwater Monitoring Network Framework guidance (National Ground Water Association, 2009) and meet USGS minimum data elements to establish a groundwater site as published in USGS Groundwater Technical Procedure Document 2 (GWPD-2) (Cunningham and Schalk, 2011a) will be collected for each monitoring well. These ancillary data are required to enter any information about a well into NWIS. Ancillary data to be described for each well include point of contact, site identifier, geologic/hydrologic description, well location, well characteristics, Wyoming State Engineer’s Office permit number, land-surface altitude, well construction and completion information, and photographs at the wellhead. Data are recorded in the

6
field on the USGS Groundwater Site Inventory (GWSI) Groundwater Site Schedule (Form 9-1904-A, appendix C–1).
Site observations, well purge volume and time, and other data collected as part of groundwater sampling will be noted on a USGS Groundwater Field Form (appendix C–2). These data include sampling equipment; sampling conditions and weather information; field instrument calibration; water-level depth; a log of field properties measured during the well purge; calculations of well and purge volumes; preservation chemicals, blank water, and. lot numbers of filters. A chain-of-custody (CoC) form will accompany samples to each laboratory. At least two different styles of forms will be used to track samples sent to laboratories—a modified “Contract” Analytical Services Request (ASR) (appendix C–3) required for samples sent to TAL under USGS contract, and appropriate sample request/CoC forms that will accompany samples sent to laboratories other than TAL. All field observations and any deviations from this SAP will be documented using the field forms described in this section of the report or in logbooks.
Groundwater-Quality Sampling Procedures This section describes procedures that will be used to collect groundwater samples from
monitoring wells MW01 and MW02. Preparation for sample collection, instrument calibration, water-level measurement, well purge, environmental sample collection, and sample shipping and tracking are described. A list of equipment needed to accomplish groundwater sampling is provided in appendix D.
Preparation Upon arrival at each well site, field personnel will perform the following preparation steps: 1. Conduct a safety inspection of the well site and vicinity as outlined in the Job Hazard
Analysis (appendix E). 2. Describe well and site conditions in field notes or on field forms, as appropriate, to include
the well number, sampling date, sampling personnel, weather conditions, and condition of the outer well casing, concrete pad, and any other unusual conditions around the well (Cunningham and Schalk, 2011a).
3. Prepare site for purging and sampling by spreading plastic sheeting on the ground to keep sampling equipment and tubing clean.
4. Unload and set up equipment and instrumentation for well purging and measurement of field properties.
a. All sampling equipment will be precleaned and quality assured. Wells MW01 and MW02 each have dedicated pumps installed that will be used for sampling. This study will use Teflon® tubing with stainless steel fittings past the wellhead point of discharge for sampling. All field instruments will be checked before deployment.
b. Unlock and open protective casing. c. Release gas pressure from well by opening valve; as valve is opened, collect
measurements of released gas at discharge point and 2 ft away using a four-gas meter (oxygen, flammable gasses (lower explosive limit), hydrogen sulfide, and carbon dioxide) and document readings.
5. When safe (safe four-gas meter measurements are described in the Job Hazard Analysis, appendix E), a water-level measurement can be made using an electric water-level indicator (e-tape), a steel tape, or a sonic water-level meter. Additionally, an intrinsically safe pressure transducer may be installed at this time to monitor water level continuously throughout the well purge and sampling process.

7
6. All field instruments will be calibrated at the site before use.
Water-Level Measurement Collecting water-level measurements during a groundwater-quality study is important. The initial
water level, which commonly is “static,” is used when determining the well purge volume, and can be used with other aquifer data to determine hydraulic head. Sufficient data may allow evaluation of the direction of horizontal and vertical groundwater flow. It is important to also monitor water levels during the well-purging process to determine the effect pumping is having on the aquifer. If a well is pumped at too high a flow rate, the water level could be drawn down to the pump level before sampling is possible. This would cause pumping to stop until the water level in the aquifer has time to recover sufficiently to allow for the collection of samples. Commonly, this cycle continues throughout the purging and sampling process. By reducing (drawing down) the water level to the pump level, the well-purging process essentially becomes a surging process, which could negatively affect the quality of samples. By monitoring water levels throughout the purging process, pumping rates can be adjusted so they do not exceed well recharge rates and well surging can be minimized. Purge data from wells MW01 and MW02 (U.S. Environmental Protection Agency, 2011a) indicate that both wells could be affected by water-level drawdown during purging. Water levels will be determined both before and during the well purge. Because both wells are known to have gas in the water, it also should be noted that some component of hydraulic head may be attributable to gas rather than hydraulic pressure.
Once it has been determined that the monitoring well is not pressurized and the workspace and well casing have been cleared of combustible gasses (if necessary), the water level will be measured using an electronic water-level indicator (e-tape), a steel tape, or a sonic water-level meter. If well construction allows, each well will be instrumented with a transducer and data logger to continuously record water levels. The general procedure for measuring a static water level using an e-tape follows; a detailed description of the method used to measure water levels by use of an e-tape or a steel tape can be found in Cunningham and Schalk (2011b, 2011c).
Procedure: 1. Determine location of a measuring point (MP). If not previously established, measure
distance from the MP to the land surface. Note the height of the MP, and describe MP location in notes.
2. Using a calibrated e-tape, make two or more consecutive water-level measurements to the nearest 0.01 ft.
3. Repeat measurement until precision is within 0.01 percent (±0.01 ft per 100 ft) of depth to water below the MP (Cunningham and Schalk, 2011d; Garber and Koopman, 1968), until the reason for lack of agreement is determined, or the results are shown to be reliable. If two or more measurements are collected, use best professional judgment to select the measurement most representative of field conditions. If well construction allows, each well additionally will be instrumented with a transducer and data logger to continuously record water levels.
4. Record e-tape identification (brand and serial number), date, and time of each measurement. 5. If e-tape is to be used to measure water levels throughout well purge then leave it in the well.
If e-tape will not be used during well purge, disinfect and rinse the part of the e-tape that was introduced to the casing as described in the USGS National Field Manual (U.S. Geological Survey, variously dated).
If a pressure transducer is used during the well purge, manufacturer’s recommendations and USGS guidelines (Cunningham and Schalk, 2011d) will be followed for instrument selection, installation and data collection.

8
Instrument Calibration All instruments, including water-level meters, pressure transducers, and water-quality
instruments will be tested or calibrated before departing for the field and again before each use at each new sampling site. Water-level meters and pressure transducers will be tested according to manufacturer’s recommendations and USGS guidelines (Cunningham and Schalk, 2011d). Field water-quality instruments will be tested according to manufacturer's recommendations and USGS guidelines (U.S. Geological Survey, variously dated, chapter 6); these recommendations and guidelines will be followed for instrument testing, calibration, and calibration checks of water-quality instruments. USGS calibration guidelines for water-quality properties regularly measured in the field are summarized in table 5. Calibration information will be recorded in instrument logbooks or on the groundwater field form (appendix C–2) as appropriate. If at any time instrument readings seem inaccurate based on historical data or professional judgment, the instrument calibration will be checked and the instrument recalibrated if necessary.
Well Purge Before collection of groundwater samples, the well will be purged of standing water and field
properties of the purge discharge will be monitored as indicators of when the water is being withdrawn directly from the formation. The purging process is meant to reduce chemical and biochemical artifacts caused by the materials and practices used for well installation, by reactions occurring within the well casing and annular space between casing and borehole wall, and by the long residence time of water within the pump tubing; purging also serves to condition sampling equipment with well water and helps to remove chemical residues that might be introduced by the equipment. USGS well-purge procedures, as outlined in chapter 4 of the USGS National Field Manual for the Collection of Water-Quality Data (“Field Manual;” U.S. Geological Survey, 2006, p. 92 and 103; Yeskis and Zavala, 2002), will be followed for this study and are summarized in this section as they apply to MW01 and MW02.
The Field Manual identifies standard procedures and exceptions to standard procedures for purging wells before sample collection (U.S. Geological Survey, 2006, Chap 4, section 4.2.3). Application of standard procedures to field situations generally falls into three categories: (1) a purge of one borehole volume (see equation 2 in the “Well-Purging Procedures” subsection) is the minimum standard procedure required and is predicated on the condition that variability of field-measured water-quality properties has stabilized (table 5) prior to initiation of sample collection, (2) preferably, the well is purged of three or more well (casing) volumes (see equation 1 in the “Well-Purging Procedures” subsection) to ensure the evacuation of at least one borehole volume, while monitoring the stabilization of field-measured water-quality properties prior to sampling, and (3) when the two previous standard procedures cannot be followed (for example, the need to sample at a low-yield well), alternative purging, field-property measurement, and sampling procedures that meet the data-quality objectives of the investigation can be considered (U.S. Geological Survey, 2006, chap. 4, p. 103-104, 107-108).
The USEPA has collected samples from wells MW01 (785 ft deep) and MW02 (980 ft deep) and provided a subset of their purging, drawdown, and well-development records, for both wells and previous sampling periods in a draft report (U.S. Environmental Protection Agency, 2011a) and online at http://www.epa.gov/region8/superfund/wy/pavillion/ (Accessed July 26, 2012). The USEPA well-purging history indicates that well MW01 provides sufficient yield to collect representative samples using the existing dedicated sampling equipment while applying the USGS standard purge and field-properties stabilization criteria. The purge and sampling history for well MW02, on the other hand, indicates that USEPA experienced much difficulty in collecting hydrologic information (water levels) because pumping caused a rapid decline in water level and exsolution of formation gasses caused by
9
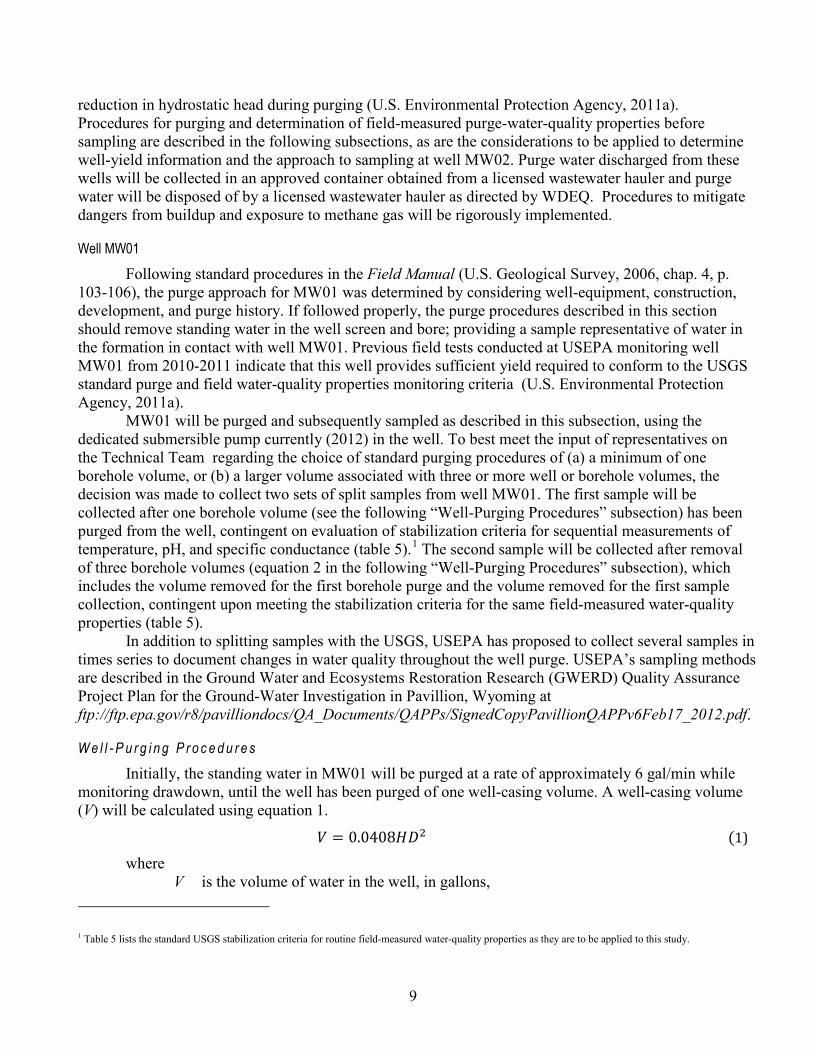
reduction in hydrostatic head during purging (U.S. Environmental Protection Agency, 2011a). Procedures for purging and determination of field-measured purge-water-quality properties before sampling are described in the following subsections, as are the considerations to be applied to determine well-yield information and the approach to sampling at well MW02. Purge water discharged from these wells will be collected in an approved container obtained from a licensed wastewater hauler and purge water will be disposed of by a licensed wastewater hauler as directed by WDEQ. Procedures to mitigate dangers from buildup and exposure to methane gas will be rigorously implemented.
Well MW01 Following standard procedures in the Field Manual (U.S. Geological Survey, 2006, chap. 4, p.
103-106), the purge approach for MW01 was determined by considering well-equipment, construction, development, and purge history. If followed properly, the purge procedures described in this section should remove standing water in the well screen and bore; providing a sample representative of water in the formation in contact with well MW01. Previous field tests conducted at USEPA monitoring well MW01 from 2010-2011 indicate that this well provides sufficient yield required to conform to the USGS standard purge and field water-quality properties monitoring criteria (U.S. Environmental Protection Agency, 2011a).
MW01 will be purged and subsequently sampled as described in this subsection, using the dedicated submersible pump currently (2012) in the well. To best meet the input of representatives on the Technical Team regarding the choice of standard purging procedures of (a) a minimum of one borehole volume, or (b) a larger volume associated with three or more well or borehole volumes, the decision was made to collect two sets of split samples from well MW01. The first sample will be collected after one borehole volume (see the following “Well-Purging Procedures” subsection) has been purged from the well, contingent on evaluation of stabilization criteria for sequential measurements of temperature, pH, and specific conductance (table 5).1 The second sample will be collected after removal of three borehole volumes (equation 2 in the following “Well-Purging Procedures” subsection), which includes the volume removed for the first borehole purge and the volume removed for the first sample collection, contingent upon meeting the stabilization criteria for the same field-measured water-quality properties (table 5).
In addition to splitting samples with the USGS, USEPA has proposed to collect several samples in times series to document changes in water quality throughout the well purge. USEPA’s sampling methods are described in the Ground Water and Ecosystems Restoration Research (GWERD) Quality Assurance Project Plan for the Ground-Water Investigation in Pavillion, Wyoming at ftp://ftp.epa.gov/r8/pavilliondocs/QA_Documents/QAPPs/SignedCopyPavillionQAPPv6Feb17_2012.pdf.
W e l l - P u r g i n g P r o c e d u r e s
Initially, the standing water in MW01 will be purged at a rate of approximately 6 gal/min while monitoring drawdown, until the well has been purged of one well-casing volume. A well-casing volume (V) will be calculated using equation 1.
𝑉 = 0.0408𝐻𝐷2 (1)
where V is the volume of water in the well, in gallons,
1 Table 5 lists the standard USGS stabilization criteria for routine field-measured water-quality properties as they are to be applied to this study.
10
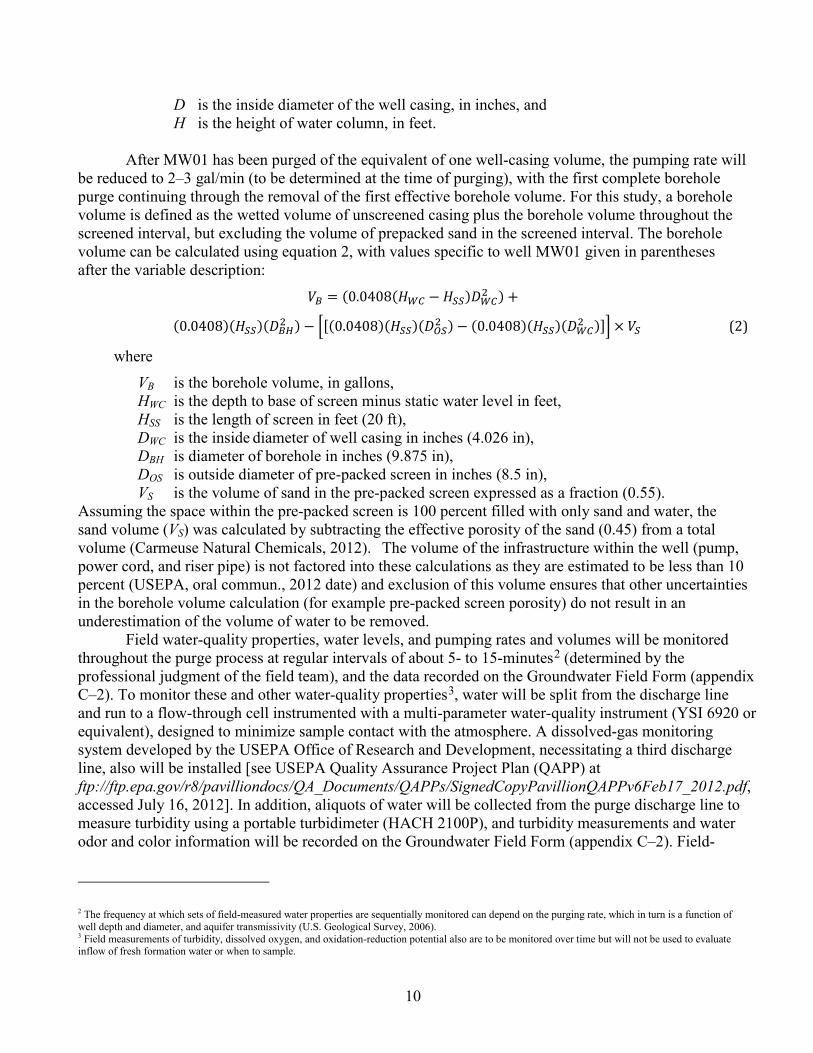
D is the inside diameter of the well casing, in inches, and H is the height of water column, in feet. After MW01 has been purged of the equivalent of one well-casing volume, the pumping rate will
be reduced to 2–3 gal/min (to be determined at the time of purging), with the first complete borehole purge continuing through the removal of the first effective borehole volume. For this study, a borehole volume is defined as the wetted volume of unscreened casing plus the borehole volume throughout the screened interval, but excluding the volume of prepacked sand in the screened interval. The borehole volume can be calculated using equation 2, with values specific to well MW01 given in parentheses after the variable description:
𝑉𝐵 = (0.0408(𝐻𝑊𝐶 − 𝐻𝑆𝑆)𝐷𝑊𝐶2 ) +
(0.0408)(𝐻𝑆𝑆)(𝐷𝐵𝐻2 ) − �[(0.0408)(𝐻𝑆𝑆)(𝐷𝑂𝑆2 ) − (0.0408)(𝐻𝑆𝑆)(𝐷𝑊𝐶2 )]� × 𝑉𝑆 (2)
where
VB is the borehole volume, in gallons, HWC is the depth to base of screen minus static water level in feet, HSS is the length of screen in feet (20 ft), DWC is the inside diameter of well casing in inches (4.026 in), DBH is diameter of borehole in inches (9.875 in), DOS is outside diameter of pre-packed screen in inches (8.5 in),
VS is the volume of sand in the pre-packed screen expressed as a fraction (0.55). Assuming the space within the pre-packed screen is 100 percent filled with only sand and water, the sand volume (VS) was calculated by subtracting the effective porosity of the sand (0.45) from a total volume (Carmeuse Natural Chemicals, 2012). The volume of the infrastructure within the well (pump, power cord, and riser pipe) is not factored into these calculations as they are estimated to be less than 10 percent (USEPA, oral commun., 2012 date) and exclusion of this volume ensures that other uncertainties in the borehole volume calculation (for example pre-packed screen porosity) do not result in an underestimation of the volume of water to be removed.
Field water-quality properties, water levels, and pumping rates and volumes will be monitored throughout the purge process at regular intervals of about 5- to 15-minutes2 (determined by the professional judgment of the field team), and the data recorded on the Groundwater Field Form (appendix C–2). To monitor these and other water-quality properties3, water will be split from the discharge line and run to a flow-through cell instrumented with a multi-parameter water-quality instrument (YSI 6920 or equivalent), designed to minimize sample contact with the atmosphere. A dissolved-gas monitoring system developed by the USEPA Office of Research and Development, necessitating a third discharge line, also will be installed [see USEPA Quality Assurance Project Plan (QAPP) at ftp://ftp.epa.gov/r8/pavilliondocs/QA_Documents/QAPPs/SignedCopyPavillionQAPPv6Feb17_2012.pdf, accessed July 16, 2012]. In addition, aliquots of water will be collected from the purge discharge line to measure turbidity using a portable turbidimeter (HACH 2100P), and turbidity measurements and water odor and color information will be recorded on the Groundwater Field Form (appendix C–2). Field-
2 The frequency at which sets of field-measured water properties are sequentially monitored can depend on the purging rate, which in turn is a function of well depth and diameter, and aquifer transmissivity (U.S. Geological Survey, 2006). 3 Field measurements of turbidity, dissolved oxygen, and oxidation-reduction potential also are to be monitored over time but will not be used to evaluate inflow of fresh formation water or when to sample.

11
measured water-quality properties will be collected, collated, and documented throughout the period of purging and sample collection.
During removal of the first borehole volume of well water, the variability among sequentially collected sets of measurements for temperature, pH, and specific conductance will be evaluated, as described below. Sampling can begin after the well has been purged of at least one complete borehole volume, conditional upon field-measured water-quality property stabilization (table 5) and field-team expertise. The well-water discharge will be split for concurrent USEPA and USGS sample collection.
The second set of split samples will be collected after a total of three borehole volumes of water have been removed (including sampling) and in accordance with USGS field water-quality property stabilization protocols, summarized below:
• A minimum of 5 sets of water-quality field properties will be recorded sequentially at regular 5- to 15-minute intervals, or as determined by the professional judgment of the field team.
– After five sets of measurements have been collected, the set of measurement values for the each field water-quality property will be checked against the field-measurement stabilization criteria (table 5). The median of the final five measurements is put on record as the value that represents formation water. This signals that sample collection can begin.
– If criteria have not been met, an additional three to five sets of field water-quality property measurements will be collected at regular time intervals, in accordance with USGS guidelines or the professional judgment of the USGS field team. The extent to which an individual field water-quality property meets the stabilization criteria will be evaluated after each additional measurement set is collected. If the variability among measurements for a given property continues to fluctuate beyond the established criterion, the decision of when and whether or not to commence with sampling relies on the expertise of the field team.
• The field conditions, problems encountered, and any modifications of standard field procedures are to be documented on the Groundwater Field Form or in study log notes, as appropriate.
USEPA will collect additional samples at well MW01 during the USGS sampling sequence as described in their QAPP ftp://ftp.epa.gov/r8/pavilliondocs/QA_Documents/QAPPs/SignedCopyPavillionQAPPv6Feb17_2012.pdf.
Well MW02 Previous field tests conducted by USEPA at deep monitoring well MW02 from 2010-2011
indicate that formation water enters the well at an exceedingly low flow rate (U.S. Environmental Protection Agency, 2011a), characterizing well MW02 as a low-yield well. The USGS operationally defines a low-yield well as a well that produces substantially less than 1 gal/min and for which drawdown occurs such that the well can be rapidly pumped dry or for which recovery to at least 90 percent of the pre-pumping water level (after removal of at least one borehole volume) takes many hours to several days or longer (U.S. Geological Survey, 2006, p. 93). During phase IV sampling of well MW02 by the USEPA in April 2011, the USEPA reported a yield in well MW02 of about 1 gallon per hour (gal/h), (about 0.017 gal/min) (U.S. Environmental Protection Agency, oral commun., 2012). Given a well yield of 1 gal/h and given that a single borehole volume of water in well MW02 equals about 510 gallons (U.S. Environmental Protection Agency, 2011a), recovery of the water level in the well following purging of 1 borehole volume would take considerably longer than 24 hours, depending on the water-level drawdown in the well.

12
Standard USGS practice is to avoid sampling at low-yield wells, if possible, because of difficulty and uncertainties in achieving an adequate purge to clear the well of artifacts inherent in standing well-bore water that can compromise the representativeness of water flowing to or withdrawn from the screened section of the well. The Field Manual allows for circumstances, such as specific study objectives, well or formation characteristics, and other constraints, for which sampling at low-yield wells might be necessary and states that the criterion for representativeness of formation water is defined also by the specific sampling and data-quality requirements established for a given investigation (U.S. Geological Survey, 2006, p. 107-108). It allows, for example, that the study team may customize purge protocols to include stabilization of specific constituent analyses relevant to the purpose of the study, as discussed by Gibs and Imbrigiotta (1990). The Field Manual provides technical information regarding selection of low-flow purge techniques to address sampling needs at low-yield wells. As MW02 was determined to be a low-yield well, the initial intention of the USGS to sample well MW02 using purge procedures that would be as consistent as possible with the standard USGS approaches implemented at well MW01 could not be carried out.
Since determination of an alternative approach for purging and sampling MW02 could not be concluded prior to the April 22 sampling date set by USEPA, USGS and USEPA agreed, instead, that USEPA would collect a split set of samples from MW02 on April 22 and send these samples for chemical analysis to the USEPA laboratories and the USGS contract laboratory TAL, to allow a comparison of results among the laboratories. The TAL sample results will be provided by USGS to the USEPA.
An abbreviated description follows of the observations and further work done at well MW02 after the sample-collection activities were completed by USGS and USEPA at MW01 and by USEPA at MW02 in April 2012. Because of the low yield of well MW02, resulting in long recovery or purge times relative to standard USGS procedures, the USGS, with permission from USEPA, redeveloped the well during the week of April 30, 2012 in an attempt to increase the well yield (U.S. Geological Survey, 2006, p. 93). As a safety precaution prior to redevelopment, the well casing was filled with potable water from the City of Riverton to reduce methane concentrations in the well. The City of Riverton water was split sampled by USGS and USEPA as a quality control measure and USGS results will be provided in the USGS Data Series Report for this study. The dedicated submersible pump was removed from the well and the WYDEQ used a previously decontaminated down-hole video camera to examine and film the well screen, the overall structure of which appeared to be intact; it was not possible to determine the degree to which the screen slots may be plugged. Three hours were spent surging the well using a 4-inch-diameter surge block attached to the stainless steel discharge pipe that formerly ran from the well head to the pump. During well redevelopment precautionary steps were taken to monitor methane levels from the well and ensure the safety of the field team. After surging, the well was bailed from the bottom for 4.5 hours and from the top of the water column for 11.5 hours. The USGS Central Region Research Drilling Chief’s project log for this redevelopment activity is contained in appendix F.
Redevelopment of well MW02 was completed on May 4, 2012. Subsequent repeated measurements of water-level recovery were made using an e-tape, as attempts to install a pressure transducer near the well bottom by USEPA were unsuccessful. On the basis of the water-level measurements made in well MW02 on May 4 and May 10, 2012, the USEPA calculated a well yield of approximately 0.65 gal/h (about 0.011 gal/min) (U.S. Environmental Protection Agency, oral communication, 2012). The USGS calculated the same well yield based on the available information (table 6). On the basis of the water-level measurements made in well MW02 on May 10 and May 21, 2012, the USGS calculated a well yield of about 0.44 gal/h (about 0.007 gal/min) (table 6). These yield

13
estimates are somewhat less than the 1 gal/h previously estimated by the USEPA, indicating that the redevelopment effort did not improve the flow of groundwater into the well.
At this point alternatives to the purge procedures used at MW01 (U.S. Geological Survey, 2006, chap. 4, p. 107-108) were considered again for well MW02, including the use of a low-flow pump with or without a packer system. These techniques are reported in the literature as used to maximize yield and alleviate the problems associated with long recovery or purge times, and are provided as options in the Field Manual (Puls and Barcelona, 1996; Shapiro, 2001; U.S. Geological Survey, 2006, p. 108; ASTM International, 2007). To date, those techniques have not been tested at MW02. Considering the depth, yield, and gas-producing characteristics of MW02, in the experience and professional opinion of the authors of this report, some period of testing would be required to determine whether such methodologies could be applied successfully at MW02, both with respect to hydraulic and technical capabilities of the sampling systems and the ability to meet the study and data-quality criteria established for this investigation.
The Technical Team discussed using the Bennett low-flow sampling pump Model 1800-6. Given the very low well yields (estimated at 0.007 to 0.011 gal/min) and potential head lift of several hundred feet, it is not certain that the Bennett pump could reliably pump at those low rates. That kind of pump performance appears to be at the margin of the pump specifications provided by Bennett (Bennett Sample Pumps, Inc.). For example, author experience in the High Plains aquifer with the Bennett pump Model 1800-6 indicates that the pumping rate may not always be adjustable down to near zero gal/min and still produce a steady stream of water for measuring field properties and collecting samples.
Given that development, testing, and evaluation of the purge and sampling procedures appropriate for MW02 are beyond the scope of this study as agreed to by the USGS and WYDEQ, and given the mid-September 2012 deadline for publishing the USGS Data Series Report for MW01, the USGS, in consultation with the Technical Team, concluded that it would not be possible to complete sampling at MW02 and evaluate the results by the report deadline. In summary, USGS did not collect samples from MW02 in April or following the attempted redevelopment. Sample-collection discussions for well MW02 by USGS and the Technical Team have been placed on hold, although collegial deliberation on possible sampling strategies within the Technical Team could be reconvened at some point in the future.
Sample Collection, Analysis, and Processing Immediately after the well has been satisfactorily purged, a portion of the pump discharge water
will be redirected to the USGS sample-processing chamber using a flow manifold. Sample collection will begin after approximately 5 minutes of rinsing water through the processing chamber to rinse sample tubing with a minimum of 2 gallons of well water. To minimize the possibility of sample contamination, all sample tubing from the wellhead will be Teflon® with stainless steel fittings. All sampling equipment will be decontaminated before and immediately after sampling according to the methods described in the “Decontamination” section. Samples will be collected in containers as specified for the method used for each analyte and according to laboratory preference. USGS and USEPA sampling teams will each have a separate line for sample collection. A modified splitter will be added at the wellhead to allow for the concurrent collection of samples and monitoring of field water-quality properties by both USGS and USEPA personnel.
Several laboratories will be used to analyze groundwater samples (table 3). Each laboratory was selected on the basis of analytical capabilities. Most of the chemical analyses of the USGS samples will be done by TAL, because they routinely use approved USEPA analytical methods. The USGS Reston Chlorofluorocarbon and Stable Isotopes Laboratories in Reston, Va., will be analyzing dissolved gasses
14
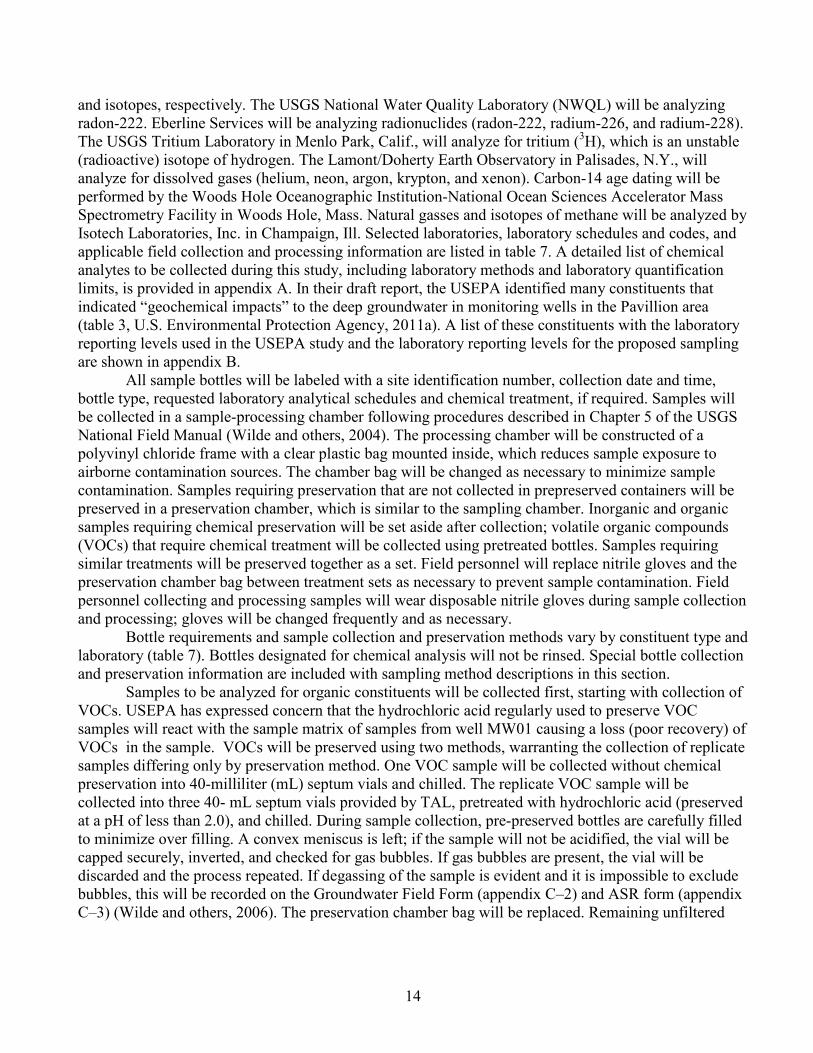
and isotopes, respectively. The USGS National Water Quality Laboratory (NWQL) will be analyzing radon-222. Eberline Services will be analyzing radionuclides (radon-222, radium-226, and radium-228). The USGS Tritium Laboratory in Menlo Park, Calif., will analyze for tritium (3H), which is an unstable (radioactive) isotope of hydrogen. The Lamont/Doherty Earth Observatory in Palisades, N.Y., will analyze for dissolved gases (helium, neon, argon, krypton, and xenon). Carbon-14 age dating will be performed by the Woods Hole Oceanographic Institution-National Ocean Sciences Accelerator Mass Spectrometry Facility in Woods Hole, Mass. Natural gasses and isotopes of methane will be analyzed by Isotech Laboratories, Inc. in Champaign, Ill. Selected laboratories, laboratory schedules and codes, and applicable field collection and processing information are listed in table 7. A detailed list of chemical analytes to be collected during this study, including laboratory methods and laboratory quantification limits, is provided in appendix A. In their draft report, the USEPA identified many constituents that indicated “geochemical impacts” to the deep groundwater in monitoring wells in the Pavillion area (table 3, U.S. Environmental Protection Agency, 2011a). A list of these constituents with the laboratory reporting levels used in the USEPA study and the laboratory reporting levels for the proposed sampling are shown in appendix B.
All sample bottles will be labeled with a site identification number, collection date and time, bottle type, requested laboratory analytical schedules and chemical treatment, if required. Samples will be collected in a sample-processing chamber following procedures described in Chapter 5 of the USGS National Field Manual (Wilde and others, 2004). The processing chamber will be constructed of a polyvinyl chloride frame with a clear plastic bag mounted inside, which reduces sample exposure to airborne contamination sources. The chamber bag will be changed as necessary to minimize sample contamination. Samples requiring preservation that are not collected in prepreserved containers will be preserved in a preservation chamber, which is similar to the sampling chamber. Inorganic and organic samples requiring chemical preservation will be set aside after collection; volatile organic compounds (VOCs) that require chemical treatment will be collected using pretreated bottles. Samples requiring similar treatments will be preserved together as a set. Field personnel will replace nitrile gloves and the preservation chamber bag between treatment sets as necessary to prevent sample contamination. Field personnel collecting and processing samples will wear disposable nitrile gloves during sample collection and processing; gloves will be changed frequently and as necessary.
Bottle requirements and sample collection and preservation methods vary by constituent type and laboratory (table 7). Bottles designated for chemical analysis will not be rinsed. Special bottle collection and preservation information are included with sampling method descriptions in this section.
Samples to be analyzed for organic constituents will be collected first, starting with collection of VOCs. USEPA has expressed concern that the hydrochloric acid regularly used to preserve VOC samples will react with the sample matrix of samples from well MW01 causing a loss (poor recovery) of VOCs in the sample. VOCs will be preserved using two methods, warranting the collection of replicate samples differing only by preservation method. One VOC sample will be collected without chemical preservation into 40-milliliter (mL) septum vials and chilled. The replicate VOC sample will be collected into three 40- mL septum vials provided by TAL, pretreated with hydrochloric acid (preserved at a pH of less than 2.0), and chilled. During sample collection, pre-preserved bottles are carefully filled to minimize over filling. A convex meniscus is left; if the sample will not be acidified, the vial will be capped securely, inverted, and checked for gas bubbles. If gas bubbles are present, the vial will be discarded and the process repeated. If degassing of the sample is evident and it is impossible to exclude bubbles, this will be recorded on the Groundwater Field Form (appendix C–2) and ASR form (appendix C–3) (Wilde and others, 2006). The preservation chamber bag will be replaced. Remaining unfiltered

15
organic samples will be collected and if necessary set aside for preservation (table 7). If needed, the chamber bag will be replaced.
Collection of samples to be analyzed for inorganic constituents will follow the collection of organics. Filtered inorganic constituent samples (trace elements, major ions, nutrients, and alkalinity) will be collected first. Flow will be directed away from the sampling chamber and a pre-rinsed disposable 0.45-micron (µm) capsule filter [pre-rinsed with 2 liters (L) of deionized water] will be attached to the sample discharge line. Flow will be redirected to the sampling chamber; the filter will be inverted to allow sample flow to force trapped air out of the filter, and then sampling will begin. Starting with the trace element sample bottle, bottles will be filled, and if necessary, set aside for preservation (table 7). Samples will be treated in sets as described in this subsection once all samples requiring preservation have been collected.
Dissolved hydrocarbon gasses sent to TAL will be collected using 40-mL septum vials and will be collected immediately after the VOCs. Carbon-14 (14C) samples will be collected with the filtered inorganic samples. Once the collection of chemical samples is completed, isotope, dissolved-gas, and age-dating samples will be collected. Collection and processing information for isotopes, dissolved gasses, and age-dating methods are listed in table 7. A short summary of each collection and processing method is described in this section; links to detailed sampling instructions are provided.
Detailed instructions for collecting isotope samples are provided by the USGS Reston Stable Isotope Laboratory at http://isotopes.usgs.gov/lab/instructions.html. Samples for analysis of stable isotope ratios of hydrogen (ratio of hydrogen-2 to hydrogen-1 relative to a reference standard; δ2H) and oxygen (ratio of oxygen-18 to oxygen-16 relative to a reference standard; δ18O) in water will be collected by filling two 60-mL glass bottles two-thirds full with filtered sample water. Bottles will be capped with polyseal caps and stored at ambient temperature until shipped to the laboratory. Samples for analysis of isotope ratios of carbon (ratio of carbon-13 to carbon-12) of dissolved inorganic carbon in water (δ13C DIC) will be collected using a 60-mL syringe. The sample is then filtered into 40-mL vials, containing copper sulfate preservative, using a 25-millimeter (mm) polysulfone GD/X syringe filter. Three vials will be collected for each δ13C DIC sample.
Dissolved-gas samples to be analyzed by the USGS Reston Chlorofluorocarbon Laboratory will be collected following the detailed instructions provided by the laboratory at http://water.usgs.gov/lab/dissolved-gas/sampling/. To summarize, dissolved-gas samples will be collected into 150-mL serum bottles provided by the laboratory. In preparation, a needle is inserted through the provided rubber stopper, and a container (larger and taller than the serum bottle) is filled with sample water. The water discharge tube is placed in the bottom of serum bottle and the bottle is filled to overflowing. The serum bottle, with sample tube still flowing, is placed in the container of sample water. When it is evident there are no bubbles adhering to the bottle, the rubber stopper is inserted. The needle will allow gas trapped under the stopper to exit the bottle. Once the stopper is firmly seated, the needle is removed carefully, and the bottle is inverted and checked for bubbles. If bubbles are found, the stopper will be removed, the bottle emptied, and the collection process repeated as described in this paragraph.
Helium and other noble gases will be collected to evaluate the apparent age of groundwater samples. The method used to collect the helium and noble gas samples to be analyzed by the Lamont-Doherty Earth Observatory is available at http://water.usgs.gov/lab/dissolved-gas/sampling/. Special copper sample tubes that are fixed in an aluminum channel with stainless steel pinch-off clamps are flushed with sample water to rinse the tubes and to remove bubbles. Back pressure is applied to sample discharge to eliminate degassing, and the tubes are sealed by crimping both ends of each copper tube using the stainless steel pinch-off clamps.

16
Tritium, sulfur hexafluoride, chlorofluorocarbon, and 14C samples will be collected and analyzed to evaluate the apparent age of groundwater samples collected from wells MW01 and MW02. Tritium samples will be collected into 1-L polyethylene bottles with no headspace and capped with a polyseal cone cap. The sulfur hexafluoride samples will be collected using the bottles and caps described at http://water.usgs.gov/lab/sf6/sampling/. The sample tube will be placed at the bottom of the sample bottle and the bottle will be filled to overflowing. After 3 L of water have flowed through the bottle, the bottle will be capped with no headspace. The chlorofluorocarbon samples will be collected in accordance with the method described at http://water.usgs.gov/lab/chlorofluorocarbons/sampling/bottles/. The sample bottle and cap (off) are placed into a container. The sampling tube is placed at the bottom of the sample bottle and at least 2 L of sample are allowed to overflow into the container. The bottle and cap are checked for bubbles. When there are no bubbles present, the bottle is capped while still underwater.
Samples for 14C will be collected with chemical samples, immediately after all filtered inorganic samples have been collected. Using the same filter that is used for inorganics, a 1-L plastic coated glass bottle is filled to overfilling and capped using a polyseal cone cap. The samples for 14C should have no headspace.
Alkalinity (filtered) and acid neutralizing capacity (whole water) samples will be collected in replicate and will be determined using the incremental titration method as described in Chapter 6 of the National Field Manual (Rounds, 2006). Measurements of ferrous iron, sulfide, and low-range dissolved oxygen will be performed in the field using a HACH DR 2800 spectrophotometer. Methods of analysis include HACH method 8146, the 1,10-phenanthroline method using Accu Vac ampoules for ferrous iron; HACH method 8131, a methylene blue method for sulfide; and HACH method 8316, the indigo carmine method using Accu Vac ampoules for low-range dissolved oxygen (HACH, 2007). The low-range dissolved oxygen analysis is a quality-assurance check for the dissolved oxygen probe. The HACH DR 2800 is factory calibrated and will be checked following manufacturer’s instructions before field deployment. For this study, this quality-assurance check will consist of checking the accuracy of dissolved oxygen and ferrous iron measurements and the precision of ferrous iron measurements. The dissolved oxygen accuracy will be checked using a hydrosulfite reagent; the result should be 0 plus or minus (±) 6 micrograms per liter (µg/L). The ferrous iron accuracy will be checked by measuring a 2 milligram per liter (mg/L) standard; the results should be between 1.80 and 2.20 mg/L. The precision will be tested by measuring the standard 3 times. The single operator error should be ± 50 µg/L.
Sample bottles will be sorted by time of collection and analyzing laboratory. In order to minimize the possibility of sample cross contamination, environmental samples from each well will be shipped in separate coolers. Additionally, quality-control samples such as blanks and spikes will be shipped separately from environmental samples. Appropriate laboratory ASR forms and chain-of-custody documentation will be completed and placed with sample bottles. Samples will be placed into a cooler (or other appropriate packaging) and packed in ice if required; coolers will be sealed with custody labels, taped shut, and shipped overnight by courier to each laboratory.
Decontamination USGS policy requires that all water-sampling equipment is properly cleaned (decontaminated)
before sample collection and that the effectiveness of cleaning procedures be quality controlled (Sandstrom, 1990; Horowitz and others, 1994; Koterba and others, 1995; Wilde, 2004). Equipment is decontaminated to ensure that the equipment is not a source of contaminants that could affect the ambient concentrations of target analytes. Additionally, the proper removal of contaminants from equipment minimizes the likelihood of sample cross contamination and reduces or eliminates the

17
transfer of contaminants to clean areas. This section summarizes the cleaning protocols that will be used to decontaminate sampling equipment used during this study. A description of samples collected as part of quality control of the cleaning procedures is included in the “Field Quality Control” section of this report.
In preparation for sampling, all equipment to be used for collection of groundwater samples will be cleaned in accordance with standard USGS protocols (Wilde, 2004). Any deviations from cleaning protocols required by this study will be described in this section. Equipment will be cleaned onsite directly after use or rinsed well with deionized water and returned to the USGS WYWSC office for cleaning. Cleaning procedures vary depending on the types of water samples that will be collected and processed with each piece of equipment. Samples for this study will be collected for both inorganic and organic analytes.
The monitoring wells to be sampled have dedicated pumps installed for sampling. For the purposes of this study, it will be assumed that these pumps and the tubing running from the pumps to above land surface were clean and will not contribute contamination. If practical, the fitting where portable sample tubing is attached will be rinsed with deionized water before attaching the portable sample tubing. Above land surface, groundwater samples will be routed through Teflon® sample tubing with stainless steel valves and fittings. The tubing and fittings will be used for collection of all groundwater samples and will be cleaned thoroughly using the method described in figure 2. Each well will have a dedicated set of sample tubing and fittings.
Figure 2. Cleaning procedures for sampling equipment used to collect samples for analysis of inorganic and organic constituents.
A short piece of silicon tubing will be attached to the end of the sampling line during the collection of filtered samples for analysis of inorganics. This will allow field personnel to attach a 0.45-µm filter to the end of the sample tubing. This short piece of silicon tubing will be cleaned following the procedures outlined in figure 3.

18
Figure 3. Cleaning procedures for silicon tubing used to collect samples for analysis of inorganic constituents.
Equipment used to collect isotope samples, dissolved gasses, and age-dating samples do not require special cleaning procedures and will be cleaned following the procedures outlined in figure 2.
Chain of Custody and Documentation Requirements Data collected as part of this study of groundwater quality from monitoring wells near Pavillion,
Wyo., need to be legally defensible. Groundwater-quality samples collected from USEPA wells MW01 and MW02 will be treated as physical evidence in an investigation, and transfer of physical samples and sampling data will be controlled. Standard chain-of custody (CoC) procedures will be followed for field documentation, sample labeling, packaging, and shipping as applied to environmental samples. This section summarizes instructions and procedures provided by Standard Operating Procedure for Chain of Custody Samples, Office of Environmental Measurement and Evaluation, USEPA New England – Region 1 (U.S. Environmental Protection Agency, 2002) . The chain of custody and documentation section of U.S. Geological Survey Protocol for Sample Collection in Response to Deepwater Horizon Oil Spill, Gulf of Mexico, 2010 (Wilde and Skrobialowski, 2011) has been used as a guide for this section of the report.
Field personnel are legally responsible for the care and custody of the samples collected until the samples have been transferred to the laboratory. For this reason, it is important that field personnel understand and follow basic documentation, sample identification, and CoC procedures. As few people as possible will handle samples. All field documentation (logbooks, field forms, sample labels, and CoC forms) will be completed using indelible ink. If it is necessary to use a pencil instead of a pen, this must be noted in the field logbook.
Field Logbooks and Other Documentation Field observations and data-collection activities will be documented in the field logbook
(logbook). The logbook will be a bound, paginated book, preferably with weather-resistant properties. It is important that logbook entries are detailed enough so that others can reconstruct field activities without relying on field personnel memory. The following steps will be followed to document activities:
• At the beginning of each day, record the date, start time, station identification number and description, names of field team members present, and the signature of the person making the entry;
• Include a record of all the names of all visitors to the site and the purpose of their visit;

19
• Record measurements made and samples collected; • Record CoC information for samples. Note courier, tracking information, and laboratory
to which samples were being transferred; • All entries will be made in indelible ink as described in this section, and no erasures will
be made. If an incorrect entry is made, the information will be crossed out with a single strike mark and the entry will be initialed and dated; and
• Logbook entries and field record sheets must all include the station identification number, date, time, and names or initials of all personnel handling the environmental and quality-control samples.
The Groundwater Field Form (appendix C–2) has been designed by the USGS to include all necessary field documentation when properly completed by field personnel. To reduce duplication of effort (documenting all field data in both the logbook and on field forms), field forms will be printed onto adhesive-backed paper for addition into the logbook. All relevant field forms, logbook notes, photographs, and other information will be included as appendixes in the final USGS Data Series Report and will be available to the public in an online version of the report.
Sample Container Labels Sample labels will be completed for each sample container collected for analysis, using indelible
ink. Figure 4 provides an example of a sample label. Each label will include the following: • Station identification number; • Sample collection date: a six-digit number indicating month, day, year; • Sample collection time: a four-digit number indicating the local time [Mountain Standard
Time (MST) or Mountain Daylight Time (MDT)] of collection using the military or 24-hour time convention;
• Laboratory schedule(s), laboratory code(s), or USEPA method(s); • Sample preservation method; and • Initials of personnel collecting and handling the sample(s).
Figure 4. Example of a sample container label.
Transfer of Custody and Sample Shipment To maintain a clear record of environmental sample custody from collection through sample
analysis, sample CoC will be documented. An ASR form will be completed to inform the laboratory of the analyses being requested for each sample and will be used to document sample possession and
USGS Pavillion Project 431525108371901 (Well MW01) Date Time
EPA 6020 1-500 mL FA ph<2 w/HN03
20
custody. The transfer of samples from the field to a courier, to the laboratory, and through the analytical process will be documented to clearly reflect movement of the samples.
A CoC/ASR form will be completed for each sample being sent for laboratory analysis. The CoC/ASR form will include the station identification number, sample collection date, sample collection time, requested analyses, and bottle types and numbers included in the sample shipment. At the bottom of the CoC/ASR form is a location for signature. An example CoC/ASR form for a water sample being sent to TAL is provided in appendix C–3.
Samples will be properly packaged for shipment (sample and laboratory dependent) and sent to the appropriate laboratory for analysis, preferably as a batch shipment. Three copies of the CoC/ASR form will be completed for each sample. Two properly completed CoC/ASR forms will accompany each shipment of samples and one will be saved for study records. The CoC/ASR forms will all be signed and dated by a member of the field team with the date and time of sample transfer. If samples will be transferred to the laboratory by courier, tracking numbers will be included on the CoC/ASR form to track sample chain-of-custody throughout the shipping process. Upon receipt of the samples at the laboratory, the receiver will complete the transfer by signing and dating both CoC/ASR forms shipped with the samples. The laboratory will keep one copy of the CoC/ASR form for their records and return one copy to the USGS WYWSC for their records.
Sample Packaging The lids or caps on all sample bottles will be checked to verify they are tightly sealed. If directed
by the receiving laboratory, lids or caps will be taped on sample containers with appropriate tape. Glass containers will be wrapped in foam or bubble wrap to prevent breakage during shipping. Sample containers will be sealed in Ziploc® bags. Similar containers (for example, VOC vials) can be sealed in the same Ziploc® bag. Each sample will be compared to entries on the CoC/ASR form to ensure bottles and CoC entries match. If ice is required for sample preservation, samples will be packaged in thermally insulated, rigid coolers with ice and temperature blanks. The temperature blank is a small bottle filled with deionized water that travels with iced samples to the laboratory; upon arrival at the laboratory, the temperature of water in the bottle is measured to evaluate if samples were adequately cooled during shipment. Each package of samples will be sealed with a signed and dated custody seal and appropriate shipping tape.
Quality Assurance and Quality Control The quality-assurance and quality-control procedures described in this section have been
developed to provide routine application of field and laboratory procedures to control the measurement process and ensure the usability and reliability of sampling and analysis data. This Sampling and Analysis Plan (SAP) is the first step to ensuring high-quality environmental data. Following standard procedures for decontaminating field equipment; maintaining, calibrating, and operating field equipment and instrumentation in accordance with manufacturer’s instructions; following standard operating procedures outlined in the USGS National Field Manual (U.S. Geological Survey, variously dated); using standard field forms; using skilled personnel for sampling; and adhering to this SAP constitute the quality-assurance procedures for the study. Errors that affect environmental measurements can be introduced in the field during sample collection, processing, shipment, in the laboratory, and during database entry. Quality-control (QC) samples described in this section ensure that data collected in the field, analyzed by the laboratory, and entered into the USGS National Water Information System (NWIS) database will be of known and appropriate quality to meet the objectives of the study.
21
U.S. Geological Survey Quality-Assurance Program The USGS maintains personnel in Water Mission Area technical offices who work to ensure data
collected by the USGS are of the highest quality. The technical offices relevant to this study are the Office of Water Quality and the Office of Groundwater. These offices along with the Office of Surface Water establish the technical guidelines water science center personnel follow. Technical guidelines applicable to this study can be found in the USGS National Field Manual for the Collection of Water-Quality Data (U.S. Geological Survey, variously dated) and Groundwater Technical Procedures of the U.S. Geological Survey (Cunningham and Schalk, 2011e). The technical offices are also responsible for ensuring USGS water science center personnel are following established technical guidelines. One method that the technical offices use to ensure all water science centers are producing hydrologic data and information that meets USGS standards is through technical reviews of water activities in USGS water science centers. The technical offices assemble multidiscipline teams that conduct reviews of science center water activities within the USGS at integrated and water science centers. These technical reviews are scheduled onsite at approximately 3-year intervals. The review includes a variety of activities designed to accomplish the objectives of the review. A few of these activities include the following:
• Visiting representative offices to observe field methods, equipment and field installations, vehicles, laboratories, and warehouses for adequacy, safety, and compliance with policies and guidelines;
• Reviewing selected data records and analytes, technical files, and documentation such as flood plans and model archives;
• Evaluating NWIS and other databases; • Reviewing quality-assurance plans and procedures that cover program planning, field
measurements, sample collection, laboratory analyses, data interpretation, and report preparation and publication;
• Reviewing quality-control procedures for activities involving field measurements, sample collection, laboratory analyses, and data interpretation provided by non-USGS personnel, such as technical contractors, cooperators, observers, volunteers, and others;
• Reporting the findings of the review team to the science center at the conclusion of the review, including major comments and recommendations resulting from the review.
The USGS WYWSC was last reviewed by the Office of Water Quality and Office of Groundwater during the summer 2011. No major deficiencies were found, and recommendations made were unrelated to the efforts involved with the proposed data collection activities at Pavillion, Wyo.
In addition to the USGS technical offices described in this section, the USGS also maintains a Branch of Quality Systems (BQS) (http://bqs.usgs.gov/). The BQS conducts evaluations of USGS field and laboratory quality assurance. The National Field Quality Assurance (NFQA) Program was created to provide quality-assurance reference samples to field personnel who make field water-quality measurements. The program monitors the proficiency of alkalinity, pH, and specific conductance measurements determined by water-quality field analysts. The USGS WYWSC field analysts are all participants in the NFQA Program. BQS laboratory programs focus on evaluating the USGS National Water Quality Laboratory (NWQL) and USGS sediment laboratories.
Most of the chemical analyses for the USGS samples will be done by TAL, under contract to the USGS NWQL. Both the NWQL and TAL are accredited by the National Environmental Laboratory Accreditation Conference Institute (TNI; http://www.nelac-institute.org/), actively participate in the TNI National Environmental Laboratory Accreditation Program (NELAP), and participate in the proficiency testing program specified by TNI. Most TAL methods comply with the most current version of the

22
Department of Defense Quality Systems Manual (http://www.denix.osd.mil/edqw/upload/QSM-V4-2-Final-102510.pdf) and provide technical and quality-assurance information for USGS studies preparing and using the Uniform Federal Policy of Quality Assurance Project Plans (U.S. Environmental Protection Agency, 2005) or other study-specific QAPPs. The TAL Arvada participates in the USGS Standard Reference Sample (SRS) Program and is currently in the approval process of the USGS BQS Laboratory Evaluation Program. Additional information on both of these programs is available at the USGS BQS website available at http://bqs.usgs.gov/srs/. As the primary subcontractor to the NWQL, TAL’s Arvada laboratory is also audited on an annual basis as part of the NWQL’s Quality Management System, with the most recent audit being performed by members of the NWQL quality staff in November 2011.
Field Quality Control Collection of QC samples is critical for evaluating the procedures and protocols used during
sampling, as well as providing confirmatory information concerning concentration values for target analytes. Many different types of QC samples are necessary. Although some of these samples are complementary, each type of QC sample provides different information about site conditions, sampling equipment and procedures, sample preservation, sample transport, and laboratory procedures and analytical methods.
Several QC samples are described in this section because they are collected in the field. The QC samples to be collected during this study include source-solution blanks, ambient blanks, field blanks, replicates, matrix spikes, matrix spike duplicates, trip blanks, and temperature blanks. Some of these QC sample types and definitions differ from those used by USEPA. Equivalent USEPA terms were determined by comparing the QC samples listed in this section with descriptions of QC samples published in USEPA SW-846 Chapter 1 and a USEPA table available at http://www.epa.gov/superfund/programs/dfa/download/qctable.pdf, which is a summary of quality-control samples and the information they provide (U.S. Environmental Protection Agency, 1996a; 2011b). In the following descriptions of QC samples, equivalent USEPA terms are indicated in parentheses. The schedule for QC sample collection is presented in table 8. A brief description of each type of QC sample follows:
• Source-solution blanks are collected by pouring certified organic-grade blank water directly into the sample vial or bottle in the office, laboratory, hotel, or other clean area on the day of sampling, before going to the field. These blanks are used to determine if the blank water, sample container, or preservation chemicals are contaminated. One source-solution blank will be included with each set of VOC, glycol, gasoline range organics (GRO), and dissolved gas samples sent to the laboratory in 40-mL vials. Sample bottles used to collect source-solution blanks are provided by the selected laboratory. The blank water used in source-solution blanks will be from the same source as will be used to prepare ambient and field blanks.
• Ambient blanks (USEPA also calls these pour or field blanks) are collected by pouring certified organic-grade blank water directly into the sample vial or bottle in the field and are used to determine if the environment in which samples are collected will contribute to sample contamination. Ambient blanks are preserved in the same manner as environmental samples.
• Field blanks (USEPA equipment blanks or rinsate blanks) consist of certified organic or inorganic blank water (depending on the type of analysis) that has been processed through the sampling system after field cleaning and is subjected to all aspects of sample

23
collection, field processing, preservation, transportation, cleaning, and laboratory handling as the environmental sample. Field blanks are used to evaluate the adequacy of field equipment cleaning, and the cleanliness of sample collection, processing, storage, and transport protocols. For this study, field blanks will be collected by passing water through the entire sample tubing, from the connection to the well spigot, through the sampling chamber, and the capsule filter (for filtered samples), before the sample tubing is connected to the well to collect analytical samples. For filtered blanks, a peristaltic pump with a small piece of precleaned silicone tubing (this tube also will be used during collection of filtered inorganics) will be used to push the sample from the sample tubing through the capsule filter. A separate piece of precleaned silicone tubing will be used for sampling at each well.
• Replicate samples are two or more samples collected or processed so that the samples are considered to be essentially identical in composition. Replicate samples will be used to evaluate the reproducibility (precision) of analyte concentration values reported by the laboratory. Although two replicates are not adequate to assess precision, they can be used to show whether variability of results for the samples is within the range of expected precision based on the larger dataset available to the laboratory.
• Matrix spike and matrix spike duplicate samples are environmental samples that will be fortified (spiked) in the laboratory with a known mass of the analyte(s) of interest. These samples are used to assess the potential bias for organic and inorganic analytes in a particular sample matrix. In spiked samples, the bias is estimated by calculating the percentage of each added analyte that is measured (recovered) in the sample. Bias can be either positive or negative with possible recoveries greater than or less than 100 percent. Because these samples are spiked at the laboratory, a separate sample aliquot will be collected and identified for this purpose. Custom spike solutions have been determined for selected organic and inorganic compounds identified by USEPA (Table 3, U.S. Environmental Protection Agency, 2011a). These spike solutions will be purchased by the USGS and provided to TAL to use as spike solutions, in addition the spike solutions TAL regularly uses.
• Trip blanks are VOC samples of analyte-free water that are prepared in the laboratory. Trip blanks will be supplied by each laboratory providing VOC, GRO, and dissolved hydrocarbon gas (ethane, ethane, methane, and propane) analyses and will be transported with VOC bottles to the field, kept with these sample bottles throughout sampling, and then returned to the laboratory for analysis with environmental samples. Trip blanks are used to identify contamination introduced during sample transport and storage.
• Temperature blanks (cooler blank) are sample bottles of deionized water included in each shipping container so that the laboratory can measure the internal temperature of the sample upon receipt. If the internal temperature of the temperature blank is at or below the required holding temperature, it is assumed that all other containers in the cooler also meet the required holding temperature.
In addition to the QC samples described previously, the USEPA has requested that USGS submit proficiency samples to TAL. These proficiency samples will be used to validate TAL’s ability to measure particular compounds of interest. USEPA will provide the USGS WYWSC with proficiency samples that will be forwarded as blind samples to TAL. Laboratory contact information is shown in table 9.
24
Laboratory Quality Control Laboratory QC samples are used to evaluate the performance of the analytical methods. The QC
measures used by laboratories while performing analytical tests, including both internal and external QC audits and performance evaluations, are described in each laboratory’s quality-assurance manual—TestAmerica Laboratories (2010), NWQL Quality Management System (Maloney, 2005), and Isotech Laboratories, Inc. (2009). For laboratory specific QC information contact the analyzing laboratory (table 9). A summary of laboratory QA/QC requirements including acceptance or performance limits of analyses performed by TestAmerica Laboratories, the primary laboratory to be used by USGS in this study, is included in table 10.
Data Management and Reporting USGS laboratories and USGS contract laboratories routinely transmit analytical results
electronically. All laboratories analyzing samples for this study will be requested to complete data packages including electronic results. The results for the analyses from this study will be stored in the NWIS database. Additional paper reports will be stored in study files. All data that meet or exceed the method detection limit (MDL) will be entered into the NWIS database. The MDL is the minimum concentration of a substance that can be measured and reported with 99 percent confidence that the analyte concentration is greater than zero (U.S. Code of Federal Regulations, 2011). Although compounds are detected with concentrations greater than the MDL, they will not be published in NWIS without qualification unless concentrations are greater than the laboratory reporting level (LRL).
If a water-quality result is measured at a concentration less than the MDL, it will be reported as less than the LRL, with a “<” remark code. The value following the “<” symbol will be the LRL associated with that analysis. If a measured value is greater than the MDL but less than the LRL, it will be reported as the measured value, but qualified with an “E” remark code, indicating an increased level of uncertainty.
Data Review All data collected in the field and generated by the laboratories will be extensively reviewed
before release of the data to identify unreliable or invalid field and laboratory measurements. The data review process is used to qualify data for interpretive use. As part of the review process for this study, chemical data (along with a full data package) received from TAL will be sent to a USGS NWQL data validation contractor. Data validation services include the following:
• Receipt of the laboratory data package from the USGS, and logging/securing the data package into a document control system;
• Assemble analytical documents and data to be validated, and review data records to determine method, procedural, and contractual requirements needed and completeness of the data package. If needed, acquire necessary supplements or corrections to the data packages;
• Review and validate the reported analytical results collectively for the data package as a whole, including laboratory data qualifiers in accordance with the appropriate criteria and guidelines;
• Summarize data and quality control (QC) deficiencies and evaluate the effect on overall data quality; and
• Assign appropriate data validation qualifiers as necessary and prepare a data validation report.

25
The following steps will be followed by USGS staff while reviewing field and laboratory data: • All field and laboratory data will be reviewed promptly for possible transcription errors,
data omissions, and suspect or anomalous values. If reported results are considered suspect, analysis reruns may be requested. If other problems are noted, corrective actions will be taken by appropriate personnel.
• Laboratory sample receipt forms will be reviewed to determine if all samples listed on the ASR/CoC form were received and if coolers were received with an internal temperature of 4 ± 2 degrees Celsius. Many samples require chilling as a preservation method and analytical data will be flagged (qualified) if recommended temperatures are not met.
• The CoC forms will be reviewed to verify samples were analyzed for requested constituents, using required preservatives, and within specified holding times. Results that do not meet preservation and holding time requirements will be flagged.
• Compounds with results for both filtered and unfiltered samples will be compared. Filtered (dissolved) sample concentrations should be equal to or less than unfiltered (total) sample concentrations. Sample results with filtered concentrations greater than unfiltered concentrations will be flagged.
• Field and laboratory blank results will be reviewed and evaluated relative to the concentrations detected in the environmental samples. If an analyte is detected in a field blank, the following actions will be taken, depending on concentrations of the analyte measured in the field blank (CB) and the associated environmental samples (CS):
Relation of CS to CB NWIS database modification
Use in data interpretation
CS > 10 x CB No action No action 3 x CB ≤ CS ≤ 10 x CB Add an “E” remark code No action CS < 3 x CB and CS ≤ LRL Add a “V” remark code Change CS to “< LRL”
CS < 3 x CB and CS > LRL Add a “V” remark code Change CS to “< CS”
The “E” remark code indicates an increased level of uncertainty, and the “V” code indicates that the value could be affected by contamination.
• Variability will be determined from replicate samples and incorporated into the evaluation.
• Percent recoveries will be determined from spiked samples and used to evaluate the concentrations found in the environmental samples relative to the concentrations that may actually be in the environment.
All relevant information provided by the laboratories and used in QA/QC analysis of the data will be included in an appendix in the final USGS Data Series Report and available to the public online or will be available in USGS files at the WYWSC.
Health and Safety Under direction of USGS Central Region Program Memorandum 2000.01, a Job Hazard
Analysis (JHA) has been prepared for this study and will be provided to field personnel and reviewed during a “tailgate” safety session each morning onsite. The JHA includes an assessment of job tasks; potential hazards, unsafe acts, or conditions; required personal protective equipment and job
26
responsibilities; and telephone contacts. A copy of the JHA for this study has been attached as appendix E. Additional health and safety considerations are addressed in the USGS National Field Manual for the Collection of Water-Quality Data chapter on Safety in Field Activities (Lane and Fay, 1998). Personnel collecting samples from USEPAs wells MW01 and MW02 are required to be Hazwoper certified.
References Cited ASTM International, 2007, Standard guide for sampling ground-water monitoring wells: West
Conshohocken, Pa., ASTM D4448–01, 17 p. ASTM International, 2010, Standard test method for analysis of natural gas by gas chromatography,
ASTM D1945, accessed July 18, 2012, at http://www.astm.org/Standards/D1945.htm. Bennett Sample Pumps, Inc., 2012, Bennett sample pumps brochure: Amarillo, Tex., Bennett Sample
Pumps, Inc., accessed August 31, 2012, at http://www.bennettsamplepump.com/Brochureemail.pdf. Bullister, J.L., 1984, Atmospheric chlorofluoromethanes as tracers of ocean circulation and mixing—
Studies in the Greenland and Norwegian seas: La Jolla, Calif., University of California, San Diego, unpublished Ph.D. dissertation, 172 p.
Bullister, J.L., and Weiss, R.F., 1988, Determination of CFC3F and CCl2F2 in seawater and air: Deep Sea Research, v. 35, p. 839–854.
Busenberg, E., and Plummer, L.N., 2000, Dating young ground water with sulfur hexafluoride—Natural and anthropogenic sources of sulfur hexafluoride: Water Resources Research, v. 36, p. 3,011–3,030.
Carmeuse Natural Chemicals, 2012, Technical Bulletin--Water well gravel pack and Colorado Silica Sand®: Pittsburgh, Pa., Carmeuse Industrial Sands, accessed July 27, 2012, at http://premiersilicasf.
blob.core.windows.net/sitefinity-container/docs-brochures/colorado_operations.pdf?sfvrsn=2Clescerl, L.S., Greenberg, A.E., and Eaton, A.D., eds., 1998, Standard methods for the examination of
water and wastewater (20th ed.): Washington D.C., American Public Health Association, American Water Works Association and Water Environment Federation, Standard Methods 3120, p. 3–37 to 3–43.
Cunningham, W.L., and Schalk, C.W., comps., 2011a, Groundwater technical procedures of the U.S. Geological Survey, GWPD 2—Identifying a minimum set of data elements to establish a groundwater site: U.S. Geological Survey Techniques and Methods 1–A1, 10 p.
Cunningham, W.L., and Schalk, C.W., comps., 2011b, Groundwater technical procedures of the U.S. Geological Survey, GWPD 4—Measuring water levels by use of an electric tape: U.S. Geological Survey Techniques and Methods 1–A1, 6 p.
Cunningham, W.L., and Schalk, C.W., comps., 2011c, Groundwater technical procedures of the U.S. Geological Survey, GWPD 1—Measuring water levels by use of a graduated steel tape: U.S. Geological Survey Techniques and Methods 1–A1, 4 p.
Cunningham, W.L., and Schalk, C.W., comps., 2011d, Groundwater technical procedures of the U.S. Geological Survey, GWPD 16—Measuring water levels in wells and piezometers by use of a submersible pressure transducer: U.S. Geological Survey Techniques and Methods 1–A1, 6 p.
Cunningham, W.L., and Schalk, C.W., comps., 2011e, Groundwater technical procedures of the U.S. Geological Survey: U.S. Geological Survey Techniques and Methods 1–A1, 151p.
Garber, M.S., and Koopman, F.C., 1968, Methods of measuring water levels in deep wells: U.S. Geological Survey Techniques of Water-Resources Investigations, book 8, chap. A1, 23 p.
Gibs, Jacob, and Imbrigiotta, T.E., 1990, Well-purging criteria for sampling purgeable organic compounds: Ground Water, v. 28, no. 1, p. 68-78.
27
James Gores and Associates, 2011, Pavillion area water supply, Level I study: Riverton, Wyo., James Gores and Associates, P.C. Report, 136 p.
HACH, 2007, DR 2800 Spectrophotometer procedures manual, June (2d ed.), accessed February 27, 2012, at http://www.hach.com/dr-2800-portable-spectrophotometer-with-lithium-ion-battery/product-downloads?id=7640439012&callback=qs.
Horowitz, A.J., Demas, C.R., Fitzgerald, K.K., Miller, T.L., and Rickert, D.A., 1994, U.S. Geological Survey protocol for the collection and processing of surface-water samples for the subsequent determination of inorganic constituents in filtered water: U.S. Geological Survey Open-File Report 94–539, 57 p.
Isotech Laboratories Inc., 2009, Quality assurance plan for Isotech Laboratories, Inc.: Champaign, Ill., Isotech Laboratories, Inc., 27 p.
Karlen, I., Olsson, I.U., Kallburg, P., and Kilici, S., 1964, Absolute determination of the activity of two 14C dating standards: Arkiv Geofysik, v. 4, p. 465–471.
Koterba, M.T., Wilde, F.D., and Lapham, W.W., 1995, Ground-water data-collection protocols and procedures for the National Water-Quality Assessment Program—Collection and documentation of water-quality samples and related data: U.S. Geological Survey Open-File Report 95–399, 113 p.
Lane, S.L., and Fay, R.G., 1997, Safety in field activities: U.S. Geological Survey Techniques of Water-Resources Investigations, book 9, chap. A9, October 1997, accessed January 18, 2012, at http://water.usgs.gov/owq/FieldManual/Chap9/chap9.pdf
Law, C.S., Watson, A.J., and Liddicoat, M.I., 1994, Automated vacuum analysis of sulfur hexafluoride in seawater—Derivation of the atmospheric trend (1979–1993) and potential as a transient tracer: Marine Chemistry, v. 48, p. 57–69.
Maiss, Manfred, Ilmberger, J., Zenger, A., and Munnich, K.O., 1994, A SF6 tracer study of horizontal mixing in Lake Constance: Aquatic Sciences, v. 56, no. 4, p. 307–328.
Maloney, T.J., ed., 2005, Quality management system, U.S. Geological Survey National Water Quality Laboratory: U.S. Geological Survey Open-File Report 2005-1263, version 1.3, 9 November 2005, chapters and appendixes variously paged.
National Groundwater Association, 2009, Subcommittee on ground water—A national framework for ground-water monitoring in the United States: Advisory Committee on Water Information, 81 p.
Olsson, I.U., 1970, The use of oxalic acid as a standard, in Olsson, I.U., ed., Radiocarbon variations and absolute chronology, Proceedings of the 12th Nobel Symposium: New York, John Wiley and Sons,
p. 17. Pankow, J.F., 1986, Magnitude of artifacts caused by bubbles and headspace in groundwater
determination of volatile compounds in water: Analytical Chemistry, v. 58, p. 1,822–1,826. Pankow, J.F., 1990, Minimization of volatilization gasses during sampling and analysis of volatile
organic compounds, in Ram, N.M., Christman, R.N., and Cantor, K.P., eds., Significance and treatment of volatile organic compounds in water supplies: Chelsea, Mich., Lewis Publishers, Inc., p. 73–86.
Plafcan, M., Eddy-Miller, C.A., Ritz, G.F., and Holland, J.P.R., II, 1995, Water resources of Fremont County, Wyoming: U.S. Geological Survey Water-Resources Investigations Report 95–4095, 133 p.
Puls, R.W., and Barcelona, M.J., 1996, Low-flow (minimal drawdown) ground-water sampling procedures: U.S. Environmental Protection Agency, EPA/540/S–95/504, 12 p.
Rasmussen, R.A., and Khalil, M.A.K., 1983a, Interlaboratory comparison, preparation, and stability of dichlorofluoromethane samples and standards: Analytical Chemistry, v. 55, p. 1,834–1,836.
Rasmussen, R.A., and Khalil, M.A.K., 1983b, Rare trace gases at the South Pole: Antarctic Journal of the United States, v. 18, p. 250–252.

28
Révész, Kinga, and Coplen, Tyler, B., 2008a, Determination of the δ(18O/16O) of water—RSIL lab code 489, chap. C2 of Révész, Kinga, and Coplen, Tyler B., eds., Methods of the Reston Stable Isotope Laboratory: U.S. Geological Survey Techniques and Methods, 10–C2, 28 p.
Révész, Kinga, and Coplen, T.B., 2008b, Determination of the δ (2H/1H) of water—RSIL lab code 1574, chap. C1 of Révész, Kinga, and Coplen, T.B., eds., Methods of the Reston Stable Isotope Laboratory: U.S. Geological Survey Techniques and Methods 10–C1, 27 p.
Révész, K.M., and Doctor, D.H., 2012, Automated determination of the stable carbon isotopic composition of total dissolved inorganic carbon (DIC) and total nonpurgeable dissolved organic carbon (DOC) in aqueous samples: RSIL lab codes 1851 and 1852 chap. 20 of Stable isotope-ratio methods, sec. C of Révész, K.M., and Coplen, T.B., eds., Methods of the Reston Stable Isotope Laboratory: U.S. Geological Survey Techniques and Methods, book 10.
Reynolds, G.W., Hoff, J.T., and Gillham, R.W., 1990, Sampling bias caused by materials used to monitor halocarbons in groundwater: Environmental Science and Technology, v. 24, p. 135–142.
Rounds, S.A., 2006, Alkalinity and acid neutralizing capacity (version 3.0): U.S. Geological Survey Techniques of Water-Resources Investigations, book 9, chap. A6., sec. 6.6, accessed February 27, 2012, at http://water.usgs.gov/owq/FieldManual/Chapter6/section6.6/pdf/6.6.pdf.
Sandstrom, M.W., 1990, Sampling requirements for organic contaminants: Cincinnati, Ohio, Management Challenges of New Monitoring Requirements for Organic Chemicals, American Water Works Association Seminar Proceedings, p. 71–85.
Shapiro, A.M., 2001, Characterizing ground-water chemistry and hydraulic properties of fractured rock aquifers using the multifunction Bedrock-Aquifer Transportable Testing Tool (BAT3): U.S. Geological Survey Fact Sheet FS–075–01, 4 p.
Sliwka, I., and Lasa, J., 2000, Optimisation of the head-space method in measuring SF6 concentration in water: Chemical Analysis (Warsaw), v. 45, p. 59–72.
Stuiver, Minze, and Polach, H.A., 1977, Discussion—Reporting of 14C data: Radiocarbon, v. 19, no. 3, p. 355–363.
Stuiver, Minze, 1980,Workshop on 14C data reporting: Radiocarbon, v. 22, no. 3, p. 964 –966. Stute, Martin, Clark, J.F., Schlosser, P., Broecker, W.S., and Bonani, G., 1995, A 30,000 yr continental
paleotemperature record derived from noble gases dissolved in groundwater from the San Juan Basin, New Mexico: Quaternary Research, v. 43, p. 209–220.
TestAmerica Laboratories, 2010, Quality assurance manual: Denver, Colo., TestAmerica Laboratories, 157 p.
Thatcher, L.L., Janzer, V.J., and Edwards, K.W., 1977, Methods for the determination of radioactive substances in water and fluvial sediments: U.S. Geological Survey Techniques of Water-Resources Investigations, book 5, chap. A5, p. 79–81.
U.S. Census Bureau, 2010, 2010 Census interactive population search, accessed on January 21, 2012, at http://2010.census.gov/2010census/popmap/ipmtext.php?fl=56.
U.S. Code of Federal Regulations, 2011, Title 40, v. 23, part 136, Appendix B. Definition and procedure for the determination of the method detection limit—Revision 1.11: Washington, D.C., U.S. Government, p. 343–345.
U.S. Environmental Protection Agency, 1980a, Prescribed procedures for measurement of radioactivity in drinking water, EPA-600/4-80-032: Cincinnati, Ohio, U.S. Environmental Protection Agency, Environmental Monitoring and Support Laboratory, Office of Research and Development, section 7, p. 38–48.
U.S. Environmental Protection Agency, 1980b, Prescribed procedures for measurement of radioactivity in drinking water, EPA-600/4-80-032: Cincinnati, Ohio, U.S. Environmental Protection Agency,

29
Environmental Monitoring and Support Laboratory, Office of Research and Development, section 8, p. 49–57.
U.S. Environmental Protection Agency, 1983, Methods for chemical analysis of water and wastes, method 425.1: Cincinnati, Ohio, U.S. Environmental Protection Agency, Environmental Monitoring and Support Laboratory, Office of Research and Development, 2 p.
U.S. Environmental Protection Agency, 1993a, Determination of ammonia nitrogen by automated colorimetry, rev. 2., method 350.1: Cincinnati, Ohio, U.S. Environmental Protection Agency, Environmental Monitoring Systems Laboratory, Office of Research and Development, 15 p.
U.S. Environmental Protection Agency, 1993b, Determination of nitrate-nitrite nitrogen by automated colorimetry, rev. 2., method 353.2: Cincinnati, Ohio, U.S. Environmental Protection Agency, Environmental Monitoring Systems Laboratory, Office of Research and Development, 14 p.
U.S. Environmental Protection Agency, 1993c, Determination of phosphorus by semi-automated colorimetry, rev. 2., method 353.2: Cincinnati, Ohio, U.S. Environmental Protection Agency, Environmental Monitoring Systems Laboratory, Office of Research and Development, 17 p.
U.S. Environmental Protection Agency, 1994, Sample preparation and calculations for dissolved gas analysis in water samples using a GC headspace equilibration technique, RSKSOP-175, rev. 0, August 1994: Ada, Okla., U.S. Environmental Protection Agency, R.S. Kerr Environmental Research Laboratory, 14 p.
U.S. Environmental Protection Agency, 1996a, Test methods for evaluating solid waste, physical/chemical methods, SW-846 (3d ed.), update IV; Chapter 1—Quality control, rev. 1: Washington D.C., U.S. Environmental Protection Agency, p. 30, accessed January 31, 2012, at http://www.epa.gov/epawaste/hazard/testmethods/sw846/pdfs/chap1.pdf.
U.S. Environmental Protection Agency, 1996b, Test methods for evaluating solid waste, physical/chemical methods, SW-846 (3d ed.), update IV; method 8260B, volatile organic compounds by gas chromatography/mass spectrometry (GC/MS): Washington D.C., U.S. Environmental Protection Agency, 92 p., accessed July 19, 2012, at http://www.epa.gov/osw/hazard/testmethods/sw846/pdfs/8260b.pdf.
U.S. Environmental Protection Agency, 1996c, Test methods for evaluating solid waste, physical/chemical methods, SW-846 (3d ed.), update IV; method 8270C, semivolatile organic compounds by gas chromatography/mass spectrometry (GC/MS): Washington D.C., U.S. Environmental Protection Agency, 54 p.
U.S. Environmental Protection Agency, 1996d, Test methods for evaluating solid waste, physical/chemical methods, SW-846 (3d ed.), update IV; method 6020A, inductively coupled plasma-mass spectrometry: Washington D.C., U.S. Environmental Protection Agency, 30 p.
U.S. Environmental Protection Agency, 1996e, Test methods for evaluating solid waste, physical/chemical methods, SW-846 (3d ed.), update IV; method 9056A, determination of inorganic anions by ion chromatography: Washington D.C., U.S. Environmental Protection Agency, 19 p.
U.S. Environmental Protection Agency, 1996f, Test methods for evaluating solid waste, physical/chemical methods, SW-846 (3d ed.), update IV; method 6010b, inductively coupled plasma-atomic emission spectrometry: Washington D.C., U.S. Environmental Protection Agency, 25 p.
U.S. Environmental Protection Agency, 1996g, Test methods for evaluating solid waste, physical/chemical methods, SW-846 (3d ed.), update IV; method 7470A, mercury in liquid waste (manual cold-vapor technique): Washington D.C., U.S. Environmental Protection Agency, 6 p.
U.S. Environmental Protection Agency, 1996h, Test methods for evaluating solid waste, physical/chemical methods, SW-846 (3d ed.), update IV; method 8015B, nonhalogenated organics using GC/FID, rev. 2: Washington D.C., U.S. Environmental Protection Agency, [variously paged].

30
U.S. Environmental Protection Agency, 1996i, Test methods for evaluating solid waste, physical/chemical methods, SW-846 (3d ed.), update IV; method 9060, total organic carbon: Washington D.C., U.S. Environmental Protection Agency, 5 p.
U.S. Environmental Protection Agency, 2002, Standard operating procedure for chain of custody samples: U.S. Environmental Protection Agency, Office of Environmental Measurement and Evaluation, New England–Region 1, March 25, 2002, 10 p.
U.S. Environmental Protection Agency, 2005, Intergovernmental Data Quality Task Force—Uniform Federal Policy for Quality Assurance Project Plans—Evaluating, assessing, and documenting environmental data collection and use programs—Part 1. UFP-QAPP Manual: U.S. Environmental Protection Agency EPA-505-B-04-900A, accessed July 18, 2012, at http://www.epa.gov/fedfac/pdf/ufp_qapp_v1_0305.pdf.
U.S. Environmental Protection Agency, 2011a, Investigation of ground water contamination near Pavillion, Wyoming: U.S. Environmental Protection Agency Report EPA–600–R–00–000, 104 p.
U.S. Environmental Protection Agency, Superfund Division, 2011b, Summary of quality control samples and the information they provide, accessed January 30, 2012, at http://www.epa.gov/superfund/programs/dfa/download/qctable.pdf.
U.S. Geological Survey, variously dated, National field manual for the collection of water-quality data: U.S. Geological Survey Techniques of Water-Resources Investigations, book 9, chaps. A1–A9, accessed January 30, 2012, at http://water.usgs.gov/owq/FieldManual/.
U.S. Geological Survey, 2006, Collection of water samples (ver. 2.0): U.S. Geological Survey Techniques of Water-Resources Investigations, book 9, chap. A4, accessed January 10, 2012, at http://water.usgs.gov/owq/FieldManual/chapter4/pdf/Chap4_v2.pdf.
U.S. Geological Survey, 2012, The Reston Chlorofluorocarbon Laboratory—Analytical procedures for dissolved gasses N2/Ar, accessed July 13, 2012, at http://water.usgs.gov/lab/dissolved-gas/lab/analytical_procedures/.
Wanninkhof, Rik, Ledwell, J.R., and Watson, A.J., 1991, Analysis of sulfur hexafluoride in seawater: Journal of Geophysical Research, v. 96, no. C5, p. 8733–8740.
Wilde, F.D., ed., 2004, Cleaning of equipment for water sampling (ver. 2.0): U.S. Geological Survey Techniques of Water-Resources Investigations, book 9, chap. A3, , accessed January 12, 2012, at http://water.usgs.gov/owq/FieldManual/chapter3/final508Chap3book.pdf.
Wilde, F.D., ed., 2006, Collection of water samples (ver. 2.0): U.S. Geological Survey Techniques of Water-Resources Investigations, book 9, chap. A4, , accessed January 13, 2012, at http://water.usgs.gov/owq/FieldManual/chapter4/pdf/Chap4_v2.pdf.
Wilde, F.D., and Skrobialowski, S.C., 2011, U.S. Geological Survey protocol for sample collection in response to the Deepwater Horizon oil spill, Gulf of Mexico, 2010: U.S. Geological Survey Open-File Report 2011–1098, 178 p., accessed January 13, 2012, at http://pubs.usgs.gov/of/2011/1098/. (Supersedes USGS Open-File Report 2010–1191.)
Wilde, F.D., Radke, D.B., Gibs, Jacob, and Iwatsubo, R.T., eds., 2004 with updates through 2009, Processing of water samples (ver. 2.2): U.S. Geological Survey Techniques of Water-Resources Investigations, book 9, chap. A5, April 2004, accessed January 17, 2012, at http://water.usgs.gov/owq/FieldManual/chapter5/pdf/chap5_2-2009.pdf.
Yeskis, Douglas, and Zavala, Bernard, 2002,Groundwater sampling guidelines for Superfund and RCRA project managers—Ground Water Forum Issue Paper: U.S. Environmental Protection Agency, EPA/542/S–02/001, 53 p., accessed July 17, 2012, at http://www.epa.gov/tio/tsp/download/gw_sampling_guide.pdf.

31
Table 1. Key organizational responsibilities of on-site personnel. [USGS, U.S. Geological Survey; SAP, Sampling and Analysis Plan; QA/QC, quality assurance/quality control; WDEQ, Wyoming Department of Environmental Quality; WOGC, Wyoming Oil and Gas Commission]
Key personnel Organization Role Responsibility David Mott USGS Site management Coordinates with other agencies, media, and local
residents’ concerns. Peter Wright USGS Project chief Leads sampling crew and ensures SAP is followed. Dave Mueller USGS Quality
Assurance/Quality Control manager
Tracks QA/QC requirements, assures implementation, documents use.
Scott Edmiston
USGS Field technician Assist with sampling as directed by project chief.
Pete McMahon USGS Technical advisor Assist with quantification of well hydraulics and planning for monitoring well MW02 sampling.
Deborah Harris WDEQ Purge water manager Coordinate contract water collection and disposal and on-site requirements.
Tom Kropatsch WOGC Safety monitoring Monitors gas sensors in USGS mobile laboratory.
Table 2. List of agencies and organizations participating with the technical team and organizational responsibilities during this study.
[SAP, Sampling and Analysis Plan; ORD, USEPA Office of Research and Development]
Agency or organization Responsibilities Wyoming Department of Environmental Quality (WDEQ)
Cheyenne, Wyoming Cooperating agency responsible for supporting this study of
characterization of groundwater quality.
U.S. Geological Survey (USGS) Wyoming Water Science Center Cheyenne, Wyoming
Responsible for compilation of the SAP and collection of groundwater-quality samples.
U.S. Environmental Protection Agency, Region 8 and ORD Denver, Colorado and Ada, Oklahoma
Well owners and principal investigators in the Pavillion, Wyo. groundwater investigation.
Wind River Indian Reservation Tribal concerns.
USGS Office of Water Quality Reston, Virginia
Leadership of Technical Team, technical assistance.
USGS Water Science Field Team Denver, Colorado
Study quality control and agency protocol adherence.
USGS National Water Quality Laboratory Denver, Colorado
Technical advice regarding protocols and methods and management of USGS contract with Test America Laboratories.
TestAmerica Laboratories Arvada, Colorado
USGS contract laboratory, providing technical input regarding their capabilities.

32
Table 3. Laboratory analytical methods, approaches, and method references. [USEPA, U.S. Environmental Protection Agency; TAL, TestAmerica Laboratories; SIM, selective ion monitoring; DAI, direct aqueous injection; LC, U.S. Geological Survey laboratory code; BTEX, the compounds benzene, toluene, ethylbenzene, and xylene; MTBE, methyl tert-butyl ether; RSKSOP, Robert S. Kerr Environmental Research Laboratory standard operating procedure.; NWQL, National Water Quality Laboratory; RCFC, U.S. Geological Survey Reston Chlorofluorocarbon Laboratory; RSIL U.S. Geological Survey Reston Stable Isotopes Laboratory; δ18O, ratio of oxygen-18 to oxygen-16 relative to a reference standard; δ2H, ratio of hydrogen-2 to hydrogen-1 relative to a reference standard; δ13C, ratio of carbon-13 to carbon-12; MPTL, U.S. Geological Survey Menlo Park Tritium Laboratory; WHOI-NOSAMS, Woods Hole Oceanographic Institution-National Ocean Sciences Accelerator Mass Spectrometry Facility; --, not available]
Method number Analytical laboratory Description Analytical approach Reference
USEPA method 8260B
TAL Volatile organic compounds (VOCs) including ethanol, isobutanol, isopropyl alcohol
Full scan gas chromatography with mass spectroscopy
U.S. Environmental Protection Agency, 1996b
USEPA method 8270C and 8270/SIM
TAL Semivolatile compounds Full scan gas chromatography with mass spectroscopy
U.S. Environmental Protection Agency, 1996c.
USEPA method 6020 (for both total and dissolved metals)
TAL Metals: antimony, arsenic, barium, beryllium, cadmium, chromium, cobalt, copper, lead, manganese, molybdenum, nickel, selenium, silver, thallium, uranium, vanadium, zinc
Inductively coupled plasma–mass spectrometry
U.S. Environmental Protection Agency, 1996d.
USEPA method 9056
TAL Anions: bromide, chloride, fluoride, sulfate
Ion chromatography U.S. Environmental Protection Agency, 1996e.
USEPA method 6010B (for both total and dissolved metals)
TAL Metals: aluminum, boron, calcium, iron, lithium, magnesium, potassium, silicon, sodium, strontium, titanium
Inductively coupled plasma–atomic emission spectrometry
U.S. Environmental Protection Agency, 1996f.
USEPA method 7470A (for both total and dissolved mercury)
TAL Mercury Manual cold-vapor technique U.S. Environmental Protection Agency, 1996g.
Method 2540C TAL Total dissolved solids Evaporation Clescerl and others, 1998. USEPA method
350.1 TAL Nitrogen, ammonia Automated colorimetry U.S. Environmental Protection Agency,
1993a. USEPA method
353.2 TAL Nitrate + nitrite Automated colorimetry U.S. Environmental Protection Agency,
1993b. USEPA method
365.1 TAL Phosphorus, dissolved, total Semi-automated colorimetry U.S. Environmental Protection Agency,
1993c.

33
Table 3. Laboratory analytical methods, approaches, and method references.—Continued [USEPA, U.S. Environmental Protection Agency; TAL, TestAmerica Laboratories; SIM, selective ion monitoring; DAI, direct aqueous injection; LC, U.S. Geological Survey laboratory code; BTEX, the compounds benzene, toluene, ethylbenzene, and xylene; MTBE, methyl tert-butyl ether; RSKSOP, Robert S. Kerr Environmental Research Laboratory standard operating procedure.; NWQL, National Water Quality Laboratory; RCFC, U.S. Geological Survey Reston Chlorofluorocarbon Laboratory; RSIL U.S. Geological Survey Reston Stable Isotopes Laboratory; δ18O, ratio of oxygen-18 to oxygen-16 relative to a reference standard; δ2H, ratio of hydrogen-2 to hydrogen-1 relative to a reference standard; δ13C, ratio of carbon-13 to carbon-12; MPTL, U.S. Geological Survey Menlo Park Tritium Laboratory; WHOI-NOSAMS, Woods Hole Oceanographic Institution-National Ocean Sciences Accelerator Mass Spectrometry Facility; --, not available]
Method number Analytical laboratory Description Analytical approach Reference
USEPA method 8015B
TAL Diesel range organics Gas chromatography/flame ionization detection
U.S. Environmental Protection Agency, 1996h.
USEPA method 8015B DAI in water (8015B)
TAL Diethylene glycol, ethylene glycol, triethylene glycol, methanol, n-butanol
Gas chromatography/flame ionization detection
U.S. Environmental Protection Agency, 1996h.
USEPA method 8015B/8021 modified
TAL Gasoline range organics + BTEX + MTBE
Gas chromatography/ photoionization-flame ionization detection
U.S. Environmental Protection Agency, 1996h.
USEPA method 425.1
TAL Methylene blue active substances Ultraviolet-visible spectroscopy
U.S. Environmental Protection Agency, 1983.
RSKSOP-175 TAL Ethane, ethylene, methane, propane Gas chromatography headspace equilibration
U.S. Environmental Protection Agency, 1994.
USEPA method 9060
TAL Total carbon, total inorganic carbon, total organic carbon, dissolved organic carbon
Carbonaceous analyzer U.S. Environmental Protection Agency, 1996i.
LC 1369 NWQL Radon-222 Scintillation counting ASTM D 5072-98 (ASTM International, 2010)
LC 794, USEPA 903.1
Eberline Services
Radium-226 Radon emanation U.S. Environmental Protection Agency, 1980a.
LC 1364, USEPA 904.0 - modified
Eberline Services
Radium-228 Radiochemical separation and beta counting
U.S. Environmental Protection Agency, 1980b.
-- RCFC Chlorofluorocarbons Purge and trap gas chromatography procedure with an electron capture detector
Bullister, 1984; Bullister and Weiss, 1988; Pankow, 1986, 1990; Rasmussen and Khalil, 1983a, 1983b; Reynolds and others, 1990.
-- RCFC Dissolved gasses: nitrogen (N2), argon (Ar), methane (CH4), carbon dioxide (CO2), oxygen (O2)
Gas chromatography/flame ionization detection
U.S. Geological Survey, 2012.
-- RCFC Sulfur hexaflouride (SF6) Purge and trap gas chromatography procedure with an electron capture detector
Busenberg and Plummer, 2000; Law and others, 1994; Maiss and others, 1994; Sliwka and Lasa, 2000; Wanninkhof and others, 1991.

34
Table 3. Laboratory analytical methods, approaches, and method references.—Continued [USEPA, U.S. Environmental Protection Agency; TAL, TestAmerica Laboratories; SIM, selective ion monitoring; DAI, direct aqueous injection; LC, U.S. Geological Survey laboratory code; BTEX, the compounds benzene, toluene, ethylbenzene, and xylene; MTBE, methyl tert-butyl ether; RSKSOP, Robert S. Kerr Environmental Research Laboratory standard operating procedure.; NWQL, National Water Quality Laboratory; RCFC, U.S. Geological Survey Reston Chlorofluorocarbon Laboratory; RSIL U.S. Geological Survey Reston Stable Isotopes Laboratory; δ18O, ratio of oxygen-18 to oxygen-16 relative to a reference standard; δ2H, ratio of hydrogen-2 to hydrogen-1 relative to a reference standard; δ13C, ratio of carbon-13 to carbon-12; MPTL, U.S. Geological Survey Menlo Park Tritium Laboratory; WHOI-NOSAMS, Woods Hole Oceanographic Institution-National Ocean Sciences Accelerator Mass Spectrometry Facility; --, not available]
Method number Analytical laboratory Description Analytical approach Reference
-- RCFC/Lamont-Doherty
Dissolved gasses: helium (He), neon (Ne), argon (Ar), krypton (Kr), xenon (Xe)
Gas mass spectrometer with electrostatical analyzer
Stute and others, 1995.
LC 1142 RSIL Isotope ratios of oxygen (δ18O) and hydrogen (δ2H) in water
Double-focusing mass spectrometer (DI-IRMS)
Révész and Coplen, 2008a, 2008b.
-- RSIL Isotope ratio of carbon (δ13C) of dissolved inorganic carbon in water
Total inorganic carbon-total organic carbon method
Révész and Doctor, 2012
-- Isotech Complete compositional analysis Shimadzu 2010 gas chromatograph
Based on ASTM D1945 (ASTM International, 2010)
-- Isotech Isotope ratios of carbon (δ13C) and hydrogen (δ2H) in methane
Offline prep/dual inlet isotope ratio mass spectrometry
Industry approved method with no reference. Please contact Isotech for more detailed information.
LC 1565 MPTL Tritium (3H) Electrolytic enrichment—liquid scintillation
Thatcher and others, 1977.
LC 3212 WHOI-NOSAMS
Carbon-14 content of dissolved inorganic carbon
Accelerator mass spectrometer with gas ionization counter
Karlen and others, 1964; Olsson, 1970; Stuiver and Polach, 1977; Stuiver, 1980.

35
Table 4. List of age dating analytes the U.S. Geological Survey added to sampling that the U.S. Environmental Protection Agency has not collected and an explanation of their use.
[δ18O, ratio of oxygen-18 to oxygen-16 relative to a reference standard; δ2H, ratio of hydrogen-2 to hydrogen-1 relative to a reference standard; δ13C, ratio of carbon-13 to carbon-12]
Analytical laboratory Analytes Analytical approach Explanation of use Reston
Chlorofluorocarbon Laboratory
Chlorofluorocarbons Purge and trap gas chromatography procedure with an electron capture detector
Chlorofluorocarbons are used in hydrologic studies to trace the flow of young water and to determine the time elapsed since recharge (infiltration) to groundwater.
Reston Chlorofluorocarbon Laboratory
Dissolved gasses: nitrogen (N2), argon (Ar), methane (CH4), carbon dioxide (CO2), oxygen (O2)
Gas chromatography/flame ionization detection
Provides concentrations of these dissolved gases in groundwater.
Reston Chlorofluorocarbon Laboratory
Sulfur hexaflouride (SF6)
Purge and trap gas chromatography procedure with an electron capture detector
Sulfur hexafluoride (SF6) is used in hydrologic studies to trace the flow of young water and to determine the time elapsed since recharge (infiltration) to groundwater.
Lamont-Doherty Earth Observatory
Dissolved noble gasses: helium (He), neon (Ne), argon (Ar), krypton (Kr), xenon (Xe)
mass spectroscopy Helium together with its isotopes could give particular information of detailed hydrogeological conditions. The results of noble gasses (He, Ne, Ar, Kr, Xe) support interpretations of the relative residence times, palaeohydrogeology, and the concept of mixing. Characterization of mean groundwater age and recharge temperature through the use of noble gas techniques provides information that is relevant to answering questions that are not accessible through traditional hydrogeologic approaches.
Reston Stable Isotope Laboratory
Isotope ratios of oxygen (δ18O) and hydrogen (δ2H) in water, and carbon (δ13C) in dissolved inorganic carbon
Double-focusing mass spectrometer (DI-IRMS)
The oxygen and hydrogen isotopes are used to evaluate sources and timing of groundwater recharge . The carbon isotopes are used to evaluate sources of dissolved inorganic carbon and chemical reactions that affect it.
36
Table 4. List of age dating analytes the U.S. Geological Survey added to sampling that the U.S. Environmental Protection Agency has not collected and an explanation of their use.—Continued [δ18O, ratio of oxygen-18 to oxygen-16 relative to a reference standard; δ2H, ratio of hydrogen-2 to hydrogen-1 relative to a reference standard; δ13C, ratio of carbon-13 to carbon-12]
Analytical laboratory Analytes Analytical approach Explanation of use Menlo Park Tritium
Laboratory
Woods Hole Oceanographic Institution-National Ocean Sciences Accelerator Mass Spectrometry Facility
Tritium (3H)
(14C)Carbon-14 in dissolved inorganic carbon
Electrolytic enrichment—liquid scintillation
Accelerator mass spectrometer with gas ionization counter
Tritium is an unstable (radioactive) isotope of hydrogen (3H). Tritium is principally of interest to the hydrologist as a water-dating tool and as a tracer, introduced either naturally or artificially, for investigating groundwater hydrodynamics in areas of relatively rapid flow. Tritium exists fairly uniformly in the environment as a result of natural production by cosmic radiation and residual fallout from nuclear weapons tests of the mid-20th century. Naturally occurring tritium is most abundant in precipitation and lowest in aged water because of its physical decay by beta emission to helium. The half-life of tritium is 12.32 years.
Carbon-14 is a radioactive isotope with a half-life of 5,730 years, is useful for age dating as well as for tracing hydrologic processes

37
Table 5. Water-quality property stabilization criteria and calibration guidelines. [±, plus or minus value shown; °C, degrees Celsius; ≤, less than or equal to value shown; µS/cm, micro- siemens per centimeter at 25°C; >, greater than value shown; unit, standard pH unit; mg/L, milligrams per liter; NTRU, nephelometric turbidity ratio units]
Water-quality property
Stabilization criteria1 (variability should be within value shown)
Calibration guidelines
Temperature: Thermistor Liquid-in-glass
±0.2°C ±0.5°C
Calibrate annually, check calibration
quarterly. Conductivity (SC):
for ≤100 µS/cm for >100 µS/cm
±5 percent ±3 percent
Calibrate each morning and at end of each day. Check calibration at each additional site; recalibrate if not within 3 to 5 percent of standard value.
pH: (displays to 0.01)
±0.1 unit
Allow ±0.3 pH units if drifting persists
Calibrate each morning and at end of each day. Check calibration at each additional site; recalibrate if not within 0.05 pH units of standard.
Dissolved oxygen: Amperometric or
optical/luminescent-method sensors
NA2
Calibrate each morning and at end of each day. If electrode uses a Teflon® membrane, inspect electrode for bubbles under membrane at each sampling site; replace if necessary.
Turbidity: ≤ 100 NTRU > 100 NTRU
NA2
Calibrate with a primary standard on a quarterly basis. Check calibration against secondary standards (Gelex) each morning and at end of each day; re-calibrate if not within 5 percent.
Redox potential NA2
Check against Zobell solution each morning and at end of each day. Recalibrate if not within ±5 millivolts (mv).
1Allowable variability between five or more sequential field measurements. For dissolved oxygen, ±0.2 to ± 0.3 mg/L; turbidity, ±0.5 NTRU or 5 percent of the measured value, whichever is greater when < 100 NTRU; redox potential, this property is not a stabilization criteria, however it can often be useful for groundwater studies.
2These field-measured properties will not be used in this study to evaluate inflow of fresh groundwater.
Table 6. Well-yield data for well MW02.
First water-level measurement Second water-level measurement Well yield
(gallons per hour) Date Depth to water
(feet below land surface)
Date Depth to water
(feet below land surface)
5/04/2012 955.03 5/10/2012 817.29 0.65 5/10/2012 817.29 5/21/2012 641.34 0.44

38
Table 7. Analytical laboratories, laboratory schedules and codes, and applicable field collection and processing information. [USEPA, U.S. Environmental Protection Agency; mL, milliliter; <, less than; HCL, hydrochloric acid; mod, modified; LC, U.S. Geological Survey laboratory code; SIM, selective ion monitoring; PAH, polycyclic aromatic hydrocarbon; BTEX, the compounds benzene, toluene, ethyl benzene, and xylene; MTBE, methyl tert- butyl ether; HNO3, nitric acid; H2SO4, sulfuric acid; RSKSOP, Robert S. Kerr Environmental Research Laboratory, Ada, Okla., standard operating procedure; δ18O, ratio of oxygen-18 to oxygen-16 relative to a reference standard; δ2H, ratio of hydrogen-2 to hydrogen-1 relative to a reference standard; δ13C of DIC, ratio of carbon-13 to carbon-12 of dissolved inorganic carbon; mm, millimeter; --, not applicable]
Laboratory method Method description (Number of bottles) Bottle
type/s Processing Preservation Hold Time TestAmerica
USEPA 8260B Volatile organic compounds (VOCs) including ethanol, isobutanol, isopropyl alcohol
(3) 40-mL clear glass vials Unfiltered Chill 7 days1
USEPA 8260B Volatile organic compounds (VOCs) including ethanol, isobutanol, isopropyl alcohol
(3) 40-mL clear glass vials Unfiltered pH to <2 with HCL, chill 14 days1
USEPA 8270C Semivolatile compounds (2) 1,000-mL baked amber glass
Unfiltered Chill 7 days2
USEPA 8270C PAHs, SIM (2) 1,000-mL baked amber glass
Unfiltered Chill 7 days2
USEPA 9056 Anions (1) 1,000-mL polyethylene bottle
Filtered, 0.45 micron Chill 48 hours to 28 days3
USEPA 6020, 6010B
Metals, filtered (1) 500-mL polyethylene bottle Filtered, 0.45 micron pH to <2 with HNO3 6 months1
USEPA 6020, 6010B
Metals, total (1) 500-mL polyethylene bottle Unfiltered pH to <2 with HNO3, chill 6 months1
USEPA 7470A Mercury, filtered (1) 250-mL glass Filtered, 0.45 micron pH to <2 with HNO3 28 days1
USEPA 7470A Mercury, total (1) 250-mL glass Unfiltered pH to <2 with HNO3 28 days1
Method 2540C Total dissolved solids (1) 250-mL polyethylene bottle Filtered, 0.45 micron Chill 7 days1
USEPA 365.1 Phosphorus, dissolved (1) 250-mL amber glass Filtered, 0.45 micron pH to <2 with H2SO4, chill
28 days1
USEPA 365.1 Phosphorus, total (1) 250-mL amber glass Unfiltered pH to <2 with H2SO4, chill
28 days1
USEPA 350.1, 353.2
Nutrients: nitrate (NO3) + nitrite (NO2), ammonia (NH4)
(1) 250-mL polyethylene bottle Filtered, 0.45 micron pH to <2 with H2SO4, chill
28 days1

39
Table 7. Analytical laboratories, laboratory schedules and codes, and applicable field collection and processing information.—Continued [USEPA, U.S. Environmental Protection Agency; mL, milliliter; <, less than; HCL, hydrochloric acid; mod, modified; LC, U.S. Geological Survey laboratory code; SIM, selective ion monitoring; PAH, polycyclic aromatic hydrocarbon; BTEX, the compounds benzene, toluene, ethyl benzene, and xylene; MTBE, methyl tert- butyl ether; HNO3, nitric acid; H2SO4, sulfuric acid; RSKSOP, Robert S. Kerr Environmental Research Laboratory, Ada, Okla., standard operating procedure; δ18O, ratio of oxygen-18 to oxygen-16 relative to a reference standard; δ2H, ratio of hydrogen-2 to hydrogen-1 relative to a reference standard; δ13C of DIC, ratio of carbon-13 to carbon-12 of dissolved inorganic carbon; mm, millimeter; --, not applicable]
Laboratory method Method description (Number of bottles) Bottle
type/s Processing Preservation Hold Time USEPA 9060 Total inorganic carbon (1) 500-mL amber glass Unfiltered Chill 14 days1
Total organic carbon (1) 500-mL amber glass Unfiltered pH to <2 with H2SO4, chill
28 days1
Dissolved inorganic carbon (1) 500-mL amber glass Filtered Chill 14 days1 Dissolved organic carbon (1) 500-mL amber glass Filtered pH to <2 with H2SO4,
chill 28 days1
USEPA 8015B/8021 modified
Gasoline range organics + BTEX + MTBE
(3) 40-mL clear glass vials Unfiltered Chill 7 days1
USEPA 8015B/8021 modified
Gasoline range organics + BTEX + MTBE
(3) 40-mL clear glass vials Unfiltered pH to <2 with HCL, chill 14 days1
USEPA 8015B Diethylene glycol, ethylene glycol, and triethylene glycol, methanol, n-butanol,
(3) 40-mL clear glass vials Unfiltered Chill 14 days1
USEPA 8015B Diesel range organics (DRO) (2) 1-liter baked amber glass Unfiltered Chill 7 days2 RSKSOP-175 Dissolved gasses (ethane, ethylene,
methane) (3) 40-mL clear glass vials Unfiltered Chill 7 days1
RSKSOP-175 Dissolved gasses (ethane, ethylene, methane)
(3) 40-mL clear glass vials Unfiltered pH to <2 with HCL, chill 14 days1
Propane (3) 40-mL clear glass vials Unfiltered Chill 7 days1 Propane (3) 40-mL clear glass vials Unfiltered pH to <2 with HCL, chill 14 days1 USEPA 425.1 Methylene blue active substances (1) 500-mL polyethylene bottle Unfiltered Chill 48 hours4
Reston Chlorofluorocarbon Laboratory -- Sulfur hexaflouride (2) 1-liter amber safety glass Unfiltered Keep in cooler, out of sun 180 days -- Chlorofluorocarbons (2) 125-mL clear glass with
caps5 Unfiltered Ice 180 days
-- Dissolved gasses: nitrogen (N2), argon (Ar), methane (CH4), carbon dioxide (CO2), oxygen (O2)
(2) 150-mL glass serum bottle Unfiltered Ice 180 days

40
Table 7. Analytical laboratories, laboratory schedules and codes, and applicable field collection and processing information.—Continued [USEPA, U.S. Environmental Protection Agency; mL, milliliter; <, less than; HCL, hydrochloric acid; mod, modified; LC, U.S. Geological Survey laboratory code; SIM, selective ion monitoring; PAH, polycyclic aromatic hydrocarbon; BTEX, the compounds benzene, toluene, ethyl benzene, and xylene; MTBE, methyl tert- butyl ether; HNO3, nitric acid; H2SO4, sulfuric acid; RSKSOP, Robert S. Kerr Environmental Research Laboratory, Ada, Okla., standard operating procedure; δ18O, ratio of oxygen-18 to oxygen-16 relative to a reference standard; δ2H, ratio of hydrogen-2 to hydrogen-1 relative to a reference standard; δ13C of DIC, ratio of carbon-13 to carbon-12 of dissolved inorganic carbon; mm, millimeter; --, not applicable]
Laboratory method Method description (Number of bottles) Bottle
type/s Processing Preservation Hold Time National Water Quality Laboratory
LC 1369 Radon-222 (1) Radon sampling bottle Unfiltered Scintillation cocktail solution
48 hours4
Eberline Services LC 794 Radium-226 (2) 1-liter acid rinsed
polyethylene bottles Filtered, 0.45 micron pH to <2 with HNO3 Requested
LC 1364 Radium-228 (2) 1-liter acid rinsed polyethylene bottles
Filtered, 0.45 micron pH to <2 with HNO3 Requested
Reston Stable Isotope Laboratory LC 1142 Isotopes ratios of oxygen (δ18O) and
hydrogen (δ2H) in water (2) 60-mL glass with polyseal
cone cap Filtered, 0.45 micron Ambient temperature Indefinite
-- Isotope ratio of carbon (δ13C) of dissolved inorganic carbon in water
(3) 40-mL glass vials Filtered, 25-mm polysulfone GD/X filter
Blue copper sulfate 90 days
Menlo Park Tritium Laboratory LC 1565 Tritium (1) 1-liter polyethylene bottle
with polyseal cap Unfiltered None 365 days
Lamont/Doherty Earth Observatory -- Dissolved noble gasses: helium (He),
neon (Ne), argon (Ar), krypton (Kr), xenon (Xe)
(2) copper tubes Unfiltered None 10 years
Woods Hole Oceanographic Institute - National Ocean Sciences Accelerator Mass Spectrometry Facility LC 3212 Carbon-14 (14C) in dissolved
inorganic carbon (1) 1-liter plastic coated glass
with polyseal cone cap 0.45-micron capsule filter,
no headspace Chill, pH and alkalinity
required, perform required test of sulfide6
Indefinite
LC 3223 Carbon-14 (14C) preparation5 -- -- -- --
Isotech Laboratories, Inc. -- Complete compositional gas analysis (1) 1,000-mL glass septum
bottle Unfiltered Bactericide capsule 3 months1
-- Isotope ratios of carbon (δ 13C) and hydrogen (δ2H) in methane
Can be taken from above bottle Unfiltered Bactericide capsule 3 months1

41
Table 7. Analytical laboratories, laboratory schedules and codes, and applicable field collection and processing information.—Continued [USEPA, U.S. Environmental Protection Agency; mL, milliliter; <, less than; HCL, hydrochloric acid; mod, modified; LC, U.S. Geological Survey laboratory code; SIM, selective ion monitoring; PAH, polycyclic aromatic hydrocarbon; BTEX, the compounds benzene, toluene, ethyl benzene, and xylene; MTBE, methyl tert- butyl ether; HNO3, nitric acid; H2SO4, sulfuric acid; RSKSOP, Robert S. Kerr Environmental Research Laboratory, Ada, Okla., standard operating procedure; δ18O, ratio of oxygen-18 to oxygen-16 relative to a reference standard; δ2H, ratio of hydrogen-2 to hydrogen-1 relative to a reference standard; δ13C of DIC, ratio of carbon-13 to carbon-12 of dissolved inorganic carbon; mm, millimeter; --, not applicable]
Laboratory method Method description (Number of bottles)
Bottle type/s Processing Preservation Hold Time Field Analyses
-- Specific conductance None Unfiltered None Field -- pH None Unfiltered None Field -- Ferrous iron None Unfiltered None Field -- Sulfide None Unfiltered None Field -- Dissolved oxygen, low range None Unfiltered None Field -- Alkalinity, hydroxide, bicarbonate,
carbonate (1) 250-mL polyethylene Filtered None Field
-- Acid neutralizing capacity, hydroxide, bicarbonate, carbonate
(1) 250-mL polyethylene Unfiltered None Field
1 Number of days from sample collection to start of sample analysis. 2 These analyses have hold times of 7 days to extraction and 40 days from extraction to analysis. 3 Nitrite, nitrate, and phosphorus have a 48-hour holding time from sample collection to start of sample analysis; bromide, chloride, fluoride, and sulfate have 28 days from sample collection to start of sample analysis. 4 Sample hold time is 48 hours from sample collection to completion of analysis. 5 Bottles and caps are sold by Scientific Specialties, Hanover, Md.; item numbers B73504 and A69522, respectively. 6 Samples sent to the Woods Holes Institute for carbon-14 analysis that contain hydrogen sulfide will require additional preparation. If hydrogen sulfide (positive sulfide test) is present, a statement indicating the
presence of hydrogen sulfide and an additional laboratory code (LC 3223) must be entered on Analytical Services Request/chain of custody form(s).

42
Table 8. Schedule for collection of quality-control samples (per sample set). [USEPA, U.S. Environmental Protection Agency; SIM, selective ion monitoring; DAI, direct aqueous injection; BTEX, the compounds benzene, toluene, ethylbenzene, and xylene; MTBE, methyl tert- butyl ether; --, not applicable; RSKSOP, Robert S. Kerr Environmental Research Laboratory, Ada, Okla., standard operating procedure.]
Laboratory analytical method Method description
Number of
source- solution blanks
Number of
ambient blanks
Number of field blanks
Number of
replicates
Number of
matrix spikes
Number of matrix spike
duplicates
Number of trip blanks
Temperature blanks
USEPA method 8260B
Volatile organic compounds (VOCs), including ethanol, isobutanol, isopropyl alcohol
1 per cooler
1 per well
1 per well
1 per well 1 per well
1 per well 1 per cooler 1 per
cooler
USEPA method 8270C and 8270/SIM
Semivolatile compounds -- 1 per well
1 per well
1 per well 1 per well
1 per well -- 1 per cooler
USEPA method 6020 Metals: aluminum, antimony, arsenic, barium, beryllium, boron, cadmium, chromium, cobalt, copper, lead, lithium, manganese, molybdenum, nickel, selenium, silver, strontium, thallium, uranium, vanadium, zinc
-- 1 per well
1 per well
1 per well 1 per well
1 per well --
1 per cooler
USEPA method 9056 Anions: bromide, chloride, fluoride, sulfate -- 1 per well
1 per well
1 per well 1 per well
1 per well -- 1 per cooler
USEPA method 6010B
Metals: calcium, iron, magnesium, mercury, potassium, silicon, sodium
-- 1 per well
1 per well
1 per well 1 per well
1 per well -- 1 per cooler
USEPA method 350.1
Nitrogen, ammonia -- 1 per well
1 per well
1 per well 1 per well
1 per well -- 1 per cooler
USEPA method 353.2
Nitrate + nitrite -- 1 per well
1 per well
1 per well 1 per well
1 per well -- 1 per cooler
USEPA method 365.1
Phosphorus, dissolved -- 1 per well
1 per well
1 per well 1 per well
1 per well -- 1 per cooler
8015B DAI in water (8015B)
Diesel range organics, glycols, methanol, n-butanol1
1 per cooler
1 per well
1 per well
1 per well 1 per well
1 per well -- 1 per cooler
8015B/8021 modified Gasoline range organics + BTEX + MTBE 1 per cooler
1 per well
1 per well
1 per well 1 per well
1 per well 1 per cooler2
1 per cooler
RSKSOP-175 Ethane, ethylene, methane, propane 1 per cooler
1 per well
1 per well
1 per well 1 per well
1 per well 1 per cooler2
1 per cooler
USEPA method 425.1
Methylene blue active substances -- 1 per well
1 per well
1 per well -- -- -- 1 per cooler
1 Only analyses requiring 40-mL vials for collection will include source-solution and ambient blanks. 2 One trip blank per cooler containing VOCs samples.

43
Table 9. Proposed analytical laboratories and contact information.
Laboratory Abbreviation Address Isotech Laboratories Inc. Isotech Isotech Laboratories, Inc.
1308 Parkland Court Champaign, IL 61821
Lamont-Doherty Earth Observatory
Lamont-Doherty
Lamont-Doherty Earth Observatory Comer Building 61 Route 9W Palisades, NY 10964
TestAmerica Laboratories
TAL TestAmerica Denver 4955 Yarrow Street Arvada, CO 80002
U.S. Geological Survey Reston Chlorofluorocarbon Laboratory
RCFC U.S. Geological Survey CFC Laboratory 12201 Sunrise Valley Dr. Reston, VA 20192
U.S. Geological Survey Reston Stable Isotope Laboratory
RSIL U.S. Geological Survey Isotope Laboratory 431 National Center Sunrise Valley Dr. Reston, VA 20192
U.S. Geological Survey Menlo Park Tritium Laboratory
MPTL Tritium Laboratory 345 Middlefield Dr. MS 434 Menlo Park, CA 94025
Woods Hole Oceanographic Institute, National Ocean Sciences Accelerator Mass Spectrometry Facility
WHOI-NOSAMS
National Ocean Sciences AMS Facility Woods Hole Oceanographic Institution McLean Laboratory, Mail Stop #8 266 Woods Hole Road Woods Hole, MA 02543-1539

44
Table 10. Summary of laboratory quality-assurance/quality-control requirements. [< MDL, less than the method detection limit; %, percent; TOC, total organic carbon; DOC, dissolved organic carbon; TIC, total inorganic carbon; DIC, dissolved inorganic carbon]
Compounds/analytes Laboratory analytical method
Blanks1 (frequency) Laboratory control samples2 (frequency)
Matrix spike samples3
(frequency) Nitrate plus nitrite as
nitrogen (NO3+NO2-n)
353.2 < MDL (before and after each sample group)
80–120% of known value (one per sample set)
80–120% recovery (one per sample set )
Dissolved phosphorus (P) 365.1 < MDL (before and after each sample group)
80–120% of known value (one per sample set)
80–120% recovery (one per sample set)
Metals by inductively coupled plasma / mass spectrometry
6020 < MDL (before and after each sample group)
80–120% of known value (one per sample set)
80–120% recovery with all metals between 50–150% recovery (one per sample set)
Anions (bromide, chloride, fluoride, sulfate)
9056 < MDL (before and after each sample group)
80–120% of known value (one per sample set)
80–120% recovery (one per sample set)
Metals by inductively coupled plasma
6010B < MDL (before and after each sample group)
80–120% of known value (one per sample set)
80–120% recovery with all metals between 50–150% recovery (one per sample set)
Diesel range organics 8015B < MDL (before and after each sample group)
60–120% of known value (one per sample set)
60–120% of known value (one per sample set)
Glycols 8015B < MDL (before and after each sample group)
80–120% of known value (one per sample set)
80–120% recovery (one per sample set)
Gasoline range organics 8015B < MDL (before and after each sample group)
48–120% of known value (one per sample set)
48–120% recovery (one per sample set)
Total petroleum hydrocarbons as gasoline
8015B < MDL (before and after each sample group)
60–120% of known value (one per sample set)
60–120% of known value (one per sample set)
Volatile and semi-volatile organic compounds
8260B < MDL (before and after each sample group)
40–130% of known value (one per sample set)
40–130% recovery (one per sample set)
Carbons (TOC, DOC, TIC, DIC)
9060 < MDL (before and after each sample group)
80–120% of known value (one per sample set)
80–120% recovery (one per sample set)
Methylene blue active substances
425.1 < MDL (before and after each sample group)
80–120% of known value (one per sample set)
80–120% recovery (one per sample set)
1 <MDL for 90% of all analytes. 2 Analyte specific laboratory control sample information is included in the quality-control section of each TestAmerica Laboratories data packet. Data
packets include analytical and quality-control data. It is expected that at least 90% of the analytes in this group will meet these criteria. 3 Analyte specific matrix spike information is included in the quality-control section of each TestAmerica Laboratories data packet. Data packets include
analytical and quality-control data. It is expected that a greater than normal number of analytes will be outside this criteria based on the expected matrix of the sample.
45
Appendix A. Table of chemical analytes, laboratory methods, and laboratory quantitation limits [Shaded rows indicate analytes for which the U.S. Geological Survey National Water Quality Laboratory and TestAmerica Laboratories, the USGS contract laboratory, currently (2012) do not have an analytical method. CASRN, Chemical Abstracts Service Registry Number; MDL, method detection limit; RL, reporting level; RSK-SOP, Robert S. Kerr Environmental Research Laboratory, Ada Okla., standard operating procedure.; USEPA, U.S. Environmental Protection Agency; mg/L, milligrams per liter; Rev., revision; µg/L, micrograms per liter; --, none or unavailable; ng/L, nanogram per liter; ORGM, USEPA Region 8 Laboratory, Golden, Colo., standard operating procedure; LC/MS/MS, liquid chromatography with tandem mass spectrometry]
Analyte (abbreviation)
U.S.Geological Survey
parameter code or CASRN1
TestAmerica Laboratories Method used in U.S.
Environmental Protection Agency Pavillion study
Comments Labor-atory MDL
Labor-atory
RL
Repor-ting
units
Laboratory analytical method
Dissolved bromide (Br-) 7726–95–6–BR 0.113 0.2 mg/L 9056 RSKSOP-276, Rev. 3 (USEPA Method 6500)
--
Dissolved chloride (Cl-) 16887–00–6 0.254 3 mg/L 9056 RSKSOP-276, Rev. 3 (USEPA Method 6500)
--
Dissolved fluoride (F-) 7782–41–4 0.06 0.5 mg/L 9056 RSKSOP-276, Rev. 3 (USEPA Method 6500)
--
Dissolved sulfate (SO4-2) 14808–79–8 0.232 5 mg/L 9056 RSKSOP-276, Rev. 3 (USEPA
Method 6500) --
Dissolved calcium (Ca) 7440–70–2 34.5 200 µg/L 6010B RSKSOP-213 Rev. 4 (USEPA Method 200.7)
--
Dissolved magnesium (Mg)
7439–95–4 10.7 200 µg/L 6010B RSKSOP-213 Rev. 4 (USEPA Method 200.7)
--
Dissolved potassium (K) 7440–09–7 237 3,000 µg/L 6010B RSKSOP-213 Rev. 4 (USEPA Method 200.7)
--
Dissolved sodium (Na) 7440–23–5 91.6 1,000 µg/L 6010B RSKSOP-213 Rev. 4 (USEPA Method 200.7)
--
Dissolved aluminum (Al)
7429–90–5 18 100 µg/L 6010B RSKSOP-213 Rev. 4 (USEPA Method 200.7)
--
Dissolved antimony (Sb) 7440–36–0 0.4 2 µg/L 6020 RSKSOP-213 Rev. 4 (USEPA Method 200.7)
--
Dissolved arsenic (As) 7440–38–2 0.33 5 µg/L 6020 RSKSOP-213 Rev. 4 (USEPA Method 200.7)
--
Dissolved barium (Ba) 7440–39–3 0.29 1 µg/L 6020 RSKSOP-213 Rev. 4 (USEPA Method 200.7)
--
Dissolved beryllium (Be) 7440–41–7 0.08 1 µg/L 6020 RSKSOP-213 Rev. 4 (USEPA Method 200.7)
--
Dissolved boron (B) 7440–42–8 4.37 100 µg/L 6010B RSKSOP-213 Rev. 4 (USEPA Method 200.7)
--

46
Analyte (abbreviation)
U.S.Geological Survey
parameter code or CASRN1
TestAmerica Laboratories Method used in U.S.
Environmental Protection Agency Pavillion study
Comments Labor-atory MDL
Labor-atory
RL
Repor-ting
units
Laboratory analytical method
Dissolved cadmium (Cd) 7440–43–9 0.1 1 µg/L 6020 RSKSOP-213 Rev. 4 (USEPA Method 200.7)
--
Dissolved chromium (Cr)
7440–47–3 0.5 2 µg/L 6020 RSKSOP-213 Rev. 4 (USEPA Method 200.7)
--
Dissolved cobalt (Co) 7440–48–4 0.054 1 µg/L 6020 RSKSOP-213 Rev. 4 (USEPA Method 200.7)
--
Dissolved copper (Cu) 7440–50–8 0.56 2 µg/L 6020 RSKSOP-213 Rev. 4 (USEPA Method 200.7)
--
Dissolved iron (Fe) 7439–89–6 22 100 µg/L 6010B RSKSOP-213 Rev. 4 (USEPA Method 200.7)
--
Dissolved lead (Pb) 7439–92–1 0.18 1 µg/L 6020 RSKSOP-213 Rev. 4 (USEPA Method 200.7)
--
Dissolved manganese (Mn)
7439–96–5 0.31 1 µg/L 6020 RSKSOP-213 Rev. 4 (USEPA Method 200.7)
--
Dissolved mercury (Hg) 7439–97–6 0.027 0.2 µg/L 7470A RSKSOP-257 Rev. 2 (USEPA Method 6020) or RSKSOP-332 Rev. 0
--
Dissolved molybdenum (Mo)
7439–98–7 0.14 2 µg/L 6020 RSKSOP-213 Rev. 4 (USEPA Method 200.7)
--
Dissolved nickel (Ni) 7440–02–0 0.3 2 µg/L 6020 RSKSOP-213 Rev. 4 (USEPA Method 200.7)
--
Dissolved phosphorus (P)
7723–14–0 0.005 0.05 mg/L 365.1 RSKSOP-213 Rev. 4 (USEPA Method 200.7)
--
Dissolved selenium (Se) 7782–49–2 0.7 5 µg/L 6020 RSKSOP-213 Rev. 4 (USEPA Method 200.7)
--
Dissolved silicon (Si) 7440–21–3 34.7 500 µg/L 6010B RSKSOP-213 Rev. 4 (USEPA Method 200.7)
--
Dissolved silver (Ag) 7440–22–4 0.033 5 µg/L 6020 RSKSOP-213 Rev. 4 (USEPA Method 200.7)
--
Dissolved strontium (Sr) 7440–24–6 0.3 10 µg/L 6010B RSKSOP-213 Rev. 4 (USEPA Method 200.7)
--
Dissolved thallium (Tl) 7440–28–0 0.05 1 µg/L 6020 RSKSOP-213 Rev. 4 (USEPA Method 200.7)
--
Dissolved titanium (Ti)1 7440–32–6 0.595 10 µg/L 6010B RSKSOP-213 Rev. 4 (USEPA Method 200.7)
--
Dissolved uranium (U) 7440–61–1 0.05 1 µg/L 6020 RSKSOP-213 Rev. 4 (USEPA Method 200.7)
--

47
Analyte (abbreviation)
U.S.Geological Survey
parameter code or CASRN1
TestAmerica Laboratories Method used in U.S.
Environmental Protection Agency Pavillion study
Comments Labor-atory MDL
Labor-atory
RL
Repor-ting
units
Laboratory analytical method
Dissolved vanadium (V) 7440–62–2 0.5 5 µg/L 6020 RSKSOP-213 Rev. 4 (USEPA Method 200.7)
--
Dissolved zinc (Zn) 7440–66–6 2 10 µg/L 6020 RSKSOP-213 Rev. 4 (USEPA Method 200.7)
--
Total arsenic -- 0.33 5 µg/L 6020 Not analyzed by USEPA Requested by State of Wyoming
Total boron -- 4.37 100 µg/L 6010B Not analyzed by USEPA Requested by State of Wyoming
Total iron -- 22 100 µg/L 6010B Not analyzed by USEPA Requested by State of Wyoming
Total silica -- 74.3 500 µg/L 6010B Not analyzed by USEPA Requested by State of Wyoming
Total calcium -- 34.5 200 µg/L 6010B Not analyzed by USEPA Requested by State of Wyoming
Total magnesium -- 10.7 200 µg/L 6010B Not analyzed by USEPA Requested by State of Wyoming
Total sodium -- 91.6 1,000 µg/L 6010B Not analyzed by USEPA Requested by State of Wyoming
Total aluminum -- 18 100 µg/L 6010B Not analyzed by USEPA Requested by State of Wyoming
Total antimony -- 0.4 2 µg/L 6020 Not analyzed by USEPA Requested by State of Wyoming
Total phosphorus -- 13.5 3,000 mg/L 6010B Not analyzed by USEPA Requested by State of Wyoming
Total cobalt -- 0.054 1 µg/L 6020 Not analyzed by USEPA Requested by State of Wyoming
Total silver -- 0.033 5 µg/L 6020 Not analyzed by USEPA Requested by State of Wyoming
Total uranium -- 0.05 1 µg/L 6020 Not analyzed by USEPA Requested by State of Wyoming
Total mercury -- 0.27 0.2 µg/L 7470A Not analyzed by USEPA Requested by State of Wyoming
Total cadmium -- 0.1 1 µg/L 6020 Not analyzed by USEPA Requested by State of Wyoming
Total beryllium -- 0.08 1 µg/L 6020 Not analyzed by USEPA Requested by State of Wyoming
Total molybdenum -- 0.14 2 µg/L 6020 Not analyzed by USEPA Requested by State of Wyoming
48
Analyte (abbreviation)
U.S.Geological Survey
parameter code or CASRN1
TestAmerica Laboratories Method used in U.S.
Environmental Protection Agency Pavillion study
Comments Labor-atory MDL
Labor-atory
RL
Repor-ting
units
Laboratory analytical method
Total lead -- 0.18 1 µg/L 6020 Not analyzed by USEPA Requested by State of Wyoming
Total nickel -- 0.3 2 µg/L 6020 Not analyzed by USEPA Requested by State of Wyoming
Total strontium -- 0.3 10 µg/L 6010B Not analyzed by USEPA Requested by State of Wyoming
Total manganese -- 0.31 1 µg/L 6020 Not analyzed by USEPA Requested by State of Wyoming
Total chromium -- 0.5 2 µg/L 6020 Not analyzed by USEPA Requested by State of Wyoming
Total copper -- 0.56 2 µg/L 6020 Not analyzed by USEPA Requested by State of Wyoming
Total barium -- 0.29 1 µg/L 6020 Not analyzed by USEPA Requested by State of Wyoming
Total selenium -- 0.7 5 µg/L 6020 Not analyzed by USEPA Requested by State of Wyoming
Total vanadium -- 0.5 5 µg/L 6020 Not analyzed by USEPA Requested by State of Wyoming
Total zinc -- 2 10 µg/L 6020 Not analyzed by USEPA Requested by State of Wyoming
Total thallium -- 0.05 1 µg/L 6020 Not analyzed by USEPA Requested by State of Wyoming
Total lithium (schedule extra)
-- 2.61 10 µg/L 6010B Not analyzed by USEPA Requested by State of Wyoming
Nitrogen, ammonia 6484–52–2 0.022 0.1 mg/L 350.1 RSKSOP-214 Rev. 5 (USEPA Method 350.1 and 353.2)
--
Nitrate+Nitrite as nitrogen (NO3+NO2-n)
00630 0.019 0.1 mg/L 353.2 RSKSOP-214 Rev. 5 (USEPA Method 350.1 and 353.2)
--
(R)-(+)-Limonene -- -- -- -- -- ORGM-515 Rev. 1.1 & USEPA Method 8270D
--
1,1,1,2-Tetrachloroethane
630–20–6 0.21 1 µg/L 8260B ORGM-501 & USEPA Method 8260B/C
--
1,1,1-Trichloroethane 71–55–6 0.16 1 µg/L 8260B ORGM-501 & USEPA Method 8260B/C
--
1,1,2,2-Tetrachloroethane
79–34–5 0.21 1 µg/L 8260B ORGM-501 & USEPA Method 8260B/C
--
1,1,2-Trichloroethane 79–00–5 0.27 1 µg/L 8260B ORGM-501 & USEPA Method 8260B/C
--
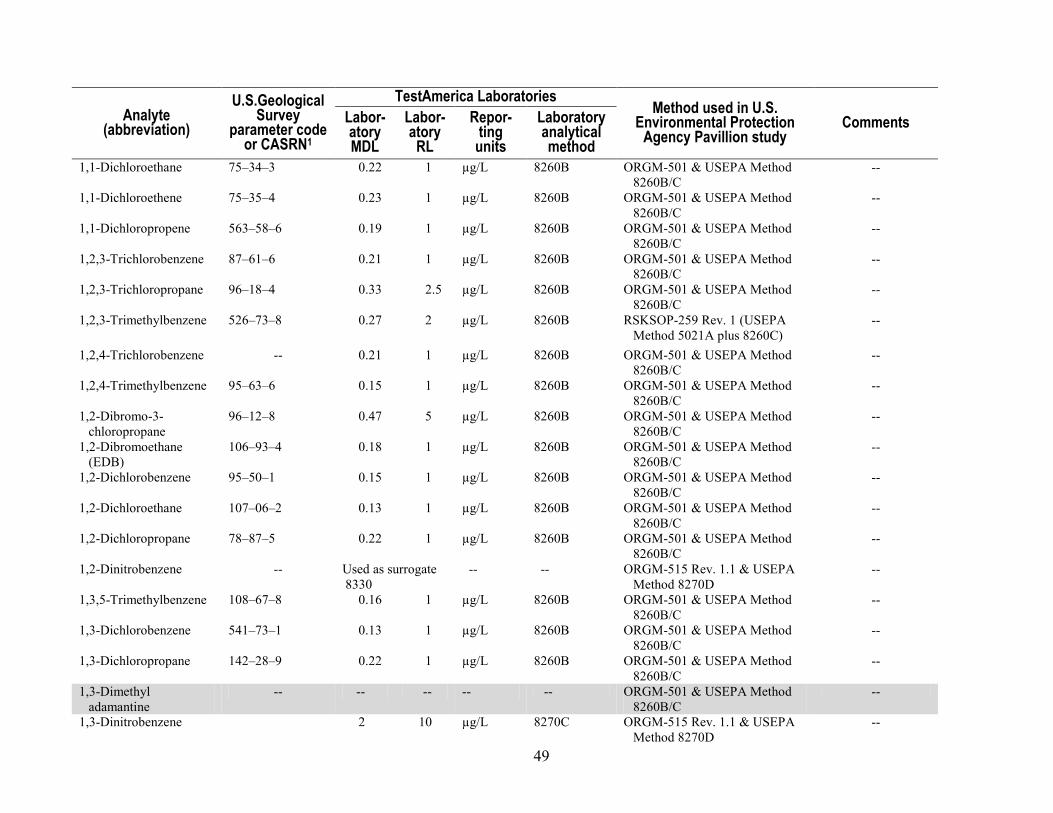
49
Analyte (abbreviation)
U.S.Geological Survey
parameter code or CASRN1
TestAmerica Laboratories Method used in U.S.
Environmental Protection Agency Pavillion study
Comments Labor-atory MDL
Labor-atory
RL
Repor-ting
units
Laboratory analytical method
1,1-Dichloroethane 75–34–3 0.22 1 µg/L 8260B ORGM-501 & USEPA Method 8260B/C
--
1,1-Dichloroethene 75–35–4 0.23 1 µg/L 8260B ORGM-501 & USEPA Method 8260B/C
--
1,1-Dichloropropene 563–58–6 0.19 1 µg/L 8260B ORGM-501 & USEPA Method 8260B/C
--
1,2,3-Trichlorobenzene 87–61–6 0.21 1 µg/L 8260B ORGM-501 & USEPA Method 8260B/C
--
1,2,3-Trichloropropane 96–18–4 0.33 2.5 µg/L 8260B ORGM-501 & USEPA Method 8260B/C
--
1,2,3-Trimethylbenzene 526–73–8 0.27 2 µg/L 8260B RSKSOP-259 Rev. 1 (USEPA Method 5021A plus 8260C)
--
1,2,4-Trichlorobenzene -- 0.21 1 µg/L 8260B ORGM-501 & USEPA Method 8260B/C
--
1,2,4-Trimethylbenzene 95–63–6 0.15 1 µg/L 8260B ORGM-501 & USEPA Method 8260B/C
--
1,2-Dibromo-3-chloropropane
96–12–8 0.47 5 µg/L 8260B ORGM-501 & USEPA Method 8260B/C
--
1,2-Dibromoethane (EDB)
106–93–4 0.18 1 µg/L 8260B ORGM-501 & USEPA Method 8260B/C
--
1,2-Dichlorobenzene 95–50–1 0.15 1 µg/L 8260B ORGM-501 & USEPA Method 8260B/C
--
1,2-Dichloroethane 107–06–2 0.13 1 µg/L 8260B ORGM-501 & USEPA Method 8260B/C
--
1,2-Dichloropropane 78–87–5 0.22 1 µg/L 8260B ORGM-501 & USEPA Method 8260B/C
--
1,2-Dinitrobenzene -- Used as surrogate 8330
-- -- ORGM-515 Rev. 1.1 & USEPA Method 8270D
--
1,3,5-Trimethylbenzene 108–67–8 0.16 1 µg/L 8260B ORGM-501 & USEPA Method 8260B/C
--
1,3-Dichlorobenzene 541–73–1 0.13 1 µg/L 8260B ORGM-501 & USEPA Method 8260B/C
--
1,3-Dichloropropane 142–28–9 0.22 1 µg/L 8260B ORGM-501 & USEPA Method 8260B/C
--
1,3-Dimethyl adamantine
-- -- -- -- -- ORGM-501 & USEPA Method 8260B/C
--
1,3-Dinitrobenzene 2 10 µg/L 8270C ORGM-515 Rev. 1.1 & USEPA Method 8270D
--

50
Analyte (abbreviation)
U.S.Geological Survey
parameter code or CASRN1
TestAmerica Laboratories Method used in U.S.
Environmental Protection Agency Pavillion study
Comments Labor-atory MDL
Labor-atory
RL
Repor-ting
units
Laboratory analytical method
1,4-Dichlorobenzene 106–47–7 0.16 1 µg/L 8260B ORGM-501 & USEPA Method 8260B/C
--
1,4-Dinitrobenzene -- 2 10 µg/L 8270C ORGM-515 Rev. 1.1 & USEPA Method 8270D
--
1-Methylnaphthalene -- 5.66 100 ng/L 8270C/SIM ORGM-515 Rev. 1.1 & USEPA Method 8270D
--
2,2-Dichloropropane 594–20–7 0.18 1 µg/L 8260B ORGM-501 & USEPA Method 8260B/C
--
2,3,4,6-Tetrachlorophenol
-- 2 50 µg/L 8270C ORGM-515 Rev. 1.1 & USEPA Method 8270D
--
2,3,5,6-Tetrachlorophenol
-- -- -- -- -- ORGM-515 Rev. 1.1 & USEPA Method 8270D
--
2,4,5-Trichlorophenol -- 0.45 10 µg/L 8270C ORGM-515 Rev. 1.1 & USEPA Method 8270D
--
2,4,6-Trichlorophenol -- 0.29 10 µg/L 8270C ORGM-515 Rev. 1.1 & USEPA Method 8270D
--
2,4-Dichlorophenol -- 0.64 10 µg/L 8270C ORGM-515 Rev. 1.1 & USEPA Method 8270D
--
2,4-Dimethylphenol -- 0.58 10 µg/L 8270C ORGM-515 Rev. 1.1 & USEPA Method 8270D
--
2,4-Dinitrophenol -- 10 30 µg/L 8270C ORGM-515 Rev. 1.1 & USEPA Method 8270D
--
2,4-Dinitrotoluene -- 1.66 10 µg/L 8270C ORGM-515 Rev. 1.1 & USEPA Method 8270D
--
2,5-Dimethylfuran 625–86–5 -- -- -- -- RSKSOP-259 Rev. 1 (USEPA Method 5021A plus 8260C)
--
2,6-Dinitrotoluene -- 1.89 10 µg/L 8270C ORGM-515 Rev. 1.1 & USEPA Method 8270D
--
2-Butanone 78–93–3 2 6 µg/L 8260B ORGM-501 & USEPA Method 8260B/C
--
2-Butoxyethanol 111–76–2 0.5 2 µg/L TIC/8260B ORGM-515 Rev. 1.1 & USEPA Method 8270D
--
2-Butoxyethanol phosphate
78–51–3 -- -- -- -- ORGM-515 Rev. 1.1 & USEPA Method 8270D
--
2-Chloronaphthalene -- 0.26 4 µg/L 8270C ORGM-515 Rev. 1.1 & USEPA Method 8270D
--
2-Chlorophenol -- 2 10 µg/L 8270C ORGM-515 Rev. 1.1 & USEPA Method 8270D
--
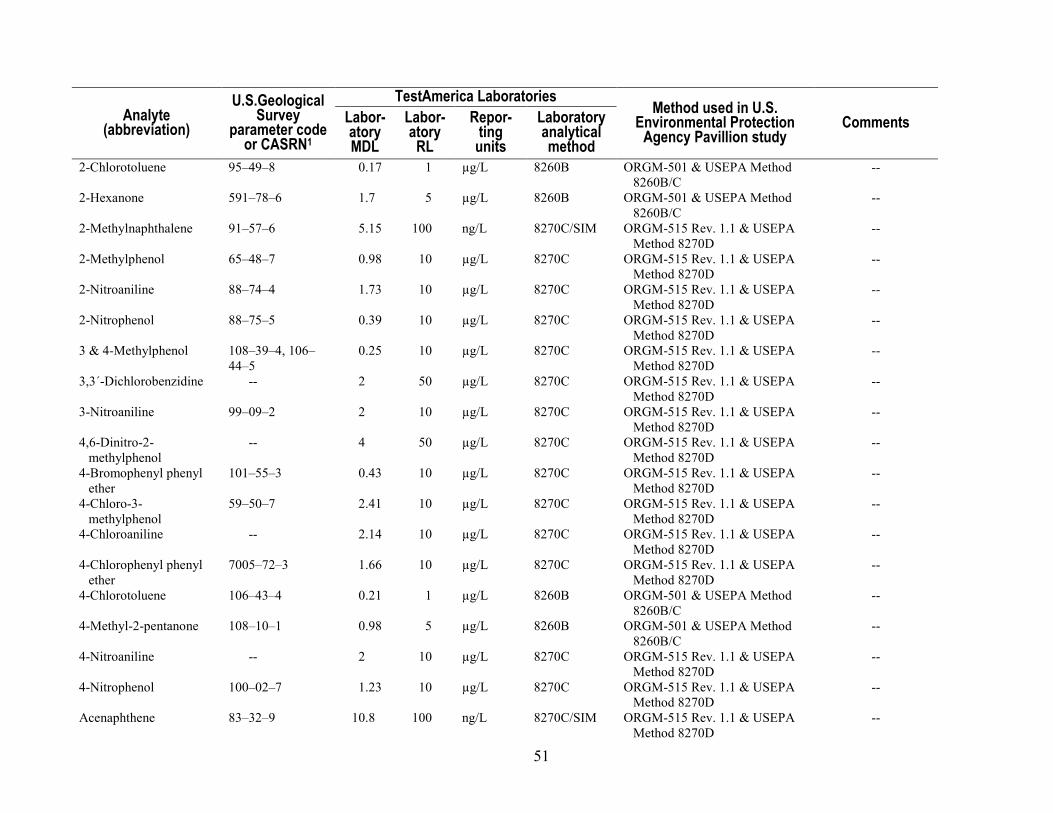
51
Analyte (abbreviation)
U.S.Geological Survey
parameter code or CASRN1
TestAmerica Laboratories Method used in U.S.
Environmental Protection Agency Pavillion study
Comments Labor-atory MDL
Labor-atory
RL
Repor-ting
units
Laboratory analytical method
2-Chlorotoluene 95–49–8 0.17 1 µg/L 8260B ORGM-501 & USEPA Method 8260B/C
--
2-Hexanone 591–78–6 1.7 5 µg/L 8260B ORGM-501 & USEPA Method 8260B/C
--
2-Methylnaphthalene 91–57–6 5.15 100 ng/L 8270C/SIM ORGM-515 Rev. 1.1 & USEPA Method 8270D
--
2-Methylphenol 65–48–7 0.98 10 µg/L 8270C ORGM-515 Rev. 1.1 & USEPA Method 8270D
--
2-Nitroaniline 88–74–4 1.73 10 µg/L 8270C ORGM-515 Rev. 1.1 & USEPA Method 8270D
--
2-Nitrophenol 88–75–5 0.39 10 µg/L 8270C ORGM-515 Rev. 1.1 & USEPA Method 8270D
--
3 & 4-Methylphenol 108–39–4, 106–44–5
0.25 10 µg/L 8270C ORGM-515 Rev. 1.1 & USEPA Method 8270D
--
3,3´-Dichlorobenzidine -- 2 50 µg/L 8270C ORGM-515 Rev. 1.1 & USEPA Method 8270D
--
3-Nitroaniline 99–09–2 2 10 µg/L 8270C ORGM-515 Rev. 1.1 & USEPA Method 8270D
--
4,6-Dinitro-2-methylphenol
-- 4 50 µg/L 8270C ORGM-515 Rev. 1.1 & USEPA Method 8270D
--
4-Bromophenyl phenyl ether
101–55–3 0.43 10 µg/L 8270C ORGM-515 Rev. 1.1 & USEPA Method 8270D
--
4-Chloro-3-methylphenol
59–50–7 2.41 10 µg/L 8270C ORGM-515 Rev. 1.1 & USEPA Method 8270D
--
4-Chloroaniline -- 2.14 10 µg/L 8270C ORGM-515 Rev. 1.1 & USEPA Method 8270D
--
4-Chlorophenyl phenyl ether
7005–72–3 1.66 10 µg/L 8270C ORGM-515 Rev. 1.1 & USEPA Method 8270D
--
4-Chlorotoluene 106–43–4 0.21 1 µg/L 8260B ORGM-501 & USEPA Method 8260B/C
--
4-Methyl-2-pentanone 108–10–1 0.98 5 µg/L 8260B ORGM-501 & USEPA Method 8260B/C
--
4-Nitroaniline -- 2 10 µg/L 8270C ORGM-515 Rev. 1.1 & USEPA Method 8270D
--
4-Nitrophenol 100–02–7 1.23 10 µg/L 8270C ORGM-515 Rev. 1.1 & USEPA Method 8270D
--
Acenaphthene 83–32–9 10.8 100 ng/L 8270C/SIM ORGM-515 Rev. 1.1 & USEPA Method 8270D
--
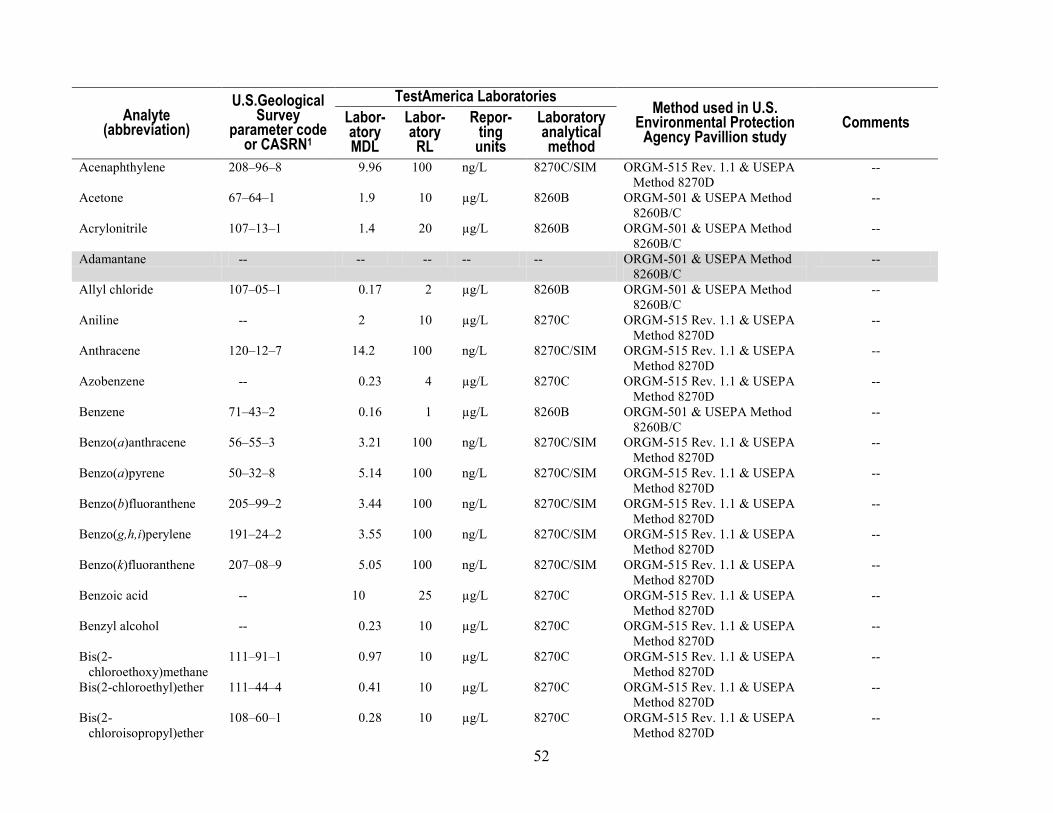
52
Analyte (abbreviation)
U.S.Geological Survey
parameter code or CASRN1
TestAmerica Laboratories Method used in U.S.
Environmental Protection Agency Pavillion study
Comments Labor-atory MDL
Labor-atory
RL
Repor-ting
units
Laboratory analytical method
Acenaphthylene 208–96–8 9.96 100 ng/L 8270C/SIM ORGM-515 Rev. 1.1 & USEPA Method 8270D
--
Acetone 67–64–1 1.9 10 µg/L 8260B ORGM-501 & USEPA Method 8260B/C
--
Acrylonitrile 107–13–1 1.4 20 µg/L 8260B ORGM-501 & USEPA Method 8260B/C
--
Adamantane -- -- -- -- -- ORGM-501 & USEPA Method 8260B/C
--
Allyl chloride 107–05–1 0.17 2 µg/L 8260B ORGM-501 & USEPA Method 8260B/C
--
Aniline -- 2 10 µg/L 8270C ORGM-515 Rev. 1.1 & USEPA Method 8270D
--
Anthracene 120–12–7 14.2 100 ng/L 8270C/SIM ORGM-515 Rev. 1.1 & USEPA Method 8270D
--
Azobenzene -- 0.23 4 µg/L 8270C ORGM-515 Rev. 1.1 & USEPA Method 8270D
--
Benzene 71–43–2 0.16 1 µg/L 8260B ORGM-501 & USEPA Method 8260B/C
--
Benzo(a)anthracene 56–55–3 3.21 100 ng/L 8270C/SIM ORGM-515 Rev. 1.1 & USEPA Method 8270D
--
Benzo(a)pyrene 50–32–8 5.14 100 ng/L 8270C/SIM ORGM-515 Rev. 1.1 & USEPA Method 8270D
--
Benzo(b)fluoranthene 205–99–2 3.44 100 ng/L 8270C/SIM ORGM-515 Rev. 1.1 & USEPA Method 8270D
--
Benzo(g,h,i)perylene 191–24–2 3.55 100 ng/L 8270C/SIM ORGM-515 Rev. 1.1 & USEPA Method 8270D
--
Benzo(k)fluoranthene 207–08–9 5.05 100 ng/L 8270C/SIM ORGM-515 Rev. 1.1 & USEPA Method 8270D
--
Benzoic acid -- 10 25 µg/L 8270C ORGM-515 Rev. 1.1 & USEPA Method 8270D
--
Benzyl alcohol -- 0.23 10 µg/L 8270C ORGM-515 Rev. 1.1 & USEPA Method 8270D
--
Bis(2-chloroethoxy)methane
111–91–1 0.97 10 µg/L 8270C ORGM-515 Rev. 1.1 & USEPA Method 8270D
--
Bis(2-chloroethyl)ether 111–44–4 0.41 10 µg/L 8270C ORGM-515 Rev. 1.1 & USEPA Method 8270D
--
Bis(2-chloroisopropyl)ether
108–60–1 0.28 10 µg/L 8270C ORGM-515 Rev. 1.1 & USEPA Method 8270D
--
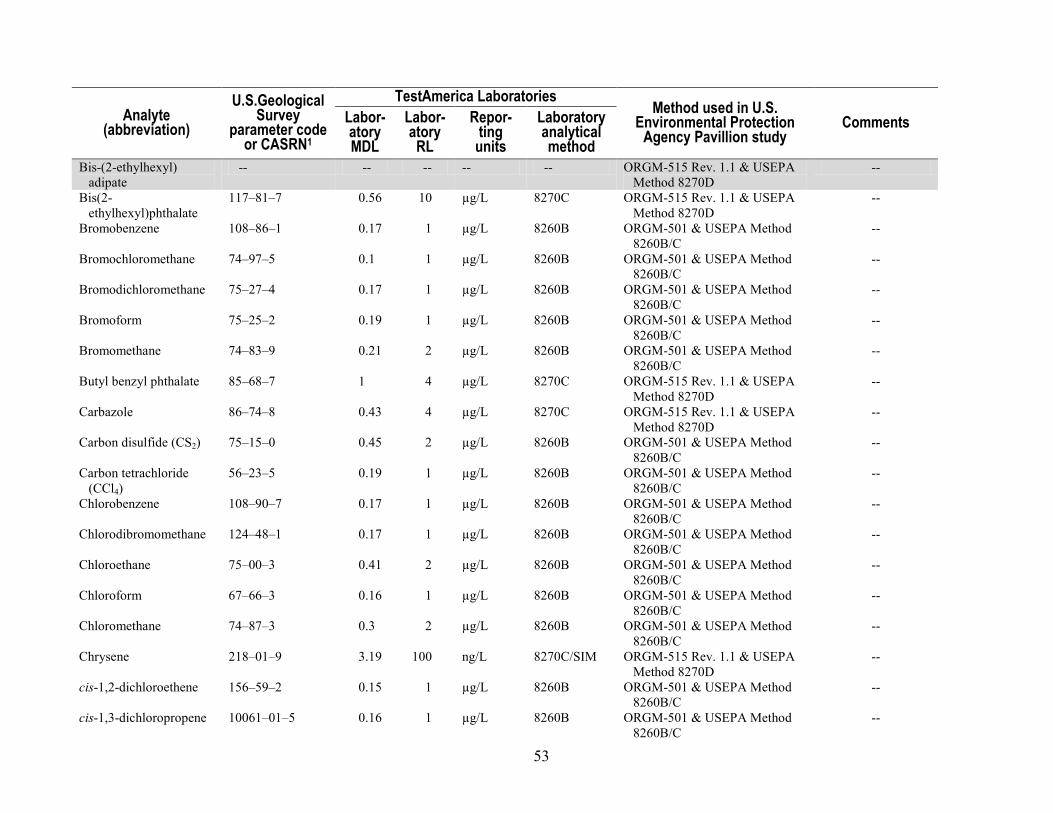
53
Analyte (abbreviation)
U.S.Geological Survey
parameter code or CASRN1
TestAmerica Laboratories Method used in U.S.
Environmental Protection Agency Pavillion study
Comments Labor-atory MDL
Labor-atory
RL
Repor-ting
units
Laboratory analytical method
Bis-(2-ethylhexyl) adipate
-- -- -- -- -- ORGM-515 Rev. 1.1 & USEPA Method 8270D
--
Bis(2-ethylhexyl)phthalate
117–81–7 0.56 10 µg/L 8270C ORGM-515 Rev. 1.1 & USEPA Method 8270D
--
Bromobenzene 108–86–1 0.17 1 µg/L 8260B ORGM-501 & USEPA Method 8260B/C
--
Bromochloromethane 74–97–5 0.1 1 µg/L 8260B ORGM-501 & USEPA Method 8260B/C
--
Bromodichloromethane 75–27–4 0.17 1 µg/L 8260B ORGM-501 & USEPA Method 8260B/C
--
Bromoform 75–25–2 0.19 1 µg/L 8260B ORGM-501 & USEPA Method 8260B/C
--
Bromomethane 74–83–9 0.21 2 µg/L 8260B ORGM-501 & USEPA Method 8260B/C
--
Butyl benzyl phthalate 85–68–7 1 4 µg/L 8270C ORGM-515 Rev. 1.1 & USEPA Method 8270D
--
Carbazole 86–74–8 0.43 4 µg/L 8270C ORGM-515 Rev. 1.1 & USEPA Method 8270D
--
Carbon disulfide (CS2) 75–15–0 0.45 2 µg/L 8260B ORGM-501 & USEPA Method 8260B/C
--
Carbon tetrachloride (CCl4)
56–23–5 0.19 1 µg/L 8260B ORGM-501 & USEPA Method 8260B/C
--
Chlorobenzene 108–90–7 0.17 1 µg/L 8260B ORGM-501 & USEPA Method 8260B/C
--
Chlorodibromomethane 124–48–1 0.17 1 µg/L 8260B ORGM-501 & USEPA Method 8260B/C
--
Chloroethane 75–00–3 0.41 2 µg/L 8260B ORGM-501 & USEPA Method 8260B/C
--
Chloroform 67–66–3 0.16 1 µg/L 8260B ORGM-501 & USEPA Method 8260B/C
--
Chloromethane 74–87–3 0.3 2 µg/L 8260B ORGM-501 & USEPA Method 8260B/C
--
Chrysene 218–01–9 3.19 100 ng/L 8270C/SIM ORGM-515 Rev. 1.1 & USEPA Method 8270D
--
cis-1,2-dichloroethene 156–59–2 0.15 1 µg/L 8260B ORGM-501 & USEPA Method 8260B/C
--
cis-1,3-dichloropropene 10061–01–5 0.16 1 µg/L 8260B ORGM-501 & USEPA Method 8260B/C
--

54
Analyte (abbreviation)
U.S.Geological Survey
parameter code or CASRN1
TestAmerica Laboratories Method used in U.S.
Environmental Protection Agency Pavillion study
Comments Labor-atory MDL
Labor-atory
RL
Repor-ting
units
Laboratory analytical method
Dibenz(a,h)anthracene 53–70–3 4.82 100 ng/L 8270C/SIM ORGM-515 Rev. 1.1 & USEPA Method 8270D
--
Dibenzofuran -- 0.29 4 µg/L 8270C ORGM-515 Rev. 1.1 & USEPA Method 8270D
--
Dibromomethane 74–95–3 0.17 1 µg/L 8260B ORGM-501 & USEPA Method 8260B/C
--
Dichlorodifluoromethane 75–71–8 0.31 2 µg/L 8260B ORGM-501 & USEPA Method 8260B/C
--
Diesel range organics -- 3.26 25 µg/L 8015B ORGM-508 Rev. 1.0 & USEPA Method 8015D
--
Diethyl phthalate 84–66–2 0.38 4 µg/L 8270C ORGM-515 Rev. 1.1 & USEPA Method 8270D
--
Di-isopropyl ether 108–20–3 0.74 10 µg/L 8260B RSKSOP-259 Rev. 1 (USEPA Method 5021A plus 8260C)
--
Dimethyl phthalate 131–11–3 0.21 4 µg/L 8270C ORGM-515 Rev. 1.1 & USEPA Method 8270D
--
Di-n-butyl phthalate 84–74–2 1.16 4 µg/L 8270C ORGM-515 Rev. 1.1 & USEPA Method 8270D
--
Di-n-octyl phthalate 117–84–0 0.35 4 µg/L 8270C ORGM-515 Rev. 1.1 & USEPA Method 8270D
--
Diphenylamine -- 1.06 10 µg/L 8270C ORGM-515 Rev. 1.1 & USEPA Method 8270D
--
Ethanol 64–17–5 94 300 µg/L 8260B RSKSOP-259 Rev. 1 (USEPA Method 5021A plus 8260C)
--
Ethyl ether 60–29–7 0.26 2 µg/L 8260B ORGM-501 & USEPA Method 8260B/C
--
Ethyl tert-butyl ether (ETBE)
637–92–3 1.2 5 µg/L 8260B RSKSOP-259 Rev. 1 (USEPA Method 5021A plus 8260C)
--
Ethylbenzene 100–41–4 0.16 1 µg/L 8260B ORGM-501 & USEPA Method 8260B/C
--
Fluoranthene 206–44–0 4.53 100 ng/L 8270C/SIM ORGM-515 Rev. 1.1 & USEPA Method 8270D
--
Fluorene 86–73–7 18.8 100 ng/L 8270C/SIM ORGM-515 Rev. 1.1 & USEPA Method 8270D
--
Hexachlorobenzene 118–74–1 0.66 10 µg/L 8270C ORGM-515 Rev. 1.1 & USEPA Method 8270D
--
Hexachlorobutadiene 87–68–3 0.36 1 µg/L 8260B ORGM-501 & USEPA Method 8260B/C
--

55
Analyte (abbreviation)
U.S.Geological Survey
parameter code or CASRN1
TestAmerica Laboratories Method used in U.S.
Environmental Protection Agency Pavillion study
Comments Labor-atory MDL
Labor-atory
RL
Repor-ting
units
Laboratory analytical method
Hexachlorocyclopentadiene
77–47–4 10 50 µg/L 8270C ORGM-515 Rev. 1.1 & USEPA Method 8270D
--
Hexachloroethane 67–72–1 2.1 10 µg/L 8270C ORGM-501 & USEPA Method 8260B/C
--
Indeno (1,2,3-cd) pyrene 193–39–5 14.7 100 ng/L 8270C/SIM ORGM-515 Rev. 1.1 & USEPA Method 8270D
--
Iodomethane 74–88–4 0.23 1 µg/L 8260B ORGM-501 & USEPA Method 8260B/C
--
Isobutanol 78–83–1 36.5 110 µg/L 8260B RSKSOP-259 Rev. 1 (USEPA Method 5021A plus 8260C)
--
Isophorone 78–59–1 0.21 10 µg/L 8270C ORGM-515 Rev. 1.1 & USEPA Method 8270D
--
Isopropanol 67–63–0 13 40 µg/L 8260B RSKSOP-259 Rev. 1 (USEPA Method 5021A plus 8260C)
--
Isopropylbenzene 98–82–8 0.19 1 µg/L 8260B ORGM-501 & USEPA Method 8260B/C
--
m,p-Xylene 179601–23–1 0.34 2 µg/L 8260B ORGM-501 & USEPA Method 8260B/C
--
Methacrylonitrile 126–98–7 1.6 10 µg/L 8260B ORGM-501 & USEPA Method 8260B/C
--
Methanol 3.9 5 mg/L 8015B -- Methyl acrylate 96–33–3 -- -- -- -- ORGM-501 & USEPA Method
8260B/C --
Methyl tert-butyl ether (MTBE)
1634–04–4 0.25 5 µg/L 8260B ORGM-501 & USEPA Method 8260B/C
--
Methylene chloride 75–09–2 0.32 2 µg/L 8260B ORGM-501 & USEPA Method 8260B/C
--
Naphthalene 91–20–3 0.22 1 µg/L 8260B RSKSOP-259 Rev. 1 (USEPA Method 5021A plus 8260C)
--
n-Butanol 71–36–3 17 60 µg/L 8260B ORGM-501 & USEPA Method 8260B/C
--
n-Butyl benzene 104–51–8 0.32 1 µg/L 8260B ORGM-501 & USEPA Method 8260B/C
--
Nitrobenzene 98–95–3 0.81 10 µg/L 8270C RSKSOP-194 rev4 or RSKSOP-175 rev5
--
N-nitrosodimethylamine 62–75–9 0.29 10 µg/L 8270C ORGM-515 Rev. 1.1 & USEPA Method 8270D
--

56
Analyte (abbreviation)
U.S.Geological Survey
parameter code or CASRN1
TestAmerica Laboratories Method used in U.S.
Environmental Protection Agency Pavillion study
Comments Labor-atory MDL
Labor-atory
RL
Repor-ting
units
Laboratory analytical method
N-nitrosodi-n-propylamine
621–64–7 0.35 10 µg/L 8270C ORGM-515 Rev. 1.1 & USEPA Method 8270D
--
n-Propanol 71–23–8 -- -- -- -- RSKSOP-259 Rev. 1 (USEPA Method 5021A plus 8260C)
--
n-Propyl benzene 103–65–1 0.16 1 µg/L 8260B ORGM-501 & USEPA Method 8260B/C
--
o-Xylene 95–46–6 0.19 1 µg/L 8260B ORGM-501 & USEPA Method 8260B/C
--
Pentachlorophenol 87–86–5 20 50 µg/L 8270C ORGM-515 Rev. 1.1 & USEPA Method 8270D
--
Phenanthrene 85–01–8 9.75 100 ng/L 8270C/SIM ORGM-515 Rev. 1.1 & USEPA Method 8270D
--
Phenol 108–95–2 2 10 µg/L 8270C ORGM-515 Rev. 1.1 & USEPA Method 8270D
--
p-Isopropyltoluene -- 0.2 1 µg/L 8260B ORGM-501 & USEPA Method 8260B/C
--
Pyrene 129–00–0 8.08 100 ng/L 8270C/SIM ORGM-515 Rev. 1.1 & USEPA Method 8270D
--
Pyridine -- 1.7 20 µg/L 8270C ORGM-515 Rev. 1.1 & USEPA Method 8270D
--
sec-Butylbenzene 135–98–8 0.17 1 µg/L 8260B ORGM-501 & USEPA Method 8260B/C
--
Squalene -- -- -- -- -- ORGM-515 Rev. 1.1 & USEPA Method 8270D
--
Styrene 100–42–5 0.17 1 µg/L 8260B ORGM-501 & USEPA Method 8260B/C
--
Terpiniol -- -- -- -- -- ORGM-515 Rev. 1.1 & USEPA Method 8270D
--
tert-Amyl methyl ether (TAME)
994–05–8 1.4 5 µg/L 8260B RSKSOP-259 Rev. 1 (USEPA Method 5021A plus 8260C)
--
tert-Butyl alcohol 75–65–0 11 50 µg/L 8260B RSKSOP-259 Rev. 1 (USEPA Method 5021A plus 8260C)
--
tert-Butylbenzene 98–06–6 0.16 1 µg/L 8260B ORGM-501 & USEPA Method 8260B/C
--
Tetrachloroethene 127–18–4 0.2 1 µg/L 8260B ORGM-501 & USEPA Method 8260B/C
--
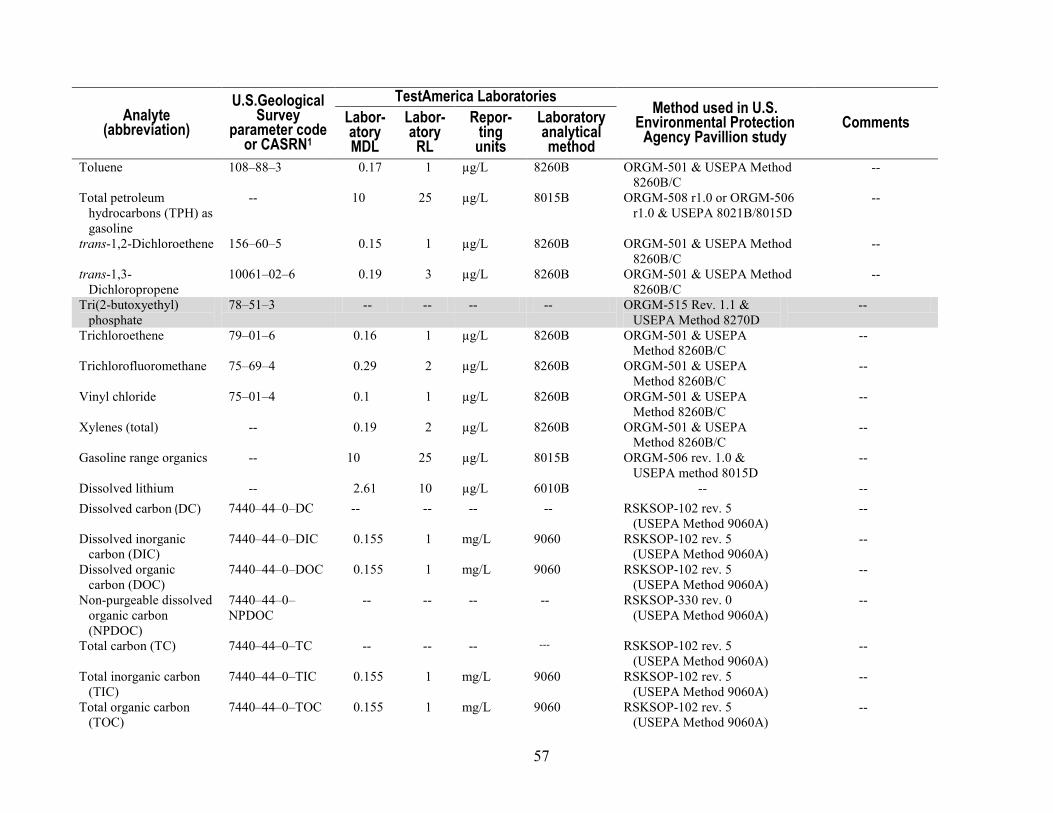
57
Analyte (abbreviation)
U.S.Geological Survey
parameter code or CASRN1
TestAmerica Laboratories Method used in U.S.
Environmental Protection Agency Pavillion study
Comments Labor-atory MDL
Labor-atory
RL
Repor-ting
units
Laboratory analytical method
Toluene 108–88–3 0.17 1 µg/L 8260B ORGM-501 & USEPA Method 8260B/C
--
Total petroleum hydrocarbons (TPH) as gasoline
-- 10 25 µg/L 8015B ORGM-508 r1.0 or ORGM-506 r1.0 & USEPA 8021B/8015D
--
trans-1,2-Dichloroethene 156–60–5 0.15 1 µg/L 8260B ORGM-501 & USEPA Method 8260B/C
--
trans-1,3-Dichloropropene
10061–02–6 0.19 3 µg/L 8260B ORGM-501 & USEPA Method 8260B/C
--
Tri(2-butoxyethyl) phosphate
78–51–3 -- -- -- -- ORGM-515 Rev. 1.1 & USEPA Method 8270D
--
Trichloroethene 79–01–6 0.16 1 µg/L 8260B ORGM-501 & USEPA Method 8260B/C
--
Trichlorofluoromethane 75–69–4 0.29 2 µg/L 8260B ORGM-501 & USEPA Method 8260B/C
--
Vinyl chloride 75–01–4 0.1 1 µg/L 8260B ORGM-501 & USEPA Method 8260B/C
--
Xylenes (total) -- 0.19 2 µg/L 8260B ORGM-501 & USEPA Method 8260B/C
--
Gasoline range organics -- 10 25 µg/L 8015B ORGM-506 rev. 1.0 & USEPA method 8015D
--
Dissolved lithium -- 2.61 10 µg/L 6010B -- -- Dissolved carbon (DC) 7440–44–0–DC -- -- -- -- RSKSOP-102 rev. 5
(USEPA Method 9060A) --
Dissolved inorganic carbon (DIC)
7440–44–0–DIC 0.155 1 mg/L 9060 RSKSOP-102 rev. 5 (USEPA Method 9060A)
--
Dissolved organic carbon (DOC)
7440–44–0–DOC 0.155 1 mg/L 9060 RSKSOP-102 rev. 5 (USEPA Method 9060A)
--
Non-purgeable dissolved organic carbon (NPDOC)
7440–44–0–NPDOC
-- -- -- -- RSKSOP-330 rev. 0 (USEPA Method 9060A)
--
Total carbon (TC) 7440–44–0–TC -- -- -- --- RSKSOP-102 rev. 5 (USEPA Method 9060A)
--
Total inorganic carbon (TIC)
7440–44–0–TIC 0.155 1 mg/L 9060 RSKSOP-102 rev. 5 (USEPA Method 9060A)
--
Total organic carbon (TOC)
7440–44–0–TOC 0.155 1 mg/L 9060 RSKSOP-102 rev. 5 (USEPA Method 9060A)
--

58
Analyte (abbreviation)
U.S.Geological Survey
parameter code or CASRN1
TestAmerica Laboratories Method used in U.S.
Environmental Protection Agency Pavillion study
Comments Labor-atory MDL
Labor-atory
RL
Repor-ting
units
Laboratory analytical method
Acetylene 74–86–2 -- -- -- -- RSKSOP-194 rev4 and RSKSOP-175 rev5
--
Butane 106–97–8 -- -- % ASTM D-1945
RSKSOP-194 rev4 and RSKSOP-175 rev5
--
Ethane 74–84–0 0.57 5 µg/L RSKSOP-175 RSKSOP-194 rev4 and RSKSOP-175 rev5
--
Ethylene (C2H4) -- 0.398 5 µg/L RSKSOP-175 -- -- Methane 74–82–8 0.218 5 µg/L RSKSOP-175 RSKSOP-194 rev4 and
RSKSOP-175 rev5 --
Propane (TestAmerica Laboratories Pittsburgh)
74–98–6 5 5 µg/L RSKSOP-175 RSKSOP-194 rev4 and RSKSOP-175 rev5
--
Diethylene glycol 111–46–6 7.73 25 mg/L 8015B USEPA Region 3 LC/MS/MS method
--
Ethylene glycol 107–21–1 8.63 25 mg/L 8015B USEPA Method 8015M -- Propylene glycol 57-55-6 18.7 25 mg/L 8015B USEPA Method 8015M Tetraethylene glycol 112–60–7 -- -- -- -- USEPA Region 3
LC/MS/MS method --
Triethylene glycol 112–27–6 8.45 25 mg/L 8015B USEPA Region 3 LC/MS/MS method
--
Acetate 127–09–3 -- -- -- -- RSKSOP-112 Rev. 6 -- Butyrate 156–54–7 -- -- -- -- RSKSOP-112 Rev. 6 -- Formate 141–53–7 -- -- -- -- RSKSOP-112 Rev. 6 -- Isobutyrate 19455–20–0 -- -- -- -- RSKSOP-112 Rev. 6 -- Lactate 867–56–1 -- -- -- -- RSKSOP-112 Rev. 6 -- Propionate 137–40–6 -- -- -- -- RSKSOP-112 Rev. 6 -- 1
This report contains Chemical Abstracts Services Registry Numbers (CASRN)®, which is a Registered Trademark of the American Chemical Society. The CASRN online database provides the latest registry number information: http://www.cas.org/. Chemical Abstracts Services recommends the verification of the CASRNs through CAS Client ServicesSM.

59
Appendix B. Method detection limits and method reporting levels of selected compounds identified by U.S. Environmental Protection Agency (USEPA) as affecting geochemistry in deep groundwater monitoring wells near Pavillion, Wyoming [NA, not applicable; mg/L, milligrams per liter; µg/L, micrograms per liter; no available method, currently (2012) the USGS National Water Quality Laboratory and TestAmerica Laboratories, the USGS contract laboratory, do not have an analytical method for this compound; R8, U.S. Environmental Protection Agency Region 8 laboratory analysis; R3, U.S. Environmental Protection Agency Region 3 laboratory analysis]
Compound (abbreviation) USEPA reporting level
TestAmerica Laboratories method detection limits for proposed analyses
TestAmerica Laboratories
reporting level for proposed analyses
pH NA NA NA Potassium (K) 0.127 mg/L 0.237 mg/L 0.3 mg/L Chloride (Cl) 1.00 mg/L 0.254 mg/L 3.0 mg/L Methane (CH4) 2.5 µg/L 0.22 µg/L 5 µg/L Benzene 0.25 µg/L 0.16 µg/L 1.0 µg/L Toluene 0.25 µg/L 0.17 µg/L 1.0 µg/L Ethylbenzene 0.25 µg/L 0.16 µg/L 1.0 µg/L Xylenes (total) 1.0 µg/L 0.19 µg/L 2 µg/L 1,2,4-Trimethylbenzene 0.25 µg/L 0.15 µg/L 2 µg/L 1,3,5-Trimethylbenzene 0.25 µg/L 0.16 µg/L 1 µg/L Diesel range organics 20 µg/L 32.6 µg/L 25 µg/L Gasoline range organics 20 µg/L 10 µg/L 25 µg/L Phenol 0.5 µg/L 2 µg/L 10 µg/L Naphthalene 0.25 µg/L 0.22 µg/L 0.1 µg/L Isopropanol 100 µg/L 13 µg/L 40 µg/L tert-Butyl alcohol 5 µg/L 11 µg/L 50 µg/L 2-Butanone 0.5 µg/L 2 µg/L 6 µg/L Diethylene glycol 50 µg/L 7,730 µg/L 25,000 µg/L Triethylene glycol 10 µg/L 8,450 µg/L 25,000 µg/L Tetraethylene glycol 10 µg/L No available method No available method 2-Butoxyethanol 1.0 µg/L (R8), 10 µg/L (R3) 0.5 µg/L 2 µg/L Acetone 1.0 µg/L 1.9 µg/L 10 µg/L Benzoic Acid 1.0 µg/L 10 µg/L 25 µg/L Acetate 0.1 mg/L No available method No available method Formate 0.1 mg/L No available method No available method Lactate 0.1 mg/L No available method No available method Propionate 0.1 mg/L No available method No available method

60
Appendix C. Field forms.
Appendix C–1. Groundwater Site Schedule, Form 9-1904-A.
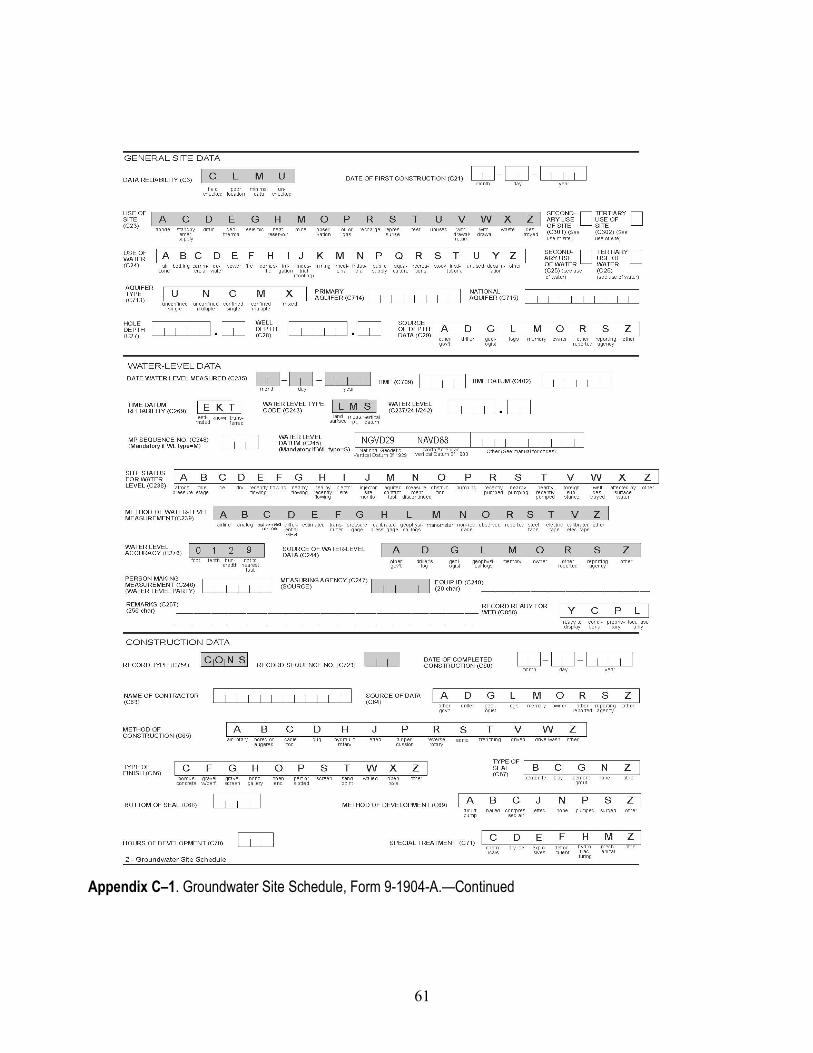
61
Appendix C–1. Groundwater Site Schedule, Form 9-1904-A.—Continued
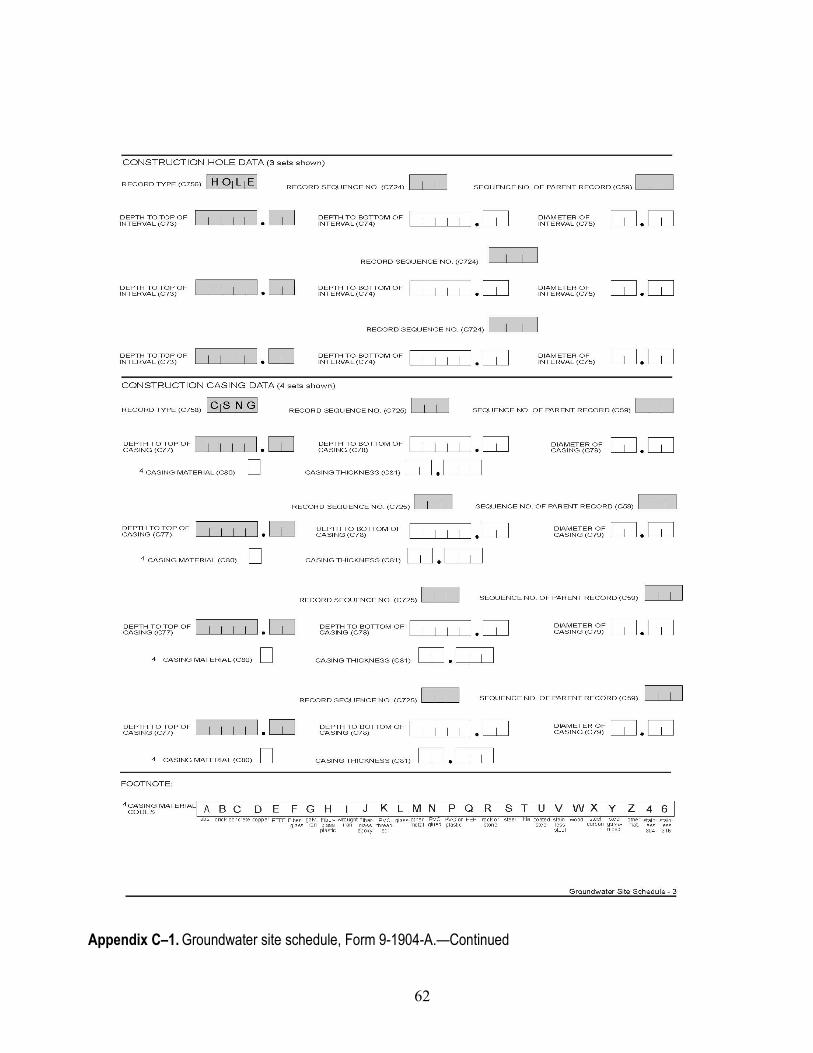
62
Appendix C–1. Groundwater site schedule, Form 9-1904-A.—Continued
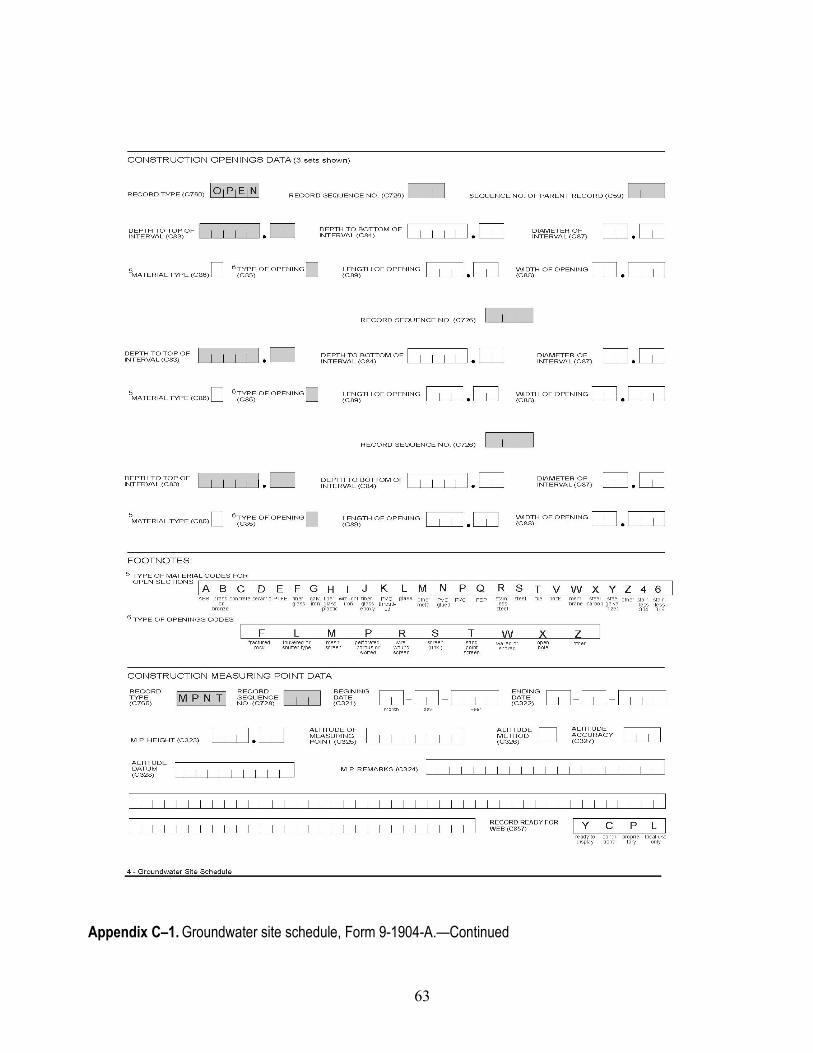
63
Appendix C–1. Groundwater site schedule, Form 9-1904-A.—Continued

64
Appendix C–1. Groundwater site schedule, Form 9-1904-A.—Continued

65
Appendix C–1. Groundwater site schedule, Form 9-1904-A.—Continued

66
Appendix C–1. Groundwater site schedule, Form 9-1904-A.—Continued
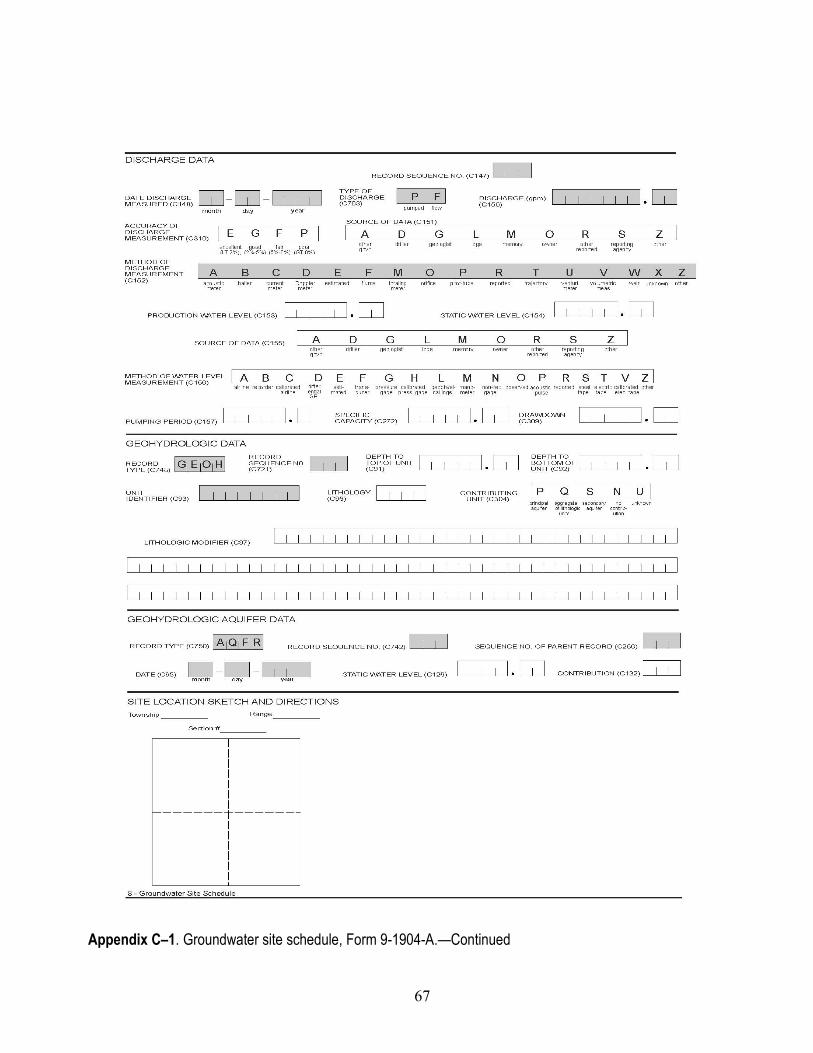
67
Appendix C–1. Groundwater site schedule, Form 9-1904-A.—Continued

68
Appendix C–2. Groundwater Field Form, version 8.0.
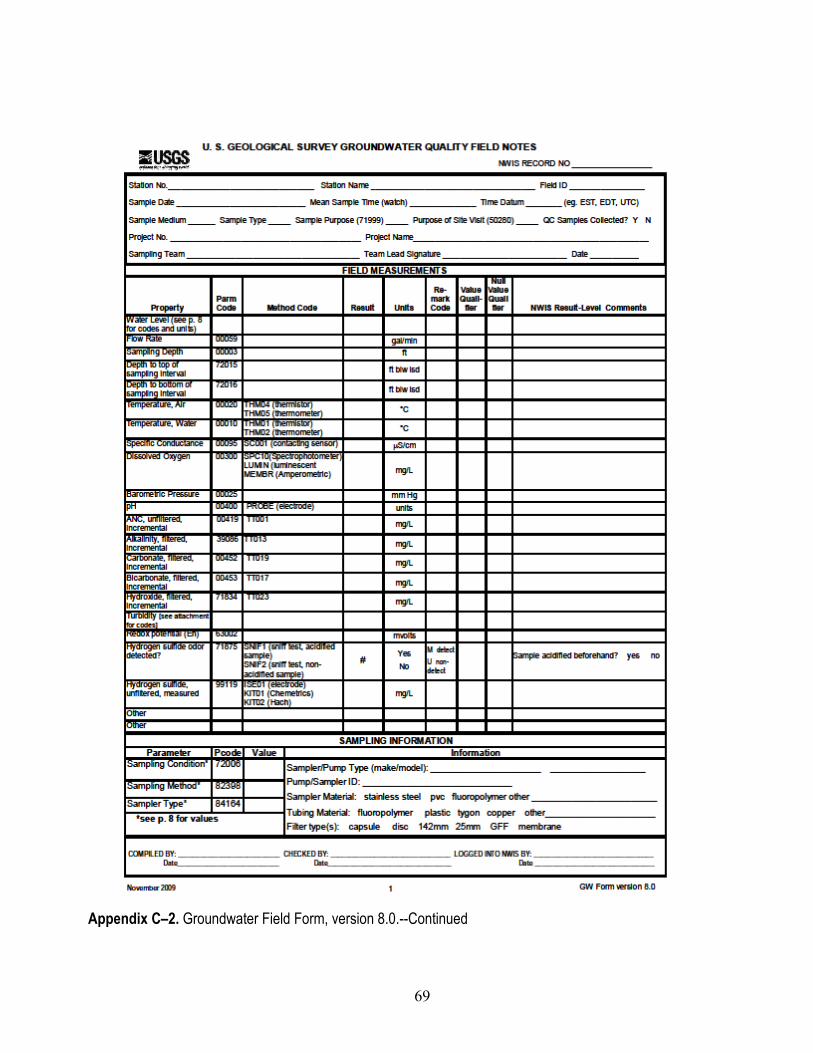
69
Appendix C–2. Groundwater Field Form, version 8.0.--Continued
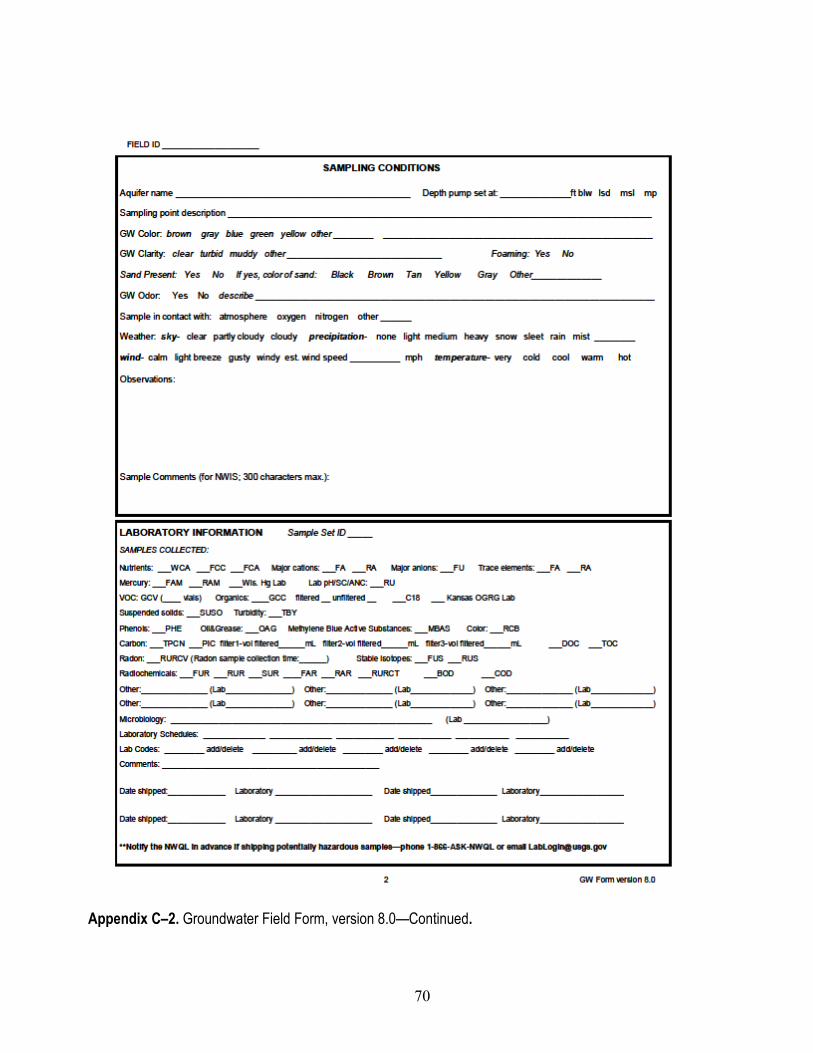
70
Appendix C–2. Groundwater Field Form, version 8.0—Continued.

71
Appendix C–2. Groundwater Field Form, version 8.0—Continued.

72
Appendix C–2. Groundwater Field Form, version 8.0—Continued.

73
Appendix C–2. Groundwater Field Form, version 8.0—Continued.
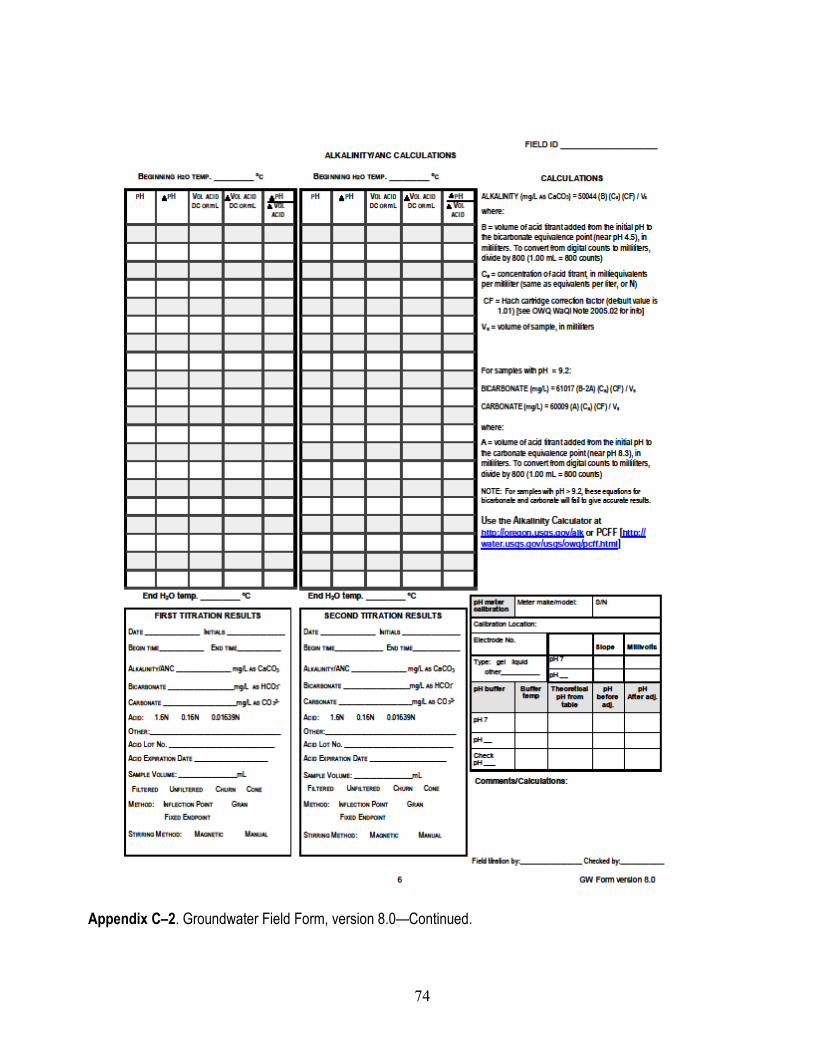
74
Appendix C–2. Groundwater Field Form, version 8.0—Continued.

75
Appendix C–2. Groundwater Field Form, version 8.0—Continued.

76
Appendix C–2. Groundwater Field Form, version 8.0—Continued.

77
Appendix C–3. U.S. Geological Survey – contract laboratory analytical services request form.

78
Appendix D. List of Groundwater Sampling Equipment and Supplies

79
Appendix E. Job Hazard Analysis
Collection of groundwater samples near Pavillion, Wyoming
JOB HAZARD ANALYSIS
JOB: Collecting Groundwater Samples from Wells
Date Created: 1/30/12
PREPARED BY: P.R.Wright PAGE 1 OF 3
REVIEWED BY: Recommended Protective Clothing and Equipment:
See JHA on Environmental Hazards – attached below
Safety goggles, appropriate gloves, foul weather gear.
Emergency Contacts
Local Hospital
Ambulance 911 Fremont County Fire Protection District 911 Fremont County Sheriff 911 Poison Control Center 800-222-1222 David Mott – WYWSC Chief Office. 307-775-9162 Cell 307-631-9816 Peter Wright – Proj. Safety Office 406-656-1444, ext. 11 Officer Cell 406-696-23375 Riverton Memorial Hospital (307)856-4161 2100 West Sunset Drive Riverton, WY 82501
Sequence of Basic Job
Steps
Potential Accidents/Hazards
Recommended Safe Job Procedures
Conduct a safety inspection
Slip, trip and fall hazards Assess work area around monitor well and remove hazards if necessary.
Breathing hazardous fumes
Make a site assessment. Using a calibrated (document in project logbook) four-gas meter (oxygen, combustible gasses (LEL), carbon monoxide, and hydrogen sulfide) measure air in work area, particularly around monitor well for hazardous (explosive or low oxygen)

80
conditions. Document gas meter readings in project logbook. If conditions are hazardous (see real-time air monitoring action levels below), ventilate work area and evaluate why conditions changed. If conditions persist and are explosive stop all work, shut down all powered equipment, such as generators, take four-gas meter, and evacuate all personnel to a safe location upwind from the site. If conditions persist and are hazardous due to low oxygen and/or high carbon monoxide or hydrogen sulfide stop all work, take four-gas meter and evacuate all personnel to a safe location upwind of the site. If appropriate, contact the local fire department. Use four-gas meter to determine when it is safe to return to site. Be aware of hazardous fumes. Work upwind and in a well-ventilated area.
Real-time air monitoring action levels
Oxygen: ≤20% O2 Oxygen: ≥22% O2 Combustible gas: ≤10% LEL Hydrogen sulfide (H2S): ≥10 ppm H2S Carbon monoxide (CO): ≤25 ppm CO All measurements must be confirmed prior to any action.
Pressurized monitoring well
Open pressure release valve on monitoring well and allow pressure to equilibrate before continuing sampling operation. Continue air monitoring during this process.
Collecting water samples
Back or muscle strain Use proper lifting techniques when lifting pumps or generators.
Back or muscle strain Use proper lifting techniques when lifting pumps or generators.
Fire / explosion / contamination hazard from refueling generators
Before refueling generator, let the generator cool down. Fuels and other hydrocarbons will be segregated from samples to minimize contamination. All fuels will be transported in approved safety containers. The use of containers other than "safety types" is prohibited. See attached JHA for Gasoline Use -attached
Electrocution A ground fault circuit interrupter device must protect all AC electrical circuits. Make sure

81
the electrical cords from generators and power tools are not allowed to be in contact with water. Do not stand in a wet area while operating power equipment.
Fire / explosion hazard from refueling generators.
Before refueling generator, let the generator cool down.
Breathing hazardous fumes
Monitor air quality during well purge and groundwater sampling using a calibrated four-gas meter (oxygen, combustible gasses (LEL), carbon monoxide, and hydrogen sulfide) conditions to ensure safe air quality throughout sampling activities. Document gas meter readings in project logbook. If conditions become hazardous (see real-time air monitoring action levels, above), verify instrument measurements, ventilate work area and evaluate why conditions changed. If conditions persist and are explosive stop all work, shut down all powered equipment, such as generators take four-gas meter, and immediately. If conditions persist and are hazardous due to low oxygen and/or high carbon monoxide or hydrogen sulfide stop all work take four-gas meter and immediately evacuate all personnel to a safe location upwind of the site. If appropriate, contact the local fire department. Use four-gas meter to determine when it is safe to return to site. Be aware of hazardous fumes. Work upwind and in a well-ventilated area.
Infectious water-borne diseases
Wear appropriate gloves. Prevent water from contacting your skin.
Breathing fumes from sample preservatives
Always work in a well-ventilated area.
Sample processing
Contaminated water source
Wear appropriate gloves and safety glasses. Prevent water from contacting your skin. A pair of coveralls or Tyvek suit or apron can be worn to minimize skin contact. Work in well-ventilated area.
Well water will be contained onsite in a container truck provided by a waste hauler contracted by the State of Wyoming. Waste water will be disposed in accordance with State of Wyoming requirements.
See JHAs for use of appropriate sample preservatives such as Nitric Acid,

82
Hydrochloric Acid, and Sulfuric Acid Ampoules – attached.
Shipping samples
Freeze burns, back strain, hazardous chemical or sample leakage.
Wear appropriate gloves when handling dry ice. Follow safe lifting techniques. Vehicles that transport chemicals shall be equipped with applicable Material Data Safety Sheets (MSDSs). Chemicals will be transported in compliance with Wyoming Department of Transportation (WDOT) regulations.
Samples shipped to laboratories will be appropriately labeled for potential hazards. All reasonable precautions will be used to prevent leaks or broken samples.
Samples that contain hazardous materials must be packed, manifested, and shipped by personnel that have WDOT or appropriate HazMat training.
Good hygiene Wash hands prior to touching food or smoking (There will be no smoking on site!)

83
JOB HAZARD ANALYSIS
JOB: Environmental Hazards Date Created: 2/13/12
PREPARED BY: Peter Wright PAGE 1 OF 2
REVIEWED BY:
Recommended Protective Clothing and Equipment:
Safety glasses, appropriate gloves, appropriate foot wear, personal floatation device (PFD), water, sunblock,
sunglasses, protective clothing, foul weather gear, rope, and shovel.
Sequence of Basic Job
Steps
Potential Accidents/Hazards
Recommended Safe Job Procedures
Walking to, from and around field site
Slip, trip and fall hazards Ensure path is clear and free of obstructions. Ensure footing at the field site work area is sound.
Lightning strikes Do not work around or during thunderstorms.
Dehydration/heat exhaustion/sun stroke
In warm/hot weather, rest often and drink plenty of water or electrolyte drink.
Hypothermia/frostbite Wear foul weather gear during winter months. Sunburn Protect yourself from the sun. Use sunblock
when it will not interfere with water-quality samples, wear light protective clothing, sunglasses and hat.
Slippery conditions Use appropriate footwear when mud, snow or ice conditions exist.
Snake bites Wear appropriate foot and leg protection. If you are bitten seek help immediately. DO NOT CUT and SUCK!! This may make the bite worse.
Attack by wild animals Be familiar with animal behavior. If firearms are needed for protection from animals follow regulations as stated in WRD memo 98.27.
Insect bites or stings Wear appropriate insect repellant if it will not impair water-quality samples. At the end of the work day check body for ticks. Avoid wasp or hornet nests.
Poisonous plants Wear appropriate clothing. Wash all exposed areas of skin with cold water only.

84
Opening gage house or monitoring well
Insect bites or stings Check carefully around shelter for wasps or spiders. Use sprays to kill insects. Do not use chemicals if they will contaminate a well or could cause contamination of water-quality samples.
Infectious diseases Watch for bats, rodent nests or droppings. If a nest or droppings are present special precautions must be taken to prevent illness or death.
Working in or around surface waters
Infectious water-borne diseases
Wear appropriate gloves. Prevent water from touching your skin.
Contaminated water source
Wear appropriate gloves. Prevent water from touching your skin. Work in a well ventilated area.
Snake bites Wear appropriate foot and leg protection. If you are bitten seek help immediately. DO NOT CUT and SUCK!! This may make the bite worse.
Drowning/rapidly rising
stage Wear appropriate personal floatation device (PFD). Be familiar with weather conditions occurring upstream. Be prepared to move to higher ground.

85
JOB HAZARD ANALYSIS
JOB: Gasoline Use Date Created: 2/13/12
PREPARED BY: Peter Wright PAGE 1 OF 1
REVIEWED BY:
Recommended Protective Clothing and Equipment:
Safety glasses, Appropriate gloves Sequence of
Basic Job Steps
Potential Accidents/Hazards
Recommended Safe Job Procedures
Filling up gas cans
Fire, explosion Remove gas cans from field vehicle to fill. Do not fill gas cans in pickup truck with plastic bed liners. Static electricity may cause fire or explosion.
Breathing fumes/toxic vapors
Avoid breathing fumes. Stand up wind if possible. Gasoline contains harmful fumes.
Chemical burns Wear appropriate gloves. Avoid contact with skin. May cause serious chemical burns.
Transporting gasoline
Fire/explosion Transport gasoline in an approved container with a flash arrestor vent. Transport no more than 5 gallons. Do not store overnight in field vehicles.
Breathing fumes/toxic vapors
Use only cans that are in good working order. Secure caps tightly to prevent fumes from entering the vehicle. Secure can tightly to vehicle. When transporting gasoline cans do not mount cans outside of motor vehicle.
Refueling small engines
Fire, explosion Let engine cool down before refueling.

86
JOB HAZARD ANALYSIS JOB: Sample preservation: Nitric
Acid and Hydrochloric acid ampoule
Date Created: 2/14/12
PREPARED BY: Peter Wright PAGE 1 OF 1
REVIEWED BY:
Recommended Protective Clothing and Equipment:
Safety glasses, safety goggles, protective gloves, eye wash
See MSDS for additional HNo3 and/or HCL safety information
Sequence of Basic Job
Steps
Potential Accidents/Hazards
Recommended Safe Job Procedures
Opening box of ampoules
Cuts or punctures with a knife
Use appropriate techniques when using a knife.
Open/leaking ampoules in box
Wear protective eyewear and gloves when removing ampoules from box. Dispose of preservative and ampoules by an approved method.
Open ampoules in box – Breathing fumes
Always work in a well ventilated area.
Opening ampoules
Skin contact chemical burns
Wear protective eyewear and gloves. Fumes may come in contact with perspiration on your skin and rehydrate to form acid. If skin itches, flush affected area for up to 15 minutes with water. Tap water is kept in vehicle for cleaning.
Eye contact Wear protective eyewear. If acid splashes in the eyes, flush eyes using eye bottle and seek medical advice.
Breathing fumes HNO3 and HCL have high vapor pressure. Always work in a well ventilated area.
Adding acid to sample
Chemical reaction Wear protective eyewear and gloves. Acid may react with highly alkaline sample and fizz (releasing CO2).
Eye contact Wear protective eyewear. If acid splashes in the eyes, flush eyes using eye bottle and seek medical advice.
Skin contact chemical burns
Wear protective eyewear and gloves.
Ampoule disposal
Eye and skin contact chemical burns
Follow recommended procedures listed above until ampoules are disposed of properly.

87
Appendix F. USGS Central Region Research Drilling Chief’s Project Log for Redevelopment of MW02
USGS ACTION PLAN FOR REDEVELOPING EPA WELL MW-02 SITE AT PAVILLION, WYOMING
The following is the action plan developed by Art Clark (Chief, USGS Central Region Research Drilling Project) in conjunction with the Pavillion Technical Team during April, 2012 for redevelopment activities for deep monitoring well MW-02 at Pavillion, Wyo. The effort was undertaken to extract the existing pump and to attempt to improve the yield on the monitoring pump. The planned activities are given below (black) with a review of the actual activities and observations (blue).
Monday 4/30/12 planned: • Drive from Denver to Riverton. Meet with USEPA at MW02 at ~ 14:00 to discuss plans and
logistics. • USGS (Denver) brings two new enclosed 500-gallon water tanks for storing Riverton water at
site. • Water truck arrives with 1,000 gallons of Riverton water at 15:00 – transfer water into holding
tanks. • Drill rig and equipment drives from Denver to Riverton.
Monday 4/30/12 actual: • Art Clark (Chief, USGS Central Region Research Drilling Project) and Jeff Eman (USGS drill
foreman) drove from Denver to Pavillion, WY site MW-02 to meet with USEPA, USGS-WY, and WY-state personnel to discuss and finalize site plans and stimulation methods. We delivered two new 550-gallon water storage tanks to hold Riverton drinking water and water removed from well.
• Water truck contracted by WY DEQ delivers 1,100 gallons of Riverton water to the site and the holding tanks are filled.
• Monitored for methane (CH4) at the wellhead: 14% CH4 inside wellhead and was 0% CH4 outside wellhead.
• The drilling rig and associated equipment was driven by the drill crew from Denver to Riverton.
Tuesday 5/1 planned: • Mobilize drilling equipment to Pavillion, Wyo., site MW-02 • Set up decon area and steam-clean drill rig and equipment as necessary • Monitor for CH4 at wellhead and inside 20-in protective well cover
o Vent accumulated CH4 from inside cover if/as necessary • Inside protective cover, remove 2-in side bushing from 4-in well casing • Insert hose in 2-in side opening and pump Riverton water into 4-in casing at 10-20 gallons per
minute (gpm) until full o Collect splits of purge water from discharge side during purging activities o Monitor vented gas during purge o When 4-in casing is filled, let sit for ½ hour and top off with fluid
• Reinsert 2-in bushing, monitor and vent gas from wellhead area if/as necessary, and cut 20-in well cover to ~2-ft height for increased rig accessibility
• Position drill rig over MW-02 and move other equipment onsite as required o Install visqueen liner beneath rig

88
• Attach to 4-in well cover and raise from 4-in well casing o Assess discharge pipe, monitor pipe, and pump cable configuration and determine
optimum equipment removal methodology • Remove equipment from well
o Pipe to be placed on saw horses or designated trailer o Pump cable to be coiled on designated spool o Pump to be left attached to cable or disconnected and placed on pipe trailer o Wellhead area to be monitored for CH4 throughout pull.
Tuesday 5/1/12 actual:
• The drill rig was driven from Riverton to MW-02 site and steam-cleaned. The drill rig was also steam-cleaned in Denver prior to leaving as was all equipment used at the site.
• Removed the 2-in bushing from side of the wellhead, assembled the pumps and hoses, and slowly pumped Riverton water from one 550-gallon tank into the well. USGS-WY and EPA collect samples of water used to purge well.
• Monitored for CH4 vented from the well during purge. The concentration inside wellhead increased from 14% CH4 at start to 100% CH4 towards end of the well purging. Once the water inside well reached land surface, CH4 readings drop to 0%.
• Cut the 20-in diameter protective well cover to 2 ft above land surface to allow for better rig access. Set rig over the well and pull the submersible pump assembly (1-in stainless steel discharge pipe, 1-in PVC tagging tube, 4-strand pump wire, and 4-in pump) from well.
• Monitor for CH4 during pull – 0% readings. • Based on the removed discharge pipe, the pump intake was set at 964 ft below land surface (bls).
Run tagging tape down well and tag bottom at 990 ft bls. Wednesday 5/2 planned:
• Run state-owned optical televiewer in well o Verify well bottom depth with televiewer or tag line
• Attach 4-in surge block to 1-in drop pipe removed from well and insert to well bottom o 1-in ball valve attached to top of pipe will allow for vacuum or venting as desired
• Begin surging activities.
Wednesday 5/2/12 actual: • Monitored for CH4 at wellhead – 0%. • Set up and ran WY state-owned and operated down-hole camera in well to bottom. Saw that the
screen was intact but some mud/sediment was noted along screen surface. Impossible to tell whether screen was plugged because only the inner-surface of the screen slots can be seen.
• Removed camera, attached 4-in surge block to cleaned 1-in stainless steel discharge pipe and installed it to 924 ft bls. Note: Did not run block inside well screen as the screen’s internal ribs would have cut the rubber block rendering it useless and leaving rubber material in the bottom of the well.
• Spent 3 hours surging the well between 904 ft and 924 ft bls using 1-in ball-valve attached to the top of the pipe to alternatively create under- and over-pressure conditions at the well screen.
• Removed surge block from the well while monitoring for CH4 – 0%. Well water was not pulled to surface during the removal of the surge block as anticipated. Therefore, no additional Riverton water was added to the well.

89
• Attempted to run 3-in diameter bailer down hole to remove sediment and collect water sample from well bottom for observation purposes only. Bailer wedged in well at approximately 200 ft bls and could not be worked past this point.
• Removed 3-in bailer and installed a 2-in polyvinyl chloride (PVC) bailer. Made five runs with bailer to well bottom, removing moderate amount of sediment and approximately 15 gallons total fluid. Fluid removed was very dark and had a strong odor.
• Tag water level in well at day’s end at approximately 235 ft bls. Thursday 5/3 planned:
• Continue surging activities o Surge slowly thru screened interval o Monitor at wellhead for CH4 during surging activities
• Remove surge block from well and tag well bottom o Collect and store purged water (between 4-in and 1-in pipe) in emptied 500-gallon tank. o Add Riverton water in top of 1-in pipe every 20 ft to keep well area below surge block
fluid filled • Use bailer to remove sediment from well bottom if/as necessary
Thursday 5/3/12 actual: • Monitored for CH4 in wellhead – 0%. Tag water level at ~234 ft bls. • Set up and ran downhole camera in well to bottom. However, the fluid in the well was too turbid
to view anything. • Removed camera and bailed well from bottom for 4.5 hrs then begin bailing from top of fluid.
Fluid removed from well bottom became slightly less turbid, but continued to have a strong odor. Fluid from the top is turbid but odor-free. All removed fluid is captured and held in emptied 550-gallon water tank.
• Bailed well for 2.5 hrs from top of fluid. • Tag water level at day’s end at ~503 ft bls. CH4 reading at day’s end is 0%.
Friday 5/4 planned:
• Run downhole camera in well • Install downhole equipment or purge water from well as directed.
o Collect purge water in 500-gallon tanks o Monitor for methane gas during water purge
Friday 5/4/12 actual: • Monitor for CH4 in wellhead – 0%. Tag water level at ~498 ft bls and begin bailing. • Collected one bail from well bottom then bailed ~9 hrs from fluid surface to within ~40 ft of well
bottom. Water continued to be turbid and water from well bottom continued to have a strong odor.
• Discontinued bailing and tagged water level at ~950 ft bls. • Water truck arrived to transport well fluid for disposal. Pumped water from holding tank into
truck. • Dropped water storage tanks, pipe, and 4-in submersible pump and cable in rancher’s yard.
Packed equipment. • Reattached 20-in protective well cover and drove equipment from Pavillion site to Riverton.
Saturday 5/5 planned: • Monitor for methane gas and install lockable well cover
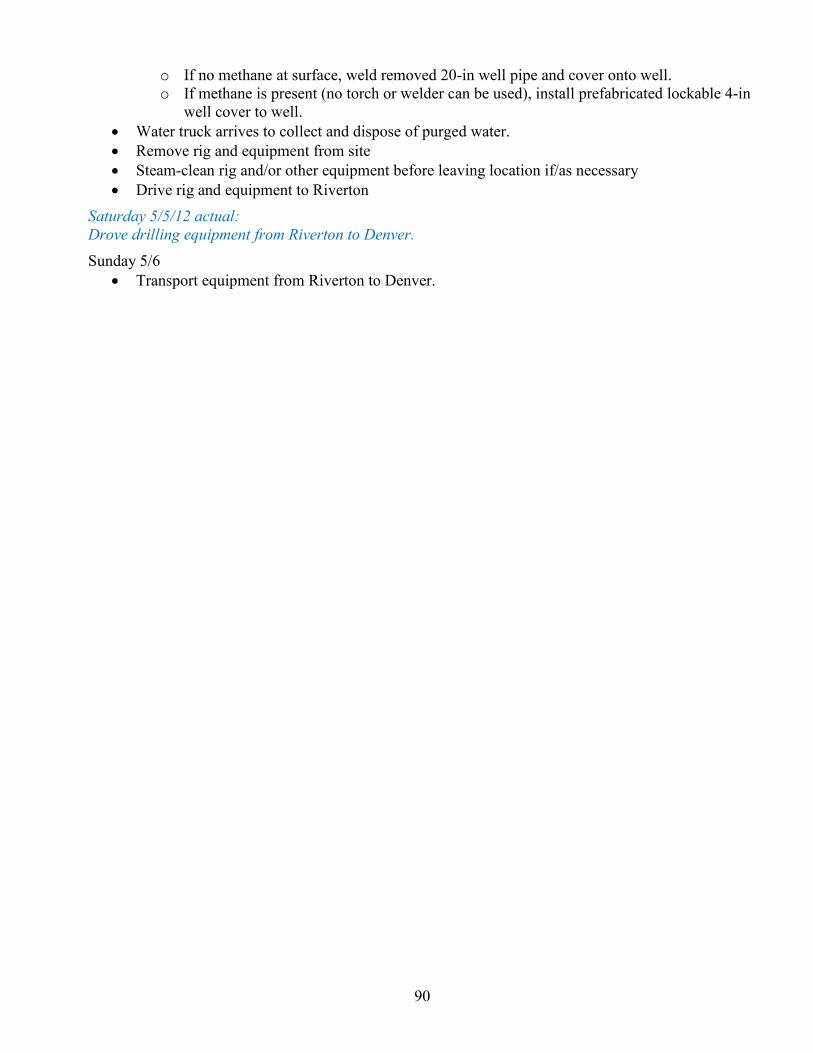
90
o If no methane at surface, weld removed 20-in well pipe and cover onto well. o If methane is present (no torch or welder can be used), install prefabricated lockable 4-in
well cover to well. • Water truck arrives to collect and dispose of purged water. • Remove rig and equipment from site • Steam-clean rig and/or other equipment before leaving location if/as necessary • Drive rig and equipment to Riverton
Saturday 5/5/12 actual: Drove drilling equipment from Riverton to Denver. Sunday 5/6
• Transport equipment from Riverton to Denver.