user-centered design
DESCRIPTION
User-Centered Design. Getting User Feedback. Agenda. Focus groups In-lab studies A/B testing Card sorting Traffic analysis. Focus Groups. What are focus groups?. A “somewhat informal” method of gathering qualitative data - PowerPoint PPT PresentationTRANSCRIPT
G E TT I N G U S E R F E E D B AC K
USER-CENTERED DESIGN
AGENDA
• Focus groups• In-lab studies• A/B testing• Card sorting• Traffic analysis
FOCUS GROUPS
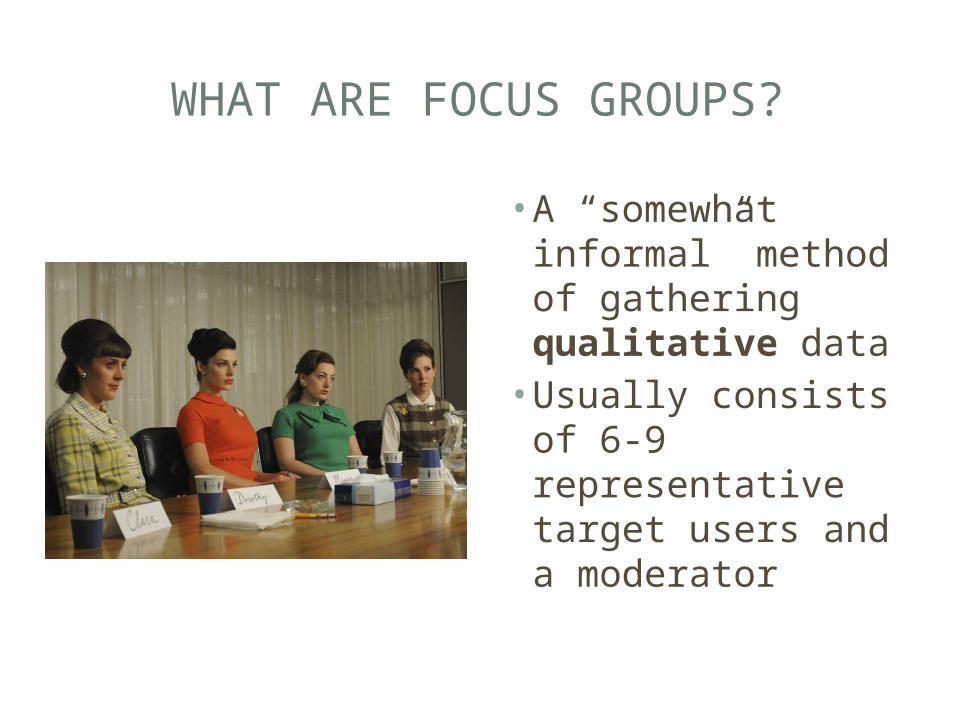
WHAT ARE FOCUS GROUPS?
• A “somewhat informal” method of gathering qualitative data• Usually consists of
6-9 representative target users and a moderator
FOCUS GROUPS: THE PROS
• Focus groups are great a great way to find out what your users want and need from your product• This is your chance to get a feel for how your
ideas will be received by the public before investing much time and money on them

FOCUS GROUPS: THE CONS
• Focus groups don’t show you what users do; they show you want users say they do• Information from focus groups can be inaccurate• Focus groups cannot be used to evaluate the
usability or efficiency of a user interface
IN-LAB STUDIES
WHAT ARE IN-LAB STUDIES?
• In-lab studies are a method of usability testing which involves observing users complete a set of predetermined tasks in a controlled environment
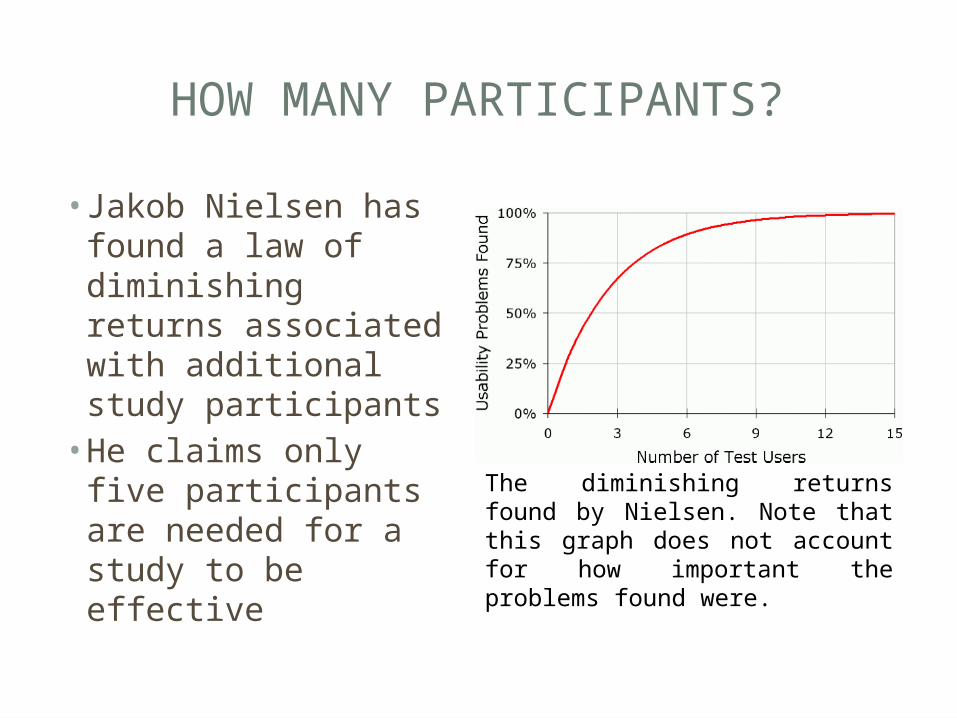
HOW MANY PARTICIPANTS?
• Jakob Nielsen has found a law of diminishing returns associated with additional study participants• He claims only five
participants are needed for a study to be effective
The diminishing returns found by Nielsen. Note that this graph does not account for how important the problems found were.
RESPONSES TO NIELSEN’S MAGIC NUMBER 5
• Nielsen’s advice is somewhat controversial, but it is important to consider some qualifications:• The number 5 only applies to identifying usability
problems; for gathering quantitative data, Nielsen recommends 20 participants
• Nielsen advocates running multiple lab sessions and designing iteratively • So if you can afford 20 participants, it’s better to have 4
rounds of 5 users than 1 round of 20. • Nielsen advises including more participants if your
system will be used by two or more distinct groups of users (e.g. buyers and sellers)
RECRUITING PARTICIPANTS
• Participants in your usability study should be representative of your user base• Consider your target demographic• Age• Level of comfort with technology• Level of experience with previous versions of your
system (if applicable) • Level of experience with similar and/or competing
systems
COMPARING DESIGNS: BETWEEN-SUBJECTS VS. WITHIN-SUBJECTS
• Let’s say you have 2+ potential designs and you would like to find out which one users prefer• You can show each individual participant only one
design (between-subjects testing) or multiple designs (within-subjects testing)• Between-subjects testing avoids biasing users by
exposing them to multiple options• Within-subjects testing requires fewer
participants
COMPARING DESIGNS: COUNTERBALANCING
• The sequence in which a user is introduced to different designs can affect their opinion of the designs• Biasing – if a participant sees super-difficult-to-use Version A
before less-difficult-to-use Version B, they are more likely to view Version B as very easy to use
• Priming – if the participant uses Version A to complete a task, that knowledge can sometimes help in using Version B to complete the same task
• These effects can be mitigated using counterbalancing. The easiest way to counterbalance a within-subjects study is to randomize the order in which designs are presented
SELECTING TEST TASKS
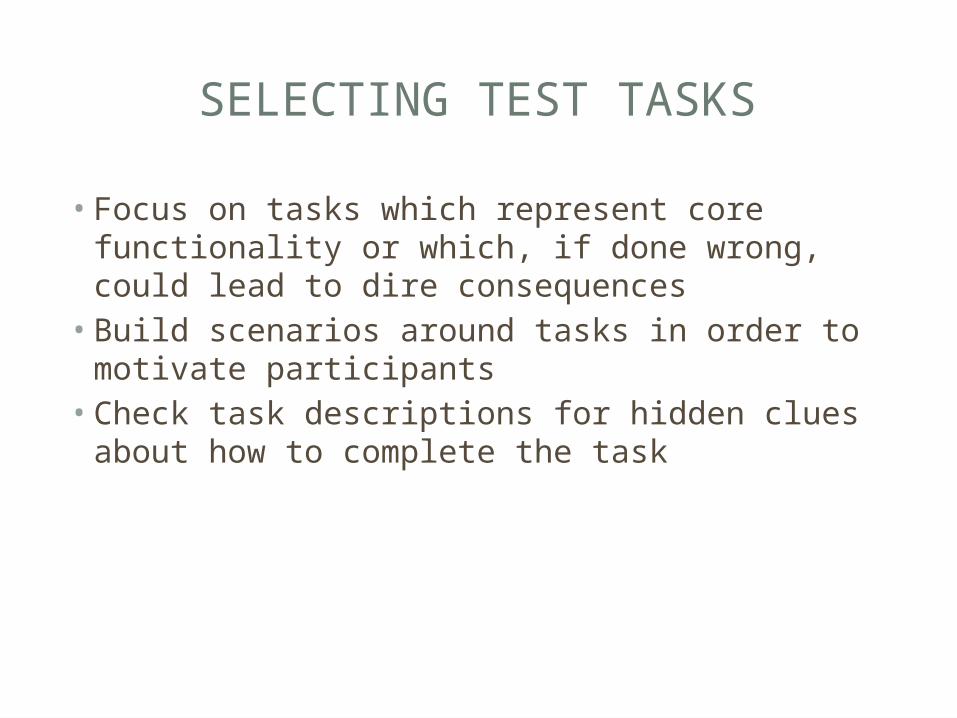
• Focus on tasks which represent core functionality or which, if done wrong, could lead to dire consequences• Build scenarios around tasks in order to motivate
participants• Check task descriptions for hidden clues about
how to complete the task
OUTLINE OF AN IN-LAB TEST
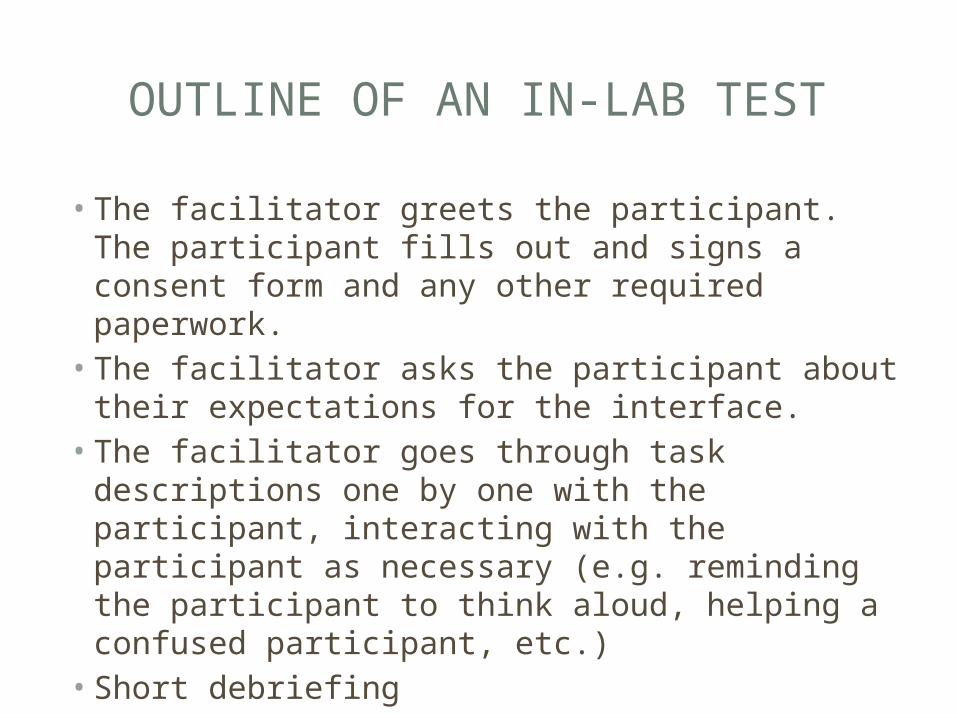
• The facilitator greets the participant. The participant fills out and signs a consent form and any other required paperwork. • The facilitator asks the participant about their
expectations for the interface. • The facilitator goes through task descriptions one
by one with the participant, interacting with the participant as necessary (e.g. reminding the participant to think aloud, helping a confused participant, etc.)• Short debriefing
A/B TESTINGAKA “BUCKET TESTING”
WHAT IS A/B TESTING?
• In A/B testing, visitors to a live website are presented with one of two or more options• These may be a control or proven design and an
experimental or new design• Their actions are then tracked to see which option
performed better• For example, a website might test two different layouts
for their product details pages and compare how many sales were made to users of each layout
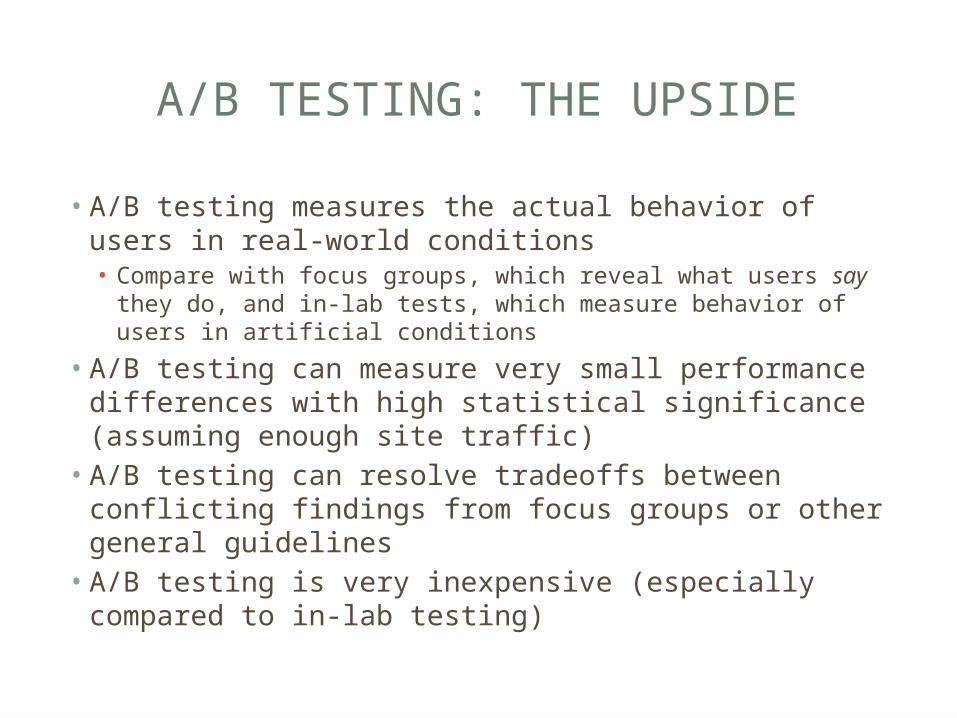
A/B TESTING: THE UPSIDE
• A/B testing measures the actual behavior of users in real-world conditions• Compare with focus groups, which reveal what users say they
do, and in-lab tests, which measure behavior of users in artificial conditions
• A/B testing can measure very small performance differences with high statistical significance (assuming enough site traffic)
• A/B testing can resolve tradeoffs between conflicting findings from focus groups or other general guidelines
• A/B testing is very inexpensive (especially compared to in-lab testing)
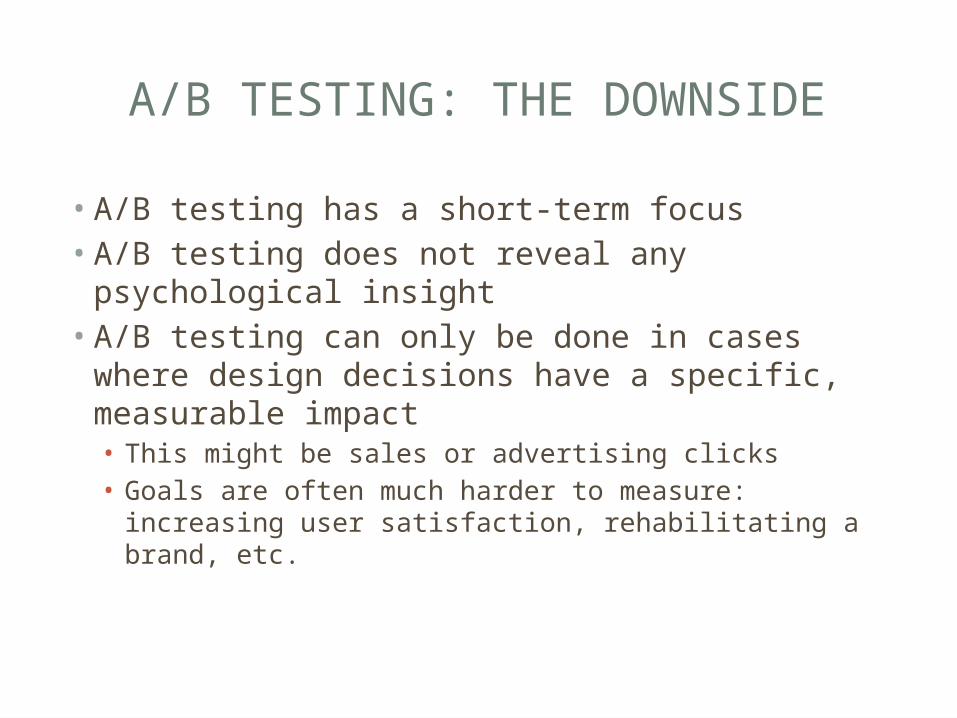
A/B TESTING: THE DOWNSIDE
• A/B testing has a short-term focus• A/B testing does not reveal any psychological
insight• A/B testing can only be done in cases where
design decisions have a specific, measurable impact• This might be sales or advertising clicks• Goals are often much harder to measure: increasing user
satisfaction, rehabilitating a brand, etc.
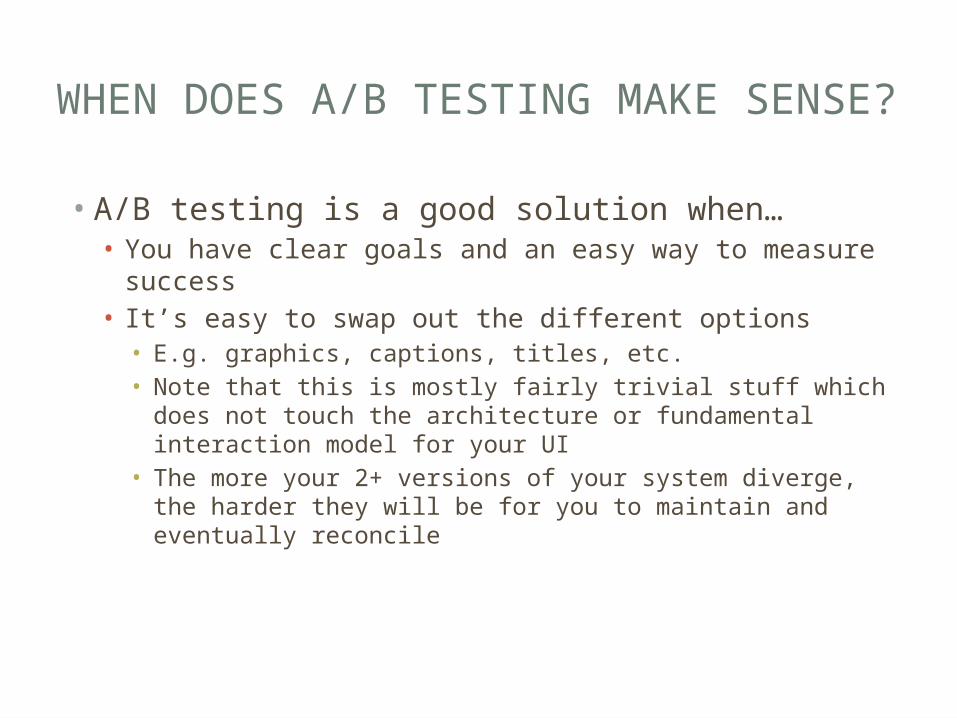
WHEN DOES A/B TESTING MAKE SENSE?
• A/B testing is a good solution when…• You have clear goals and an easy way to measure
success• It’s easy to swap out the different options• E.g. graphics, captions, titles, etc.• Note that this is mostly fairly trivial stuff which does not
touch the architecture or fundamental interaction model for your UI
• The more your 2+ versions of your system diverge, the harder they will be for you to maintain and eventually reconcile
CARD SORTING
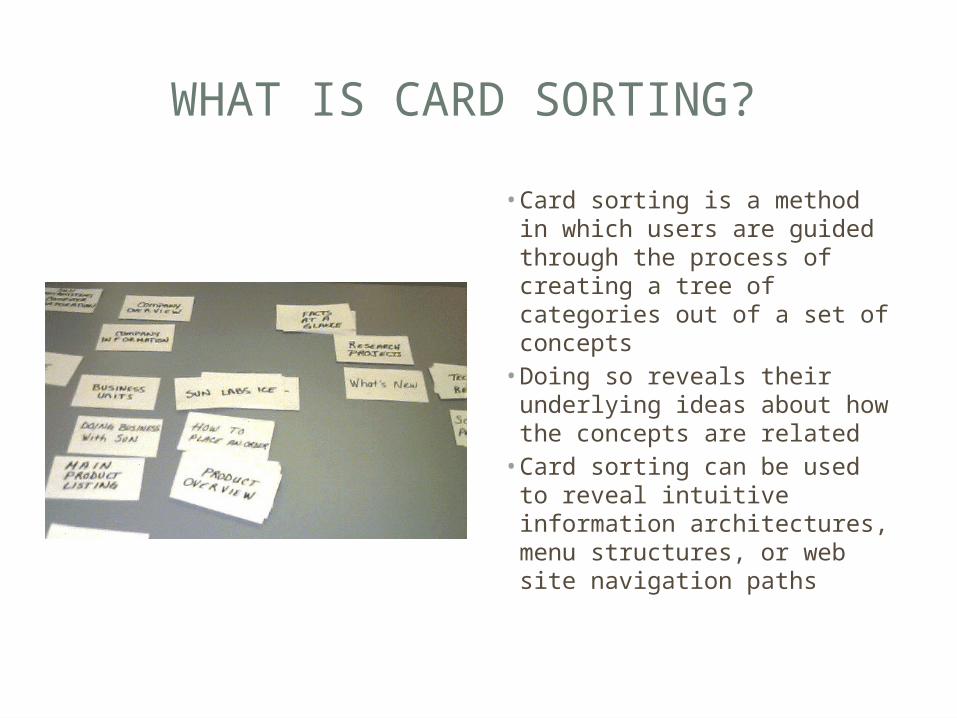
WHAT IS CARD SORTING? • Card sorting is a method in
which users are guided through the process of creating a tree of categories out of a set of concepts
• Doing so reveals their underlying ideas about how the concepts are related
• Card sorting can be used to reveal intuitive information architectures, menu structures, or web site navigation paths
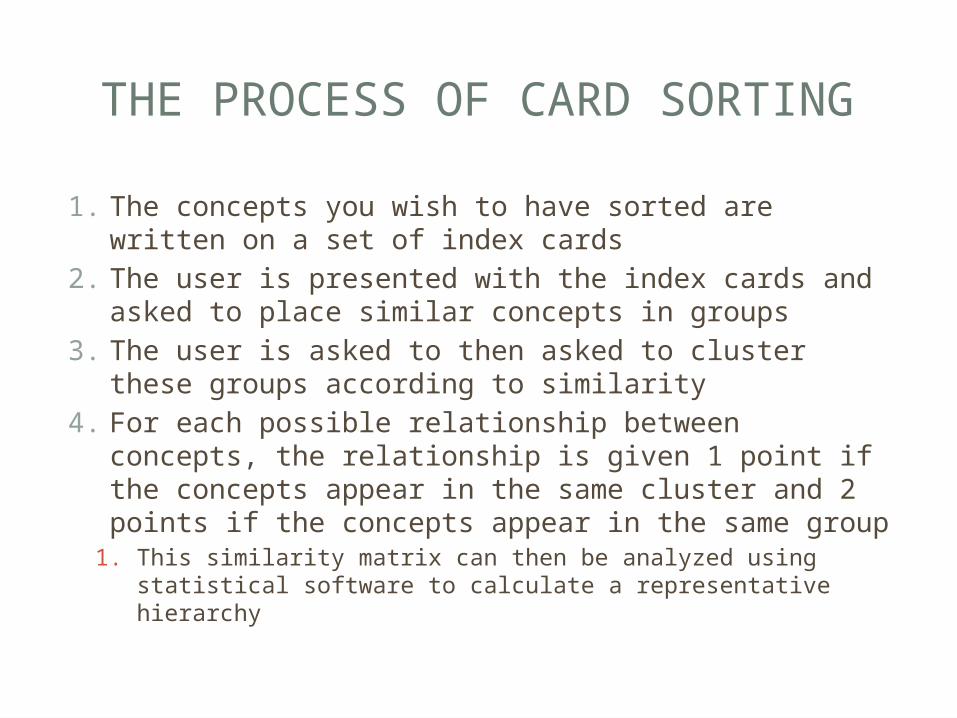
THE PROCESS OF CARD SORTING
1. The concepts you wish to have sorted are written on a set of index cards
2. The user is presented with the index cards and asked to place similar concepts in groups
3. The user is asked to then asked to cluster these groups according to similarity
4. For each possible relationship between concepts, the relationship is given 1 point if the concepts appear in the same cluster and 2 points if the concepts appear in the same group
1. This similarity matrix can then be analyzed using statistical software to calculate a representative hierarchy
TRAFFIC ANALYSIS
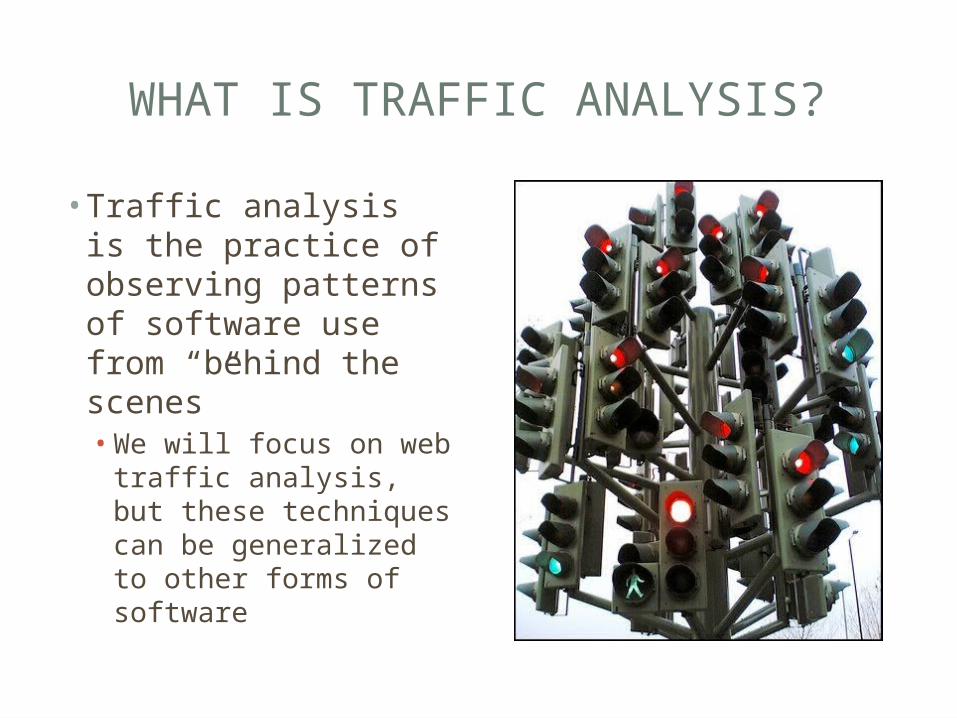
WHAT IS TRAFFIC ANALYSIS?
• Traffic analysis is the practice of observing patterns of software use from “behind the scenes” • We will focus on web
traffic analysis, but these techniques can be generalized to other forms of software
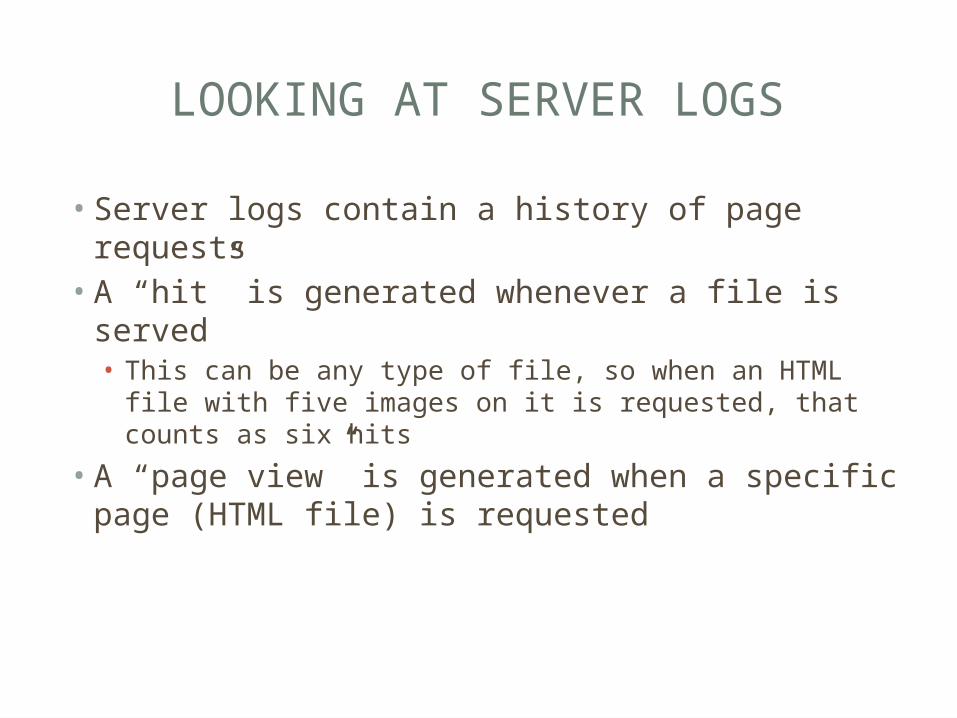
LOOKING AT SERVER LOGS
• Server logs contain a history of page requests• A “hit” is generated whenever a file is served• This can be any type of file, so when an HTML file with
five images on it is requested, that counts as six hits• A “page view” is generated when a specific page
(HTML file) is requested
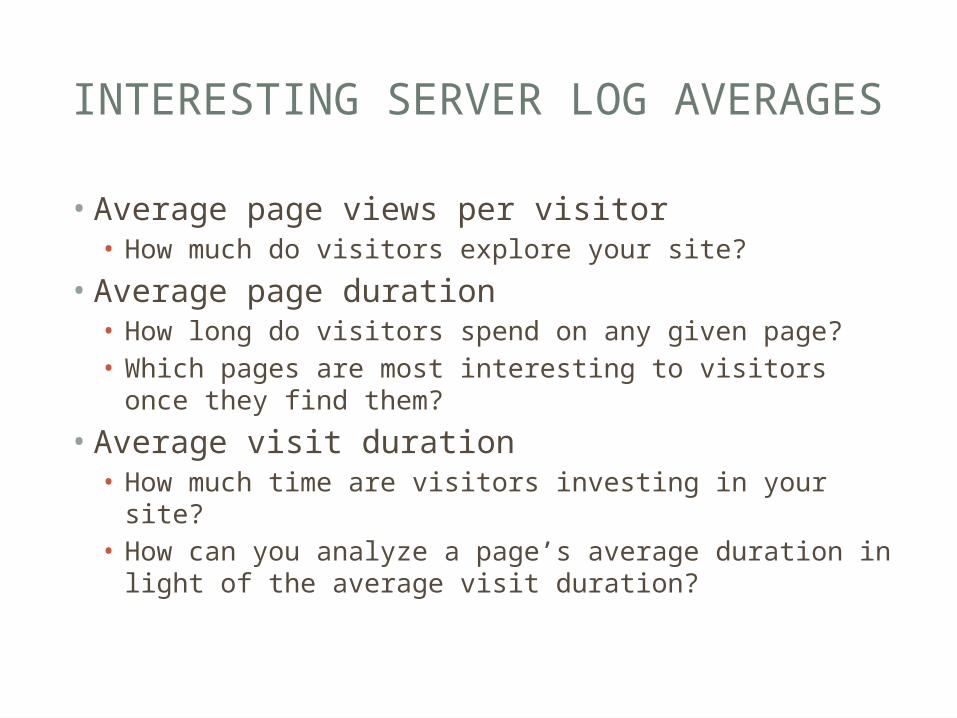
INTERESTING SERVER LOG AVERAGES
• Average page views per visitor• How much do visitors explore your site?
• Average page duration• How long do visitors spend on any given page? • Which pages are most interesting to visitors once they
find them?• Average visit duration• How much time are visitors investing in your site? • How can you analyze a page’s average duration in light
of the average visit duration?
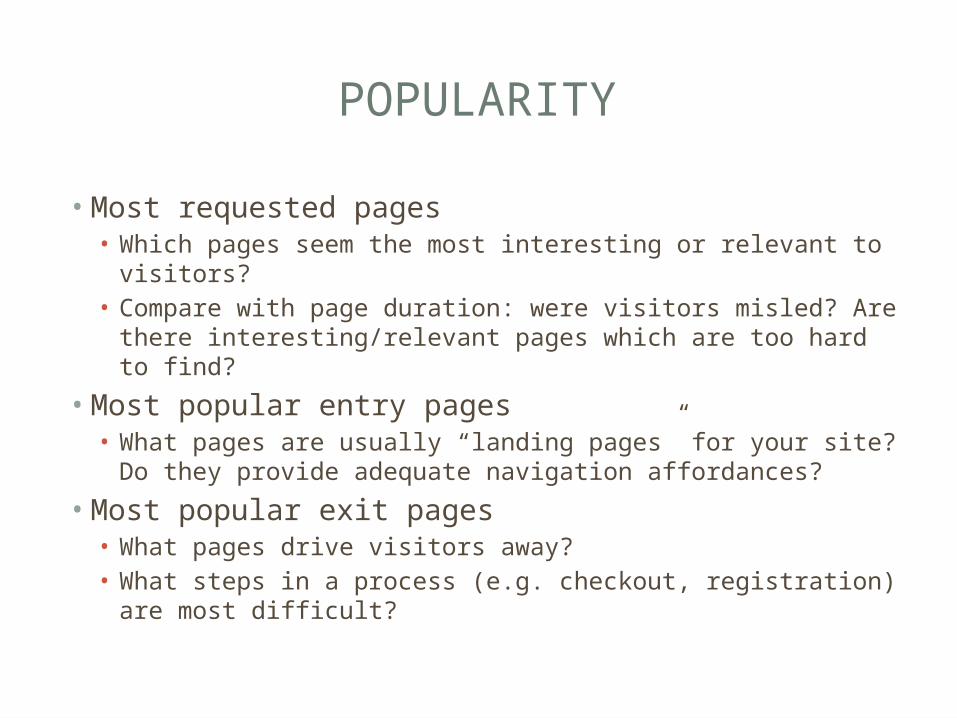
POPULARITY
• Most requested pages• Which pages seem the most interesting or relevant to
visitors?• Compare with page duration: were visitors misled? Are
there interesting/relevant pages which are too hard to find?• Most popular entry pages• What pages are usually “landing pages” for your site? Do
they provide adequate navigation affordances?• Most popular exit pages• What pages drive visitors away?• What steps in a process (e.g. checkout, registration) are
most difficult?
OTHER SERVER LOG INSIGHTS
• Popular paths• How do users move through your site?
• Referrers• Where are your users coming from?• How effective are your advertising campaigns (if
applicable)?
THINKING OUTSIDE THE SERVER LOG
• Server logs can provide a lot of useful data, but ultimately they only keep track of page requests• What happens after the page is loaded?
TRACKING USER INTERACTION
• Client-side scripting (e.g. JavaScript) makes it possible to track how users interact with a page after it loads • Mouse-tracking• Provides an approximation of where the user’s attention
is focused• Interaction with DOM elements• Tracking DOM events
NARROWING FOCUS
• So far, we have covered how aggregate data can be used to draw conclusions about the “average user”• However, there is no average user• It can be helpful to look at a single visit in detail
rather than large data sets• Especially illuminating: looking at anomalous or
unwanted behavior• Why would a user abandon a full shopping cart midway
through checkout?
WHERE IT GETS COMPLICATED
• As with A/B testing, web traffic analysis is easiest when you have a specific, measurable goal in mind• Selling a product, generating advertising revenue, etc.
• It becomes more difficult when your goals are more abstract
EXAMPLE
• How would you use web traffic analysis to measure search quality for a major search engine?