use of the 1993 aashto guide, mepdg and historical ... · pdf fileresearch report . use of the...
TRANSCRIPT

September 2011Jianhua LiJeff S. UhlmeyerJoe P. MahoneyStephen T. Muench
WA-RD 779.1
Office of Research & Library Services
WSDOT Research Report
Use of the 1993 AASHTO Guide, MEPDG and Historical Performance to Update the WSDOT Pavement Design Catalog


Research Report
USE OF THE 1993 AASHTO GUIDE, MEPDG AND HISTORICAL PERFORMANCE TO UPDATE THE WSDOT PAVEMENT DESIGN CATALOG
by
Jianhua Li Pavement Engineer
Washington State DOT
Jeff S. Uhlmeyer State Pavement Engineer Washington State DOT
Joe P. Mahoney Professor
University of Washington
Stephen T. Muench Associate Professor
University of Washington
Prepared for The State of Washington
Department of Transportation Paula J. Hammond, Secretary
September 2011

2
1. REPORT NO. 2. GOVERNMENT ACCESSION NO. 3. RECIPIENTS CATALOG NO
WA-RD 779.1 4. TITLE AND SUBTITLE 5. REPORT DATE
USE OF THE 1993 AASHTO GUIDE, MEPDG AND HISTORICAL PERFORMANCE TO UPDATE THE WSDOT PAVEMENT DESIGN CATALOG
September 2011 6. PERFORMING ORGANIZATION CODE
7. AUTHOR(S) 8. PERFORMING ORGANIZATION REPORT NO.
Jianhua Li, Jeff S. Uhlmeyer , Joe P. Mahoney, Stephen T. Muench
9. PERFORMING ORGANIZATION NAME AND ADDRESS 10. WORK UNIT NO.
Materials Laboratory Washington State Department of Transportation 1655 South Second Avenue Tumwater, Washington 98512
11. CONTRACT OR GRANT NO.
12. CO-SPONSORING AGENCY NAME AND ADDRESS 13. TYPE OF REPORT AND PERIOD COVERED
University of Washington Department of Civil and Environmental Engineering P.O. Box 352700 Seattle, Washington 98109
Research Report
14. SPONSORING AGENCY CODE
15. SUPPLEMENTARY NOTES
This study was conducted in cooperation with the U.S. Department of Transportation, Federal Highway Administration. 16. ABSTRACT
This report describes the preparation of a revised pavement thickness design catalog for the Washington State Department of Transportation (WSDOT) using the 1993 American Association of State Highway and Transportation Officials (AASHTO) Guide, the Mechanistic-Empirical Pavement Design Guide (MEPDG), and WSDOT historical pavement performance data. 17. KEY WORDS 18. DISTRIBUTION STATEMENT
Pavement, pavement design, Empirical design, the 1993 AASHTO Guide for Pavement Design, mechanistic-empirical pavement design guide, MEPDG, calibration, pavement management system, pavement distress model, pavement performance.
19. SECURITY CLASSIF. (of this report) 20. SECURITY CLASSIF. (of this page) 21. NO. OF PAGES 22. PRICE
27

3
DISCLAIMER
The contents of this report reflect the views of the authors, who are responsible for the
facts and the accuracy of the data presented herein. The contents do not necessarily reflect the
official views or policies of the Washington State Department of Transportation. This report does
not constitute a standard, specification, or regulation.
4
TABLE OF CONTENTS
LIST OF FIGURES ........................................................................................................................ 5
LIST OF TABLES .......................................................................................................................... 5
CHAPTER 1 INTRODUCTION .................................................................................................... 6
CHAPTER 2 DESIGN PROCEDURES ......................................................................................... 8
2.1 The 1993 AASHTO Guide Specifics ........................................................................................ 9
2.1.1 Inputs—Flexible Pavements .......................................................................................... 9
2.1.2 Inputs—Rigid Pavements ............................................................................................ 10
2.1.3 Outputs ......................................................................................................................... 10
2.2 The Mechanistic-Empirical Pavement Design Guide (MEPDG) ........................................... 11
2.2.1 Inputs ............................................................................................................................ 11
2.2.2 Pavement Condition Goals........................................................................................... 12
2.2.3 Recalibration ................................................................................................................ 13
2.2.4 Outputs ......................................................................................................................... 16
2.2.5 Discussion .................................................................................................................... 17
CHAPTER 3 HISTORICAL PAVEMENT PERFORMANCE ................................................... 19
3.1 Fifty Year Design Life ............................................................................................................ 19
3.2 Rigid Pavement Base Material................................................................................................ 20
3.3 Thickness Adjustments ........................................................................................................... 20
3.4 New HMA Layer Coefficients of 0.50 ................................................................................... 21
CHAPTER 4 CONCLUSIONS AND RECOMMENDATIONS ................................................. 23
REFERENCES ............................................................................................................................. 25

5
LIST OF FIGURES
Figure 1 Age of HMA and PCC pavements for WSDOT Interstate highways in 2008. .............. 20
LIST OF TABLES
Table 1 Pavement Layer Thicknesses by the 1993 AASHTO Guide ........................................... 11
Table 2 Calibration Results of MEPDG ....................................................................................... 14
Table 3 Pavement Layer Thicknesses by the MEPDG ................................................................. 17
Table 4 Revised Pavement Thickness Design Catalog for WSDOT ............................................ 21
Table 5 HMA Layer Thickness Design by the 1993 AASHTO Guide ........................................ 22

6
CHAPTER 1 INTRODUCTION
For most state highway agencies, the current primary pavement design tool is the 1993
AASHTO Guide for Design of Pavement Structures (the 1993 AASHTO Guide) (1). While use of
this empirical method has been successful, it has several generally acknowledged shortcomings
including being based on a limited number of pavement sections at one location, one climate,
limited traffic, and one set of materials (2).
Currently, the Washington State Department of Transportation (WSDOT) uses Darwin
3.01 (based on the 1993 AASHTO Guide) as well as a structural thickness catalog developed as
a guide for WSDOT pavement designers. For the design tables, which are essentially the first
option for state pavement design, pavement thicknesses were based on a series of typical
reliability levels, subgrade resilient moduli and equivalent single axle load (ESAL) levels for
Washington State (3). Since the current table’s inception in 1992, changes in materials, mix
designs, traffic loading and local practices for both rigid and flexible pavements warrant an
update (minor changes have been done in earlier years).
The Guide for Mechanistic-Empirical Design of New and Rehabilitated Pavement
Structures and its associated software (MEPDG) have been proposed as an advanced pavement
design tool. With its basis in empirical field or laboratory observed performance and mechanistic
principles, resulting designs are assumed to produce improved thickness estimates over
traditional empirical designs (4). Since the release of the MEPDG in 2002, many state highway
agencies have been involved in data collection, model testing, software calibration and
evaluation (5, 6, 7). WSDOT calibrated the rigid portion of the MEPDG software Version 0.6 in
2005 and the flexible portion of Version 1.0 in 2008 (8, 9). These efforts were primarily focused
on the software functionality and model reliability and based on the historical performance data
obtained from the Washington State Pavement Management System (WSPMS) (10
The MEPDG has continued to evolve with the AASHTO marketed version (DARWin-
ME) released July 1, 2011. Annual licenses for this software range from $5,000 for one user up
to $40,000 for an unlimited number of users.
).
There have been a number of updates for the MEDPG since the first release. The results
reported here are based on the software versions previously stated. While it is acknowledged that

7
the MEPDG will continue to be updated and improved, its complexity will, for the foreseeable
future, require well-trained personnel to properly use and interpret. Therefore, at least initially,
WSDOT plans to use the MEPDG as an analysis tool and train a limited number of users.
WSDOT also acknowledges that many pavement design decisions do not require individual
analysis using the MEPDG and could thus be better addressed by using a design catalog
approach.
This report describes the preparation of a revised pavement thickness design catalog for
WSDOT which was prepared for both flexible and rigid pavements. It covers the selection of the
design categories and performance criteria, as well as explains how the 1993 AASHTO Guide,
MEPDG and historical records are used together to generate the design catalog. Descriptions of
the typical design categories and variables are provided. The resulting design catalog has been
officially adopted by WSDOT and is included in an update of its pavement policy (3).

8
CHAPTER 2 DESIGN PROCEDURES
The 1993 AASHTO Guide and MEPDG were used in combination to help develop a
revised WSDOT pavement catalog. The underlying design procedure for the revised design
catalog remains the 1993 AASHTO Guide. The MEPDG was used to check the 1993 AASHTO
Guide thicknesses at all ESAL levels. Depending on the 1993 AASHTO Guide inputs (such as
reliability levels or layer coefficients) thicker pavement sections can result. Due to subsequent
changes to MEPDG since earlier WSDOT calibration, this process included a recalibration of the
software version 1.0. This calibration effort, which was done in an attempt to match the MEPDG
outputs with observed WSDOT field performance, as seen in WSPMS, essentially incorporates
WSDOT historical performance into the model. Finally, certain minimum layer thicknesses and
maximum lift thicknesses controlled by WSDOT's Standard Specifications for Road, Bridge, and
Municipal Construction (11) and the WSDOT Construction Manual (12
For both AASHTO and MEPDG methods, the following categories and input values were
used:
) were incorporated.
• Pavement structure types. Flexible (HMA) and rigid (JPCP).
• Design period. Fifty years for both flexible and rigid pavement since this is consistent
with the current design policy. The pavement base and shoulders are expected to perform
adequately for the full design period, but the surface layers are expected and allowed to
be renewed by routine rehabilitation such as HMA overlay for flexible pavements, and
diamond grinding for rigid pavements.
• Traffic level. The volume and character of traffic was expressed in ESALs rather than
load spectra as used in MEPDG because a single number of ESAL provides pavement
designers a more intuitive indicator of loading levels than axle load spectra. The traffic
levels are expressed by the total ESALs in the 50-year design life for both flexible and
rigid pavement design catalog.
• Base type. Granular base (GB) was used for flexible pavements. For rigid pavements
with ESALs less than 5 million, portland cement concrete (PCC) slabs are placed directly

9
on a GB. For higher ESAL levels, slabs are placed on a Hot Mix Asphalt (HMA) base
over a GB (3). These base types are based on WSDOT experience and policy.
• Reliability level. An 85% reliability level was used for two ESAL levels: (1) less than 5
million, and (2) 5 to 10 million. A reliability level of 95% was used for the higher ESAL
levels. This too is largely based on existing WSDOT policy.
• Base layer thicknesses. These vary depending upon design ESALs but in all cases were
pre-determined based on construction practices and WSDOT experience which have
exhibited good performance over time. For example, the 4.2 inches GB for rigid
pavements is decided by the maximum compaction thickness allowed for a single layer
defined by WSDOT Standard Specification (11
• Subgrade Resilient Modulus. 10,000 psi is a reasonable assumption based on prior
laboratory and field tests statewide (
). Therefore they were effectively
eliminated as design variables.
13, 14
2.1 THE 1993 AASHTO GUIDE SPECIFICS
). Higher subgrade moduli can be achieved but
generally only with granular, low fines materials or some type of subgrade stabilization.
The prior use of the 1993 AASHTO Guide by WSDOT used the following basic inputs
(note: some of the inputs for the new WSDOT design table were changed and these are described
later in the report).
2.1.1 INPUTS—FLEXIBLE PAVEMENTS
• The difference of the serviceability indexes (PSI) from the construction to the end of the
pavement design life was set to 1.5. This implies a po = 4.5 and pt = 3.0.
• The combined standard error of the traffic prediction and performance prediction (So)
was set to 0.5.
• The layer coefficients for the HMA were 0.44 and 0.13 for GB.
• Drainage coefficient (m) was set to 1.0 for all layers. WSDOT does not increase layer
thicknesses due to expected poor drainage; they instead attempt to address this issue with
positive drainage design when necessary.
10
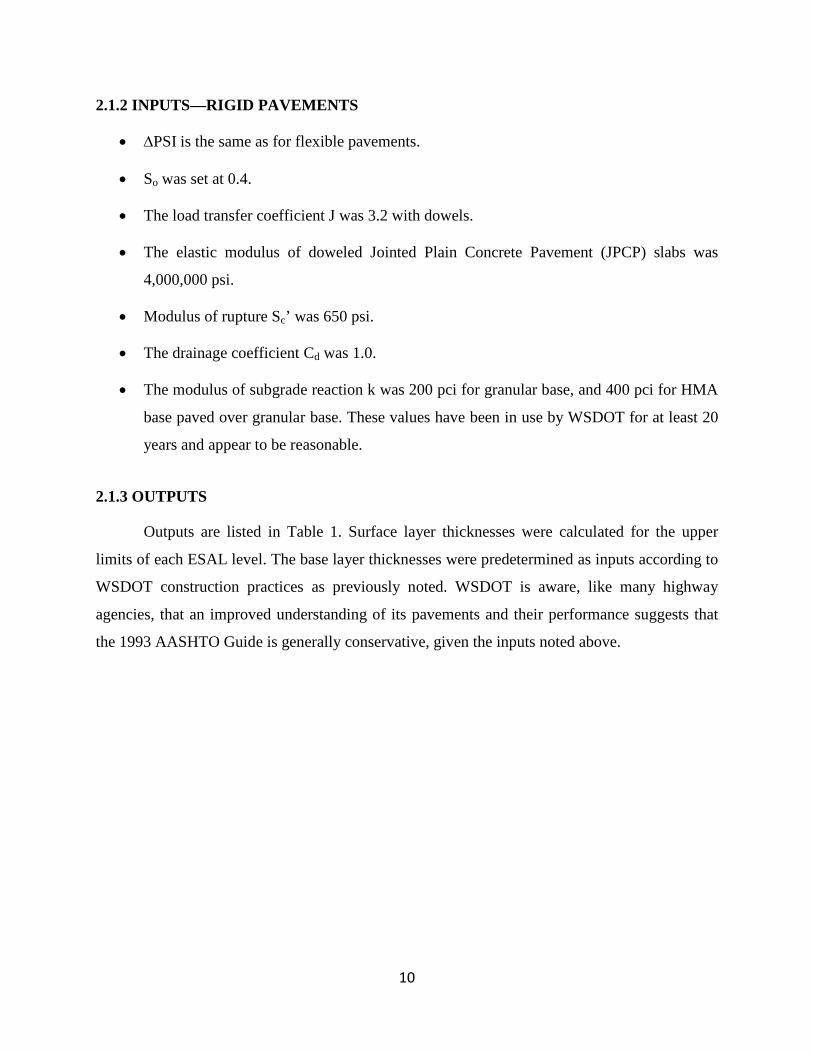
2.1.2 INPUTS—RIGID PAVEMENTS
• ∆PSI is the same as for flexible pavements.
• So was set at 0.4.
• The load transfer coefficient J was 3.2 with dowels.
• The elastic modulus of doweled Jointed Plain Concrete Pavement (JPCP) slabs was
4,000,000 psi.
• Modulus of rupture Sc’ was 650 psi.
• The drainage coefficient Cd was 1.0.
• The modulus of subgrade reaction k was 200 pci for granular base, and 400 pci for HMA
base paved over granular base. These values have been in use by WSDOT for at least 20
years and appear to be reasonable.
2.1.3 OUTPUTS
Outputs are listed in Table 1. Surface layer thicknesses were calculated for the upper
limits of each ESAL level. The base layer thicknesses were predetermined as inputs according to
WSDOT construction practices as previously noted. WSDOT is aware, like many highway
agencies, that an improved understanding of its pavements and their performance suggests that
the 1993 AASHTO Guide is generally conservative, given the inputs noted above.

11
Table 1 Pavement Layer Thicknesses by the 1993 AASHTO Guide
50-year ESALs
Reliability Level
Flexible Pavement* Rigid Pavement*
HMA** Base PCC Base
5,000,000 85% 7.5 6 9.5 GB only 4.2
10,000,000 85% 8.5 6 10.0 HMA over GB 4.2 + 4.2
25,000,000 95% 11.2 6 12.5 HMA over GB 4.2 + 4.2
50,000,000 95% 12.3 7 14.0 HMA over GB 4.2 + 4.2
100,000,000 95% 13.3 8 15.5 HMA over GB 4.2 + 4.2
200,000,000 95% 14.5 9 17.0 HMA over GB 4.2 + 4.2
Note: * Thicknesses are in inches and rounded to the 0.1 inches. ** The HMA layer coefficient is 0.44.
2.2 THE MECHANISTIC-EMPIRICAL PAVEMENT DESIGN GUIDE (MEPDG)
The mechanistic-empirical approach uses both mathematical models and experimental
results to estimate the future pavement distress under a defined pavement condition of climate,
traffic patterns, materials and structure. However, the accuracy of the model estimation is
dependent on calibration (4, 15
2.2.1 INPUTS
).
The MEPDG requires three categories of input data: traffic, climate and pavement
structure (4). The values used in this analysis were generally taken from typical WSDOT
designs.
• This analysis used the typical axle load spectra created by prior WSDOT studies of WIM
station data (16). It includes traffic volume adjustment factors, vehicle class distribution
and axle load distribution factors. The Annual Average Daily Truck Traffic (AADTT),
traffic growth rates were obtained from the historical traffic data files in the Washington
State Traffic Data Office. To match the format of the design catalog and compare

12
MEPDG design with the AASHTO results, these detailed traffic data were converted to
ESALs over the entire design life by using a fixed ESAL number for each truck type.
• The default climate data of weather stations located in Washington State have proved
acceptable for use with the MEDPG (8, 9).
• The detailed material properties and structural information were obtained from WSDOT
original design files, material tests, the WSDOT Standard Specifications for Road, Bridge
and Municipal Construction (11), and the WSDOT Construction Manual (12
2.2.2 PAVEMENT CONDITION GOALS
).
Since the MEPDG output is pavement condition over time, end-of-life pavement
condition goals must first be defined in order to determine pavement structural thicknesses.
These condition goals are:
• HMA Pavements
o Total structural life. WSDOT HMA pavements can to serve 50 years with proper
rehabilitation—this is based on results from pavement design systems and,
importantly, observed pavement performance.
o Surface life. WSPMS data indicate that WSDOT typically overlays HMA pavements
on about 12 to 16 year intervals (less often in Western Washington (WW) more often
in Eastern Washington (EW)). This means that on average, the surface layer is able to
serve about 12 to 16 years before the next overlay. Therefore, to reflect the
performance of the surface course only and thus the analysis period for flexible
pavement was set to 16 years. Specific MEPDG inputs for terminal conditions were:
(1) IRI = 220 inch/mile, (2) longitudinal cracking = 1,000 ft/mile, (3) fatigue cracking
= 50%, (4) transverse cracks (thermal fracture) = 1,000 ft/mile, and (5) permanent
deformation = 0.5 inches (17
• Rigid Pavements
).
o Total structural life. WSDOT doweled JPCP can serve 50 years with proper
rehabilitation—this is based on results from pavement design systems and,
importantly, observed pavement performance. Specific MEPDG inputs for terminal

13
conditions were: (1) IRI = 220 inch/mile, (2) transverse cracks as % of total slabs =
50%, and (3) mean joint faulting = 0.24 inches.
o Surface life. Over the structural life, diamond grinding is normally planned every 25
years to address studded tire wear (18
A reasonable pavement structure thickness design should be able to keep (1) the related
surface layer distresses, as noted above, within the range of the pavement condition goals for two
analysis periods: 16 years for the surface layer flexible pavements, and 50 years for rigid
pavements; and (2) the base layers in an assured good condition throughout the 50-year structure
design life.
).
2.2.3 RECALIBRATION
Previously, WSDOT calibrated the rigid portion of the MEDPG Version 0.6 and the
flexible portion of Version 1.0. Both bench testing and model analysis have been performed (8,
9). However, additional recalibration was required for this work due to subsequent changes to the
MEPDG software. The recalibration has been accomplished by comparing the model outputs
with WSDOT historical pavement performance data according to the Recommended Practice for
Local Calibration of the ME Pavement Design Guide (15
The MEPDG software is designed to evaluate one pavement design at a time; the user
provides a set of input values and the damage over time is estimated. Based on the acceptability
of these results, the user modifies the calibration factor values until an acceptable damage
progression is estimated. Because this process only allows for the evaluation of one pavement
section at a time, a full calibration of all WSDOT flexible pavements (which allows for the
simultaneous calibration of multiple pavement sections) is not possible. Instead, a single
pavement section must be selected, evaluated with the MEPDG software and the resulting
damage estimates compared to the actual pavement performance. This method requires that the
“calibration sections” be carefully chosen to represent typical design parameters and pavement
condition data for a larger group of WSDOT’s pavements.
).
Typical calibration sections were selected from all WSDOT pavements based on:
• Pavement type. Flexible (HMA) and rigid (JPCP).

14
• Traffic level. Defined by 50 year design ESALs.
• Subgrade Resilient Modulus. 20,000 psi, 10,000 psi and 5,000 psi.
• Climate. Eastern Washington (EW) and Western Washington (WW).
A set of calibration factors is chosen and then the design software is run on each of the
two selected calibration sections. Based on the results, the calibration factors are adjusted in
order of high to low elasticity and the design software is run again. When this process converges
on an acceptable set of calibration factors it is essentially repeated on the validation sections.
Calibration coefficients were changed between iterations, by comparing observed versus
predicted distress.
With the broad range of validation sections, models do not provide precise predictions for
each section, but rather approximate field performance. The calibrated models were tested
against each individual validation section. The group of calibration factors with the least standard
errors between the MEPDG prediction and WSPMS measures on all calibration and validation
sections was determined as the final calibration results (Table 2).
Table 2 Calibration Results of MEPDG
Calibration Factor* Elasticity Default Recalibration Results
Flexible Pavement
AC Fatigue Bf1 -3.3 1 0.96 Bf2 -40 1 0.945 Bf3 20 1 1.055
Longitudinal cracking
C1 -0.2 7 6.42 C2 1 3.5 3.8 C3 0 0 0 C4 ≈0 1,000 1,000
Alligator cracking C1 1 1 1 C2 0 1 1 C3 ≈0 6,000 6,000
AC Rutting Br1 0.6 1 1.05 Br2 20.6 1 1 Br3 8.9 1 1.06
Subgrade Rutting Bs1 - 1 0
Rigid Pavement Cracking
C1 -7.579 2 1.93 C2 -7.079 1.22 1.177 C3 0.658 1 1 C4 -0.579 -1.98 -1.98
*Note: Default values are suggested and used for the calibration factors not listed in the table.

15
The following observations are made relative to the MEPDG flexible pavement distress
models:
• Alligator cracking model. The MEPDG model assumes bottom up fatigue cracking. For
thicker WSDOT HMA pavements, this model does not reflect historical performance;
most alligator cracking is top down (i.e., the origin of the cracking is within the wearing
course) (19
• Longitudinal cracking model. The model is recalibrated and able to reasonably estimate
WSDOT longitudinal cracking conditions.
). However, it still produces a reasonable rate of cracking albeit the wrong
type. This is a major issue that has yet to be fully resolved by WSDOT since it essentially
relegates the MEPDG to an empirical model; no different than the existing 1993
AASHTO Guide in its inability to predict the correct type of cracking. Also, the
progression of cracking in the MEPDG output is questionable and illustrates markedly
different trends for different traffic loadings.
• Transverse cracking model. The default calibration factors are able to reasonably
estimate WSDOT transverse cracking conditions and were used.
• Rutting model. The models were calibrated for the surface rutting only since WSDOT
does not typically experience rutting in the base and subgrade layers.
• Roughness model. The model cannot be calibrated due to MEPDG software bugs within
the versions uses. Further, the default roughness model underestimates observed WSDOT
roughness, so the model cannot be used for now. However, WSDOT flexible pavement
rehabilitation projects are mostly triggered by cracking or rutting, but not roughness.
Therefore, the pavement failure is defined by cracking and rutting for this study.
For rigid pavement distress models, default calibration factors for the faulting and
roughness models were used resulting in estimates that matched well with the WSPMS data in
both magnitude and trend. Pavement wear is observed on Washington State rigid pavements due
to studded tires, but it is not modeled in MEPDG. Since faulting seldom happens on doweled
JPCP, and the distresses of wear and roughness can be addressed by diamond grinding which is
normally planned at least once throughout the 50-year design life, slab failure is defined only by
the cracking condition.

16
The MEPDG had model issues and software bugs during the time these computer runs
and calibrations were done. However, it was able to estimate reasonable values of the major
pavement distresses for WSDOT through the calibration efforts.
2.2.4 OUTPUTS
The MEPDG outputs are the surface layer distresses over the analysis periods. With all
other inputs fixed, the structural thicknesses vary in each MEPDG run as a design input. Then,
the estimated surface layer distresses are compared to the defined pavement condition goals in
the analysis periods (16 years for HMA layer and 50 years for PCC slabs). The layer thicknesses
which can match all related surface distress to the condition goals throughout the analysis period
are chosen as the design results.
The 1993 AASHTO Guide design thicknesses (Table 1) were used as input values for the
MEPDG in an effort to check these thicknesses for reasonableness against WSDOT historical
performance. As previously stated, the MEPDG recalibration suggests that MEPDG results
reflect historical performance as observed in WSPMS. As expected, these checks confirmed that
the 1993 AASHTO Guide produced overly thick pavement designs for high ESAL levels
(depending on the selected reliability levels and layer coefficients). Table 3 shows the results of
MEPDG revised pavement thicknesses.
17
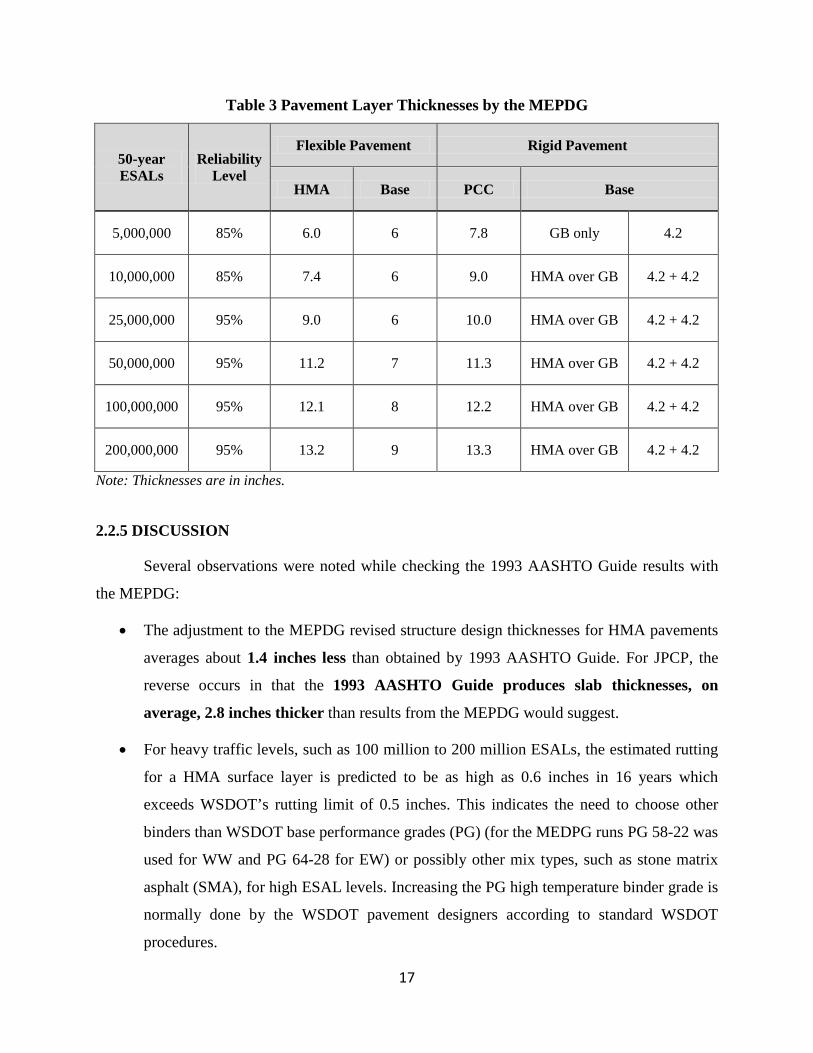
Table 3 Pavement Layer Thicknesses by the MEPDG
50-year ESALs
Reliability Level
Flexible Pavement Rigid Pavement
HMA Base PCC Base
5,000,000 85% 6.0 6 7.8 GB only 4.2
10,000,000 85% 7.4 6 9.0 HMA over GB 4.2 + 4.2
25,000,000 95% 9.0 6 10.0 HMA over GB 4.2 + 4.2
50,000,000 95% 11.2 7 11.3 HMA over GB 4.2 + 4.2
100,000,000 95% 12.1 8 12.2 HMA over GB 4.2 + 4.2
200,000,000 95% 13.2 9 13.3 HMA over GB 4.2 + 4.2
Note: Thicknesses are in inches.
2.2.5 DISCUSSION
Several observations were noted while checking the 1993 AASHTO Guide results with
the MEPDG:
• The adjustment to the MEPDG revised structure design thicknesses for HMA pavements
averages about 1.4 inches less than obtained by 1993 AASHTO Guide. For JPCP, the
reverse occurs in that the 1993 AASHTO Guide produces slab thicknesses, on
average, 2.8 inches thicker than results from the MEPDG would suggest.
• For heavy traffic levels, such as 100 million to 200 million ESALs, the estimated rutting
for a HMA surface layer is predicted to be as high as 0.6 inches in 16 years which
exceeds WSDOT’s rutting limit of 0.5 inches. This indicates the need to choose other
binders than WSDOT base performance grades (PG) (for the MEDPG runs PG 58-22 was
used for WW and PG 64-28 for EW) or possibly other mix types, such as stone matrix
asphalt (SMA), for high ESAL levels. Increasing the PG high temperature binder grade is
normally done by the WSDOT pavement designers according to standard WSDOT
procedures.

18
• Longitudinal cracking is observed in WSDOT rigid pavements (especially in Western
Washington on Interstate-5) but is not modeled in the MEPDG. However, longitudinal
cracking alone rarely triggers rehabilitation because (1) multiple cracks on the same panel
are required to do so, and (2) it is rare to see multiple longitudinal cracks on the same
panel without at least one transverse crack. Therefore, prediction of transverse cracking is
likely more critical for design of PCC slabs.
• WSDOT allows studded tires from November to April which causes surface wear. A
WSDOT test showed that PCC pavements with an IRI of 145 to 155 inch/mile in the
wheelpath (where studded tire wear would have the greatest effect) only had IRIs of
80~100 inches/mile outside of the wheelpaths (18). This type of roughness is not
modeled in the MEPDG for rigid pavements, but can be estimated according to WSPMS
historical data. Even so, since only slab cracking is used to define failure, this issue is of
limited concern for structural design.

19
CHAPTER 3 HISTORICAL PAVEMENT PERFORMANCE
While the most direct influence of historical performance comes from its use in
calibrating the MEPDG, two other historical performance factors influenced the revised design
catalog: selection of a 50-year performance life and base layer selection for rigid pavements.
3.1 FIFTY YEAR DESIGN LIFE
Both pavement types can perform adequately for at least 50 years or more with proper
surface layer renewal techniques. Figure 1 show that a large percentage of WSDOT’s Interstate
routes have pavement structures that are at least 30 years old (greater than 94% of the flexible
and 63% of the rigid). This performance is due to reasonable design decisions and superior local
materials (in the case of the PCC) over the past several decades.
Interstate HMA pavements (based largely on data from I-90) constructed mostly during
the 1960s were generally thick—with original constructed HMA thicknesses averaging 14.5
inches in WW to 9.5 inches in EW (the ranges were 13.8 to 18.6 inches in WW and 6.0 to 13.9
inches in EW). These sections have performed well and are no known structural failures of these
HMA pavements. Naturally, periodic HMA overlays have been placed to renew the wearing
course. Interstate undoweled JPCP pavements constructed in the same timeframe averaged 9.3
inches thick in WW and 9.1 inches in EW (the ranges were 8.0 to 12.0 inches in WW and 8.0 to
11.0 inches in EW). The undoweled JPCP typically survived 25 to 45 years of Interstate level
traffic with the shorter lives occurring in EW and longer lives in WW. Early performance of the
thick doweled PCC pavement (10 to 13 inch thick slabs) in Washington State suggests that these
thicknesses should also perform well over a long time span.

20
Figure 1 Age of HMA and PCC pavements for WSDOT Interstate highways in 2008.
3.2 RIGID PAVEMENT BASE MATERIAL
In the past, base depths under rigid pavements were determined primarily by the
requirement for support of construction traffic. Currently, it is recognized that the base course
directly beneath PCC slabs is a critical element in the performance of PCC pavement because of
the large influence of the slab support. HMA is the required base material on high traffic
roadways (greater than 5 million ESALs) in order to minimize the risk of failure. GB is used
under the HMA layer to provide a stable construction surface for the HMA.
3.3 THICKNESS ADJUSTMENTS
The MEPDG was recalibrated and used as a tool to reflect the pavement performance in
WSPMS. The base layer thicknesses were predetermined according to WSDOT construction
practice and experience. The MEPDG outputs are shown in Table 3, and the design thicknesses
are further rounded to the nearest half inch. Table 4 is the revised pavement thickness design
catalog. This revised design catalog is applied to WSDOT’s typical pavement design cases with
similar categories and parameters as described in Chapter 2.
Thickness adjustments can be made to catalog designs if they are based on site-specific
data that warrant change. Two cases for table value adjustment stand out. First, reductions in the
0
100
200
300
400
500
600
700
<10 10~20 20~30 30~40 40~50 50~60 ≥60
Age since original construction
Lane
mile
HMAPCC

21
total HMA thickness can be made by constructing flexible pavements on a stiffer subgrade. In
these cases, pavement designers may choose to use an approved design procedure rather than
follow the design catalog as published. Second, the primary surface renewal technique for rigid
pavements is diamond grinding which reduces the PCC slab thickness (3, 19
Table 4 Revised Pavement Thickness Design Catalog for WSDOT
). To reduce the
impacts of the reduced slab thickness by diamond grinding, 0.5 to 1.0 inches of slab thickness
can be added to PCC slab thicknesses in anticipation that it would be removed by future diamond
grind(s).
50-year ESALs
Reliability Level
Flexible Pavement Rigid Pavement
HMA Base PCC Base
≤ 5,000,000 85% 6 6 8 GB only 4.2
5,000,000 to 10,000,000 85% 8 6 9 HMA over GB 4.2 + 4.2
10,000,000 to 25,000,000 95% 10 6 10 HMA over GB 4.2 + 4.2
25,000,000 to 50,000,000 95% 11 7 11 HMA over GB 4.2 + 4.2
50,000,000 to 100,000,000 95% 12 8 12 HMA over GB 4.2 + 4.2
100,000,000 to 200,000,000 95% 13 9 13 HMA over GB 4.2 + 4.2
Note: Thicknesses are in inches.
3.4 NEW HMA LAYER COEFFICIENTS OF 0.50
Currently, WSDOT is using the 1993 AASHTO Guide which requires a layer coefficient
for the HMA layer. In the past, WSDOT has used a HMA layer coefficient of 0.44 which
underestimates the load sharing contribution of the HMA layers (Table 1). As Table 5 shows, a
HMA layer coefficient of 0.50 generates similar thickness designs as the MEPDG and WSDOT
historical pavement performance data especially for the higher ESAL loads. Therefore, a HMA
layer coefficient of 0.50 is recommended for WSDOT typical pavement designs using the 1993
AASHTO Guide. This increase is a bit less than the recommended 0.54 resulting from the recent
NCAT Test Track study (20).

22
Table 5 HMA Layer Thickness Design by the 1993 AASHTO Guide
50-year ESALs Reliability Level
HMA Layer Thickness*
a**=0.44 a**=0.50 Final Revised (Table 4)
5,000,000 85% 7.5 6.5 6
10,000,000 85% 8.5 7.5 8
25,000,000 95% 11.2 9.9 10
50,000,000 95% 12.3 10.8 11
100,000,000 95% 13.3 11.8 12
200,000,000 95% 14.5 12.8 13
Note:* Thicknesses are in inches. **a is the HMA layer coefficient for the 1993 AASHTO Pavement Design Guide.

23
CHAPTER 4 CONCLUSIONS AND RECOMMENDATIONS
WSDOT’s revised pavement design catalog reflects a combination of the 1993 AASHTO
Guide, the MEPDG, and historical pavement performance. Major observations in developing this
catalog are:
1. The 1993 AASHTO Guide provides reasonable structural designs for flexible pavements
by use of a more realistic layer coefficient for HMA. Rigid pavements exhibit excessively
thick slabs for the given inputs in 1993 AASHTO Guide. WSDOT has been aware of this
for some time but has attempted to address the issue during the development of the new
pavement policy and associated design catalog.
2. The MEPDG was recalibrated based on WSDOT historical data obtained through
WSPMS. While this recalibration seems to create reasonable output values, there are still
several distress types that routinely occur in WSDOT pavements that are not adequately
modeled. These unmodeled behaviors make it difficult to rely solely on the MEPDG for
pavement design. It should be noted that the MEPDG was not used as a design tool in this
analysis, but as a tool to reflect WSPMS historical performance data under various traffic,
reliability level, climate, and pavement structures. Specific MEPDG issues are:
o The MEPDG model assumes bottom up fatigue cracking. For thicker WSDOT HMA
pavements, this model does not reflect historical performance, since most alligator
cracking is top down in WSDOT flexible pavements. Also, the MEPDG estimates of
cracking progression are questionable and show markedly different trends for
different traffic loadings.
o The flexible pavement roughness models cannot be calibrated due to software bugs.
o The MEPDG does not model studded tire wear, thus, wheelpath wear on WSDOT
rigid pavements due to studded tire wear cannot be estimated.
o The MEPDG does not have a longitudinal cracking model for rigid pavements, but
longitudinal cracking is observed on WSDOT rigid pavements.
3. A new pavement thickness design catalog was created based on the 1993 ASSHTO
Guide as modified by checks with the MEPDG and typical WSDOT design conditions,

24
local practices and construction guidance. Deviations from this table are possible for any
number of conditions but should be analyzed by the 1993 AASHTO Guide and MEPDG
along with the historical pavement performance data.
It is difficult to base statewide pavement design on models alone. While the 1993
AASHTO Guide has been in existence for quite some time, it is now being used to design
pavements for ESAL levels far in excess of the empirical evidence upon which it was based. It is
a testament to this model’s robustness and the ingenuity of those who have worked on it that it
can still be used to design reasonable pavement structures. Nevertheless, most users of the 1993
AASHTO Guide recognize its shortcomings and have developed work-arounds to get results that
match field performance. While the MEPDG is, in many respects, a much more sophisticated
and detailed design approach, it too has limitations. For WSDOT, the MEPDG does not model
all the desired distress types and is unable (due to bugs or otherwise) to predict others adequately.
Ultimately it is historical performance that provides the missing information and the assurance
that model outputs are likely to be achieved during actual performance. Thus, the new WSDOT
design catalog is developed based on a combination of old models, new models and historical
performance.

25
REFERENCES
1. NCHRP (1998), “Pavement Design Tools: NCHRP 1-32,” Transportation Research Board
Business Office, Washington D.C.
2. AASHTO (1993), “AASHTO Guide for Design of Pavement Structures,” AASHTO,
Washington, D.C.
3. Washington State Department of Transportation (WSDOT) (2011), “WSDOT Pavement
Policy,” WSDOT, Olympia, WA.
4. Applied Research Associates, Inc. (2004), “Guide for Mechanistic-Empirical Design of New
and Rehabilitated Pavement Structures,” Final Report, National Cooperative Highway
Research Program, Transportation Research Board, Washington, DC.
5. Christopher, W. (2007), “MEPDG: Where are we now?” Presented in Liousiana
Transportation Engineering Conference, Baton Rouge, Louisiana. Available
at http://www.ltrc.lsu.edu/tec_07/presentations/medpg.pdf.
6. TRB (2009), “MEPDG Workshop,” Transportation Research Board Annual Meeting,
Washington, D.C.
7. Al-Yagout, M. A., J. P. Mahoney, L. M. Pierce, and M.E. Hallenbeck (2005), “Load Spectra
for Washington State,” Washington State Transportation Center, Washington State
Department of Transportation. Olympia, WA.
8. Li, J., S.T. Muench, J.P. Mahoney, N. Sivaneswaran, and L.M. Pierce (2006), “Calibration of
the Rigid Pavement Portion of the NCHRP 1-37A Software for Use by the Washington State
Department of Transportation,” Journal of the Transportation Research Board, No. 1949,
TRB, Washington, D.C., pp. 43-53.
9. Li, J., L.M. Pierce and J. Uhlmeyer (2009), “Calibration of the Flexible Pavement Portion of
the Mechanistic-Empirical Pavement Design Guide for the Washington State Department of
Transportation,” Accepted for publication in Transportation Research Record: Journal of the
Transportation Research Board.

26
10. Pierce, L.M., D.M. Crimmins and J.R. Livingston (2008), “Washington State Pavement
Management System (WSPMS), version 2007,” Materials Laboratory, Washington State
Department of Transportation, Materials Laboratory, Olympia, WA.
11. WSDOT (2006), “WSDOT Standard Specifications for Road, Bridge and Municipal
Construction,” WSDOT, Olympia, WA.
12. WSDOT (2009), WSDOT Construction Manual. WSDOT, Olympia, WA.
13. Newcomb, D. E. (1986), “Development and Evaluation of a Regression Method to Interpret
Dynamic Pavement Deflections,” Ph.D. dissertation. University of Washington. Seattle, WA,
1986.
14. Mahoney, J, Lee, S., Jackson, N., Newcomb, D. (1988), “Mechanistic-Based Overlay Design
Procedure for Washington State Flexible Pavements,” Research Report Washington-RD
170.1, Washington State Department of Transportation, Olympia, WA.
15. Quintus, H.L.V., M.I. Darter, and J. Mallela (2007), “Recommended Practice for Local
Calibration of the ME Pavement Design Guide,” Draft report to National Cooperative
Highway Research Program, Project 1-40A. Applied Research Associates, Inc., Round Rock,
TX.
16. Li, J., L.M. Pierce, and J. Uhlmeyer (2009), “Sensitivity of Axle Load Spectra in
Mechanistic-Empirical Pavement Design Guide for Washington State Department of
Transportation,” Accepted for publication in Transportation Research Record: Journal of the
Transportation Research Board.
17. Kay, R.K., J.P. Mahoney, and N.C. Jackson (1993), “The WSDOT Pavement Management
System: 1993 Update,” Washington State Transportation Center, Washington State
Department of Transportation. Olympia, WA.
18. Pierce, L. M. and S. T. Muench (2009), “Evaluation of Dowel Bar Retrofit for Long-Term
Pavement Life in Washington State,” Washington State Transportation Center, Washington
State Department of Transportation. Olympia, WA.
19. Uhlmeyer, J. S., K. Willoughby, L.M. Pierce and J.P. Mahoney (2000), “Top-Down
Cracking in Washington State Asphalt Concrete Wearing Courses,” Journal of the
Transportation Research Board, No. 1730, TRB, Washington, D.C., pp. 110-116.

27
20. Peters-Davis, K, and Timm, D. (2009), “Recalibration of the Asphalt Layer Coefficient,”
NCAT Report 09-03, National Center for Asphalt Technology, Auburn, AL.