use of nutrient balances in comprehensive watershed water quality modeling … · 2011-10-11 ·...
TRANSCRIPT
Technical Report EL-98-5 June 1998
US Army Corps of Engineers Waterways Experiment Station
Use of Nutrient Balances in Comprehensive Watershed Water Quality Modeling of Chesapeake Bay
by Anthony S. Donigian, Jr., Radha V. Chinnaswamy Aqua Terra Consultants
Patrick N. Deliman, WES
Approved For Public Release; Distribution Is Unlimited
19980701 225
DTIC QUALITY INSPECTED 1
Prepared for U.S. Environmental Protection Agency
The contents of this report arc not to be used for advertising, publication, or promotional purposes. Citation of trade names does not constitute an official endorsement or approval of the use of such commercial products.
The findings of this report are not to be construed as an official Department of the Army position, unless so desig- nated by other authorized documents.
$ PRINTED ON RECYCLED PAPER
Technical Report EL-98-5 June 1998
Use of Nutrient Balances in Comprehensive Watershed Water Quality Modeling of Chesapeake Bay by Anthony S. Donigian, Jr., Radha V. Chinnaswamy
Aqua Terra Consultants 2672 Bayshore Parkway, Suite 1001 Mountain View, CA 94043-1001
Patrick N. Deliman
U.S. Army Corps of Engineers Waterways Experiment Station 3909 Halls Ferry Road Vicksburg, MS 39180-6199
Final report Approved for public release; distribution is unlimited
Prepared for Chesapeake Bay Program Office U.S. Environmental Protection Agency Annapolis, MD 21403
US Army Corps of Engineers Waterways Experiment Station
HEAOOUARTBS BULDMG
ENTRANCE
I -K-
1
ENVflONMENTAI. lABORATORY —
FOR INFORMATION CONTACT: PUBLIC AFFAIRS OFFICE U.S. ARMY ENGINEER WATERWAYS EXPERIMENT STATION 3909 HALLS FERRY ROAD VICKSBURG, MISSISSIPPI 39180-6199 PHONE: (601) 634-2502
STRUCTURES LABORATORY
AREA OF RESERVAT«» . 2 rjqw«
Waterways Experiment Station Cataloging-in-Publication Data
Donigian, Anthony S. Use of nutrient balances in comprehensive watershed water quality modeling of
Chesapeake Bay / by Anthony S. Donigian, Jr., Radha V. Chinnaswamy, Patrick N. Deliman ; prepared for Chesapeake Bay Program Office, U.S. Environmental Protection Agency.
118 p.: ill.; 28 cm. - (Technical report; EL-98-5) Includes bibliographic references. 1. Water quality - Mathematical models. 2. Environmental quality -Mathematical
models. 3. Valley ecology - Mathematical models. 4. Stream ecology - Mathematical models. 4. Chesapeake Bay (Md. and Va.) - Mathematical models. I. Chinnaswamy, Radhakrishnan V. II. Deliman, Patrick N. III. United States. Army. Corps of Engineers. IV. U.S. Army Engineer Waterways Experiment Station. V. Environmental Laboratory (U.S. Army Engineer Waterways Experiment Station) VI. United States. Environmental Protection Agency. Chesapeake Bay Program. VII. Title. VIII. Series: Technical report (U.S. Army Engineer Waterways Experiment Station); EL-98-5. TA7 W34 no.EL-98-5
Contents
Preface yj Conversion Factors, Non-SI to SI Units of Measurement vii
1-Introduction 1
Study Background 1 Scope and Objectives i Summary Conclusions and Recommendations 2 Format of this Report 6
2-Expected Nutrient Balances by Land Use Categories 7
Overview and Summary Tables 7 Forest Balances 8 Pasture Balances 8 Urban Balances 9 Agricultural Cropland Balances 11 Closure 11
3-Application of Nutrient Balances and Model Refinements to the Shenandoah River Watershed 14
Overview of Model Refinements 14 Hydrology Simulation 15 Nonpoint Source and Loading Assessment 16 Water Quality Calibration Results 25 Conclusions and Recommendations 28
References 38 Appendix A: Shenandoah Model Segments Results Al SF 298
in
List of Figures
Figure 1. Chesapeake Bay Watershed Model and Shenandoah Model Segments 3
Figure 2. Simulated and Observed Flow at Reach 190, SF Shenandoah River at Front Royal, VA 18
Figure 3. Simulated and Observed Row at Reach 200, Shenandoah River at Millville, WV 19
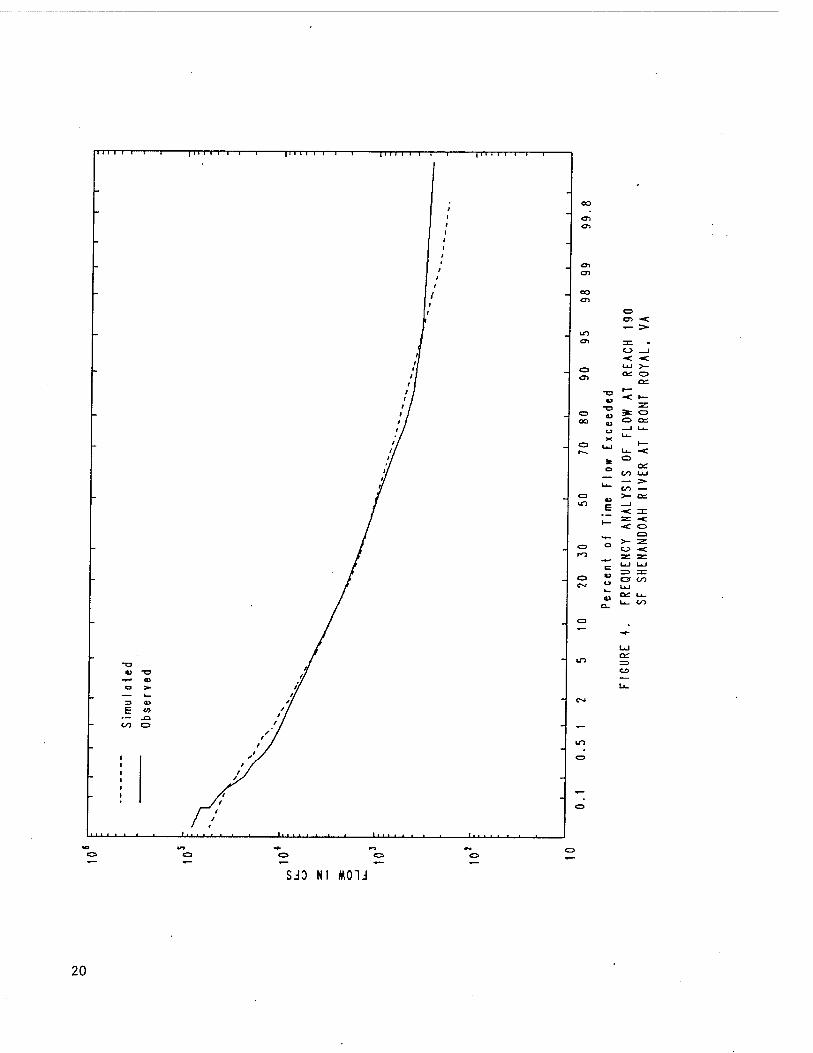
Figure 4. Frequency Analysis of Flow at Reach 190, SF Shenandoah River at Front Royal, VA ... 20
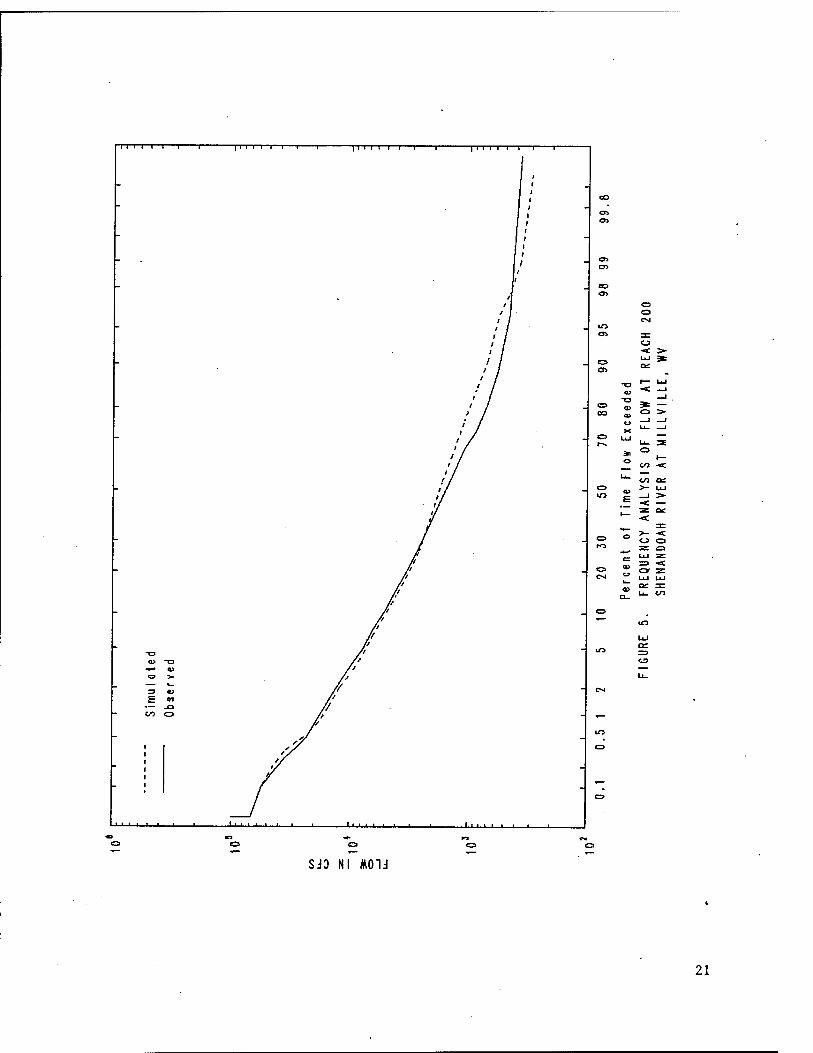
Figure 5. Frequency Analysis of Flow at Reach 200, Shenandoah River at Millville, WV 21
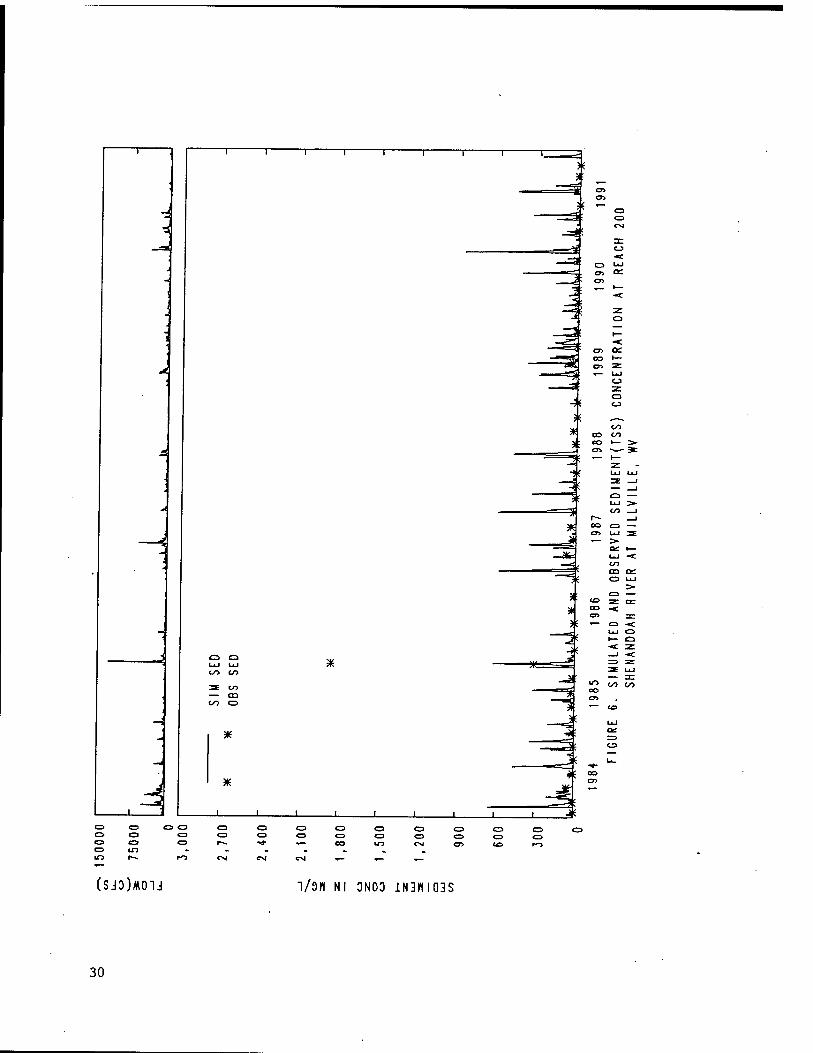
Figure 6. Simulated and Observed Sediment (TSS) Concentration at Reach 200, Shenandoah River at Millville, WV 30
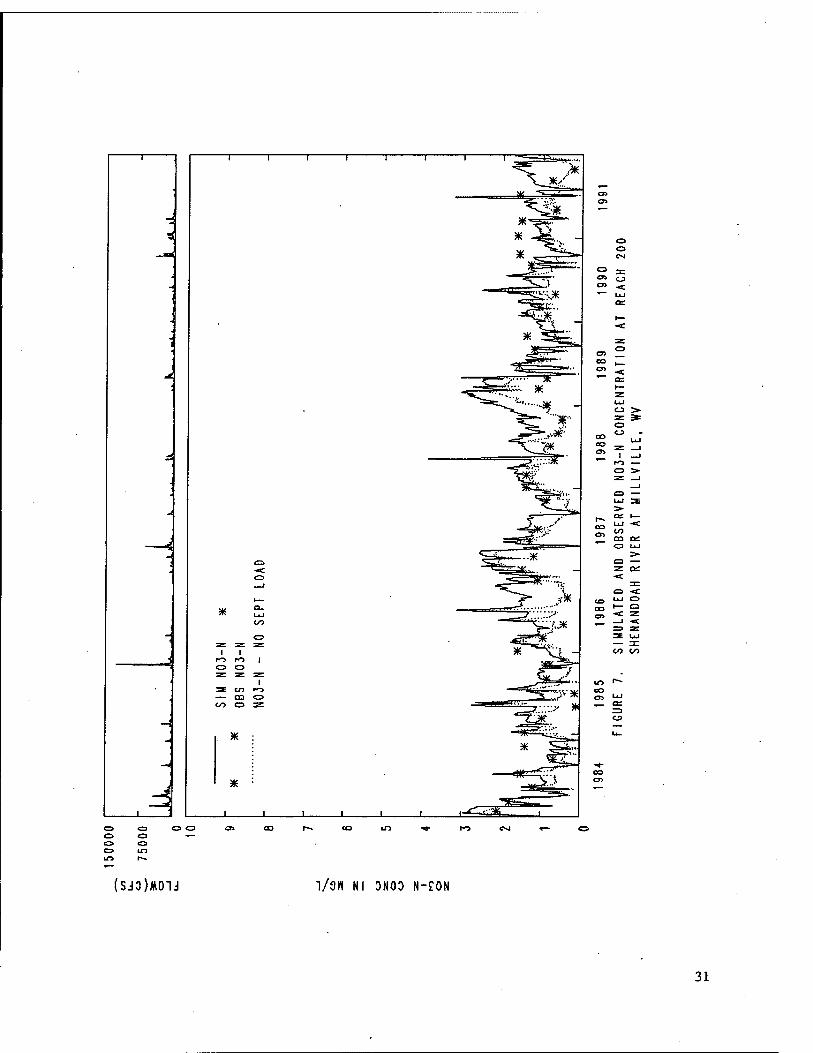
Figure 7. Simulated and Observed N03-N Concentration at Reach 200, Shenandoah River at Millville, WV 31
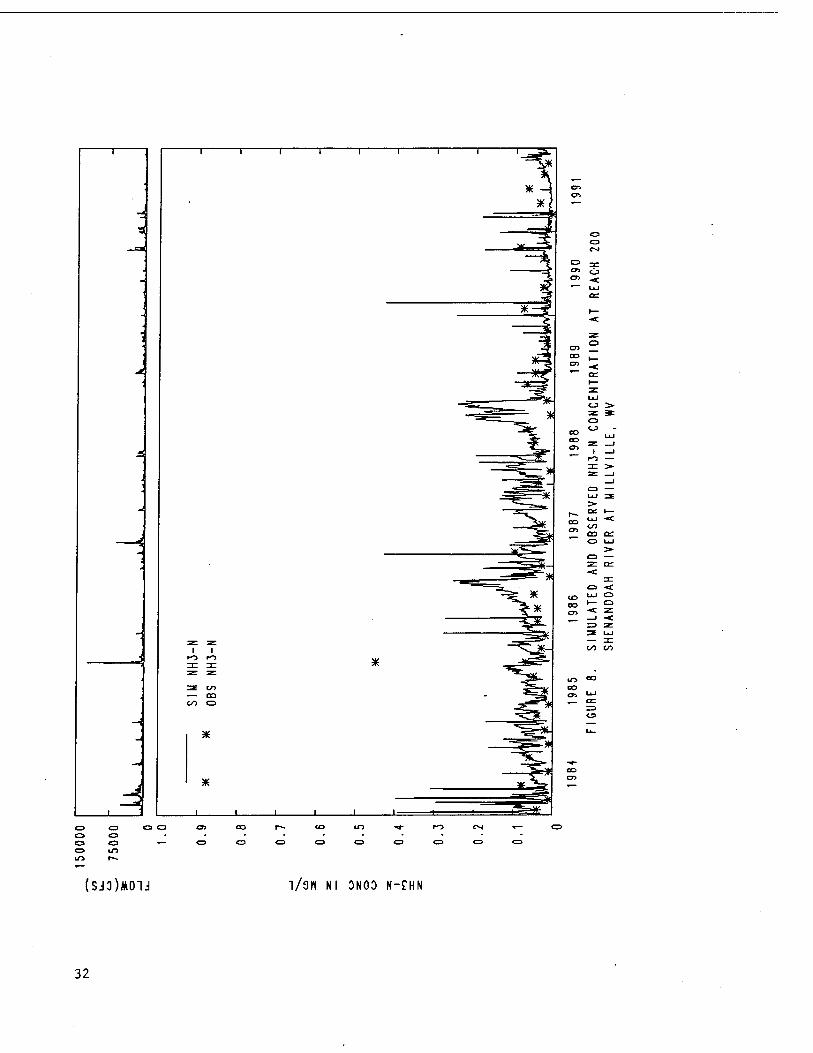
Figure 8. Simulated and Observed NH3-N Concentration at Reach 200, Shenandoah River at Millville, WV 32
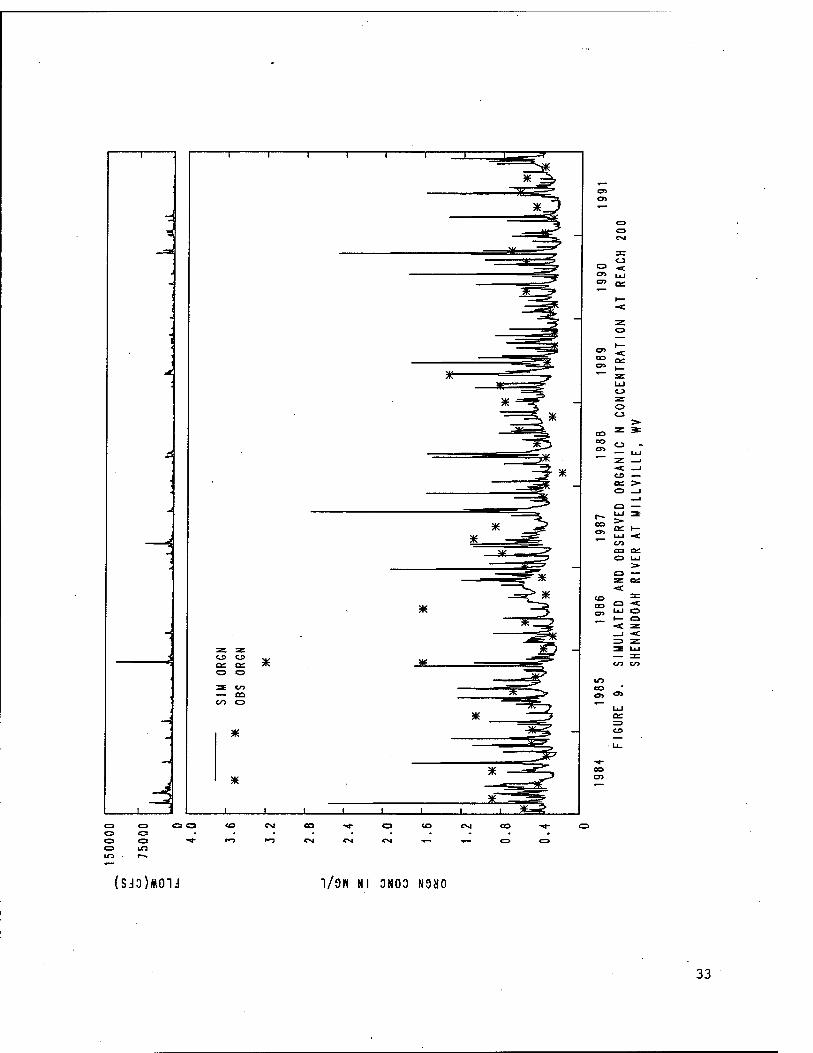
Figure 9. Simulated and Observed Organic N Concentration at Reach 200, Shenandoah River at Millville, WV 33
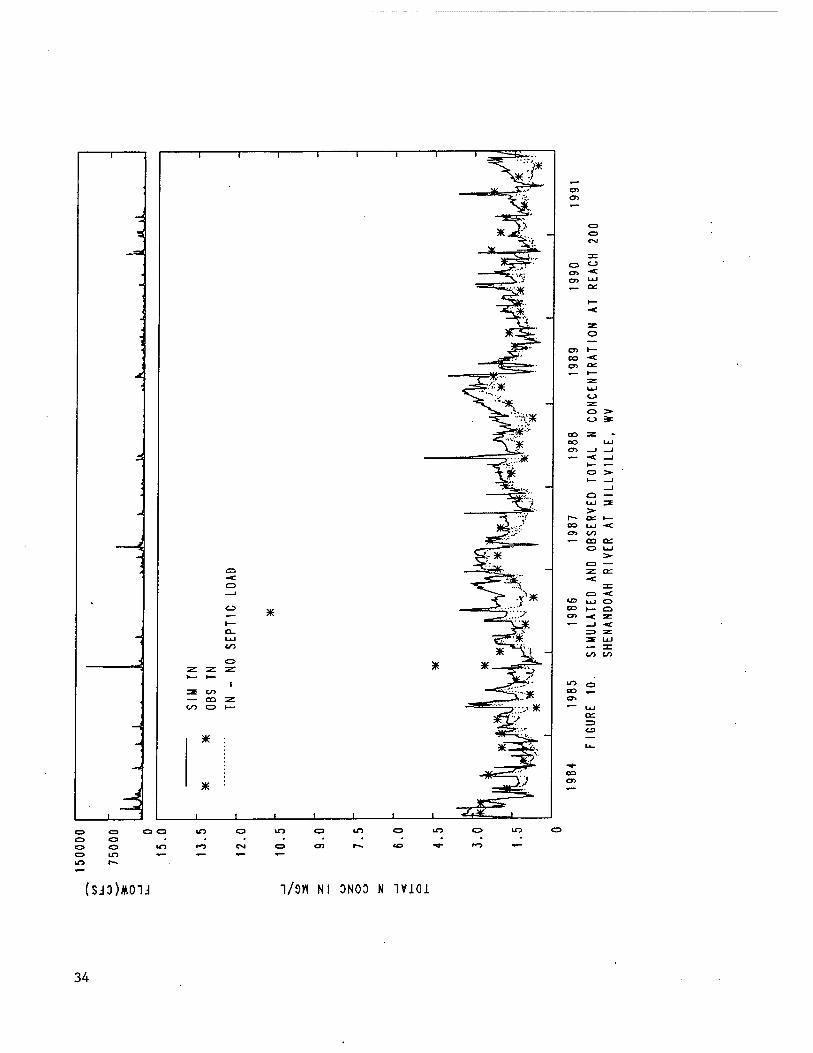
Figure 10. Simulated and Observed Total N Concentration at Reach 200, Shenandoah River at Millville, WV 34
Figure 11. Simulated and Observed P04-P Concentration at Reach 200, Shenandoah River at Millville, WV 35
Figure 12. Simulated and Observed Organic P Concentration at Reach 200, Shenandoah River at Millville, WV 36
Figure 13. Simulated and Observed Total P Concentration at Reach 200, Shenandoah River at Millville, WV 37
IV
List of Tables
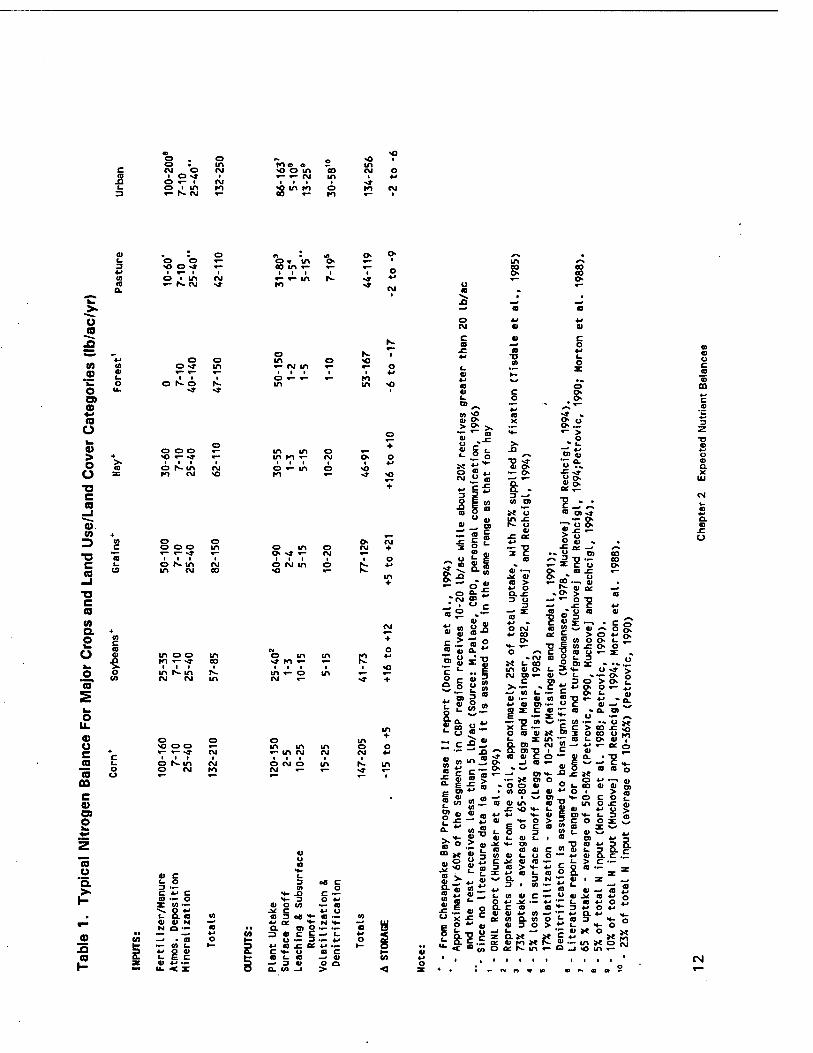
Table 1. Typical Nitrogen Balances for Major Crops and Land Use/Land Cover Categories 12
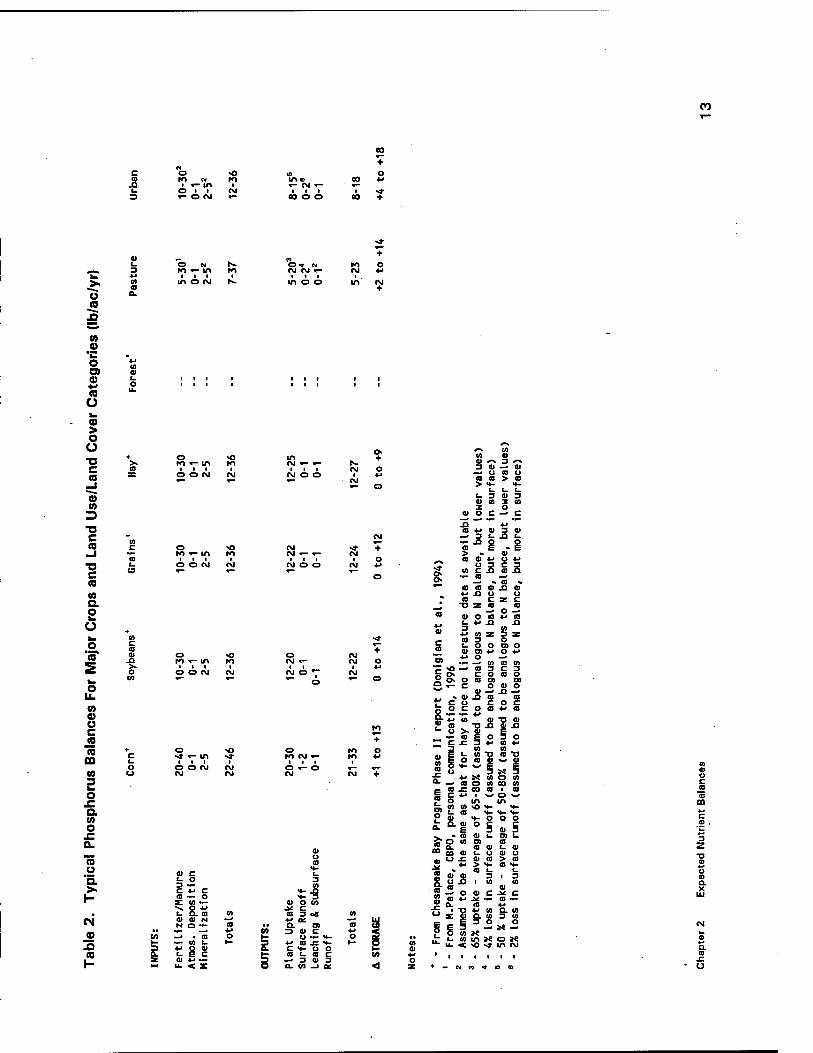
Table 2. Typical Phosphorus Balances for Major Crops and Land Use/Land Cover Categories 13
Table 3. Shenandoah River Watershed Hydrologie Calibration: Comparison of Annual Total Observed versus Simulated Flow 17
Table 4. Unit Area Nonpoint Source Loading Rates for Each Land Use for the Shenandoah Basin 23
Table 5. Percent of Total Load Contributed From Each Source in Shenandoah Basin 23
Preface
The work herein was authorized under U.S. Army Engineer Waterways Experiment Station (WES) Contract No. DACW39-94-C-0052 with Aqua Terra Consultants, dated 30 March 1994 and amended 25 July 1995; the work was completed on 30 September 1996.
Dr. Patrick N. Deliman, Environmental Laboratory (EL), WES, was the Project Officer and co-author of this report. He was instrumental in facilitating the administration and execution of the contract work.
The Use of Nutrient Balances in Comprehensive Watershed Water Quality Modeling of Chesapeake Bay study, as documented in this report, was performed for the U.S. Environmental Protection Agency Chesapeake Bay Program Office (CBPO), Annapolis, MD. Mr. Lewis Linker, CBPO, was point of contact The CBPO provided data for model testing and refinement within the Chesapeake Bay Watershed Model that were critical to the successful completion of this study. Mr. Linker and his staff at the CBPO are acknowledged for their assistance and cooperation.
Mr. Anthony S. Donigian, Aqua Terra, was the Principal Investigator and Project Manager, responsi- ble for the overall technical direction of the work and preparation of the final report. Mr. Radha V. Chinnaswamy, also of Aqua Terra, reviewed the literature and assisted in developing nutrient balances for the simulated land-use categories; he also performed model testing and calibration and assisted in preparing the final report. Messrs. Brian Bicknell and Thomas Jobes, Aqua Terra, assisted with operational and technical model application issues throughout the study.
At the time of publication of this report, Director of WES was Dr. Robert W. Whalin, and EL Director was Dr. John Harrison. Dr. Richard E. Price was Chief, Environmental and Effects Division, EL. WES Commander was COL Robin R. Cababa, EN.
This report should be cited as follows:
Donigian, A. S., Chinnaswamy, R. V., and Deliman, P. N. (1998). "Use of nutrient balances in comprehensive watershed water quality modeling of Chesapeake Bay," Technical Report EL-98-5, U.S. Army Engineer Waterways Experiment Station, Vicksburg, MS.
The contents of this report are not to be used for advertising, publication.
VI
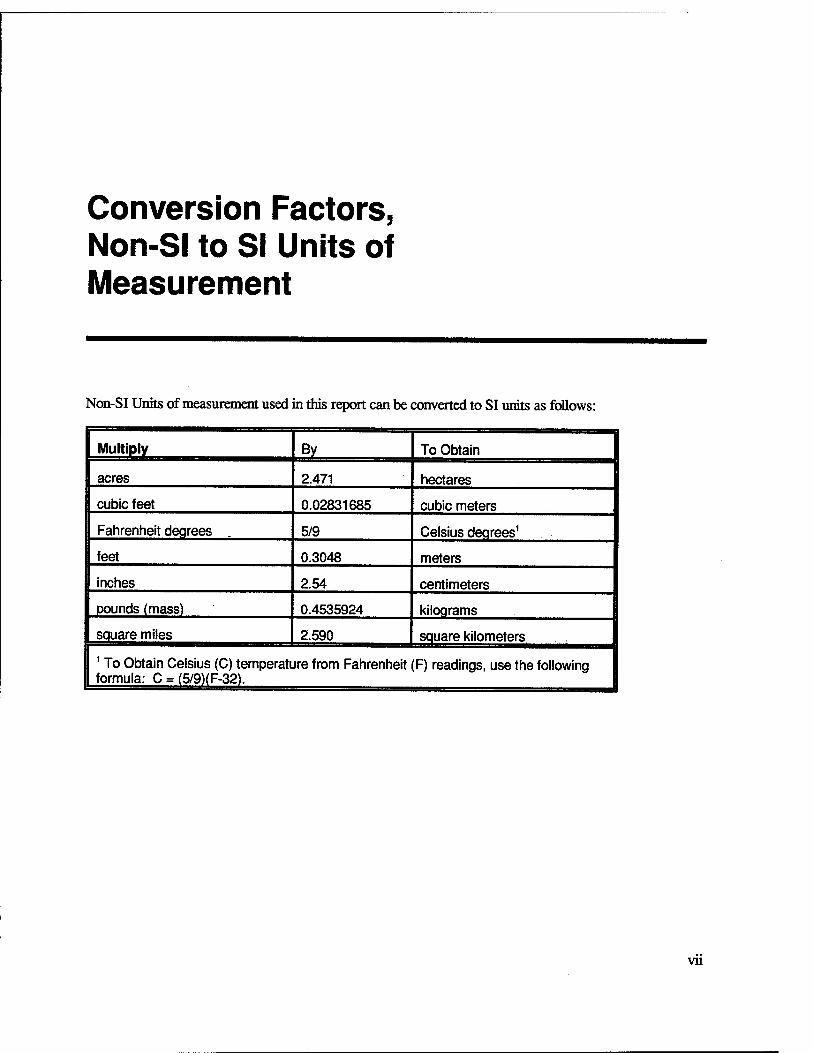
Conversion Factors, Non-SI to SI Units of Measurement
Non-SI Units of measurement used in this report can be converted to SI units as follows:
Bv
2.471
To Obtain
hectares
Fahrenheit degrees
0.02831685
5/9
cubic meters
Celsius degrees1
feet
inches
pounds (mass)
0.3048
2.54
0.4535924
meters
centimeters
kilograms
square miles 2.590 square kilometers 1 To Obtain Celsius (C) temperature from Fahrenheit (F) readings, use the following formula: C = (5/9)(F-32).
vn
1 Introduction
Study Background
In 1987 the Chesapeake Bay Agreement was signed by the EPA Administrator and governors of the member states recommending a 40% reduction in nutrient loadings to the Chesapeake Bay to restore and maintain the water quality and living resources of the Bay. The Chesapeake Bay Watershed Model, based on the U.S. EPA Hydrologie Simulation Program-Fortran (HSPF) (Bicknell et al. 1993) was used to provide a framework for quantifying and evaluating the needed nutrient loading reductions to the Chesapeake Bay, and to allow the Chesapeake Bay Program Office (CBPO) to evaluate the impacts of land use changes and alternate nutrient and agricultural management practices. The Watershed Model provides total pollutant loadings from all land areas tributary to the Bay in order to drive a fully dynamic three-dimensional, hydrodynamic/water quality model of Chesapeake Bay.
The CBP Watershed Model is a unique state-of-the-art watershed modeling capability that includes detailed soil process simulation for agricultural areas, linked to an instream water quality and nutrient model capable of representing comprehensive point and nonpoint pollutant loadings for die entire 68,000 square mile drainage area of the Chesapeake Bay. In 1992, major refinements and re- calibration of the Watershed Model was completed and a report prepared describing the CBP Phase II Watershed Model application to the Bay drainage for calculating nutrient loadings to the Bay (Donigian et al. 1994). That work included updating and extending the model database, incorporating detailed agricultural process simulation using the AGCHEM modules of HSPF, developing capabilities for instream sediment-nutrient interactions, and re-calibrating the improved model for the extended time period. However, for non-agricultural areas, simple empirically-derived algorithms were used to estimate nonpoint loadings, both surface and subsurface, based on user-derived potency factors, washoff rates, and subsurface concentrations. This approach for the non-agricultural lands, including the large areas of forested lands, did not maintain a nutrient balance and inhibited detailed assessment of the impacts and contributions of atmospheric pollutant sources (specifically nitrogen) to overall water quality.
Scope and Objectives
Recent HSPF code enhancements (Bicknell et al., 1996a) have extended the detailed AGCHEM algorithms to forested areas (Hunsaker et al, 1994; Bicknell et al., 1996b), have added more direct input of atmospheric sources, and have improved the AGCHEM plant uptake functions for better representation of agricultural nutrient management practices (Donigian et al., 1995). These
Chapter 1 Introduction
enhancements have shown the added benefits of performing detailed nutrient balance calculations for the non-agricultural areas. As a result of these efforts, additional improvements and refinements were identified and recommended to more directly consider atmospheric deposition and other nutrient sources by allowing nutrient balance approaches for all land uses, consistent with the recommendations of the Chesapeake Bay Executive Council and the Nonpoint Source Evaluation Panel in 1990 (Chesapeake Bay Nonpoint Source Evaluation Panel, 1990). This comprehensive nutrient balance approach will help improve the overall utility of the Watershed Model as a planning tool for comprehensive watershed planning and assessment of nutrient management/reduction alternatives.
The specific improvements recommended and tasks identified in this effort include the following developmental and application aspects:
Model Development and Refinement
• Develop nutrient balances and simulation procedures for the AGCHEM module to better represent nutrient cycling, mass balance, and runoff contributions for non-agricultural lands
• Test the AGCHEM procedures and refinements on the non-agricultural land uses, along with atmospheric sources, for selected segments of the CBP Watershed Model
Model Testing and Application
• Apply the refined AGCHEM procedures for the non-agricultural lands to a selected subbasin of the Chesapeake Bay drainage
• Re-calibrate the Watershed Model, with the refined AGCHEM, for the selected subbasin and assess the load contributions from all sources and the impact of the refined procedures
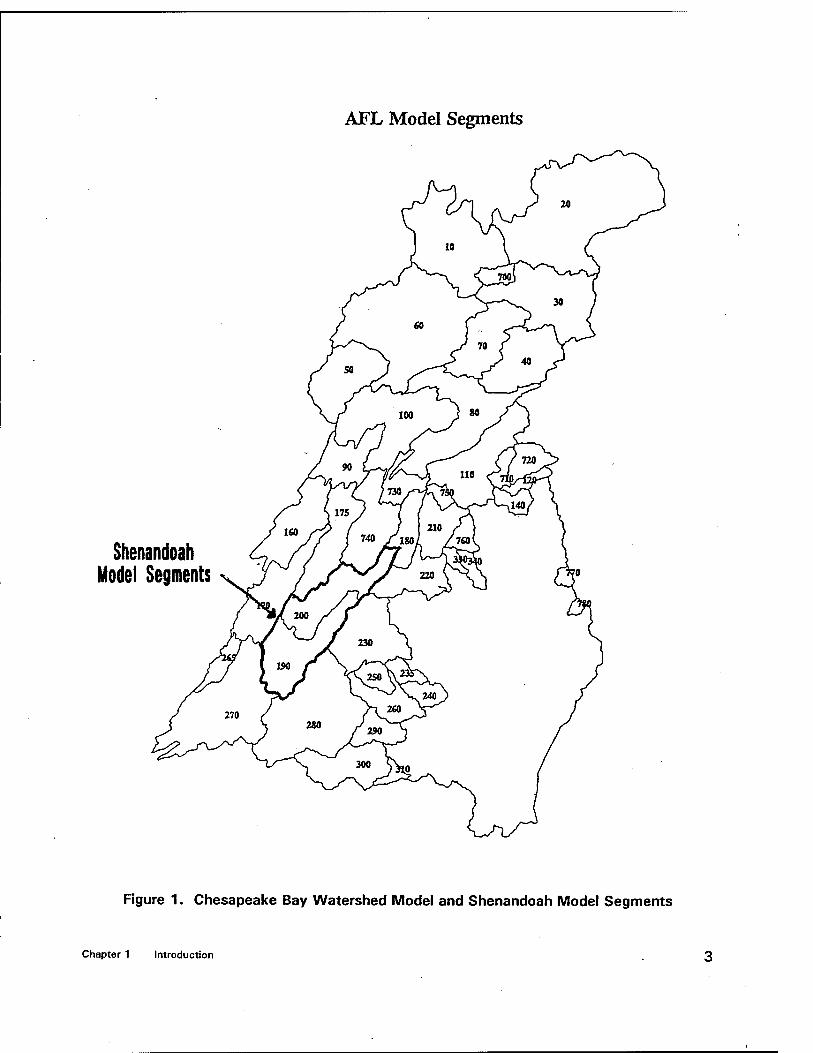
We selected the Shenandoah River subbasin within the Chesapeake Bay drainage to fully test the refined AGCHEM module integrated within the Watershed Model framework. Figure 1 shows the CBP Phase III Watershed Model segmentation for the Above Fall Line (AFL) region, along with the location of the Shenandoah subbasin. The most recent land use, point source, meteorologic, atmospheric deposition, septic system load, flow, and water quality data used in the current Phase IV watershed model effort was provided by the Chesapeake Bay Program Office (L. Linker, personal communication, 1996).
SUMMARY CONCLUSIONS AND RECOMMENDATIONS
The water quality results from this effort are not greatly different from those produced in the earlier study, in spite of all the changes implemented, including more extensive application of AGCHEM, addition of septic system loads, refinement of loading rates, and additional calibration. However, this simply indicates that the prior calibration was a good representation of the observed data, and that the changes implemented to better define the load sources were incorporated while maintaining the accuracy of the overall simulation. The real benefits of the current refinement phase of the CBP
Chapter 1 introduction
AFL Model Segments
Shenandoah Model Segments
Figure 1. Chesapeake Bay Watershed Model and Shenandoah Mode! Segments
Chapter 1 Introduction
Watershed Model are realized from the extension of the nutrient balance approach to all major land use (except urban, in our simulations), and the utility of this approach for nutrient management.
Below we discuss some of the areas where the current results differ from those presented earlier in Donigian et al (1995), and identify some problems that still remain for selected constituents, where further 'fine tuning' of the calibration is recommended:
a. The N03-N simulation is acceptable but not as seasonally correct as the earlier results reported by Donigian et al (1995). We suspect that the differences primarily in late summer, fall, and winter for selected years are due mostly to the newly-added septic loads and possibly inaccuracies in the seasonal loadings from the forest and pasture segments, i.e. the added AGCHEM segments.
b. Both the NH3-N and P04-P simulations have improved with reduced contributions from cropland (along with reduced sediment loads), reduced peaks due to nutrient application adjustments, and increased algal uptake due to higher benthic algae levels than in the previous efforts.
c. Simulation of both Organic N and Organic P has improved in this effort, and since Organic P is the major component of Total P similar improvement is shown there. Except for the November 1985 storm, the organics are generally well represented, although many of the peaks are still somewhat high. The improvements result from reduced sediment loads (and associated organics), adjustments to the N/P ratios, changes to manure applications, and reductions in phytoplankton levels (which are included in the organic state variables).
d. With the detailed AGCHEM simulation of forests, the forest segment is now a major contributor of organic N, both labile and refractory in both dissolved and particulate forms, along with the animal acres segment. Also, for the forest segment, BOD and Organic P loads are calculated from the organic N components; thus BOD loads from forest are also a major component. In the Shenandoah, our results indicate that forests contribute about 25% of the Organic N load and 30% of the BOD load, while the animal acres segment contributes more than 30% of the Organic N to the stream. Both of these components need further investigation as there is little data to confirm this level of contribution.
Our primary recommendations resulting from this effort are as follows:
1. Finer segmentation for all stream reaches should be pursued as a major component of future Watershed Model enhancements. Increasing the spatial detail of the model by about a factor of lOx, along with appropriate detail in the precipitation and land use inputs, will help to improve all the process simulations, with specific benefits for the sediment and associated constituents, and benthic processes.
2. A more consistent approach for both BOD and organics loading needs to be developed and applied consistently across all land use categories. Currently the forest simulation enhancements provide loadings of both labile and refractory organic N components (dissolved and paniculate), while the other AGCHEM segments (Hi-Till, Lo-Till, Hay, Pasture) are restricted to just the refractory particulate organic N and P eroded from the land surface. The
4 Chapter 1 Introduction
forest organic N capabilities can, and probably should, be applied to all land segments to implement this consistent loading representation. Further investigation of partitioning and transformation parameters for the organics will be needed, along with consideration of extending the forest N simulation approach to include phosphorous (see #8, below).
3. The current representation of septic system loads needs to be re-evaluated. The use of a constant load has helped to reduce the seasonality of the N03 simulation shown in both the observed data and the previous model simulations. A revised approach is needed to allow the septic loadings to be 'hydrologically-driven' so that the seasonality of the hydrologic regime and loadings is represented.
4. The algal simulation, both phytoplankton and benthic algae, need more data, investigation, and evaluation. In this effort, the benthic algal levels were increased dramatically, by factors of 10 to 20, based on very limited data from widely scattered sites outside the Chesapeake Bay drainage. Additional literature data should be identified and actual site-specific data within the Chesapeake Bay watersheds collected to confirm the general magnitude of both the benthic and phytoplankton levels represented in the model. The algal simulation has such a critical impact on inorganic nutrient levels that major improvements in their modeling will depend on establishing realistic levels for the algal populations.
5. The urban land use should be divided into separate urban categories - residential, commercial, industrial — each with pervious and impervious fractions, as a prelude for nutrient mass balance and AGCHEM-type model application. Although CBPO has pursued an AGCHEM approach for the aggregated urban pervious segment, we feel a better definition of specific urban activities is needed to develop reasonable nutrient balances.
6. The CBPO should explore the option of eliminating the current 'composite crop' representation in the model, developed as part of the Phase II enhancements in 1991, and move to simulating each major crop individually in each cropland category. Recent computer hardware developments have eliminated many of the run time restrictions that required this simplification, and such an approach would allow more accurate representation of agricultural practices and the resulting nutrient balances.
7. In conjunction with representing each major crop, the nutrient application rates, timing, procedures, and composition distribution (both fertilizers and manure) should be closely reviewed and revised as needed. Experience with both the Watershed Model and the detailed Patuxent Model has confirmed the critical importance of the assumptions underlying the nutrient applications in the model.
8. The forest N simulation approach should be extended to include the P cycle, so that both N and P mass balances can be implemented for all land segments. Just as the previous AGCHEM module provided a valid framework for the forest N enhancements, the P cycle processes currently in AGCHEM can be readily adapted for forested conditions. Field site testing on small forested watersheds would be needed to fully evaluate the code enhancements.
Chapter 1 Introduction
Format of this Report
Following this introduction, Chapter 2 describes the development of nutrient balances for all land uses with the focus on the non-agricultural cropland segments while Chapter 3 presents the results of model testing and re-calibration to the Shenandoah subbasin. The Appendix includes complete simulation results for the Shenandoah subbasin..
Chapter 1 Introduction
2 Expected Nutrient Balances by Land Use Categories
Overview and Summary Tables
As part of this study, 'expected' nutrient balances were developed for forest, pasture, and urban land use categories to help guide the model application and calibration effort for those land segments for which the new HSPF Version 11.0 AGCHEM module was applied to simulate the detailed nitrogen dynamics. Consequently, the AGCHEM sections replaced the PQUAL sections in the Watershed Model for forest for only the N species, and for pasture for both N and P species. Although the preliminary nutrient balances for the urban land use were developed, the nutrient loadings from the urban segment in the Model were still simulated using PQUAL, as in Phase EH; the basis for this decision is discussed in Chapter 3.
Tables 1 and 2 (at the end of this chapter) show the typical or expected nitrogen and phosphorus balances, respectively, for different major crops and land cover/use categories. The information in the tables is presented in a 'production' sense by estimating the annual INPUTS and OUTPUTS for the soil-plant system. The INPUTS represent external additions to the system, such as nutrient applications (i.e. fertilizer and manure), in addition to net mineralization from the soil that supplies plant-available inorganic nutrients. The OUTPUTS represent various loss mechanisms, plus plant uptake (e.g. through harvest or plant retention) that extracts the nutrients from the soil impacting the potential for nutrient export and losses. Thus, although mineralization and plant uptake are not truly external to the soil-plant system, they are most often key components in establishing representative nutrient balances for most land use/cover categories.
A review of the literature was performed to develop the nutrient balances for each category. The nitrogen balance for forest was derived primarily from information in the report by Oak Ridge National Laboratory (ORNL; Hunsaker et al., 1994) that was the basis for the algorithm enhancements to AGCHEM for the forest N cycling (Bicknell et al., 1996). Since HSPF does not currently have the capability to simulate the forest P cycling in detail, the PQUAL module was used for P loading simulations and hence we did not develop the P balance for forests. Also, the nutrient balances for agricultural croplands developed during Phase II (Donigian et al., 1994) were used in this study and are included in Tables 1 and 2. In this chapter (below), we briefly discuss the development of the 'expected' nutrient balances for each land use/cover as background for the values shown in the tables.
Chapter 2 Expected Nutrient Balances
Forest Balances
In the previous CBP modeling efforts, the PQUAL module in HSPF was used to compute the N and P loadings from the forest segments based on user-defined potency factors and subsurface concentrations. Since the Chesapeake Bay watershed has approximately 60% forested land and there was concern regarding the level of N loadings from these areas, there was a need to simulate the N cycling in forests with a more detailed mass balance approach that would also allow more direct consideration of atmospheric deposition inputs and impacts.
The ORNL report (Hunsaker et al., 1994) provided the design details for the enhancement of the AGCHEM/NTTR module in HSPF based on an extensive literature review of forest nitrogen pools and fluxes, review of monitored N data from the CBP region, and available N models. The literature review focused on the data collected from two studies: the International Biological Program which provided data on 116 forest research sites around the world, and the Integrated Forest Study that provided 17 forest research sites (16 in North America). The information and data collected at these sites and subsequently presented in the ORNL report formed a reasonable basis for developing the nitrogen balance shown in Table 1, besides serving as a tool for the development of forest N module. Based on the review of available literature and information provided in ORNL report, the following general summary is presented.
• The primary sources of input to forests are atmospheric N deposition, with nitrogen fixation for some species, along with plant available N (inorganic N) from mineralization. Forest fertilization can be important in silvicultural activities and should be included if appropriate for a specific site assessment; we have not included forest fertilization in Table 1.
• The major pathways by which N export losses occur include leaching from soil and denitrification. Also, the surface runoff losses are generally small except when the forest system has reached higher levels of N saturation (Stoddard, 1994). Although plant uptake is not a true 'loss' from the system, it is a key component in the overall balance.
• The other processes that play important roles in forest N cycling are retention of ammonium- N by soils, immobilization of available nitrogen by microorganisms, and return of plant N to the soil both belowground and through the forest litter layer. See Hunsaker et al (1994) and Bicknell et al (1996c) for additional details.
Since mineralization and plant uptake are such dominant components of a forest N balance, an accurate accounting of their fluxes is critical to modeling the N cycling and export to waterbodies.
Pasture Balances
A significant portion of the Chesapeake Bay region consists of pasture, or grassland ecosystems. The grassland/pasture ecosystem presents a wide diversity of environments, productivity and degree of management. The limited literature data available for the input-output dynamics of nutrients in both grasslands and pastures are often based on studies conducted across the continental U.S. and are not specific to CBP region. However, based on the review of available literature data on nitrogen cycling
3 Chapter 2 Expected Nutrient Balances
in these ecosystems, the following general conclusions are presented. Since there are very little literature data available on phosphorus cycling in the grassland systems, ,many of the corresponding components were assumed to be analogous to N cycle components.
• The principal sources of N inputs are atmospheric deposition, manure and N fertilizer applications, along with the mineralization contribution to plant-available N as noted above for forests. Symbiotic and nonsymbiotic fixation of N2 is considered small or insignificant under typical grassland conditions (Woodmansee, 1978).
• The N uptake by plants (aboveground, belowground and understory) are in the range of 65- 80% of the total N input (Legg and Meisinger, 1982; Muchovej and Rechcigl, 1994). Hence, an average 73% plant N uptake was assumed in Table 1.
• In pasture, loss due to volatilization is significant (Muchovej and Rechcigl, 1994). About 10- 25% is lost due to volatilization of NH3 from animal urine and feces while about 5% is lost due to surface runoff (Meisinger and Randall, 1991; Legg and Meisinger, 1982). Consequently, an average 17% volatilization loss and 5% surface runoff loss were assumed in Table 1; clearly, these values will vary by site-specific conditions.
• Denitrification is not a significant factor in N balance for most pasture and grasslands (Woodmansee, 1978). This is probably due to the fact that native and extensively managed grasslands are N deficient (Muchovej and Rechcigl, 1994). However, denitrification is very site-specific and was assumed to be similar to hay land for our balance.
• Some studies indicate that leaching is an important factor while other studies indicate leaching is either small or insignificant in these systems (Woodmansee, 1978; Legg and Meisinger, 1982; Keeney, 1982). Since very little research has been done on nitrate leaching from grasslands in the U.S. (Muchovej and Rechcigl, 1994) and those studies were conducted at different soils, climatic conditions and vegetation type, it is difficult to generalize the leaching potential of pasture land. However, subsurface losses are one of the major pathways by which N is transported from grasslands (Muchovej and Rechcigl, 1994). Hence, the leaching and subsurface losses were assumed to be the same as that for hay lands since hay and pasture lands have similar conditions.
• Mineralization and immobilization are important factors in the grassland N balance. However, data are not available on the mineralization and immobilization rates for grassland systems. As mentioned above, since pasture and hay lands have similar conditions, mineralization and immobilization for pasture were assumed to be in the same range as that for hay lands. For conditions where manure inputs are significant, mineralization rates in the surface soil layers should reflect the higher values common to the readily mineralizable portion of manure organics.
Urban Balances
There are very few studies and literature data on the nutrient dynamics in an urban environment. Although the few available studies were performed in parts of the northeastern U.S., they provide
Chapter 2 Expected Nutrient Balances
current state of knowledge on the fate of the fertilizers applied to home lawns. Based on the review of available literature data, the following general conclusions are presented. Since there are no literature data available on phosphorus cycling in urban land use, it was assumed to be analogous to N cycling in our tables.
• The principal source of N input is fertilizer N applied to lawns. Intensively managed turfgrass receives between 100-200 lb N/ac/yr (Muchovej and Rechcigl, 1994; Petrovic, 1990; Morton et al. 1988; Gold et al., 1990).
• In general, the N uptake by turfgrass is in the range of 5-74% of the total N input depending on the N release rate, application rate, and species of grass (Petrovic, 1990). On an average, about 35-60% of the applied N is found in clippings while about 14-21% of the fertilizer N is found in a thatch layer (Petrovic, 1990; Muchovej and Rechcigl, 1994). Therefore, the total N taken up by turfgrass is in the range of 50-80%. In Table 1, we assumed that an average 65% of the total N input was taken up by plants.
• Loss of applied fertilizer to the atmosphere as either ammonia due to volatilization or as one of several nitrous oxide compounds (e.g. denitrification) is a significant factor in the N balance of turfgrass (Petrovic, 1990). Factors such as presence or absence of thatch, irrigation and humidity can affect the rate of volatilization. The soil moisture and temperature have a significant influence on denitrification rates. About 10-36% of the applied fertilizer N is lost due to volatilization and/or denitrification (Petrovic, 1990). In Table 1, we assumed that an average 23% was lost due to volatilization and denitrification.
• The fertilizer management practices, soil texture, and irrigation appear to have influence on the leaching losses in turfgrass. Even though the leaching losses from turfgrasses are variable, in general these losses are less than 10% of the applied N (Muchovej and Rechcigl, 1994; Morton et al. 1988). Hence, we assumed that ten percent of the total N input is lost due to leaching.
• Surface runoff losses are minimal (less than 7% of the total waterborne loss) in turfgrass with permeable soils (Morton et al. 1988; Petrovic, 1990). For our purposes, we assumed that about 5% of the total N input is lost in surface runoff.
• Mineralization rates are not known or little research has been done for turfgrass (Petrovic, 1990). However, we assumed that N and P mineralization rates for urban lawns are in the same range as that for hay and pasture land. Studies comparing rural and urban forest N cycling indicate lower mineralization rates, less cycling, and lower labile N and nitrification in the urban environments possibly due to pollution effects on vegetation and litter quality (Goldman et al., 1995; White and McDonnell, 1988).
A significant limitation in applying the urban nutrient balance within the framework of the Watershed Model is the lumped, or aggregate, nature of the urban land use segment that includes residential, commercial, industrial, parks, etc. A more refined definition of the urban category, with the specific activities and land cover is needed to attempt a nutrient balance modeling approach (see Chapter 3).
10 Chapter 2 Expected Nutrient Balances
Agricultural Cropland Balances
The nitrogen and phosphorus balances developed for croplands during the Phase II modeling effort (Donigian et al., 1994) were also used in this study without modification. The values included in Tables 1 and 2 are typical nitrogen and phosphorus balances expected for Corn, Soybean, Grains and Hay when the nutrients are applied at agronomic rates meeting crop requirements. Moreover, since plant uptake amounts are a function of crop yields, the uptake values are based on average yields expected for the Chesapeake Bay region. Our experience with using these values for agricultural croplands indicates that wide variations can be expected depending on site-specific conditions. For example, yields can vary with species, double-cropping and winter cover crops will increase uptake levels, and the composition of nutrient inputs (e.g. organic versus inorganic), especially for manure and sludge applications, will have a major impact on the N and P balance components. Thus, users should attempt to develop site-specific balances to the extent possible and/or refine the values in the tables for specific local conditions.
Closure
The nutrient balances in Tables 1 and 2 for forest, pasture and urban land uses were based on literature data collected in different parts of the U.S., but with a specific focus on the Chesapeake Bay region, while the values for the croplands are more directly pertinent to the Bay region.. Even though the data may have been derived from somewhat diverse sites and conditions, and the techniques used in collecting the data may have been different, the available literature and the data formed a reasonably good basis for determining the general magnitude of many of the nutrient balance components. Model users should use these balances as general guides in evaluating simulation results with the knowledge that local conditions can have a major impact on the values shown in the tables. As noted above, these balances should be updated and/or modified whenever more site-specific data are available.
Chapter 2 Expected Nutrient Balances 1 1
2 o : in in CM O CM «oom CO CM t O •» i <r- w CM in
O «- 1 CM ■ t I >* o < m «- r- CM
to s^s o ro
01 . ; o w • to o> o* L. o o o« in o »~ t
3 >o o »» ^- comf" ^- *■* I «— 1 ■ t i i 1 i o a o i m CM «- »- in K .* +* co •- f<- CM •* to »» a. rvi
w >• "o -2 £ K
_ o r». ■ ■M o o in o <o
CO IA O N» in «- CM in w— «"■ o .2 a> «~ «•- ■ i ■ i 1 ■*-»
i. 1 1 • o «- «- V— to *c o o f>- o s. in in «O o u. -» N» i
o> 0) ** CO o o
<0 o o o o in in O
7 > +
(0
O «- vT »— in to »- CM Sv o o ONm CM o «- m o >o *■*
o z fO «M NO to T- »»• >o
•a + c co _i 0) CO + «— 3 IA o o o CM c o o o in o in o CM + "O a 1 1 I • o sr *-
i i i CM
I 1 o c L. oNtn CM o CM in o fc *-» (0 «3 in CM CO vO »-
in _1 + ■n c CO
(0 a + CM
o O
(A C CO
9! moo in CM o in in P
+ O
■6 t»l «- ■» oo •* to «- k> >. ■ i i • ■ 1 <o p o in N- in N. in r- o in r- •"•
CO m IM in CM «- **■ + "ST
CO o
a
o CM
a ■a (A
00 co o
c o
o X
-> 2
c o .& V y"N
CO -* » X o> o o .„
H- «- > o >> * 1_ .O "ZL *-• TO QJ
S o 0°-. «- o ■S-* Ü o &"> «2 3 —■ (A O) l-"~ *< Ü *> a> •* tC-5 T o <?>
01 « j= ^> -c ec ^ u *-» O 4> .
•5? ,^ t--ü CD ^■N i? ü oT—> £ a -c
CO > •— CO —, u *> o t ai a: Q. JZ o > 3 O _• ^-o-g
3 __.
a. a
CO CO o
— X « ,'u «
2 "P S D _ o CM ca S2 N^ ai *■* va of £ > o
O J 8 O» H- «- "D J; u) J: O o *N c ^ o o •-
»CM co g t- D >« L. CO 5 Oil - m c» L3« O CMO)«-«lv'L. «~-
C 0> .. 3 O > "•MO O
01
o> 6 o i_
— a> t. •- ^ _. _
- .- o £ ai
£ x "*• O •— ^
a) O o O in +
o <o o o ^ in in in o o c c •" •~ vj- CM *~ in CM CM CM ** n o t»- in CM o CM n in fv. in o o CM to CM ^ i^ >* tu o *"" v~ •— ■
m c 0)
O
(0 o a 01 c
t- o 3 — C 4J C <o .— o X «A — ~» Ö « <- Q. a <A oi ai N
N o •— CO
_. ■ co o ••- <A L. t- *■» Q CJ c- e c 0) « —
3 o0 C CA O
H- J3 C — »- 3 O «-«
01 O «rt M- Co ■K C 4J O B 3 o« »• O - «0 VK t N «4- —' LU a en o »- «. <o 3 3 0> c C — L. ♦> «
o — 3 .— «J o ej 4J eg £ K P •*• I— o C H- O CD C t- ii L a -> ti c/i
—• 3 « o a a. co _J > <
x C — £ c > oo O • IIX Bl OCO c- x in ~T co u o &o> CM <2 —• *> «-
oi "D i c 01 « « CO' JD. • -vi01"- <ijev'"io
—• O) <•- ■" ^ 4< •— »e oi o „ o «-•
■ o o 01 £ L. co o> CA CO _I 01 ♦* o ■
I v^ O) «.- O c a» in ca i? in o f NO <»- L. 0J (U v *■* H- a> c o> H- u
H- O > 3 c o O E o c a <A co x O 3 « L. 01 ^ L a L I c OI
e at c n v L 3 a>L.oo**-4->o>a. ^OlCD— _ i. > c <o>"*-*jggco-^ W CO t- CD ° Q. a 3 N •- oi ■ z 3 i «9 — £ t-
_< co ot -^ «<JC»-utlJ<0 *-» J^ •— 4-» *•" t_ CO 4J C CD CO "*■ 3 « O -
» Ü.» o h • 3 "»-o 0)3O>'*Jl- >t-o
^2 K O
** 3
p. **
ax
01 ♦-» o
KlXK S- in •—
£ £- o> M o
NO in R to O CM
CN
CO
c 2
o >o IO w to
> «- in 1 o ■ I CM »- O CM t~
00
7 o
CO 4J
+
O <* to «- m CM CM «-
O co
co .£ o O) 0) *■> a U 09 > o Ü ■o c a _i "5 CO D ■o c co -i TJ C a co a. o
o ■<cT
(0 CD Ü C
JfO CD
00 CO 3
to «- in i i i
O O CM
t^ CM
^* CO CO 01 cu ^* 3 ^x 3 01 —' 01
— U <0 O a a > co > «♦- »f-
t- u C- t- 3 o> 3 0) CO 3 (0 2 o
01 o c — c
CM ■ o CM <-•
c CO 01
it CO
o to «- m
o IO CM «-
o *- o CM
T CM CM O
CM
+ o
Q. CO O £ a.
01 u
CO a u 01 c
H- L. "5. >•
c- o 3 — CMC
3 10
H CO •»- o <t- 3 X CO — ai o co so« t- Q. CO
J* c • co CO 3 oi CM o> a) N 4-" a:
_N a — CO • ■ Q. Dl ■■ 4J CO 3 01 C CD (0 -^ . co o i o ••- «*-
.O •— CO t- 1— •»-, co jr •*- 3 P Q 01 C H- Ü o
CO <- 6 C g co L. a c
H Z 01 <-> — —< 3 01 3 ** u- < X a. «i _i at
a u
S« CO *« 3 O CO
O CO 00 CO
gram
rsona
as th
oo co ■ ID 1 %■* o ^
in in \0 H- M-
y o) M- O o o o c c
3 0) 3
Bay
BPO,
e sa
0) c DI L. O) a a ai L. 0) 1- u 0) o
peake
ace, C
be th
0» CO > CO > «•- CD H- CO L. C
3 I 10
■ 3 CO
01
|22 0» c Ji c £t •<- CO ••- CO ■*-»
*» tn ex co "it a. <o 3 CO
es: From
From
Assu
m 3 o o
»* "" x -. in X o se -o •* in CM
S ■ ' ' i i i i
CO CO
3 Z
a a JO O
3 Application of Nutrient Balances and Model Refinements to the Shenandoah River Watershed
Overview of Model Refinements
The model testing and refinement focussed on the evaluation of the new forest simulation procedures and AGCHEM application to the non-cropland segments, but also included other enhancements to the modeling that were included as part of the refinements under Phase IV of the CBP Watershed Model effort. The Phase III model refinement effort, discussed and reported by Donigian et al (1995) for three selected test basins, included the following changes from the earlier Phase II work (Donigian et al, 1994):
a. Land use was updated by CBPO to 1990 conditions (Neumiller at al. 1994).
b. Selected model segments were re-defined for finer spatial detail.
c. Precipitation and meteorologic data was reviewed and extended through 1991.
d. Point sources, diversion, and atmospheric deposition files were extended through 1991.
e. The yield-based plant uptake function was used in AGCHEM.
f. Enhanced SPECIAL ACTIONS capabilities were used to reduce the length of the model input and improve representation of chemical application practices.
g. Atmospheric deposition was included as timeseries directly input to chemical storages for the AGCHEM segments, taking advantage of additional HSPF Version No. 11 capabilities.
h. Benthic oxygen demand and benthic algae processes were activated within HSPF in order to improve the low DO and inorganic nutrient simulation.
As part of this study, in coordination with the Phase IV efforts of the CBPO staff, the following additional changes and model refinements were implemented:
14 Chapter 3 Application to the Shenandoah River Watershed
a. Forest nitrogen simulation capabilities (implemented within AGCHEM) in HSPF Version No. 11 (Bicknell et al., 1996a) were used for the forest segment.. The forest phosphorous simulation is the same as in Phase III, i.e. the PQUAL module of HSPF is used for phosphorous loadings.
b. AGCHEM is used for both N and P simulations for pasture, in addition to the cropland and hay segments.
c. Atmospheric deposition was added for all segments, including urban impervious.
d. Septic system loads of N were estimated and input as a point load for each stream reach segment, as recommended by CBPO (L. Linker, personal communication, 1996).
e. Minor adjustments were made to the SPECIAL ACTIONS operations to improve the representation of the nutrient applications to croplands, hay, and pasture.
f. Manure nutrient applications in Phase II/III were reviewed by CBPO based on a manure mass balance analysis; application rates were revised and values for pasture were developed (M. Palace, personal communication, 1996).
g. Water quality calibration included a greater focus on the impact of benthic algae processes on inorganic nutrient concentrations, in addition to review and assessment of all water quality constituents.
The Watershed Model re-calibration and refinement effort for the Shenandoah segments involved:
a. Review, calibration, and evaluation of the simulations for the new AGCHEM applications to the forest and pasture segments, and a check of the cropland simulations, based on the expected nutrient balances developed in this study
b. Review and comparison of nonpoint source, point source, atmospheric deposition, and septic loadings from all land use categories
c. Calibration of selected instream water quality parameters based on comparison of simulated and observed concentrations
These tasks and simulation results are discussed below under the 'Nonpoint Source and Loading Assessment' and 'Water Quality Calibration Results' sections, following a brief discussion of the 'Hydrology Simulation' results. This chapter concludes with our 'Conclusions and Recommendations' derived from the results of these efforts and our interactions with the CBPO staff in their application of the Phase IV refinements to the entire Chesapeake Bay Watershed.
Hydrology Simulation
The hydrology simulation for this study on the Shenandoah Basin is essentially the same as was reported by Donigian et al., (1995) for the prior study, with the following exceptions:
Chapter 3 Application to the Shenandoah River Watershed 1 5
a. The CBPO staff reviewed the precipitation data for the entire Chesapeake Bay Watershed Model and updated selected datasets based on an analysis of spatial variation and changes with elevation for major storm events (Neumiller et al., 1994). Except for a few storm events, these adjustments did not have a major impact on the hydrology simulation.
b. As part of the forest nitrogen enhancements to HSPF (Bicknell et al., 1996c), model testing was performed on completely forested sites resulting in a refinement of the hydrology parameters for the forest segments. These refinements only affected the distribution between surface and subsurface flow, with no significant impact on total annual flow volumes (Donigian and Chinnaswamy, 1996). The new parameters produced less surface runoff and more interflow than previously simulated, providing a better representation of the hydrologic regime for forested watersheds.
c. In this study, we reviewed the hydrology simulation at two sites within the Shenandoah Basin: the Basin outlet at Millville, WV, and the South Fork Shenandoah River at Front Royal, VA. In addition to the Shenandoah River at Millville, which has been the calibration station for the previous modeling efforts, we output model results for the Reach 190 which corresponds to the Front Royal station. No calibration was needed, as shown by the results below, as the model parameters used for the entire Basin were appropriate for the upper model segment.
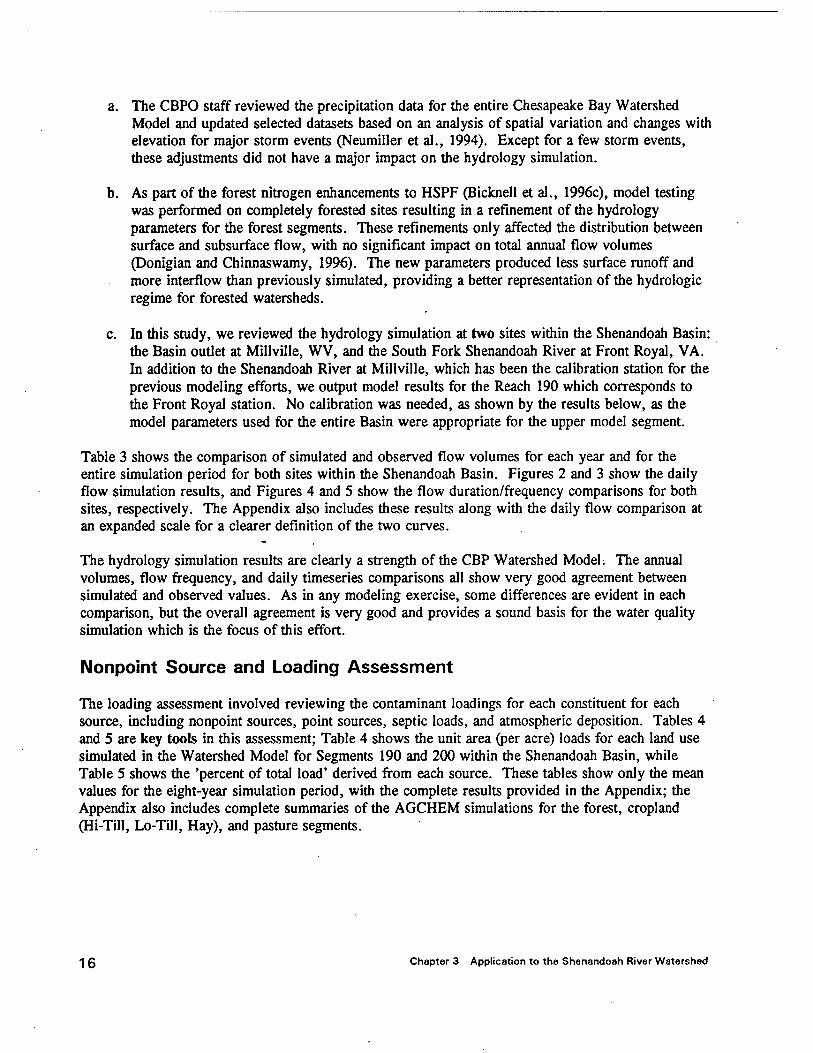
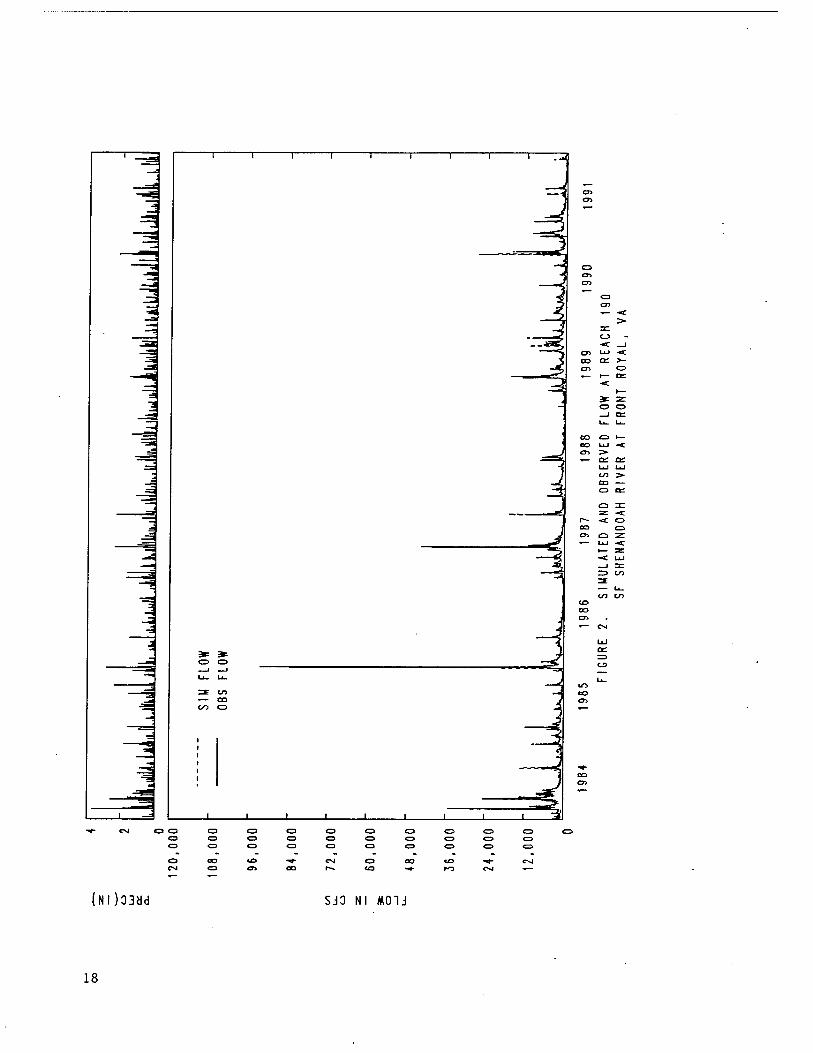
Table 3 shows the comparison of simulated and observed flow volumes for each year and for the entire simulation period for both sites within the Shenandoah Basin. Figures 2 and 3 show the daily flow simulation results, and Figures 4 and 5 show the flow duration/frequency comparisons for both sites, respectively. The Appendix also includes these results along with the daily flow comparison at an expanded scale for a clearer definition of the two curves.
The hydrology simulation results are clearly a strength of the CBP Watershed Model. The annual volumes, flow frequency, and daily timeseries comparisons all show very good agreement between simulated and observed values. As in any modeling exercise, some differences are evident in each comparison, but the overall agreement is very good and provides a sound basis for the water quality simulation which is the focus of this effort.
Nonpoint Source and Loading Assessment
The loading assessment involved reviewing the contaminant loadings for each constituent for each source, including nonpoint sources, point sources, septic loads, and atmospheric deposition. Tables 4 and 5 are key tools in this assessment; Table 4 shows the unit area (per acre) loads for each land use simulated in the Watershed Model for Segments 190 and 200 within the Shenandoah Basin, while Table 5 shows the 'percent of total load' derived from each source. These tables show only the mean values for the eight-year simulation period, with the complete results provided in the Appendix; the Appendix also includes complete summaries of the AGCHEM simulations for the forest, cropland (Hi-Till, Lo-Till, Hay), and pasture segments.
1 5 Chapter 3 Application to the Shenandoah River Watershed
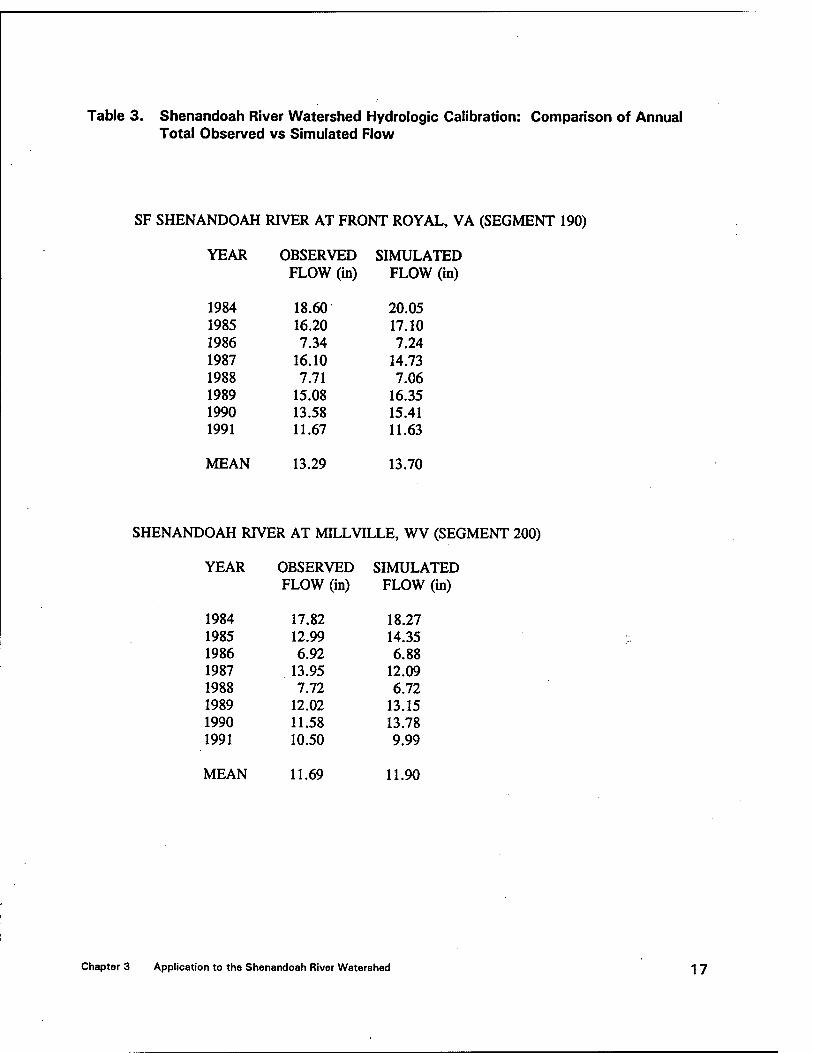
Table 3. Shenandoah River Watershed Hydrologie Calibration: Comparison of Annual Total Observed vs Simulated Flow
SF SHENANDOAH RIVER AT FRONT ROYAL, VA (SEGMENT 190)
YEAR OBSERVED SIMULATED FLOW (in) FLOW (in)
1984 18.60 20.05 1985 16.20 17.10 1986 7.34 7.24 1987 16.10 14.73 1988 7.71 7.06 1989 15.08 16.35 1990 13.58 15.41 1991 11.67 11.63
MEAN 13.29 13.70
SHENANDOAH RIVER AT MILLVILLE, WV (SEGMENT 200)
YEAR OBSERVED SIMULATED FLOW (in) FLOW (in)
1984 17.82 18.27 1985 12.99 14.35 1986 6.92 6.88 1987 13.95 12.09 1988 7.72 6.72 1989 12.02 13.15 1990 11.58 13.78 1991 10.50 9.99
MEAN 11.69 11.90
Chapter 3 Application to the Shenandoah River Watershed 1 7
-3 d CO CO
CO CO
00
O C3
00 o 05
csl ca ao i— <o -#-
to
(NI)33dd SJO Nl MOId
18
(NI>03dd SJO Nl M01J
19
111 I I I—1 1 111 I I I I—I- ll I I I 11 i i i i—i—r*
3 Q> E «
ao <J1
CD * o OQ O Od
(J u_
O t— -K:
3t O Q£
CO LU — >■
CD >- DC:
XJ-1..I—I 1 1 ... 1 I I I I 1. -L. -J 1 ■ ll 1 I i 1 t I 1
CD o
UJ
3:
UJ
o DT CO
03 Q£ U_ U_ CO
LJ
SJD Nl M01J
20
■mn—1—1—I 1 1 I I I I i—i—I 1 1 I I I I I—I—I 1 1 I I I I I—I—I r
• ■ ' ■
en
en
o en
CD o CM
* — C3 >
O i. i
I r i i i—t—i i i
en az >- UJ _i > -«: — ■<
>- ■<
<J> O
0 S car a= 01 UJ UJ
a: C3
SJO Nl iOU
21
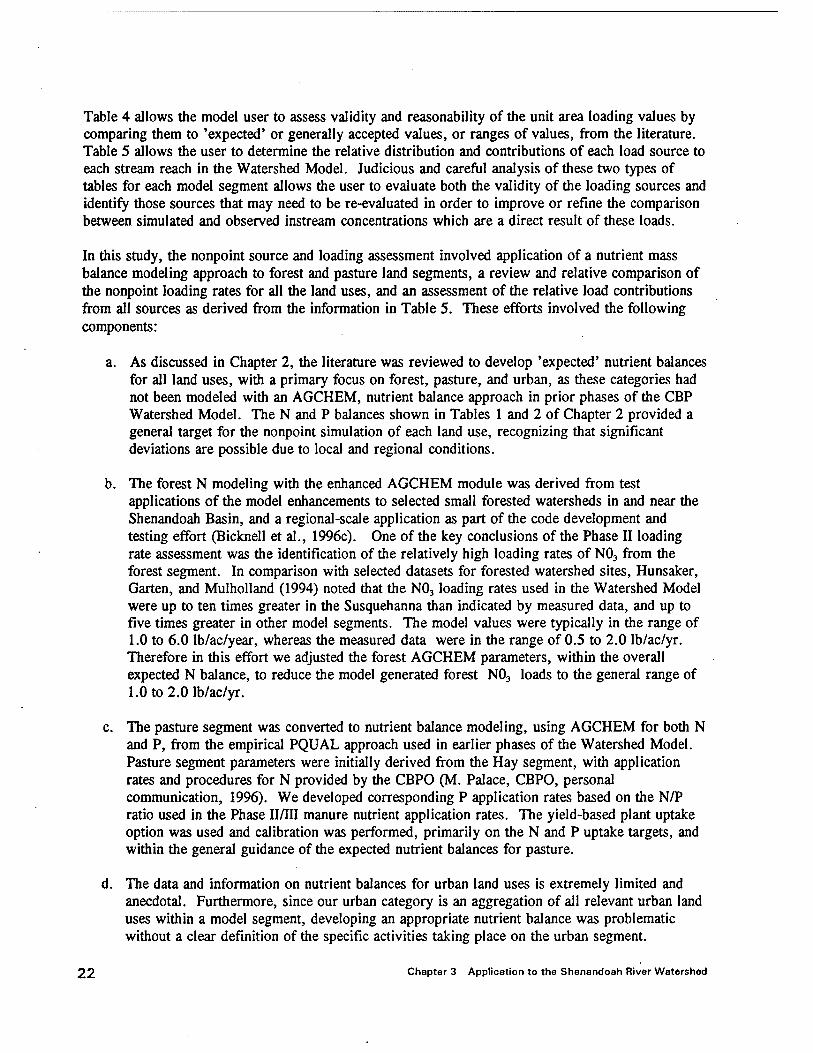
Table 4 allows the model user to assess validity and reasonability of the unit area loading values by comparing them to 'expected' or generally accepted values, or ranges of values, from the literature. Table 5 allows the user to determine the relative distribution and contributions of each load source to each stream reach in the Watershed Model. Judicious and careful analysis of these two types of tables for each model segment allows the user to evaluate both the validity of the loading sources and identify those sources that may need to be re-evaluated in order to improve or refine the comparison between simulated and observed instream concentrations which are a direct result of these loads.
In this study, the nonpoint source and loading assessment involved application of a nutrient mass balance modeling approach to forest and pasture land segments, a review and relative comparison of the nonpoint loading rates for all the land uses, and an assessment of the relative load contributions from all sources as derived from the information in Table 5. These efforts involved the following components:
a. As discussed in Chapter 2, the literature was reviewed to develop 'expected' nutrient balances for all land uses, with a primary focus on forest, pasture, and urban, as these categories had not been modeled with an AGCHEM, nutrient balance approach in prior phases of the CBP Watershed Model. The N and P balances shown in Tables 1 and 2 of Chapter 2 provided a general target for the nonpoint simulation of each land use, recognizing that significant deviations are possible due to local and regional conditions.
b. The forest N modeling with the enhanced AGCHEM module was derived from test applications of the model enhancements to selected small forested watersheds in and near the Shenandoah Basin, and a regional-scale application as part of the code development and testing effort (Bicknell et al., 1996c). One of the key conclusions of the Phase II loading rate assessment was the identification of the relatively high loading rates of N03 from the forest segment. In comparison with selected datasets for forested watershed sites, Hunsaker, Garten, and Mulholland (1994) noted that the N03 loading rates used in the Watershed Model were up to ten times greater in the Susquehanna than indicated by measured data, and up to five times greater in other model segments. The model values were typically in the range of 1.0 to 6.0 lb/ac/year, whereas the measured data were in the range of 0.5 to 2.0 lb/ac/yr. Therefore in this effort we adjusted the forest AGCHEM parameters, within the overall expected N balance, to reduce the model generated forest N03 loads to the general range of 1.0 to 2.0 lb/ac/yr.
c. The pasture segment was converted to nutrient balance modeling, using AGCHEM for both N and P, from the empirical PQUAL approach used in earlier phases of the Watershed Model. Pasture segment parameters were initially derived from the Hay segment, with application rates and procedures for N provided by the CBPO (M. Palace, CBPO, personal communication, 1996). We developed corresponding P application rates based on the N/P ratio used in the Phase II/III manure nutrient application rates. The yield-based plant uptake option was used and calibration was performed, primarily on the N and P uptake targets, and within the general guidance of the expected nutrient balances for pasture.
d. The data and information on nutrient balances for urban land uses is extremely limited and anecdotal. Furthermore, since our urban category is an aggregation of all relevant urban land uses within a model segment, developing an appropriate nutrient balance was problematic without a clear definition of the specific activities taking place on the urban segment.
22 Chapter 3 Application to the Shenandoah River Watershed
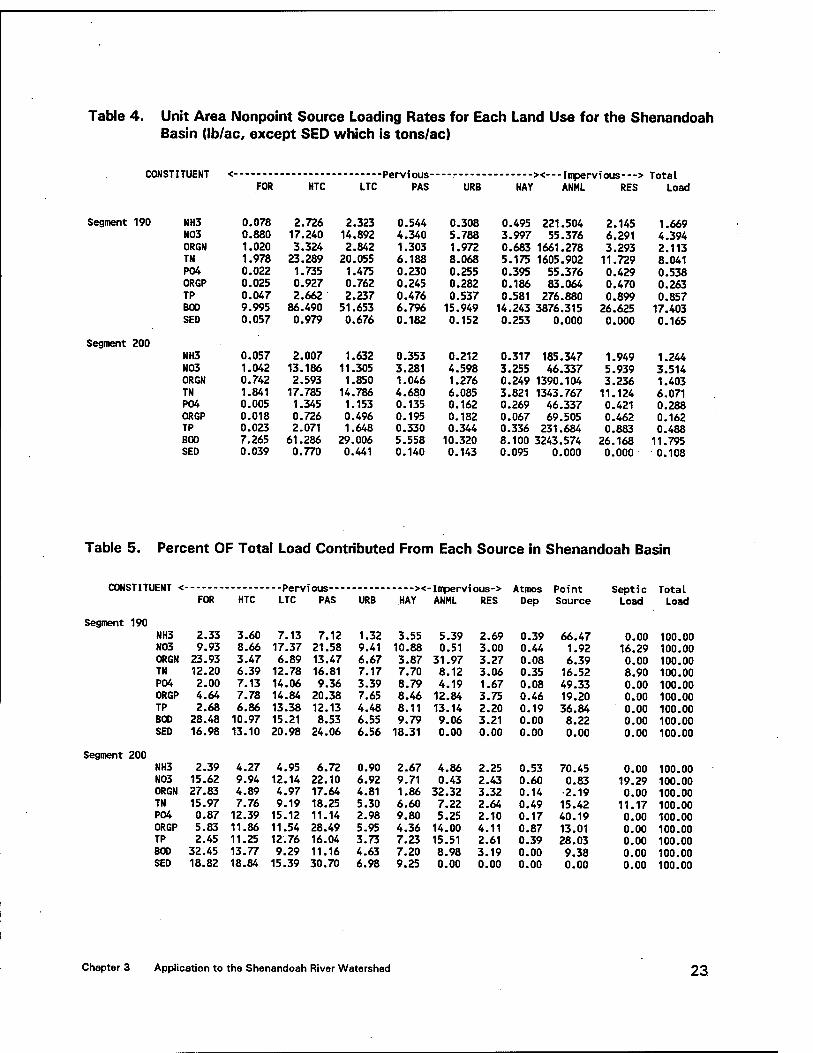
Table 4. Unit Area Nonpoint Source Loading Rates for Each Land Use for the Shenandoah Basin (Ib/ac, except SED which is tons/ac)
CONSTITUENT Total FOR HTC LTC PAS URB HAY ANML RES Load
Segment 190 NH3 0.078 2.726 2.323 0.544 0.308 0.495 221.504 2.145 1.669 N03 0.880 17.240 14.892 4.340 5.788 3.997 55.376 6.291 4.394 ORGN 1.020 3.324 2.842 1.303 1.972 0.683 1661.278 3.293 2.113 TN 1.978 23.289 20.055 6.188 8.068 5.175 1605.902 11.729 8.041 P04 0.022 1.735 1.475 0.230 0.255 0.395 55.376 0.429 0.538 ORGP 0.025 0.927 0.762 0.245 0.282 0.186 83.064 0.470 0.263 TP 0.047 2.662 2.237 0.476 0.537 0.581 276.880 0.899 0.857 BOD 9.995 86.490 51.653 6.796 15.949 14.243 3876.315 26.625 17.403 SED 0.057 0.979 0.676 0.182 0.152 0.253 0.000 0.000 0.165
Segment 200 NH3 0.057 2.007 1.632 0.353 0.212 0.317 185.347 1.949 1.244 N03 1.042 13.186 11.305 3.281 4.598 3.255 46.337 5.939 3.514 ORGN 0.742 2.593 1.850 1.046 1.276 0.249 1390.104 3.236 1.403 TN 1.841 17.785 14.786 4.680 6.085 3.821 1343.767 11.124 6.071 P04 0.005 1.345 1.153 0.135 0.162 0.269 46.337 0.421 0.288 ORGP 0.018 0.726 0.496 0.195 0.182 0.067 69.505 0.462 0.162 TP 0.023 2.071 1.648 0.330 0.344 0.336 231.684 0.883 0.488 BOD 7.265 61.286 29.006 5.558 10.320 8.100 3243.574 26.168 11.795 SED 0.039 0.770 0.441 0.140 0.143 0.095 0.000 0.000 0.108
Table 5. Percent OF Total Load Contributed From Each Source in Shenandoah Basin
CONSTITUENT < -Impervious-> Atmos Point Septic Total FOR HTC LTC PAS URB HAY ANML RES Dep Source Load Load
Segment 190 NH3 2.33 3.60 7.13 7.12 1.32 3.55 5.39 2.69 0.39 66.47 0.00 100.00 N03 9.93 8.66 17.37 21.58 9.41 10.88 0.51 3.00 0.44 1.92 16.29 100.00 ORGN 23.93 3.47 6.89 13.47 6.67 3.87 31.97 3.27 0.08 6.39 0.00 100.00 TN 12.20 6.39 12.78 16.81 7.17 7.70 8.12 3.06 0.35 16.52 8.90 100.00 P04 2.00 7.13 14.06 9.36 3.39 8.79 4.19 1.67 0.08 49.33 0.00 100.00 ORGP 4.64 7.78 14.84 20.38 7.65 8.46 12.84 3.75 0.46 19.20 0.00 100.00 TP 2.68 6.86 13.38 12.13 4.48 8.11 13.14 2.20 0.19 36.84 0.00 100.00 BOD 28.48 10.97 15.21 8.53 6.55 9.79 9.06 3.21 0.00 8.22 0.00 100.00 SED 16.98 13.10 20.98 24.06 6.56 18.31 0.00 0.00 0.00 0.00 0.00 100.00
Segment 200 NH3 2.39 4.27 4.95 6.72 0.90 2.67 4.86 2.25 0.53 70.45 0.00 100.00 N03 15.62 9.94 12.14 22.10 6.92 9.71 0.43 2.43 0.60 0.83 19.29 100.00 ORGN 27.83 4.89 4.97 17.64 4.81 1.86 32.32 3.32 0.14 2.19 0.00 100.00 TN 15.97 7.76 9.19 18.25 5.30 6.60 7.22 2.64 0.49 15.42 11.17 100.00 P04 0.87 12.39 15.12 11.14 2.98 9.80 5.25 2.10 0.17 40.19 0.00 100.00 ORGP 5.83 11.86 11.54 28.49 5.95 4.36 14.00 4.11 0.87 13.01 0.00 100.00 TP 2.45 11.25 12.76 16.04 3.73 7.23 15.51 2.61 0.39 28.03 0.00 100.00 BOD 32.45 13.77 9.29 11.16 4.63 7.20 8.98 3.19 0.00 9.38 0.00 100.00 SED 18.82 18.84 15.39 30.70 6.98 9.25 0.00 0.00 0.00 0.00 0.00 100.00
Chapter 3 Application to the Shenandoah River Watershed 23
Consequently, we retained the PQUAL approach used in the previous CBP Watershed Model efforts. Atmospheric deposition of N was added to the impervious urban segment, and the parameters were adjusted to avoid double-counting of the atmospheric components in the surface runoff. An analogous approach could not be implemented for the urban pervious segment because a 'potency factor' approach is used for the surface runoff loading simulation, which does not follow a nutrient balance approach (see Conclusions and Recommendations).
e. Estimates of annual loadings of N from septic systems were developed by CBPO staff (L. Linker, personal communication, 1996), based on an assessment performed by Maizel et al. (1995) using GIS-based procedures as applied to the entire Chesapeake Bay drainage. The estimated annual loads for the Shenandoah, corresponding to 10.02 lb N/ac/yr for segment 190 and 12.83 lb N/ac/yr for segment 200, were input as N03-N as a constant daily value for each acre of pervious urban land within each model segment.
Review and analysis of the information in Table 4, as compared to the values from the earlier study (Donigian et al., 1995) indicate the following:
a. The forest TN and TP loadings are not significantly different, primarily because the earlier study had already reduced the forest TN loadings to the expected range of 1.0 to 2.0 lbs N/ac/year. However, the AGCHEM simulation for forests in this study does produce a somewhat different distribution, with lower N03-N and higher Organic N loadings. The NH3- N loadings are slightly higher with the AGCHEM simulation, and the phosphorous simulation is essentially unchanged.
The BOD loads from forest have increased significantly because they are now calculated from the labile organic N loading produced by the enhanced AGCHEM module.
b. The cropland loadings from Hi-Till, Lo-Till, and Hay have been reduced due to changes in the dates and methods of application and incorporation of nutrients through the SPECIAL ACTIONS capability. These changes helped to reduce some of the extreme N03-N, NH3-N, and P04-P concentration peaks from fertilizer and manure applications, and thus reduced the overall loadings of these forms.
c. From the pasture segment, the nutrient simulation with AGCHEM and manure applications tended to increase P loads and either decrease or not change TN loads for the Shenandoah segments. For the N forms, N03-N was reduced while both NH3-N and Organic N increased. While the relative changes for NH3-N, P04-P, and Organic P were significant, the absolute loadings were still relatively small, in the range of 0.2 to 0.5 lb/ac/yr.
d. Loadings from the Urban Pervious land segment did not change significantly, but the Urban Impervious segment loadings did increase due to addition of the Atmospheric Deposition inputs of all the N forms. TN loadings increased by factors in the range of 1.5 to 2.0.
The distribution of sources of each constituent shown in Table 5 is not greatly different from the distribution produced in the earlier study. Most of the numbers are either the same or have changed by at most a few percentage points, which would not have a major impact on an evaluation of the relative contributions of the different sources. However, a few numbers have changed reflecting the
04 Chapter 3 Application to the Shenandoah River Watershed
loading rate changes noted above and the additional sources considered. Some of these differences are as follows:
a. The forest segments now represent a larger relative source of N03-N and a smaller source of Organic N, with very little change in the TN percentage contribution.
b. The forest segment also contributes much more BOD, due to the higher calculated loading rate, with a corresponding reduction in the contribution from other sources such as Hay, point sources, croplands, animal acres, etc.
c. The pasture segment is now a larger contributor of P loads due to the higher loading rates with the AGCHEM simulation, resulting in a reduction in the relative contribution of the hay segment.
d. The addition of the septic load of N03-N shows that it contributes almost 20% of the load in the Shenandoah. With this additional load and the reduced forest N03-N load, the relative contributions from other sources have decreased.
In spite of these differences, the key conclusions regarding source contributions from the earlier studies remain unchanged. Point sources remain a dominant source of the total NH3-N load and represent almost half of the total P04-P load in the Shenandoah. In terms of TN and TP, point sources represent about 1/4 and 1/3, respectively, of the total loads, with the remaining 3/4 and 2/3 derived primarily from nonpoint sources and septic loads. Total agricultural contributions amount to about 50% of the TN load and 58% of the TP load in the Shenandoah, while the urban contributions represent about 10% of the TN and 6% of the TP. Although additional investigation of the loading rates is recommended (see Conclusions and Recommendations below), the results provided with the nutrient balance approach are a clear improvement from earlier studies and provide a sound basis for evaluating nutrient management alternatives.
Water Quality Calibration Results
Following the nonpoint source and loading assessment, water quality calibration involved adjustment of selected instream parameters to improve the overall comparison between observed and simulated concentrations. As noted above, the simulation of benthic oxygen demand and benthic algae were activated in the earlier effort (Donigian et al., 1995) as part of the Phase III water quality calibration. These processes provided additional mechanisms to improve and better represent the instream simulation. The primary focus of the calibration was on maintaining reasonable levels of phytoplankton and benthic algae, since no observed data was available, and adjusting the related parameters so that the nutrients, both organic and inorganic, followed the observed variation with the revised loadings from this study. Review of the water quality parameters and the algal simulation by the CBPO indicated a few potential adjustments to the instream parameters (G. Shenk, personal communication, 1996), and refinements to the algal simulation to increase benthic algae concentrations and decrease the phytoplankton levels (L. Linker, personal communication, 1996). Through ongoing coordination with CBPO staff, these efforts provided input to our calibration work.
Figures 6 through 13 (end of this chapter) show the model results comparisons, in the form of eight-
chapter 3 Application to the Shenandoah River Watershed 25
year timeseries plots of daily simulated concentrations and the sporadic observed data, for sediment (TSS), nitrogen forms (N03, NH3, Organic N, and Total N4), and phosphorous forms (P04, Organic P, and Total P) for the Shenandoah River at Millville, WV (model segment 200). The complete results of all simulated constituents for the Millville site and for the Shenandoah River at Front Royal, VA (model segment 190) are included in the Appendix. The extent and volume of the results precludes duplication as part of this discussion, so the reader should refer to the results in the Appendix to better comprehend the results discussion below.
The water quality results from this effort are not greatly different from those produced in the earlier study, in spite of all the changes implemented, including more extensive application of AGCHEM, addition of septic loads, refinement of loading rates, and additional calibration. However, this simply indicates that the prior calibration was a good representation of the observed data, and that the changes implemented to better define the load sources were incorporated while maintaining the accuracy of the overall simulation. The real benefits of the current refinement phase of the CBP Watershed Model are realized from the extension of the nutrient balance approach to all major land use (except urban in our simulations), and the utility of this approach for nutrient management.
Below we discuss some of the areas where the current results differ from those presented earlier in Donigian et al (1995), and identify some problems that still remain for selected constituents, where further 'fine tuning' of the calibration is recommended. The specific conclusions and model results discussed by Donigian et al (1995) will not be repeated here, but they are still relevant for many of the water quality constituents whose simulation did not change significantly. Some of the key differences in the simulation results and issues identified in this work are as follows:
a. The earlier sediment calibration was generally high with simulated concentrations higher than the sporadic observed values; thus we attempted to reduce the concentrations through limited reductions in the sediment loading rates. As shown in Figure 6, this effort was not entirely successful as the peaks are still higher than all of the observed values except for the storm of November 1985 whose flow was undersimulated. Further reductions in the loading rates does not appear to be realistic. We feel that additional improvement will require finer segmentation of the model to include shorter, more representative stream segments to better represent localized scour and deposition processes. Currently, the U.S. Geological Survey under EPA funding is developing a finer segmentation of the Potomac basin with about an order-of-magnitude increase in the number of land and stream segments (A. Lumb, personal communication, 1996). Although limited to the hydrologic and flow simulation, this more detailed Potomac model should also provide a more realistic basis for sediment and water quality simulation.
b. The N03-N simulation shown in Figure 7 is acceptable but not as seasonally correct as the earlier results reported by Donigian et al (1995). We suspect that the differences primarily in late summer, fall, and winter for selected years are due mostly to the newly-added septic loads and possibly inaccuracies in the seasonal loadings from the forest and pasture segments, i.e. the added AGCHEM segments. The dotted line in Figure 7 ( and in Figure 10 for Total N) shows the simulation without the N03-N load from septic systems appears to be improved in about five of the eight years simulated. As opposed to being a constant load, the septic load should probably be 'hydrologically' driven by baseflow so that the loading to the stream will depend on the flow regime.
26 Chapter 3 Application to the Shenandoah River Watershed
Both the NO3-N and Total N simulations include occasional peaks that are well above the observed data. This is typical of most of the nutrient simulation results, and may also be due to the relatively large model segments and long stream reaches used in the Watershed Model. However, the observed data is relatively infrequent (about every two months) and one sample point exceeding 9.0 mg/1 N03-N in the summer of 1986 indicates that much higher concentrations are possible. Adjustments in the timing and placement of nutrient applications have helped to lower some peaks, but further investigation and finer segmentation should be investigated.
Both the NH3-N and P04-P simulations (Figures 8 and 11) have improved with reduced contributions from cropland (along with the reduced sediment loads), reduced peaks due to the nutrient application adjustments, and increased algal uptake due to higher benthic algae levels than in the previous efforts. Both of these constituents are highly sensitive to the algal simulation (phytoplankton and benthic algae), for which no data was available for any of the test model segments. In spite of the refinements made in this effort, algal data remains as a major data need at this time; additional instream benthic and algal data would help to assess the validity of the phytoplankton (and benthic algae) simulation and its impact on the inorganic nutrient concentrations.
While the NH3-N peaks remain higher than most of the observations, the P04-P peaks are much closer than in previous efforts. However, base concentrations appear to be too low and could probably be improved with additional calibration. Both of these constituents would benefit by a finer model segmentation since they are impacted by the accuracy of the sediment simulation.
As noted earlier, for the Shenandoah the greatest fraction of the total loads for both NH3 and P04 are derived from point sources. Thus, although the concentration peaks in Figures 8 and 11 are likely due to nonpoint sources, the point sources are major contributors to the total load.
c. Simulation of both Organic N (Figure 9) and Organic P (Figure 12) has improved in this effort, and since Organic P is the major component of Total P (Figure 13) similar improvement is shown there. Except for the November 1985 storm, Organic N is generally well represented, although many of the peaks are still somewhat high. For Organic P, the concentrations are closer to observed than in the previous effort, but peak concentrations are also still high. The improvements result from reduced sediment loads (and associated organics), adjustments to the N/P ratios, changes to manure applications, and reductions in phytoplankton levels (which are included in the organic state variables).
With the detailed AGCHEM simulation of forests, the forest segment is now a major contributor of organic N, both labile and refractory in both dissolved and particulate forms, along with the animal acres segment. Also, for the forest segment, BOD and Organic P loads are calculated from the organic N components; thus BOD loads from forest are also a major component. As shown in Table 5, forests contribute about 25% of the Organic N load and 30% of the BOD load, while the animal acres segment contributes more than 30% of the Organic N to the stream. Both of these components need further investigation as there is little data to confirm this level of contribution.
Chapter 3 Application to the Shenandoah River Watershed 27
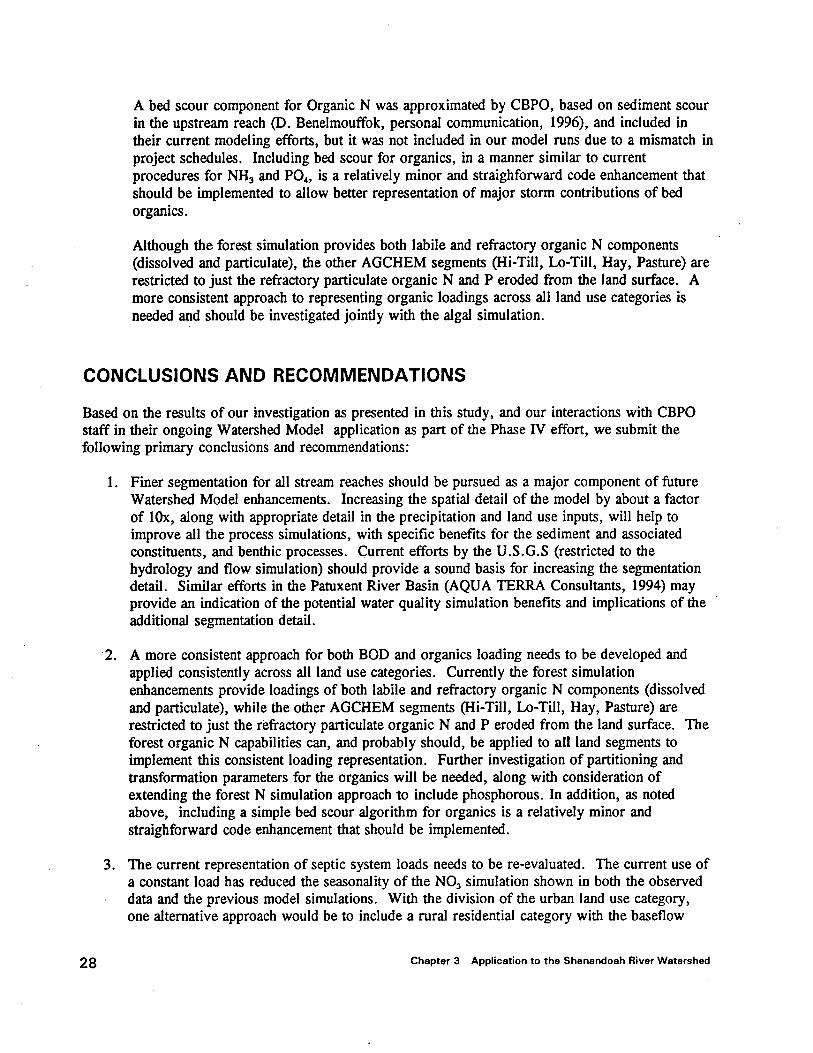
A bed scour component for Organic N was approximated by CBPO, based on sediment scour in the upstream reach (D. Benelmouffok, personal communication, 1996), and included in their current modeling efforts, but it was not included in our model runs due to a mismatch in project schedules. Including bed scour for organics, in a manner similar to current procedures for NH3 and P04, is a relatively minor and straighforward code enhancement that should be implemented to allow better representation of major storm contributions of bed organics.
Although the forest simulation provides both labile and refractory organic N components (dissolved and particulate), the other AGCHEM segments (Hi-Till, Lo-Till, Hay, Pasture) are restricted to just the refractory particulate organic N and P eroded from the land surface. A more consistent approach to representing organic loadings across all land use categories is needed and should be investigated jointly with the algal simulation.
CONCLUSIONS AND RECOMMENDATIONS
Based on the results of our investigation as presented in this study, and our interactions with CBPO staff in their ongoing Watershed Model application as part of the Phase IV effort, we submit the following primary conclusions and recommendations:
1. Finer segmentation for all stream reaches should be pursued as a major component of future Watershed Model enhancements. Increasing the spatial detail of the model by about a factor of lOx, along with appropriate detail in the precipitation and land use inputs, will help to improve all the process simulations, with specific benefits for the sediment and associated constituents, and benthic processes. Current efforts by the U.S.G.S (restricted to the hydrology and flow simulation) should provide a sound basis for increasing the segmentation detail. Similar efforts in the Patuxent River Basin (AQUA TERRA Consultants, 1994) may provide an indication of the potential water quality simulation benefits and implications of the additional segmentation detail.
2. A more consistent approach for both BOD and organics loading needs to be developed and applied consistently across all land use categories. Currently the forest simulation enhancements provide loadings of both labile and refractory organic N components (dissolved and particulate), while the other AGCHEM segments (Hi-Till, Lo-Till, Hay, Pasture) are restricted to just the refractory particulate organic N and P eroded from the land surface. The forest organic N capabilities can, and probably should, be applied to all land segments to implement this consistent loading representation. Further investigation of partitioning and transformation parameters for the organics will be needed, along with consideration of extending the forest N simulation approach to include phosphorous. In addition, as noted above, including a simple bed scour algorithm for organics is a relatively minor and straighforward code enhancement that should be implemented.
3. The current representation of septic system loads needs to be re-evaluated. The current use of a constant load has reduced the seasonality of the N03 simulation shown in both the observed data and the previous model simulations. With the division of the urban land use category, one alternative approach would be to include a rural residential category with the baseflow
28 Chapter 3 Application to the Shenandoah River Watershed
concentrations calibrated to match the annual loading rates estimated for the septic system loads. Whatever approach is selected it should allow the septic loadings to be 'hydrologically- driven' so that the seasonally of the hydrologic regime and loadings is represented.
4. The algal simulation, both phytoplankton and benthic algae, need more data, investigation, and evaluation. In this effort, the benthic algal levels were increased dramatically, by factors of 10 to 20, based on very limited data from widely scattered sites outside the Chesapeake Bay drainage. Phytoplankton levels showed an associated decrease from earlier modeling efforts due to competition for the available nutrients. It seems appropriate that benthic processes have a greater impact than represented in previous modeling efforts, but additional literature data should be identified and actual site-specific data within the Chesapeake Bay watersheds collected to confirm the general magnitude of both the benthic and phytoplankton levels represented in the model. The algal simulation has such a critical impact on inorganic nutrients levels that major improvements in their modeling will depend on establishing realistic levels for the algal populations.
5. The urban land use should be divided into separate urban categories — residential, commercial, industrial - each with pervious and impervious fractions, as a prelude for nutrient mass balance and AGCHEM-type model application. The CBPO has pursued an AGCHEM approach for the aggregated urban pervious segment in their current modeling efforts (L. Linker, personal communication, 1996); however, we feel this approach requires a better definition of specific urban activities in order to develop reasonable nutrient balances. With a division into separate urban categories, nutrient balances would be more representative.
6. The CBPO should explore the option of eliminating the current 'composite crop' representation in the model, developed as part of the Phase II enhancements in 1991, and move to simulating each major crop individually in each cropland category. With the widespread availability of Pentium processors running at up to 200 megahertz with gigabytes of disk storage, many of the run time restrictions that required this simplification have disappeared. Such an approach would allow more accurate representation of agricultural practices and the resulting nutrient balances.
7. In conjunction with representing each major crop, the nutrient application rates, timing, procedures, and composition distribution (both fertilizers and manure) should be closely reviewed and revised as needed. Experience with both the Watershed Model and the detailed Patuxent Model has confirmed the critical importance of the assumptions underlying the nutrient applications in the model. Issues such as double-cropping, application methods, inorganic/organic splits (e.g. P04/Org P splits for manure and sludge), etc. need to be investigated to improve the nutrient mass balances and simulations.
8. The forest N simulation approach should be extended to include the P cycle, so that both N and P mass balances can be implemented for all land segments. Just as the previous AGCHEM module provided a valid framework for the forest N enhancements, the P cycle processes currently in AGCHEM can be readily adapted for forested conditions. Field site testing on small forested watersheds would be needed to fully evaluate the code enhancements.
Chapter 3 Application to the Shenandoah River Watershed 29
o o
-i
d
a CD ÜJ UJ CO CO
3E CO CO
*
*
*
C3 o O o O C3 o CD O O oo IT3 CM CO CO
en CO
-^S
O C3 CM
eo o: CO
j: -
>i ~ *
—st
■<
CO CC OS t— CO ^c 1— UJ O z o <_3
CO oo CO oo 1— CO -w^
O — UJ >- CO 1
f^ 1 oo C=) —. CTi UJ 3 *— >-
Q£ t— UJ -« CO CD oc CD UJ
>■ ea __
to Z or DO -<: o> DC *— Q -C
UJ o h- Cl -c z 1 -*c ZD 2E 3 UJ — n-
ir> CO CO CO CX> ,—
to
oo CO
(SJO)MOIJ "I/OH Nl 0N00 1N3HIQ3S
30
n 1 1 r
~!
A
e=> -c o —' l_
* a. UJ CO
=c Ä 2=
!"-> IO 1 o o z z ^ 3 CO fO — CD o oo O z
*
*
-1 I I l_
r-~ <o m
o o
CO
"fr CO CO
CO
O
O >
C3»
■<
ce: UJ :>- 0£
■<
o (=1
.— —' ■<
CO
oo o*>
c=> in
(SJO)MOU 1/9H Nl DNOD N-CON
31
A
3 OO — co co o
*
C3 C3 '
O O co in in f—
CD
en O
id
CO CO en ■«r
»— z UJ CJ > z * o
oo O
1 w fO — a: >■
oo
to oo en
CO
C? UJ >■
CD — z a:
UJ O
IT) °° oo e*> uj
DO CD
(sja)Mou 1/3H Nl 0N00 N-CHN
32
c» OS
O
CO QJ CD ,
o <J
CO CO
C3
O _i
CO
to oo CO
1/5 CO
""" UJ
CC I—
en
CO o
C3 a •
O CO CD un
CO
CM
e<j oo
(SJO)ftOU l/OH Nl 3N00 N9N0
33
1 1 1 1 1 1 r
d
CZ>
^ * O- UJ CD
o
3 ts> — OD CO O
*
*
o a tn
C3
o CO
en
en ■<
cr> t— oo -«c
oo = CO CT> I — -<
r- ac »— oo UJ -«£ cy> CO *— m o;
C3 UJ >■
CD — Z ac -<
3; CD -<
CO UJ CO 09 I— Q
oo _
*~ UJ or
CD
OO o
(SJO)MOIJ 1/9W Nl ONOO N 1V101
34
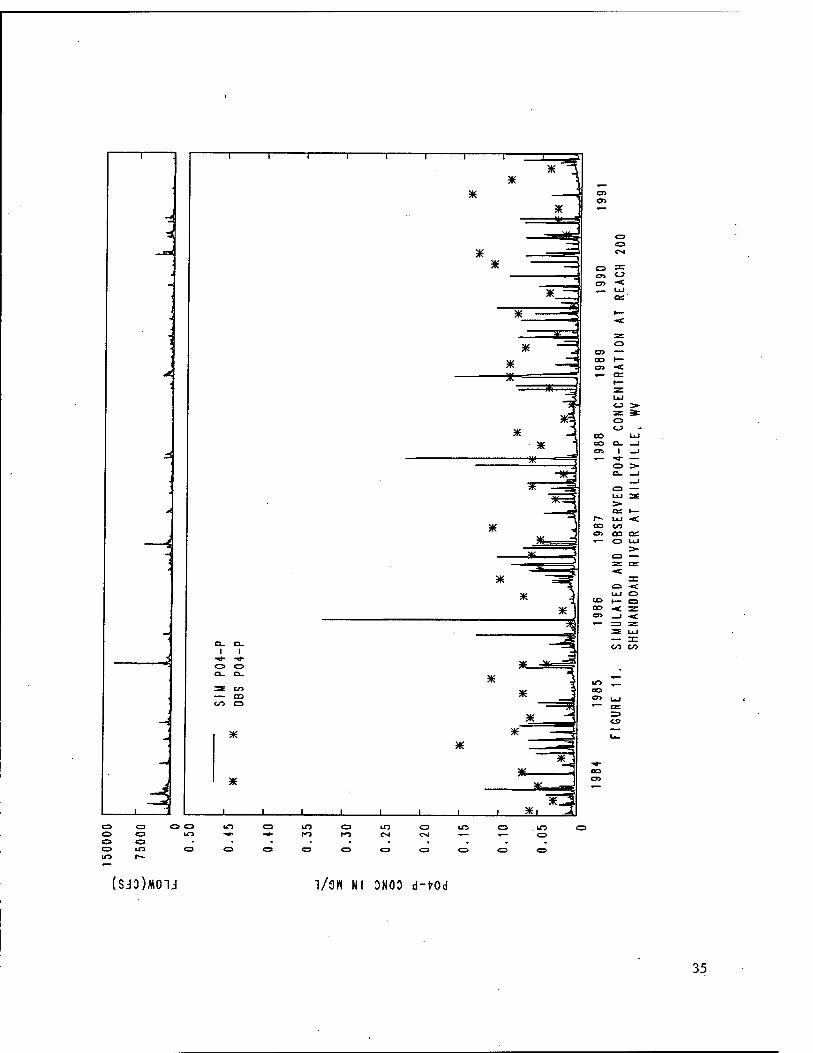
-i I
d O C3 O O c=> in
l l
3 to CD </> CD
SK
*
en o
o
*
*
*
*
* *
o
CO
en
CO CO en
>■
OS h— r— UJ <c oo <s> Cn aa Q£
*
*
*-
J *1
oo en
Uj o
—1 ■<:
DO Cn u
00 CO
O C-J
ir> es .10
(SJO)MOTJ 1/9H Nl 0N00 d-frOd
35
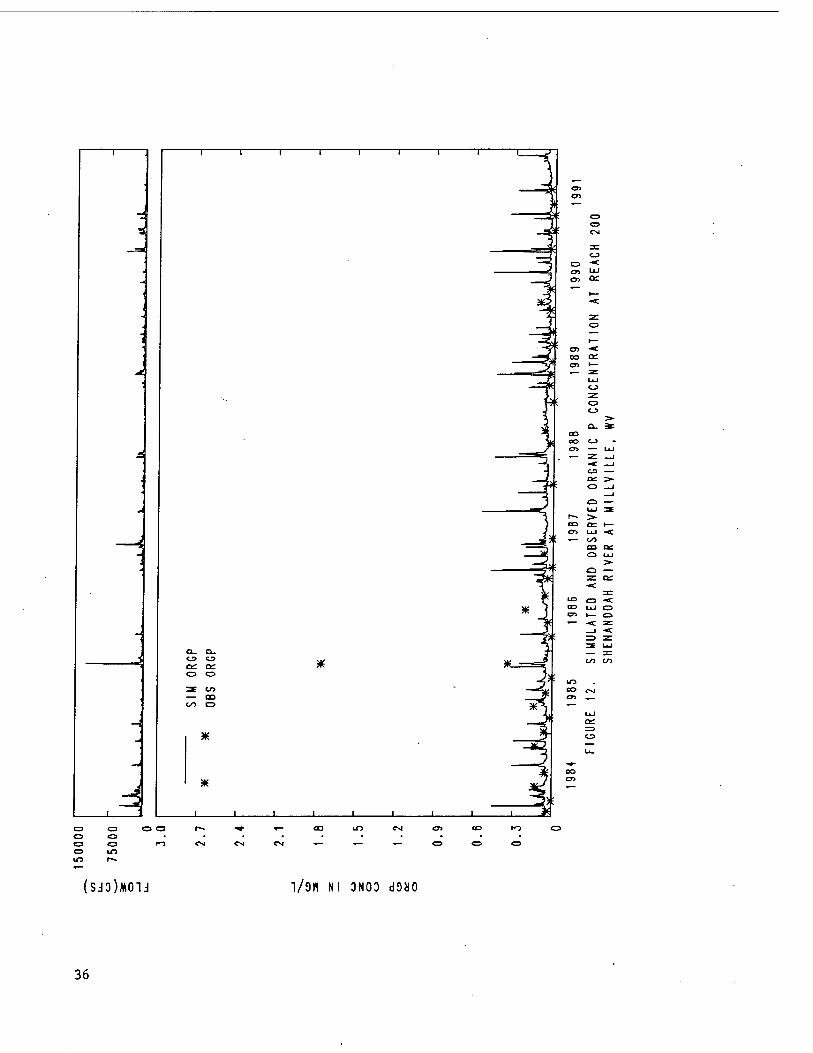
1
-J
ä
O- B. <J> cj> C£ oe O o
3E to CD CO o
*
*
ir> CM <n
a in
CM CM
(SJO)MOU I/O« Nl 3N0D dOHO
oo or i— a ui <
as ae O UJ
*_
to CD ■< CO UJ o CT> I— en
36
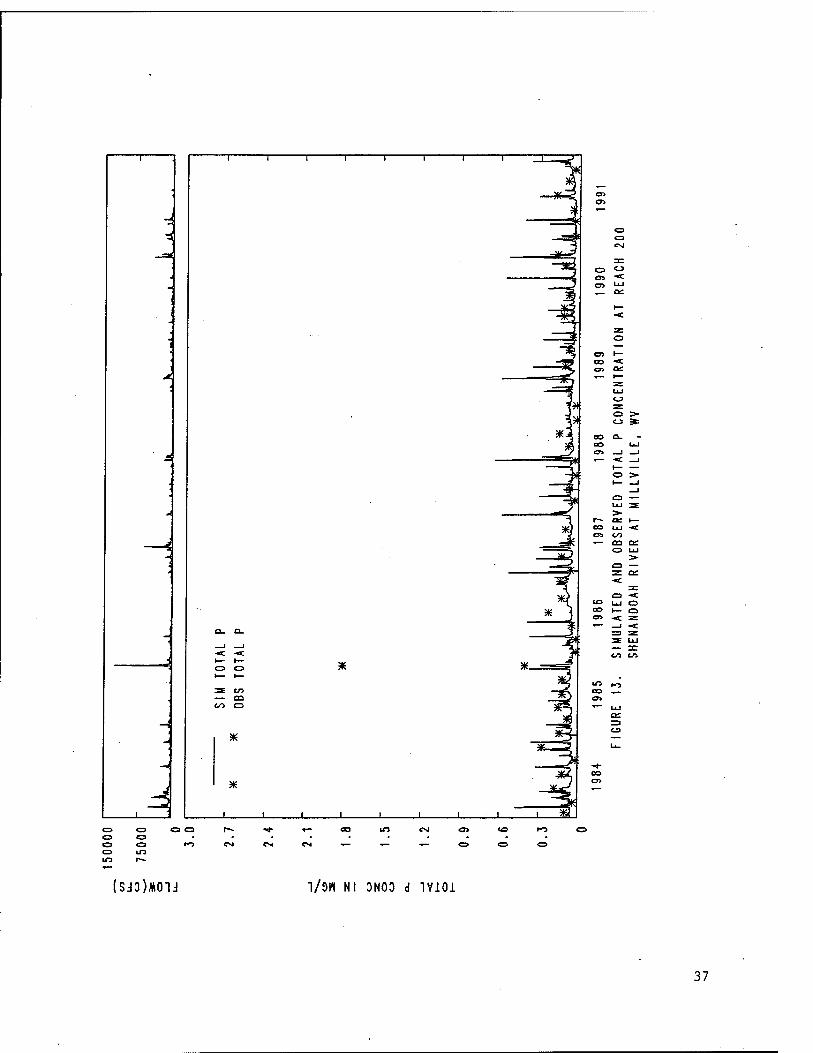
_, , , p
—i
d
-c -«c I— I—
:x en — OQ
*
*
J 1_
i-»
CM
*
iO es4
CM CM
to uj CD eo I— O en -«r ar
<o ro
o in ITS r—
!SJ3)*01J "l/OH Nl ONOO d 1V101
37
REFERENCES
AQUA TERRA Consultants. (1994). Patuxent River Basin Watershed Model. DRAFT REPORT. Prepared for U.S. Geological Survey, Reston, VA, and Maryland Department of the Environment, Baltimore, MD.
Bicknell, B.R., J.C. Imhoff, J.L. Kittle Jr., A.S. Donigian, Jr. and R.C. Johanson. (1993). Hydrological Simulation Program - FORTRAN. User's Manual for Release 10. EPA/600/R-93- 174. U.S. EPA Environmental Research Laboratory, Athens, GA.
Bicknell, B.R., J.C. Imhoff, J.L. Kittle Jr., A.S. Donigian, Jr. and R.C. Johanson. (1995). Hydrological Simulation Program - FORTRAN. User's Manual for Release 11. DRAFT. U.S. EPA Environmental Research Laboratory, Athens, GA.
Bicknell, B.R., T.H. Jobes, A.S. Donigian, Jr., C.T. Hunsaker, and T.O. Barnwell, Jr. (1996). Modeling Nitrogen Cycling and Export in Forested Systems at the Watershed Scale. In: WATERSHED '96 - Moving Ahead Together. Conference Proceedings, June 8-12, 1996. pp. 685-687.
Bicknell, B.R., A.S. Donigian, Jr., T.H. Jobes, and R.V. Chinnaswamy. (1996.) Modeling Nitrogen Cycling and Export in Forested Watersheds Using HSPF. (In Press). Prepared for U.S. Geological Survey, Hydrologie Analysis and Support Section, Washington, D.C., and U.S. Environmental Protection Agency, Athens, GA.
Chesapeake Bay Nonpoint Source Evaluation Panel. (1990). Report and Recommendations of the Nonpoint Source Evaluation Panel. Presented to the Chesapeake Bay Executive Council and U.S. Environmental Protection Agency, Washington, D.C.
Donigian, Jr., A.S., B.R. Bicknell, A.S. Patwardhan, L.C. Linker, C.H. Chang, and R.Reynolds. (1994). Chesapeake Bay Program Watershed Model Application to Calculate Bay Nutrient Loadings: Final Findings and Recommendations. FINAL REPORT. U.S. EPA, CBPO, Annapolis, MD. 283 p.
Donigian, Jr., A.S., B.R. Bicknell, and R.V. Chinnaswamy. (1995). Refinement of a Comprehensive Watershed Water Quality Model.. FINAL REPORT. Prepared for U.S. Army Corps of Engineers, Waterways Experiment Station, Vicksburg, MS.
Donigian, Jr., A.S. and R.V. Chinnaswamy. (1996). Shenandoah Hydrology Parameters for Phase IV. Technical Memoranda to Lewis Linker, EPA-CBPO. Dated 20 February 1996.
33 References
Gold, A.J. W.R. DeRagon, W.M. Sullivan, and J.L. Lemunyon. (1990). Nitrate-Nitrogen Losses to Groundwater from Rural and Suburban Land Uses. J. Soil Water Cons. pp. 305-310.
Goldman, M.B., P.M. Groffman, R.V. Pouyat, MJ. McDonnell, and S.T.A. Pickett. (1995). CH4
Uptake and N Availability in Forest Soils Along an Urban to Rural Gradient. Soil Biol. Biochem. 22(3):281-286. Elsevier Science Ltd. Great Britain.
Hunsaker, C.T., C.T. Garten, and P.J. Mulholland. (1994). Nitrogen Outputs from Forested Watersheds in the Chesapeake Bay Drainage Basin. DRAFT. ESD Publication No. 4275. Environmental Sciences Division, Oak Ridge National Laboratory, Oak Ridge, TN.
Keeney, D. (1982). Nitrogen Management for Maximum Efficiency and Minimum Pollution. In: Nitrogen in Agricultural Soils. F.J. Stevenson (ed.). Soil Science Society of America, Inc., Madison, Wisconsin, p. 605-649.
Legg, J.O. and J.J. Meisinger. (1982). Soil Nitrogen Budgets. In: Nitrogen in Agricultural Soils. F.J. Stevenson (ed.). Soil Science Society of America, Inc., Madison, Wisconsin, p. 503-566.
Maizel, M.S., G. Meuhlbach, P. Baynham, and J. Zoerkler. (1995). The Potential for Nutrient Loadings from Septic Systems to Ground and Surface Water Resources and the Chesapeake Bay. A Cooperative Project between U.S. EPA Chesapeake Bay Program, Chesapeake Research Consortium, Inc., NCRI Chesapeake, Inc., and USDA/NRCS Northeast National Technical Center.
Meisinger, J.J. and G.W. Randall. (1991). Estimating Nitrogen Budgets for Soil-Crop Systems. Chapter 5. In: Managing Nitrogen for Groundwater Quality and Farm Profitability. R.F. Follett, D.R. Keeney, and R.M. Cruse (eds.). Soil Science Society of America, Inc.
Morton, T.G., A.J. Gold, and W.M. Sullivan. (1988). Influence of Overwatering and Fertilization on Nitrogen Losses from Home Lawns. J. Environ. Qual. 17(1): 124-130.
Muchovej, R.M.C., and J.E. Rechcigl. (1994). Impact of Nitrogen Fertilization of Pastures and Turfgrasses on Water Quality. In: Soil Processes and Water Quality. R. Lai and B.A. Stewart (eds.). Advances in Soil Science, CRC Press/Lewis Publishers, Boca Raton, FL. pp. 91-135.
Neumiller, S.K., L. Linker, J.E. Hannawald, A.S. Donigian, Jr., and B. Bicknell. (1994). Chesapeake Bay Program Phase III Watershed Model Application to Calculate Bay Nutrient Loadings: Appendix E - Land Use and Selected Parameter Values. (DRAFT, November 17, 1994). U.S. EPA, CBPO, Annapolis, MD.
Petrovic, A.M. (1990). The Fate of Nitrogenous Fertilizers Applied to Turfgrass. J. Environ. Qual. 19(1):1-14
Stoddard, J.L. (1994). Long-Term changes in Watershed Retention of Nitrogen: Its Causes and Aquatic Consequences. In: L.A. Baker (ed). Environmental Chemistry of Lakes and Reservoirs. Advances in Chemistry, No. 237. American Chemical Society, Washington, D.C. pp. 223-284.
References 39
Tisdale, S.L., W.L. Nelson, and J.D. Beaton. (1985). Soil Fertility and Fertilizers. 4th Edition. Macmillan Publishing Company, New York, NY. 754 p.
White, C.S., and M.J. McDonnell. Nitrogen cycling Processes and Soil Characteristics in an Urban Versus Rural Forest. (1988). Biogeochemistry 5:243-262. Kluwer Academis Publishers, Dordrecht, Netherlands.
Woodmansee, R.G. (1978). Additions and losses of nitrogen in grassland ecosystems. BioScience 28:448-453.
40 References
Appendix A Shenandoah Model Segments Results Simulated and Observed Flow at Reach 190,1984-87 Simulated and Observed Flow at Reach 190,1988-91 Frequency Analysis of Flow at Reach 190 Comparison of Annual Total Observed and Simulated Flow Volume Simulated Sediment(TSS) Concentration at Reach 190 Simulated and Observed Water Temperature at Reach 190 Simulated and Observed DO Concentration at Reach 190 Simulated and Observed Nitrate-N Concentration at Reach 190 Simulated Ammonia-N Concentration at Reach 190 Simulated Organic-N Concentration at Reach 190 Simulated Total-N Concentration at Reach 190 Simulated and Observed P04-P Concentration at Reach 190 Simulated Organic-P Concentration at Reach 190 Simulated Total-P Concentration at Reach 190 Simulated TOC Concentration at Reach 190 Simulated Chlorophyll A Concentration at Reach 190 Simulated BOD Concentration at Reach 190 Simulated Benthic Algae Concentration at Reach 190
Simulated and Observed Flow at Reach 200,1984-87 Simulated and Observed Flow at Reach 200,1988-91 Frequency Analysis of Flow at Reach 200 Simulated and Observed Sediment(TSS) Concentration at Reach 200 Simulated and Observed Water Temperature at Reach 200 Simulated and Observed DO Concentration at Reach 200 Simulated and Observed Nitrate-N Concentration at Reach 200 Simulated and Observed Ammonia-N Concentration at Reach 200 Simulated and Observed Organic-N Concentration at Reach 200 Simulated and Observed Total-N Concentration at Reach 200 Simulated and Observed P04-P Concentration at Reach 200 Simulated and Observed Organic-P Concentration at Reach 200 Simulated and Observed Total-P Concentration at Reach 200 Simulated TOC Concentration at Reach 200 Simulated Chlorophyll A Concentration at Reach 200 Simulated BOD Concentration at Reach 200
Appendix A Shenandoah Model Segments Results A1
Simulated Benthic Algae Concentration at Reach 200 AGCHEM Summary for Shenandoah Basin (FOREST), PERLND 191 AGCHEM Summary for Shenandoah Basin (Hi-Till), PERLND 192 AGCHEM Summary for Shenandoah Basin (Low-Till), PERLND 193 AGCHEM Summary for Shenandoah Basin (PASTURE), PERLND 194 AGCHEM Summary for Shenandoah Basin (HAY), PERLND 196 AGCHEM Summary for Shenandoah Basin (FOREST), PERLND 201 AGCHEM Summary for Shenandoah Basin (Hi-Till), PERLND 202 AGCHEM Summary for Shenandoah Basin (Low-Till), PERLND 203 AGCHEM Summary for Shenandoah Basin (PASTURE), PERLND 204 AGCHEM Summary for Shenandoah Basin (HAY), PERLND 206
Per Acre Load Contributed from Each Land Use in Shenandoah Basin (lb/ac) Percent of Total Load Contributed from Each Land Use/Source in Shenandoah Basin
A2 Appendix A Shenandoah Model Segments Results
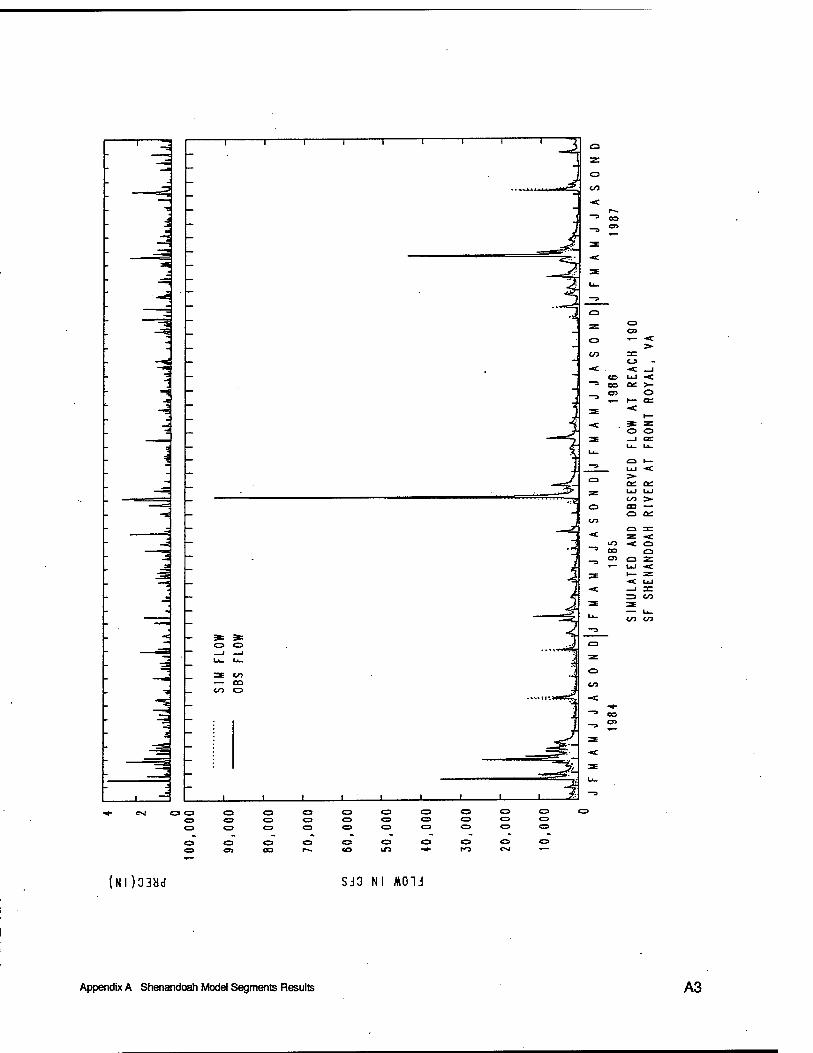
T r
C3
(D UJ < eo «: >- o> O T— r— ce
o o
=E CO CD CO C3
J I L.
^■^ o; ce SE UJ UJ
o m — o cc
GO
■< o
■<
-= ■«
1=1 OS Q z
■< —"
o C3
o es <o C3 Ol 03 i-~ <o
o m
(NI)03Hd SJ3 Nl MOU
Appendix A Shenandoah Model Segments Results A3
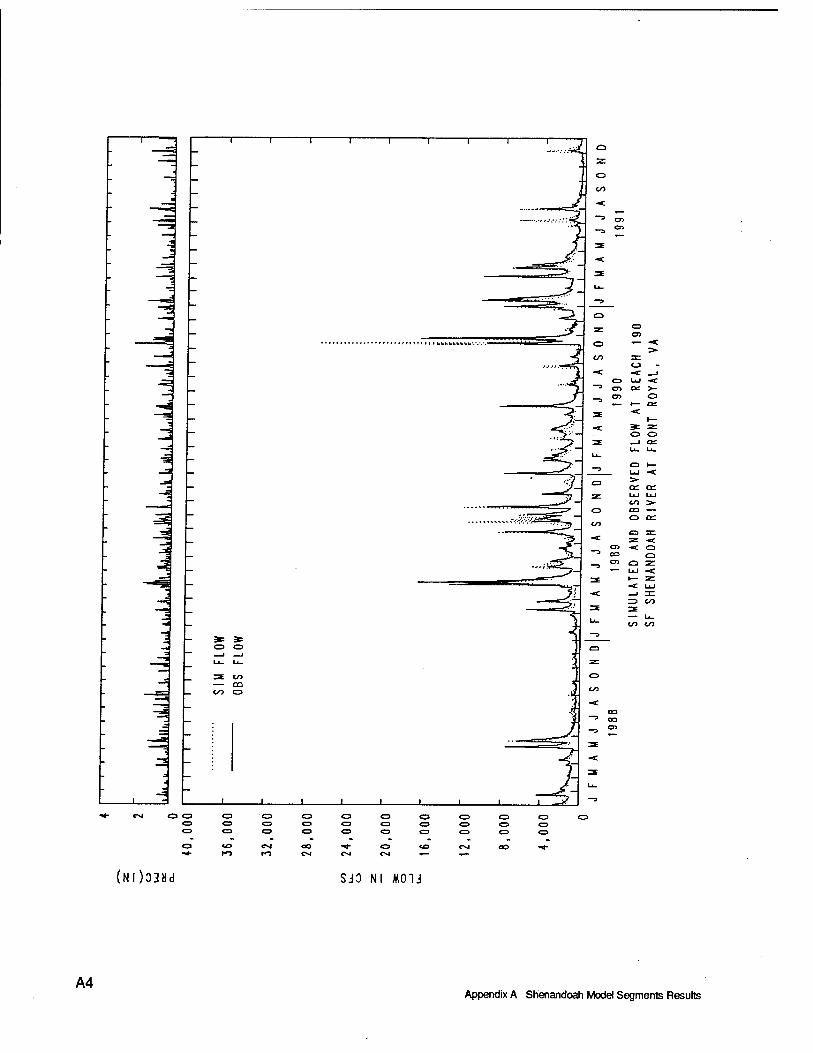
i r i i i r
1=1
z O
o *'— -< > to 3C
„ ■< -< __J
o LU -«C -> CT> Q£ >- o> o
CO OQ
_ CO
cv< o a o o
CM €3 ex
(Nl)03dd SJO Nl M01J
A4 Appendix A Shenandoah Model Segments Results
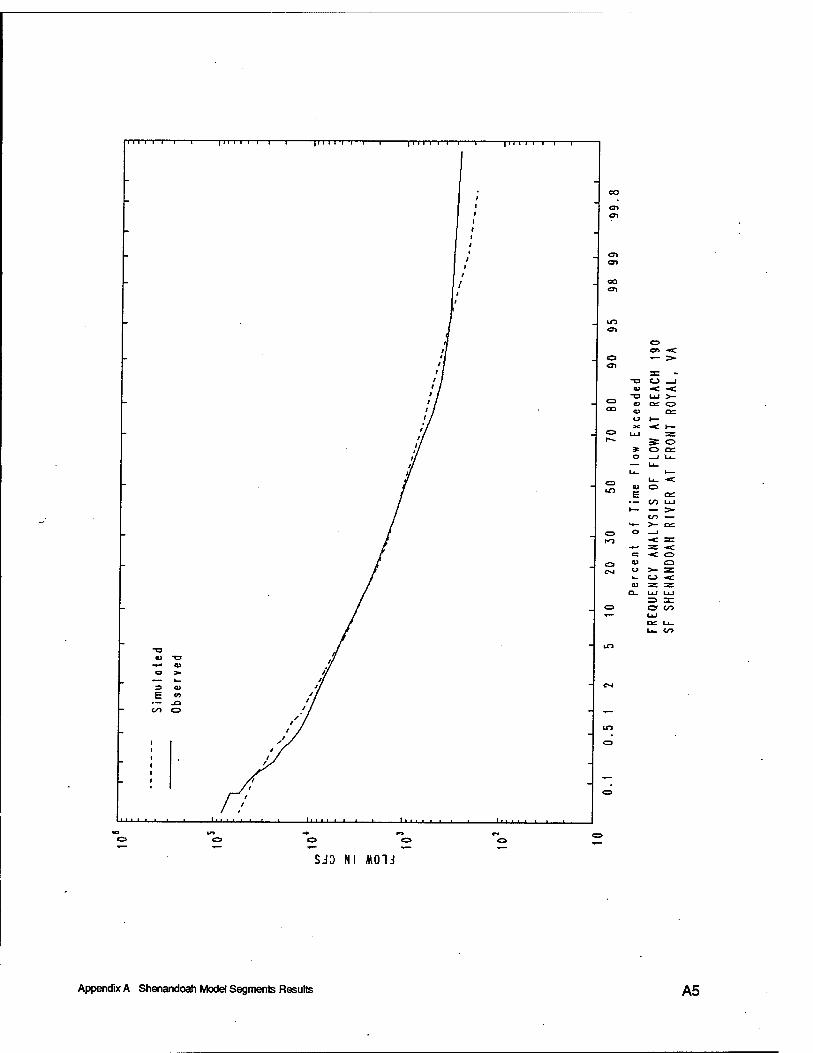
111 I I I—I 1 111 I I I I—I 1 ll I I I I I 11 i i i i—r- 111 i i i—r-
3 a> E «
'■'■■'■
Ol Ol
GO
Ol
-o CJ> _i
'S u >-
3E o SOD:
V o E ce
— to u •— — s-
co —
O I
SJD Nl *Q1J
Appendix A Shenandoah Model Segments Results A5
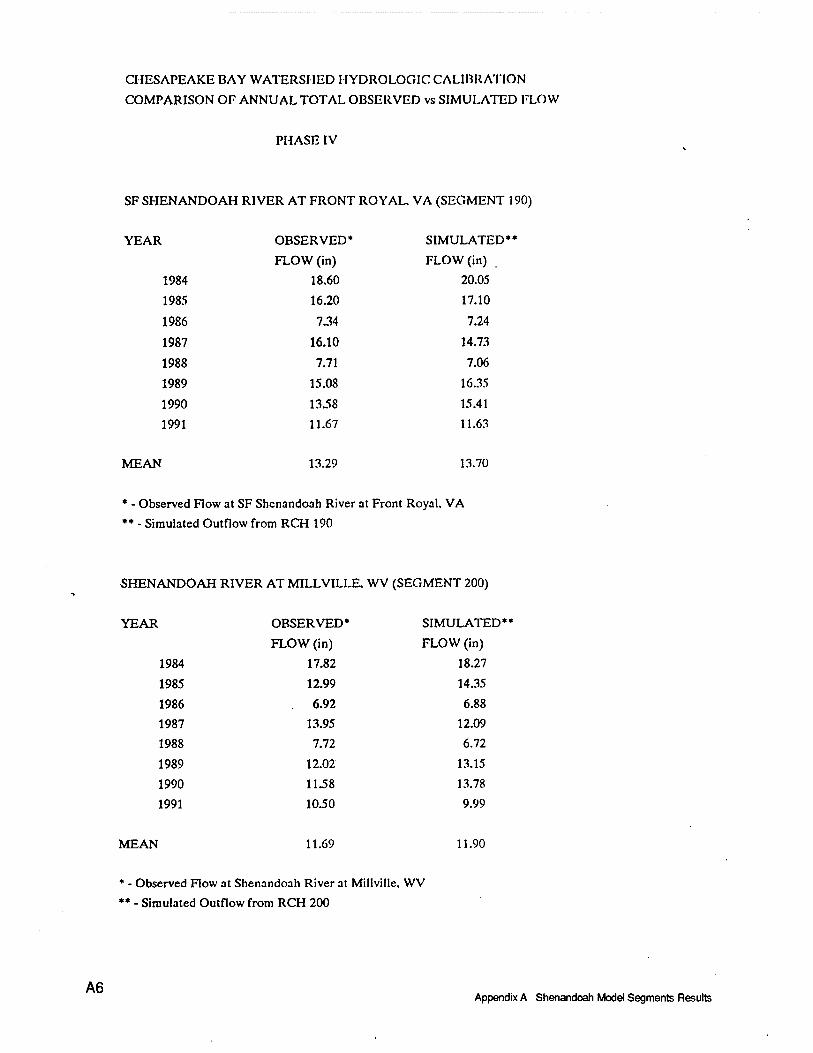
CHESAPEAKE BAY WATERSHED HYDROLOGIC CALIBRATION
COMPARISON OF ANNUAL TOTAL OBSERVED vs SIMULATED FLOW
PHASE IV
SF SHENANDOAH RIVER AT FRONT ROYAL, VA (SEGMENT 190)
YEAR OBSERVED* SIMULATED**
FLOW (in) FLOW (in)
1984 18.60 20.05
1985 16.20 17.10
1986 7.34 7.24
1987 16.10 14.73
1988 7.71 7.06
1989 15.08 16.35
1990 13.58 15.41
1991 11.67 11.63
MEAN 13.29 13.70
* - Observed Flow at SF Shenandoah River at Front Royal. VA
** - Simulated Outflow from RCH 190
SHENANDOAH RIVER AT MILLVILLE, WV (SEGMENT 200)
YEAR OBSERVED* SIMULATED*
FLOW (in) FLOW (in)
1984 17.82 18.27
1985 12.99 14.35
1986 6.92 6.88
1987 13.95 12.09
1988 7.72 6.72
1989 12.02 13.15
1990 11.58 13.78
1991 10.50 9.99
MEAN 11.69 11.90
* - Observed Flow at Shenandoah River at Millville. WV
** - Simulated Outflow from RCH 200
A6 Appendix A Shenandoah Model Segments Results
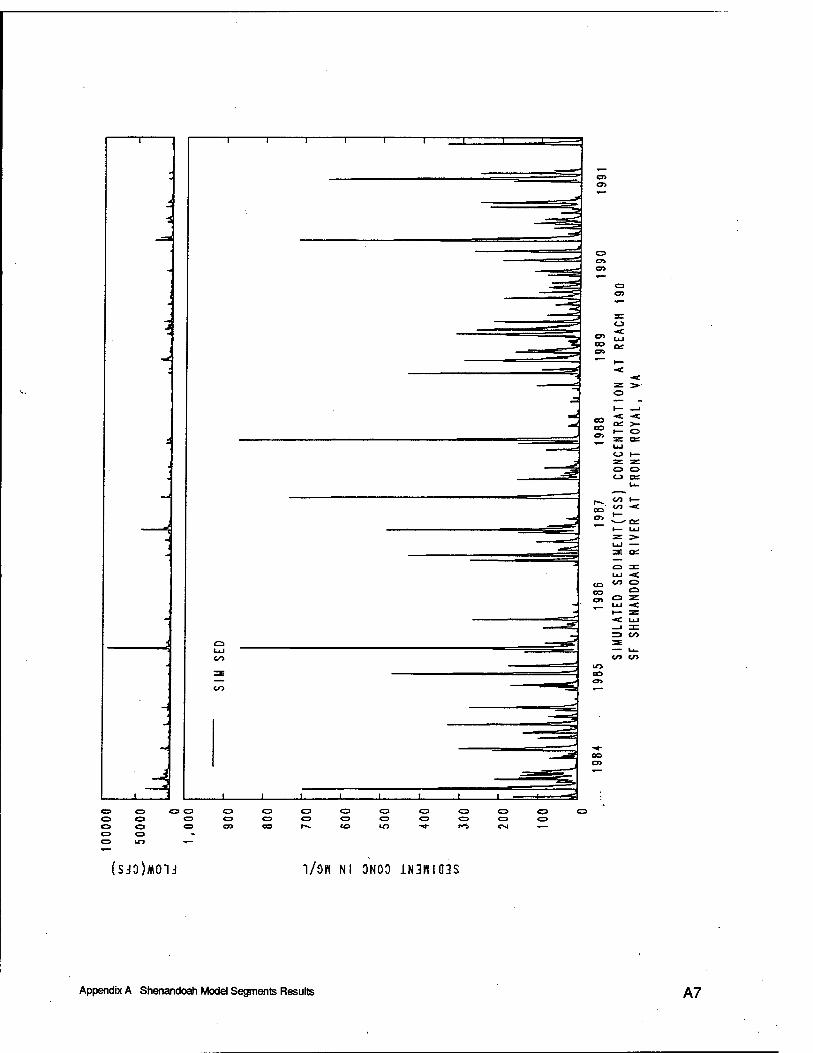
A
an
en o>
C3
3E >■' o
CO on
CO CO Cn
CO CO
O O o o en
O C3 CD O CO IT3 fÖ CXI
(SJO)MOU l/OH Nl 0N00 1N3HIG3S
Appendix A Shenandoah Mode) Segments Results A7
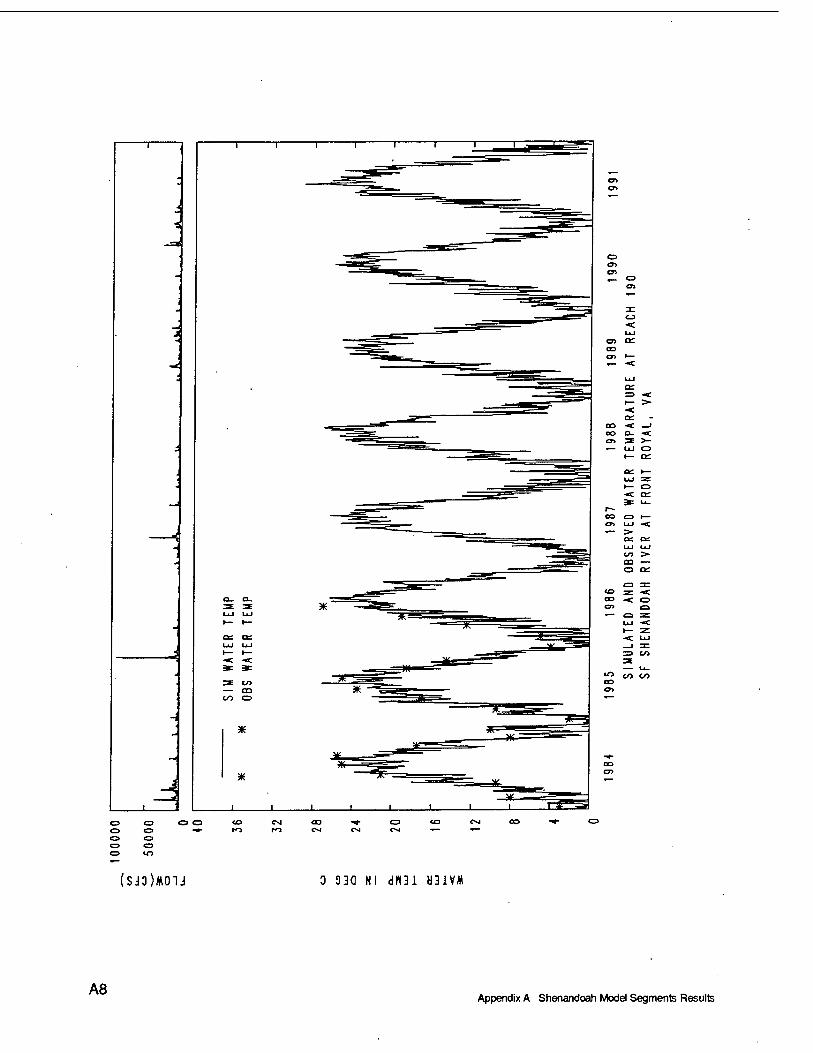
(SJO)MOU 0 93a Nl dH31 H3IVM
A8 Appendix A Shenandoah Mcxiel Segments Results
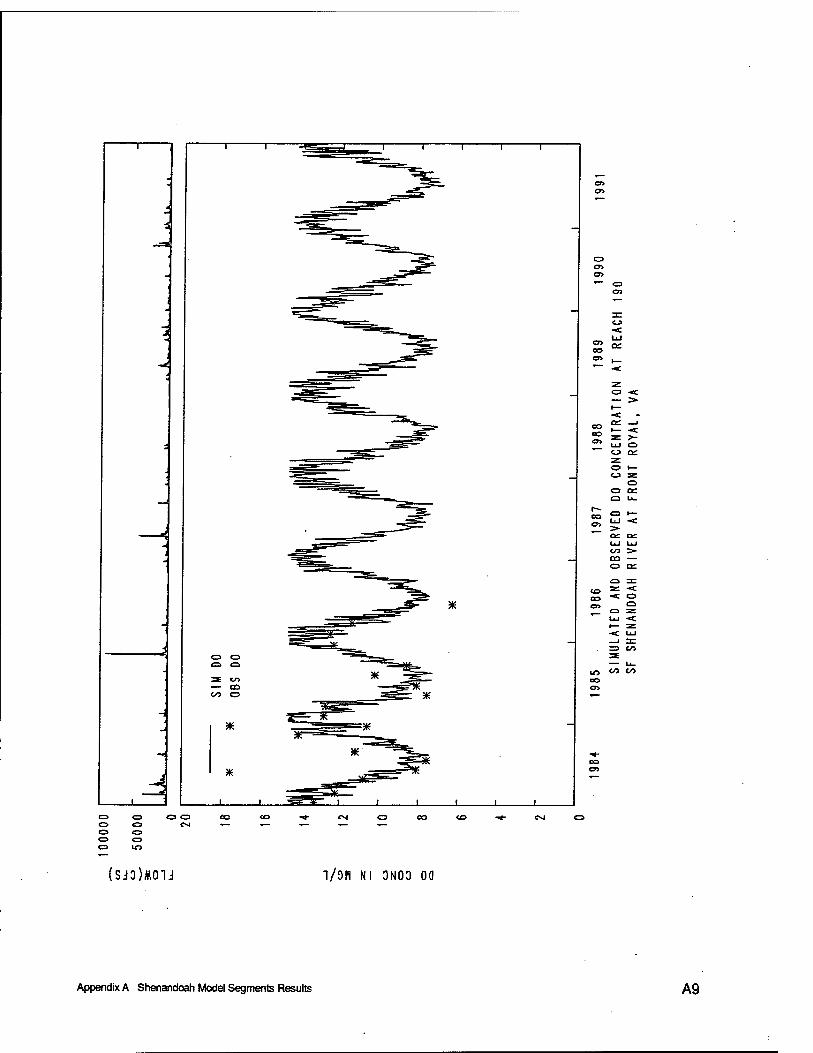
o
O
cr>
■<
— >• ■<
<° - < s = ? cj oc
«p I— o =
O o ce
CO 05
CO >- m — o ce
,_ ea as UJ ■<
^> CO CO «I CJi
CO
(SJO)MOU 1/9H Nl 3N03 00
Appendix A Shenandoah Model Segments Results A9
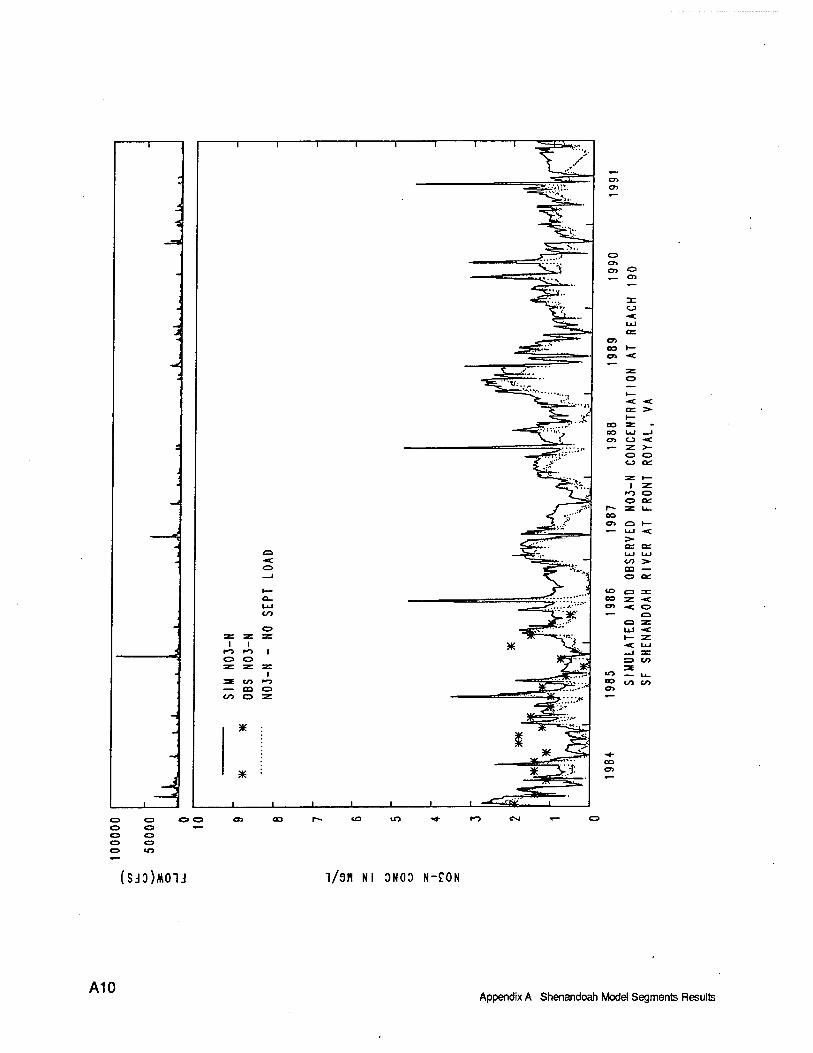
C3 O
o es
<vi *—
(SJO)MOU l/9H Nl 0N00 N-CON
A10 Appendix A Shenandoah Model Segments Results
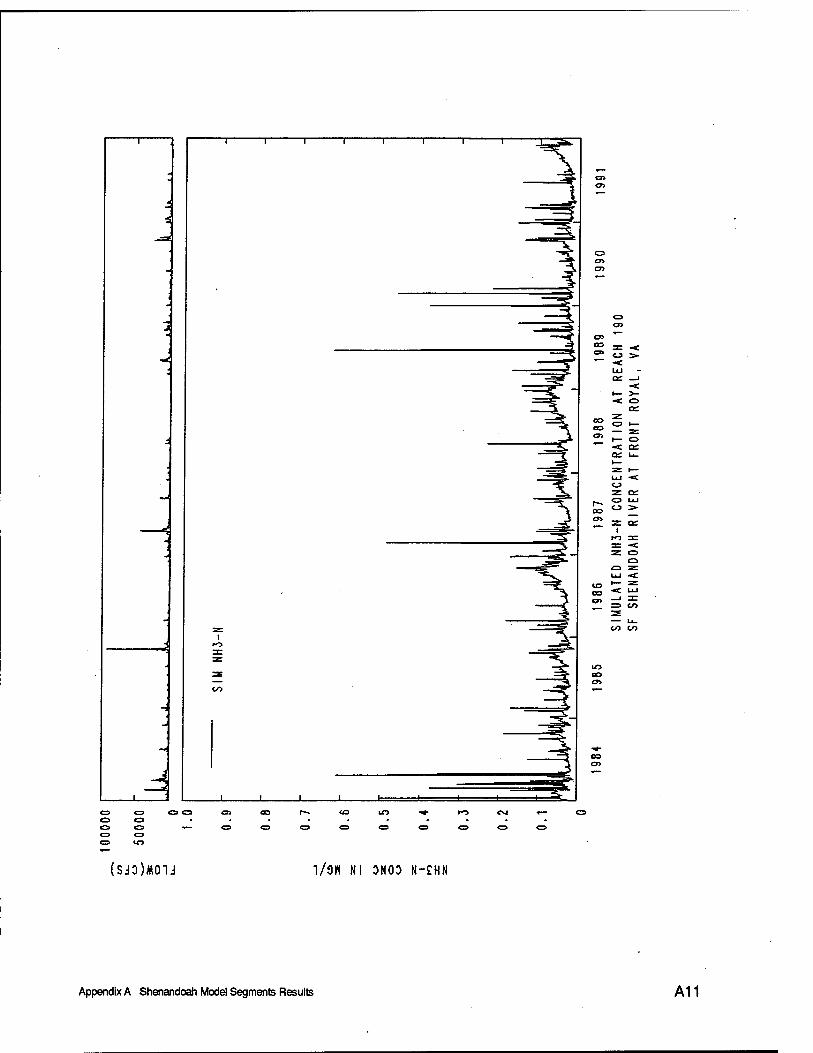
(SJ0)*01J 1/9H Nl DNOO N-CHN
Appendix A Shenandoah Model Segments Results A11
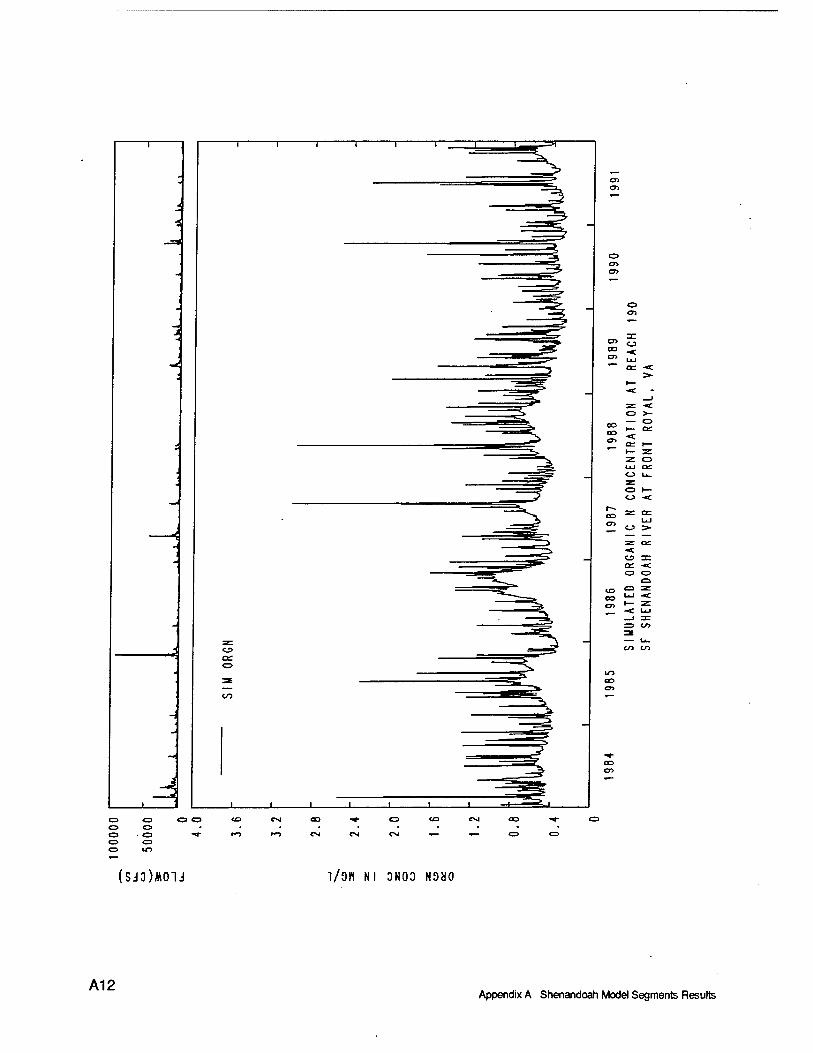
(SJO)MOU I/OH Nl 3N00 NDiJO
A12 Appendix A Shenandoah Model Segments Results
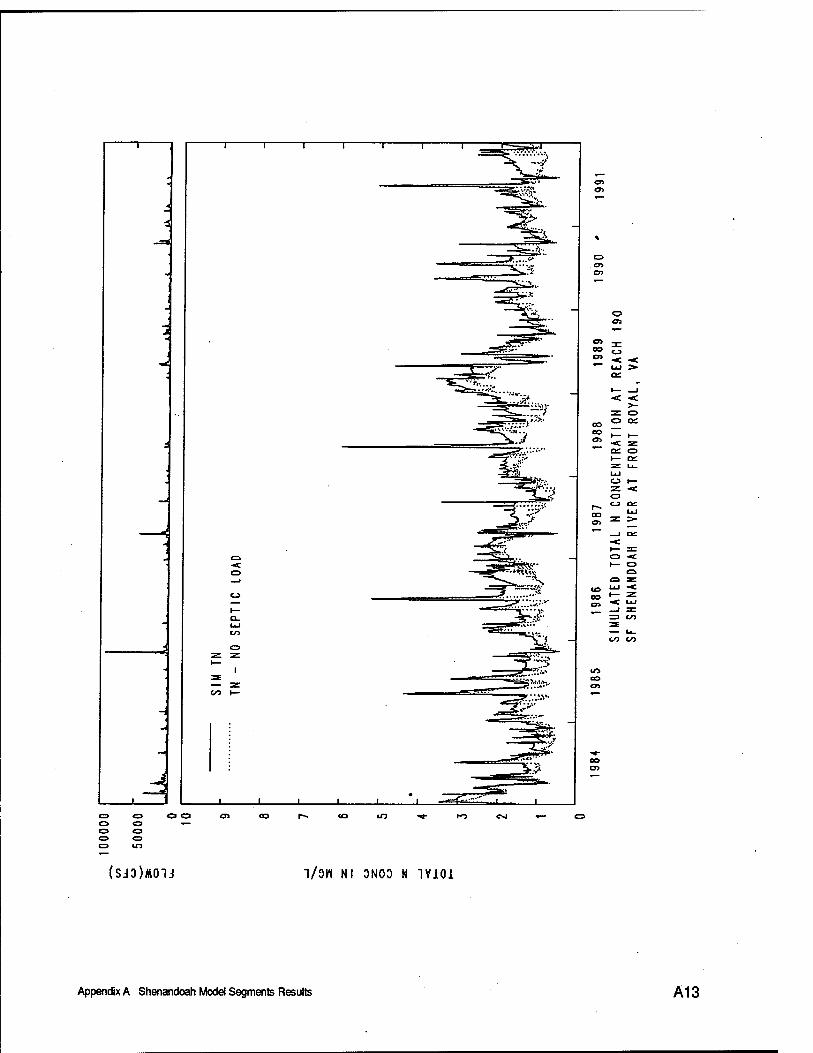
J
T r
A
a. UJ
o
:*.....* en er>
O
s >- ■- *"" cc o
t— on
O I— Z ■< o
00
CO OS
OO en 00 m -*-
(SJO)MOIJ 1/9H Nl 0NO0 N 1V101
Appendix A Shenandoah Model Segments Results A13
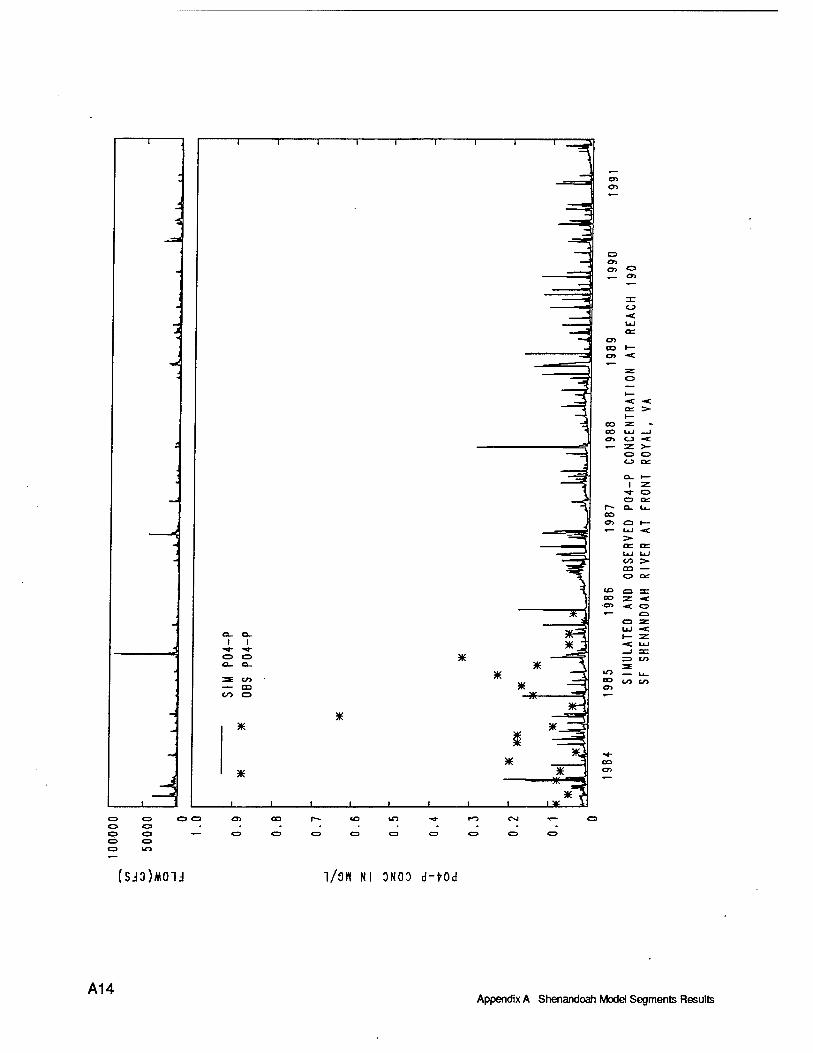
o e» «75 O
DC O ■<
C7> 00 I—
■«£ «c cc >■
1— CO SE - CO UJ —1 o> CJ ■<
»— z >- o o CJ oc
o_ 1 z
■"«- o O oe:
f^ O- u_ oo cy> o 1— *~ UJ •<
ac DC UJ UJ CO > m ^ C3 OrT
lO O 3= CO Z -C o» ■< O «— Q
C3 3C UJ -C t— z -<c UJ _J ar ^ to
OO en
3
CO Li-
en
i— C3
(SJO)MOU 1/9H Nl 0N00 d-tOd
A14 Appendix A Shenandoah Model Segments Results
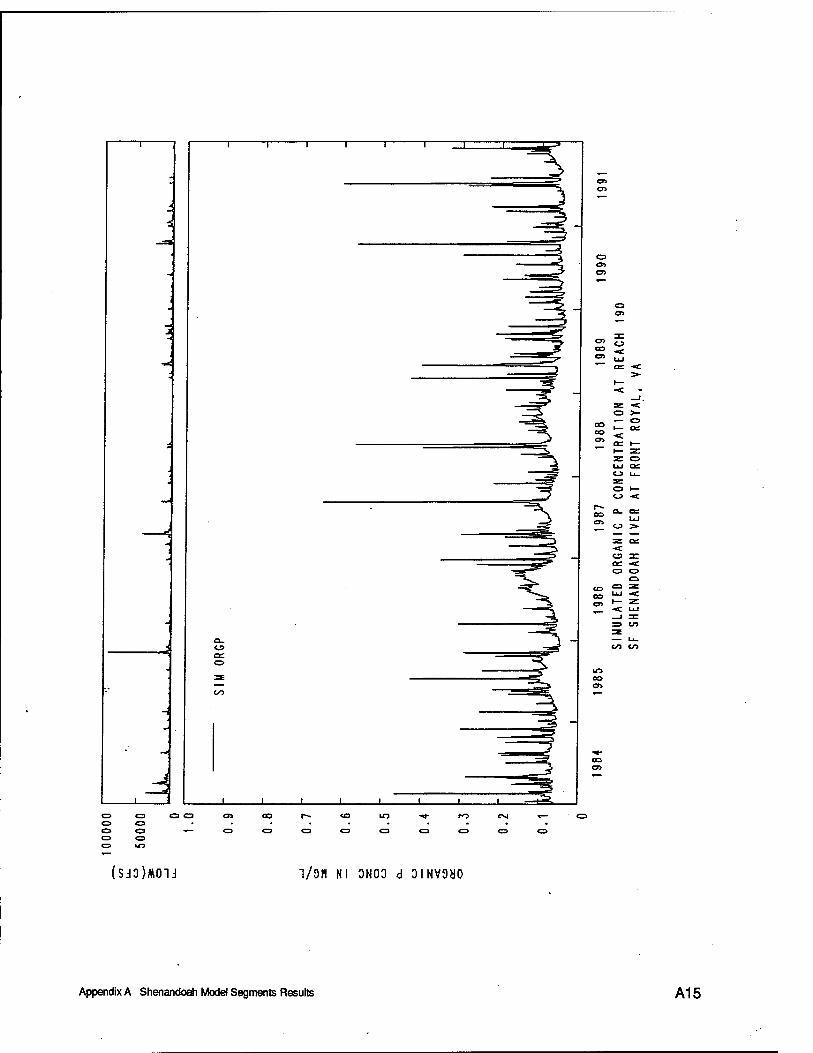
O
o
DO CO
or 1— z Z o UJ Q= CJ u_ SE o I— <J ■<
UJ
5C D± ■«C ts 3T Oi -< o
C3 2;
CO UJ 1— ■<
1
■<
Z UJ
=> tn 3 — u_ co CO
\r> oo o>
03 <3>
o o
o o
oa co m •*»-
(SJO)MOU l/DH Nl ONOO d OINVOcdO
Appendix A Shenandoah Model Segments Results A15
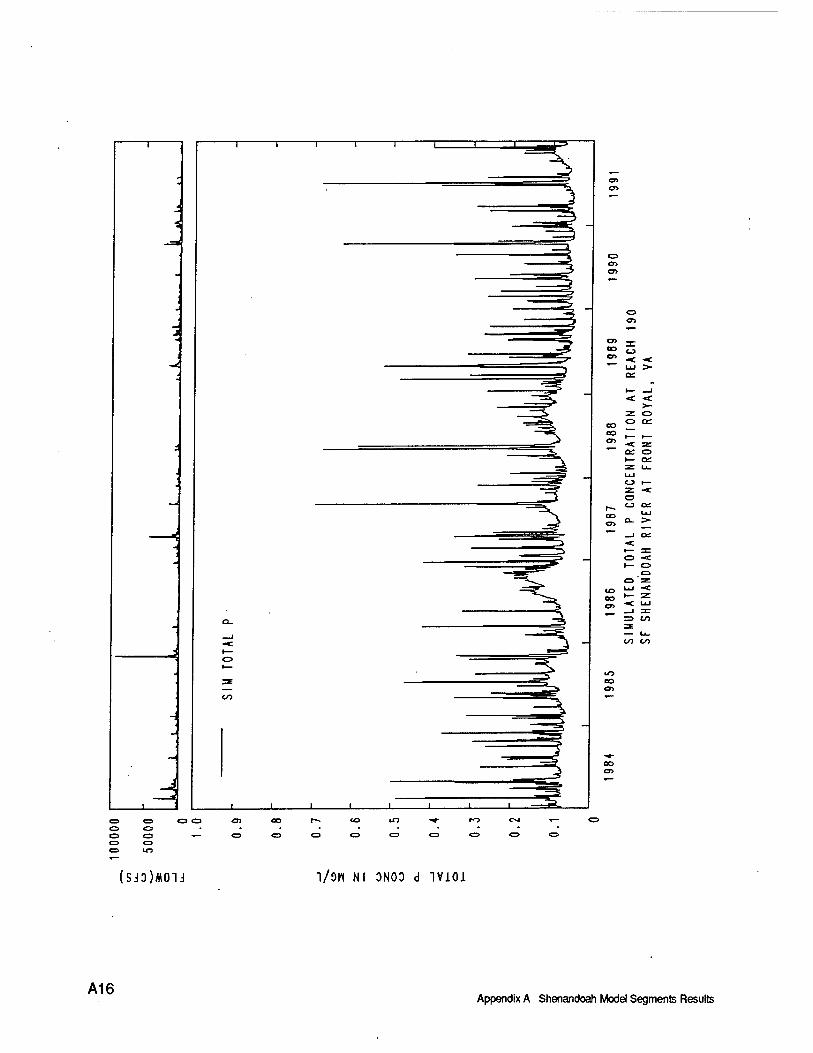
1
i
I I
^
3
a
en
CT>
O
«c >-
Z o CO CO
o
-< OS o t— Oi z: u_ UJ O h— Z -«C o
DO
1 -<
UJ
>— ^ O -c 1—
C3 Q z
cr>
UJ ►— ■<
3
z UJ
en
— u. 00 to
«o SO
CO co
o <o
CD C3 C=> u->
en oo r-~ <o u"5 r-o c-j T— es
(SJO)MOU "l/OH Nl ONOO d "IVlOi
A16 Appendix A Shenandoah Model Segments Results
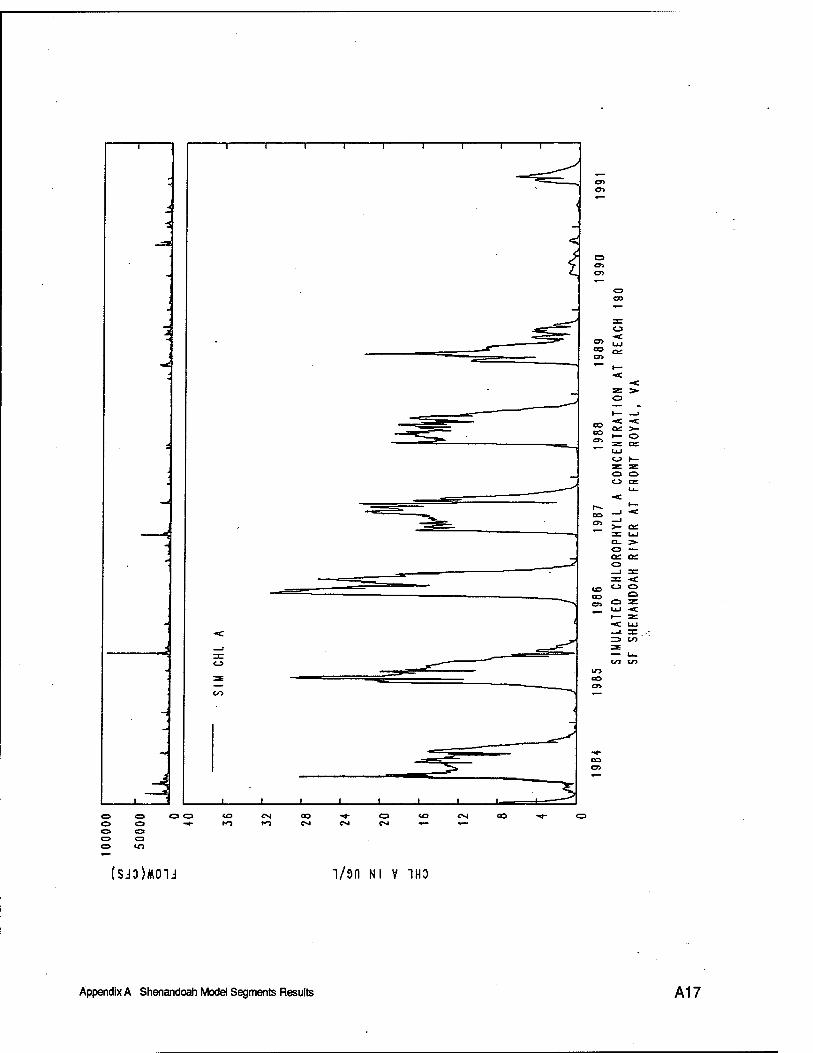
J
i
—I
^
i o
CO
•< UJ
■< -< ss > o ^~ •» ►— .^
CO CO
-< ■<
as
>- o or
<J (— ^ Z C3 O <J or
U_ ■«:
OS Cft >- a:
UJ o_ > o — a: a: O _i 3= T ■<
oo o O.
O O z
1— zs. «e UJ «J. 3: =3 to 3 — la- C/7 CO
lO CO OS
OO
o a o
CO »*• CM CNI
a
o
en
(SJO)*01d l/9n Nl V 1HD
Appendix A Shenandoah McxJel Segments Results A17
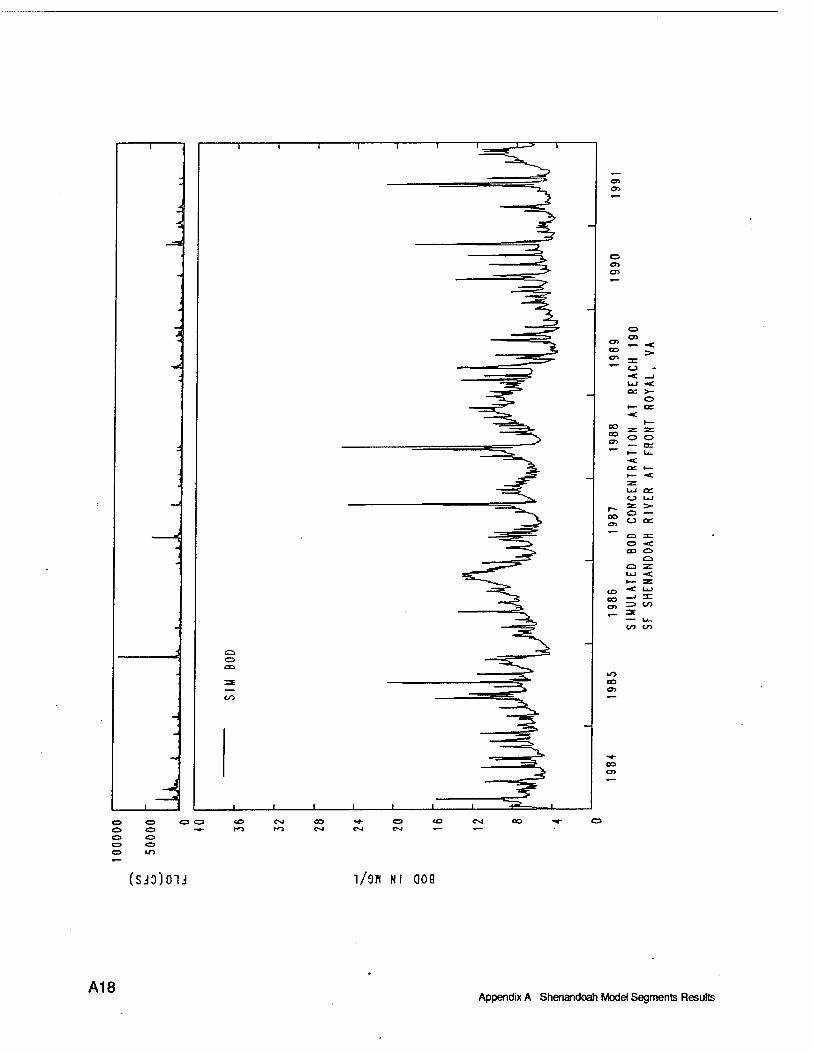
an
C3 en 05
03
CD CO
o ■<
O
UJ ce CJ UJ
f~. == >■
£ <=> ~ £> ° °= o -< CD O
o z UJ ■<
CO 0>
SO
CO en
(SJO)OU 1/3H Nl aOB
A18 Appendix A Shenandoah Model Segments Results
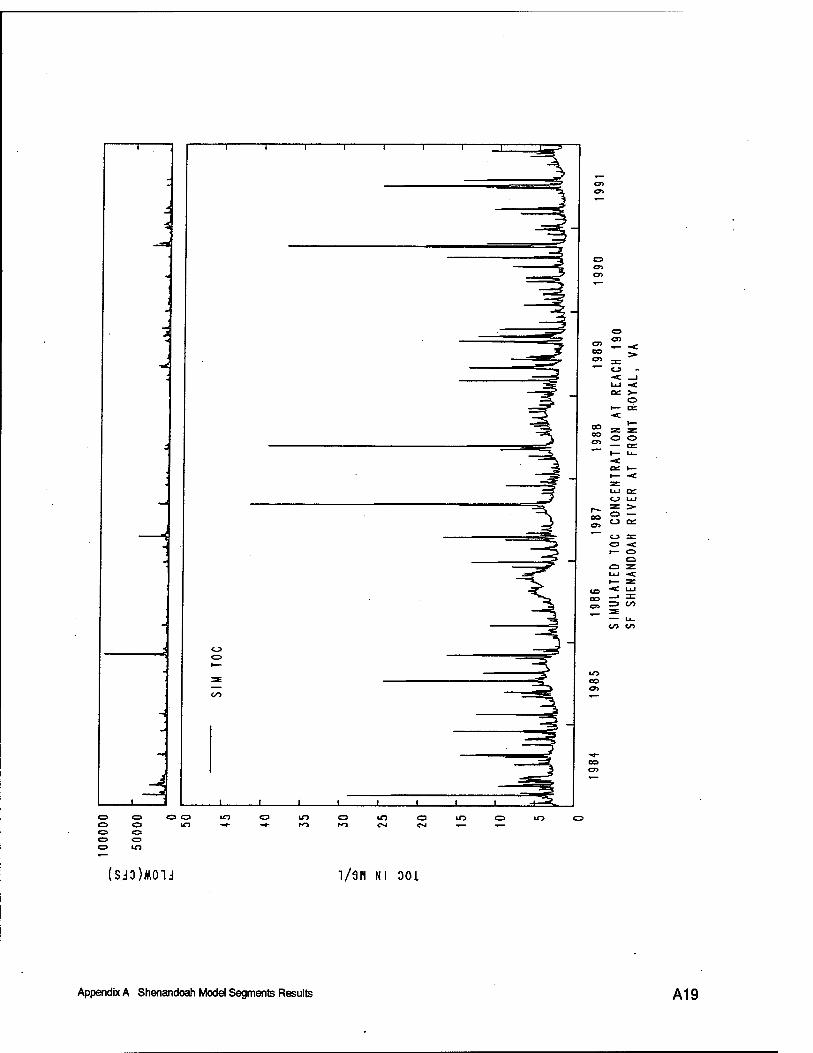
C3>
o
cr>
CD
05 00
o
>•
«c 1 UJ ■<.
et: >- ©
I— cc «c
co CO CJ>
5C o 1—
1— z o cc U_
Oi 1— 1— -< Z UJ cc <_J UJ
CO O o >■
a: —• CJ sz o ■<
l— to CD
o z UJ -«c 1— 3T
CO CO on =1
UJ zn.
u_ CO co
to co ay
(SJ3)*01J 1/911 Nl 001
Appendix A Shenandoah Model Segments Results A19
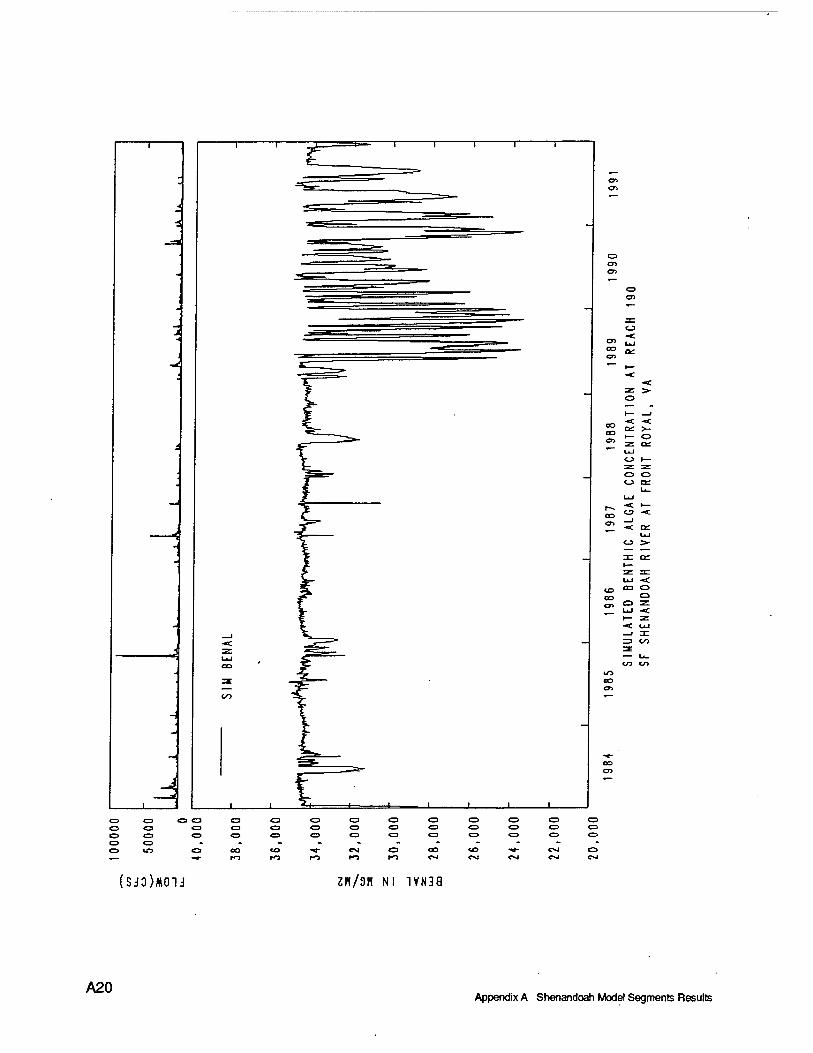
O o oo <fi "«*- e%4 O ro 0*4 <*sj Osl Csl <NJ
(SJO)MOU Zn/9H N! 1VN38
A20 Appendix A Shenandoah Model Segments Results
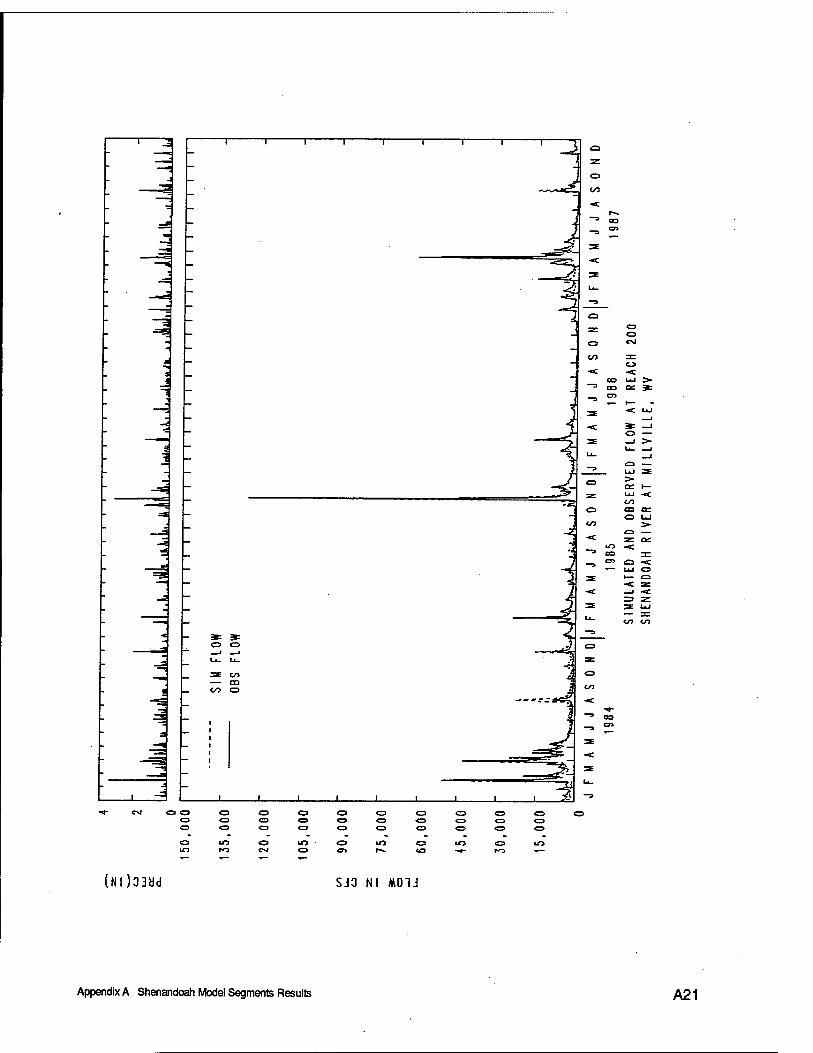
"■—3 1 1 1 1 1 1 1 r
a
a J 1
Q
SS C3 O
o CM
to o
■< ■«c CO UJ >•
—a DO a: *
2E t/> — 00 CO o
cv) OO
irj m o CM
(NI)33^d SJO Nl M01J
Appendix A Shenandoah Model Segments Results A21
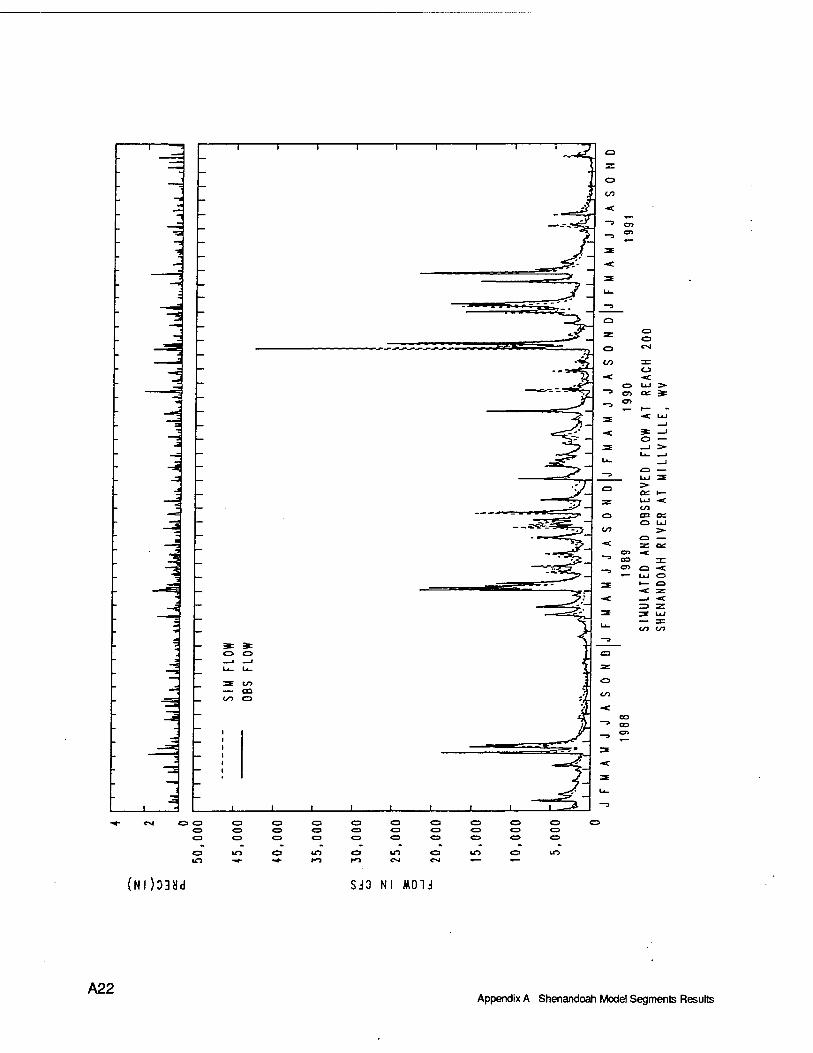
n 1 1 1 1 r
o to
a sc CD
o o CM
CO 3= CJ
-< -«c o UJ
>■
"^ OS ac
2 CO CO CO o
Q£ 1— UJ -< CO m a: O UJ
O — SE OE:
en •*E 03 DC CO o ■<
^~ UJ O 1— a -< 3= 1 ■<
=> z
-*- CM OO a o
CM o CM
(Nl)03Hd SJO Nl M01J
A22 Appendix A Shenandoah Model Segments Results
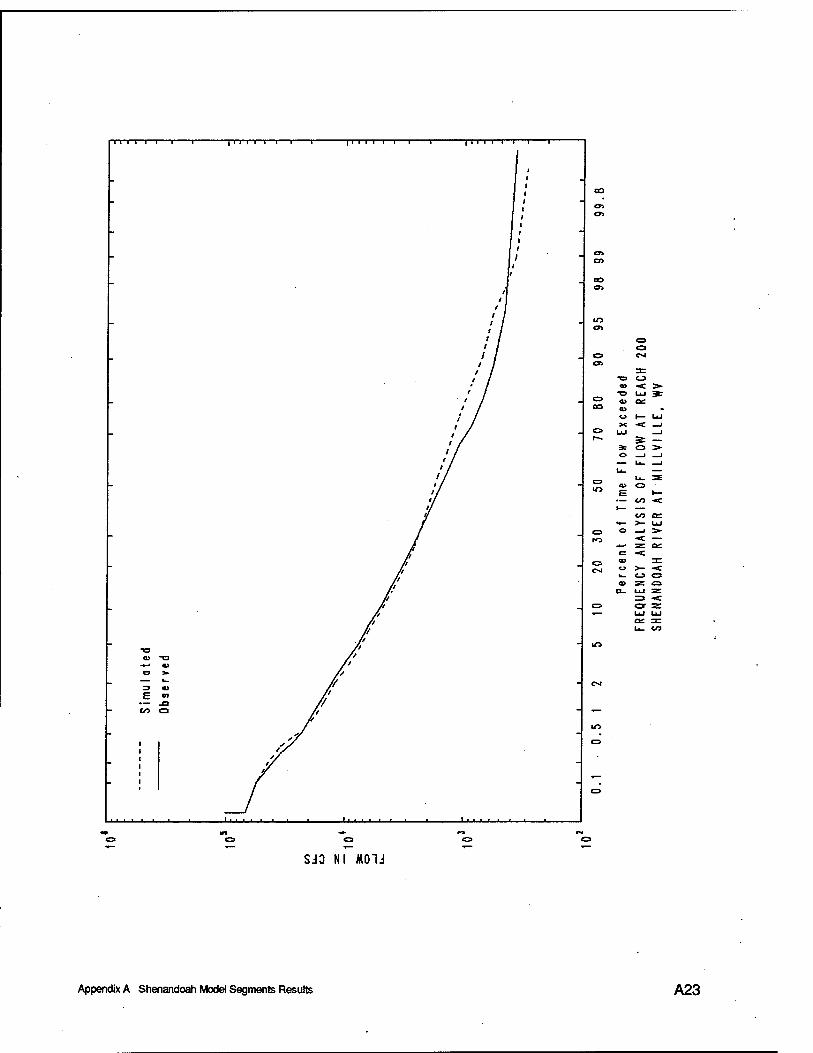
TT i i n i ~ |iiiIiii -i—i—i r
■ ■ ■ ■ ■ 'i ■ i
o o
SJO N! M01J
to
O 03
u I— LU x ■< —1
* o >
— CO -C I— —
co a: H— >- UJ © —i >■
Or Z UJ LLJ 0£ ZC
Appendix A Shenandoah Model Segments Results A23
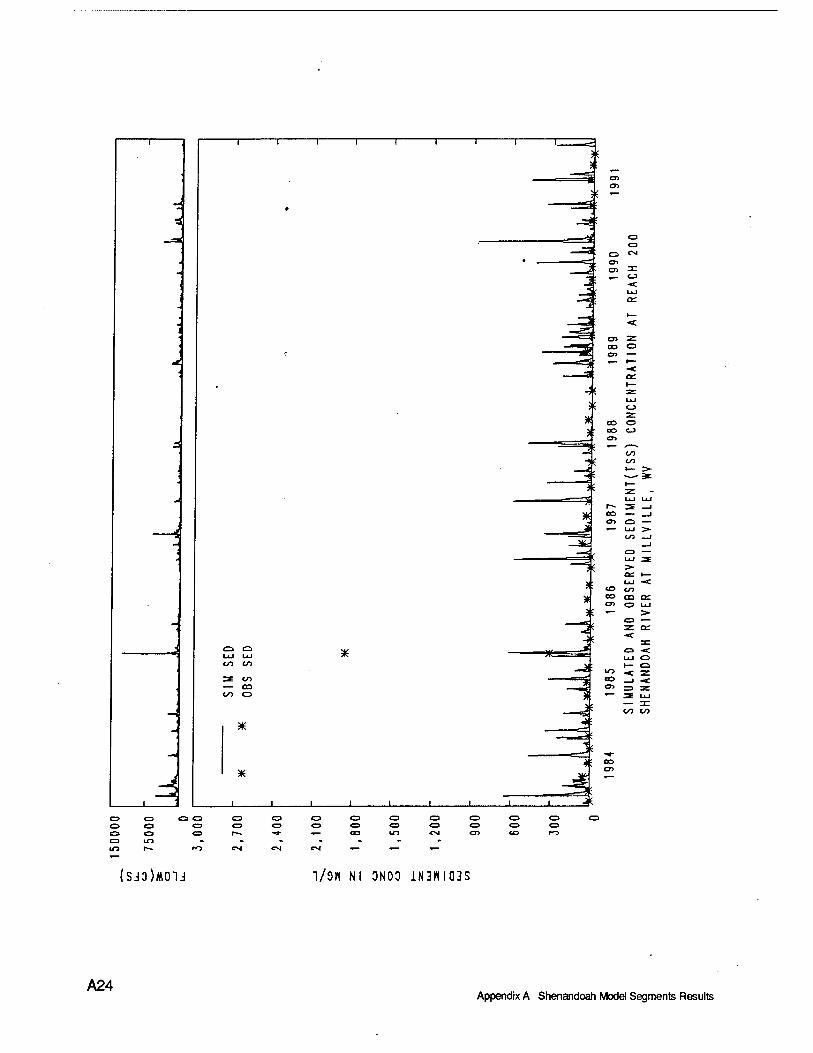
1 1 1 1 1 1 r
A
ea o UJ UJ co co
=E CO — DO CO O
*
*
*
J I I L _l l_
a o
o CD
CD
WO
C3
cn
■Jf "
j: - -5: "3'
O ^ en cn 3Z
—h
oo o o> —
1—
t— z UJ CO z
CO O 00 CJ en
CO CO
">- *
1— 2: UJ UJ
r- S _l CO — 1 en o — •— UJ >-
CO 1 1
C3 UJ 3 >• C£ »— UJ -<
to CO CO CO CC C» o UJ *— >•
CD — z oc -<
3: a -< UJ o v— o
lO ■<■ T' co ■
•<■
o> =3 Z
=*< ^
(SJO)KOIJ "l/SH Nl 0N00 1N3HIQ3S
A24 Appendix A Shenandoah Model Segments Results
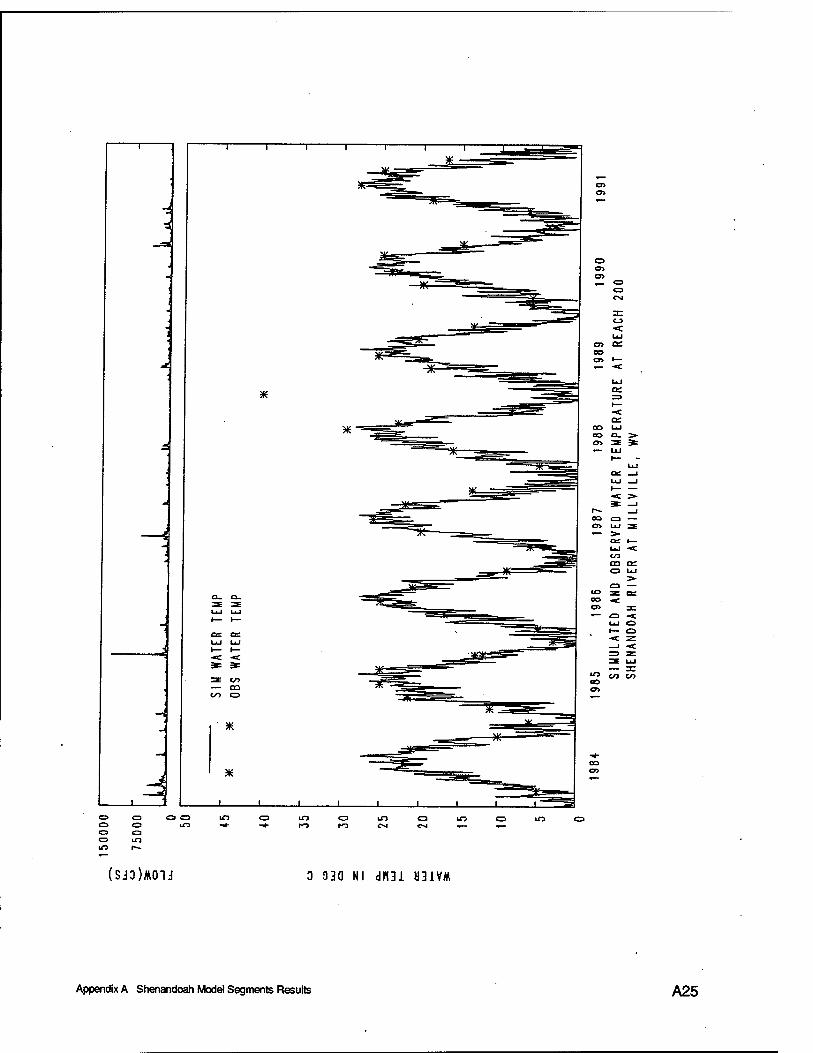
-a
-i ■
-■
I L ^
*
=E CO — OQ CO o
*
*
o o> o> ^ C3
C3 O*
:c CO «c LiJ
o> o: OS o> »—
o o O O O LD
a a 1T3
C3 1X7
(SJ0)*01J 0 93a Nl dim H31VM
Appendix A Shenandoah Model Segments Results A25
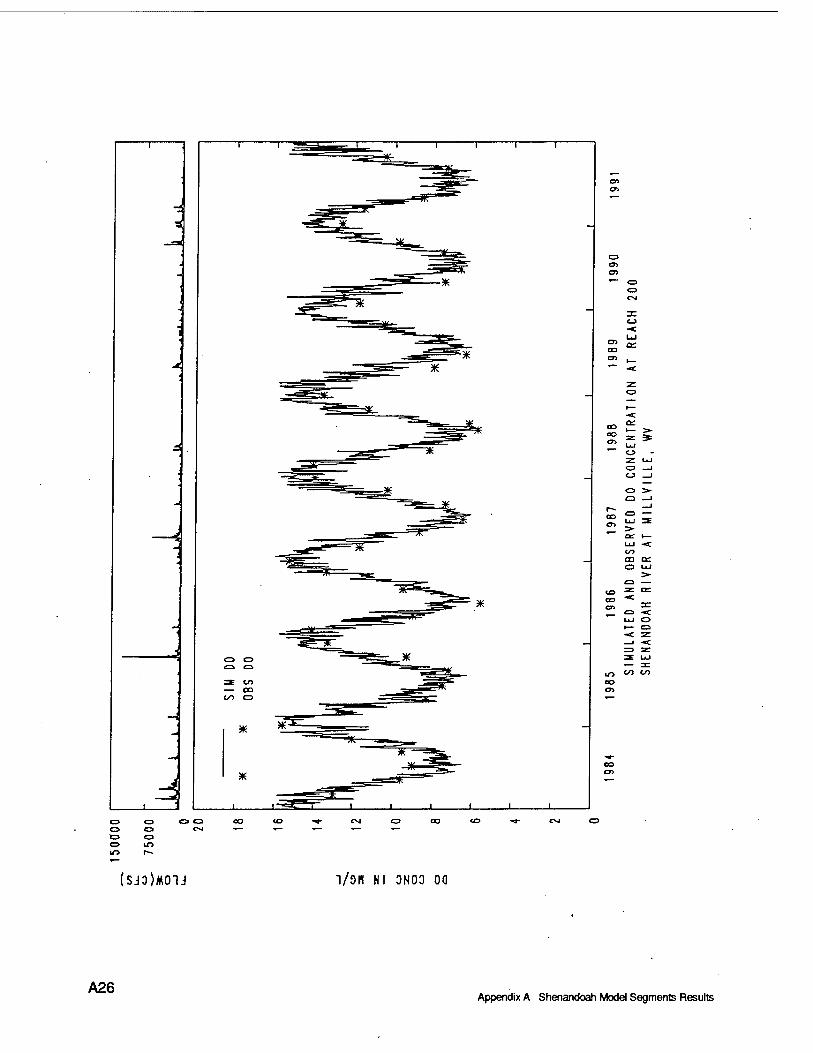
-i i
-
A
en
O o
CO
-< CO Q;
■>•
CT1 * " <J> -
z UJ o 1 O —' o >■
o 1 r- ea
1
Ol UJ zt
UJ -c CO 03 en O UJ
>■
a — =: CE ■<
3:
UJ ■< o
U5 CO M 00
CO
o o Ö o o in
o O <o «*•
(SJO)MOU Vow Ni ONOO oa
A26 Appendix A Shenandoah Model Segments Results
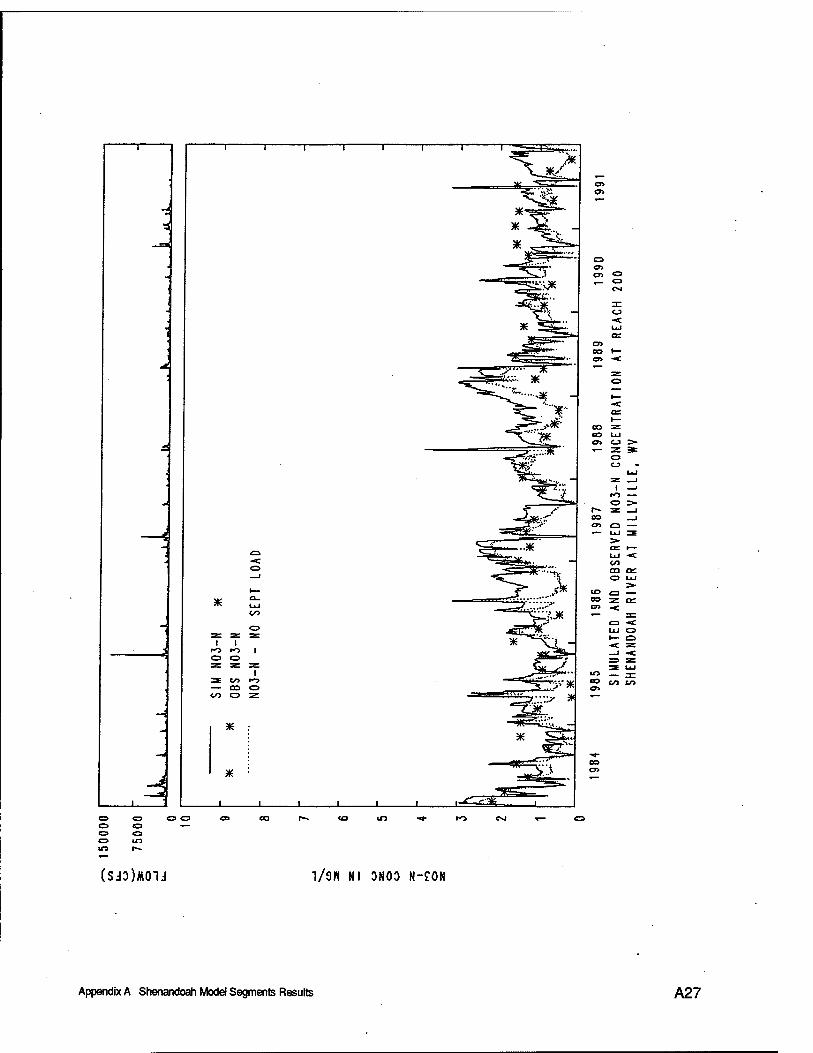
i r
a
-i
d o o o in
* tVO
= Z O SB
o 3=
o 1
CvO
to CO C3
*
*
en «3»
%
o o> en O
C3 CM
a: ■< LiJ
o> oo 1— en ■<
as o
I— CO z CO LiJ en e_a > *~ z
o 3r
CJ UJ
l —i
*"j — o ;>-
I-- ^ i 03 i CTi a — *" UJ >
3
ce t— UJ -< Vi CD CC O LiJ
<JO C3 — CD Z DC cn -<:
i "^ J"2fc_>.
IO _ 3- =o c/a to
:^ * —
OS en
co m r>-> esi •«—
(SdO)MOU 1/9K Nl DNOO N-CON
Appendix A Shenandoah Model Segments Results A27
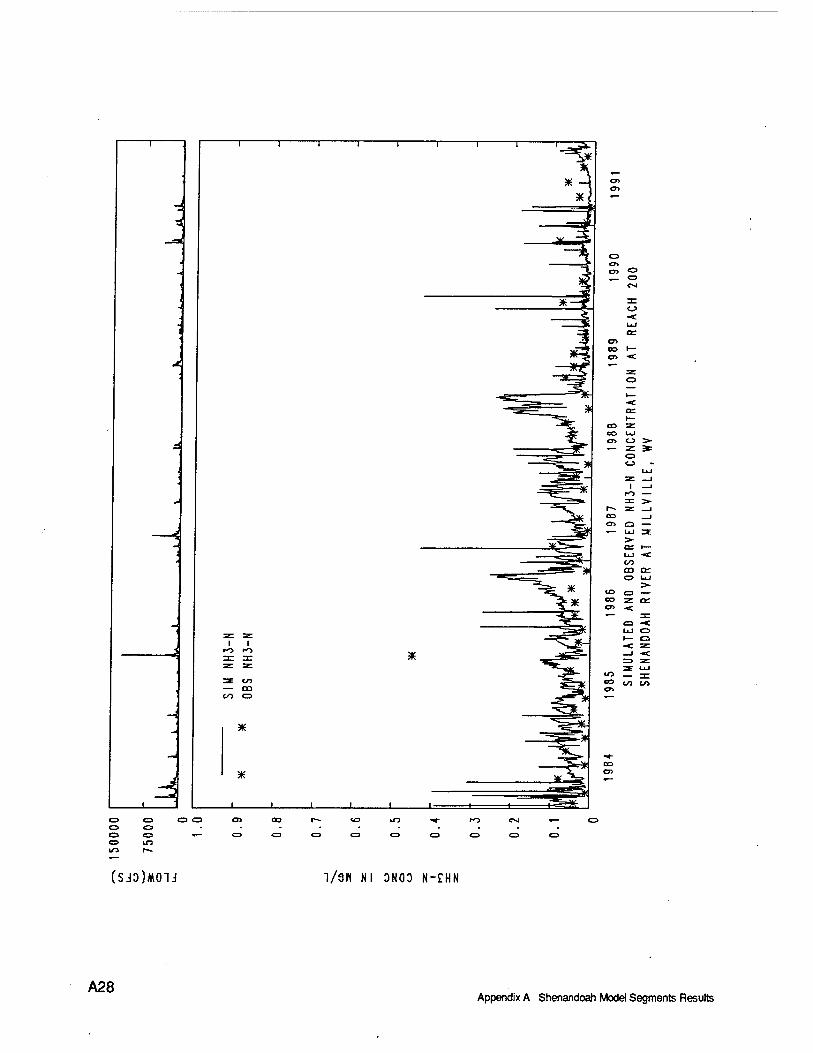
o a •
o <o o in
(SJO)MOU 1/9H Nl 0N00 N-CHN
A28 Appendix A Shenandoah Model Segments Results
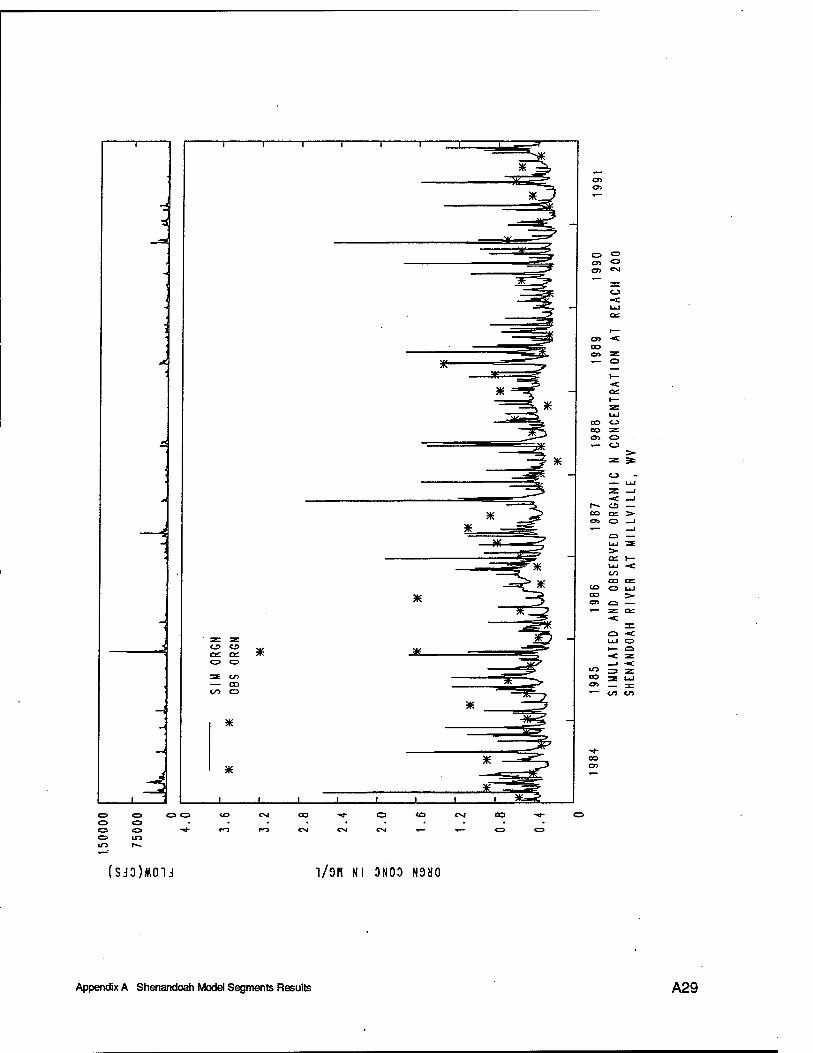
o es
o o in
CO
CM
<o evi oo
(SJO)MOTJ l/OH Nl ONOO N9S0
Appendix A Shenandoah Model Segments Results A29
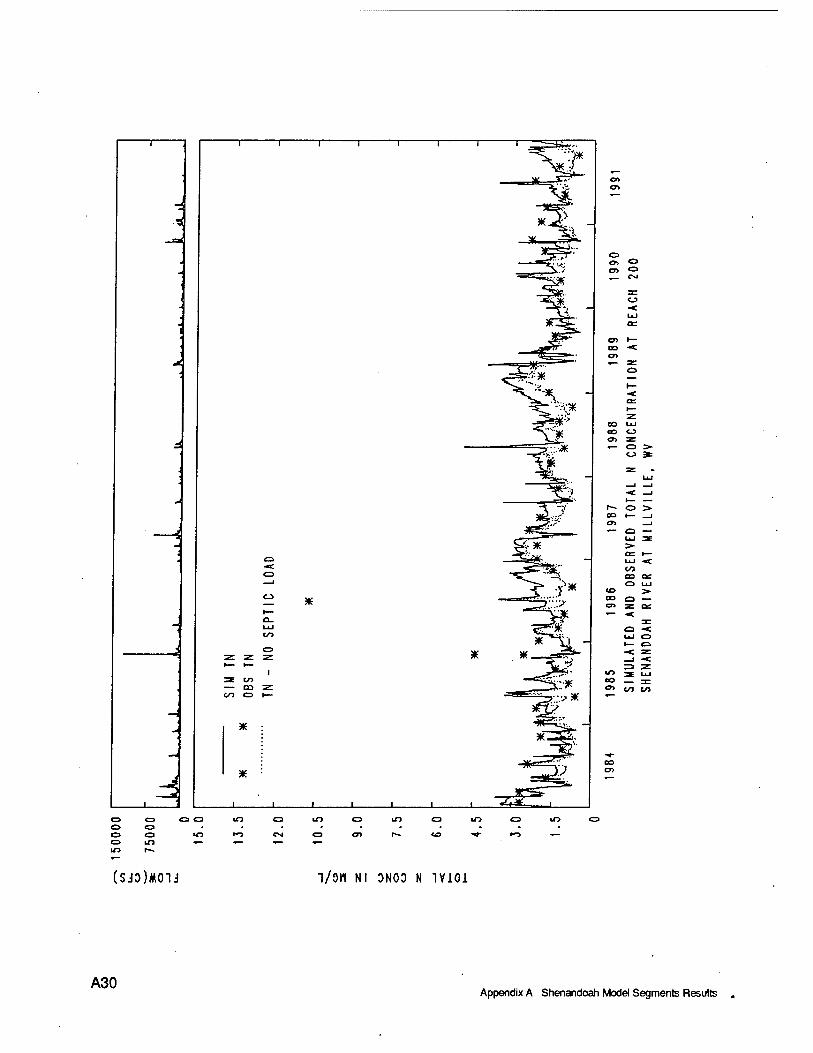
o o
o a un •o >»i
C3 lO o m O m o
Ol O Ol r** to •«■ r-->
(SJD)MOU l/OH Nl 0N00 N 1V101
A30 Appendix A Shenandoah Model Segments Results
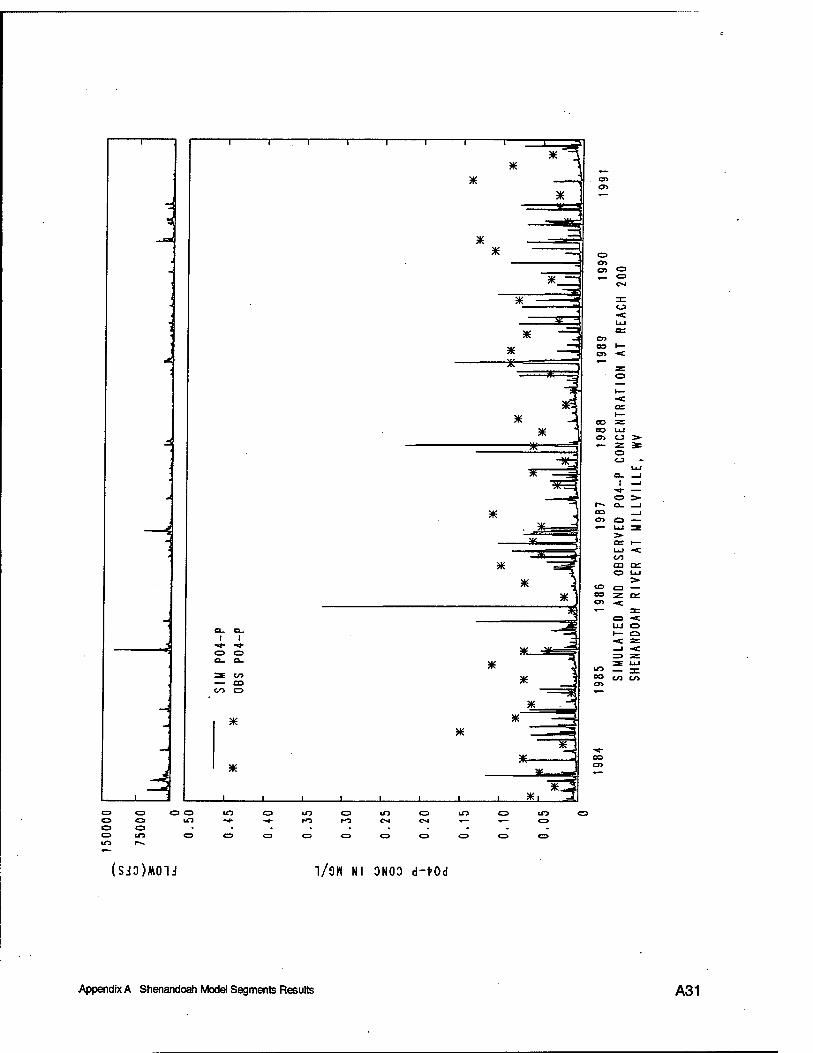
->.
d O o
ITS
n i ; i i r
a_ o_
a_ Q-
to CD O
*
*
_! L
* *
^
* *
X —
* —3} *
co o
* *
-*
*
OS CO <CI ^- a
ex
i: CJ -< LU OS
CO S3 1— CO -c
fl e>
3K
*
*-
' *■
co 3= BO LU oo o :>- z o CJ
o. 1
3C
LU 1
-«f- — O >-
r~ o_ 1 co 1 CO Q — *■*
UJ 3
ee 1— UJ -<c CO m D- o UJ >•
to C3 — CO 2 ce CO
■<
DO CO
CO CO
m ex
(SJO)MOIJ 1/9H Nl DNOO d-tOd
Appendix A Shenandoah Model Segments Results A31
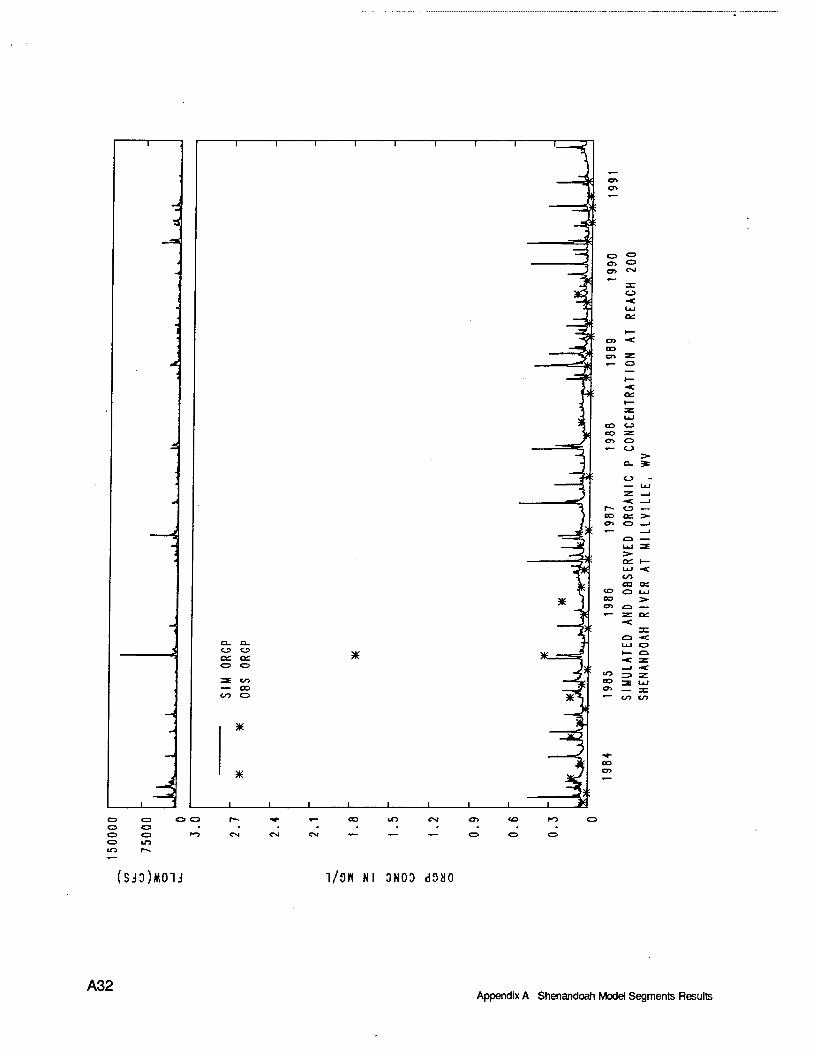
*
on ce <z> o
3 CO — CO co o
*
*"
*
A *
J L
O O
o in
J I I
m <vi <r>
CNJ OJ C3
!SJO)MOU 1/311 Nl 3N00 d9H0
A32 Appendix A Shenandoah Model Segments Results
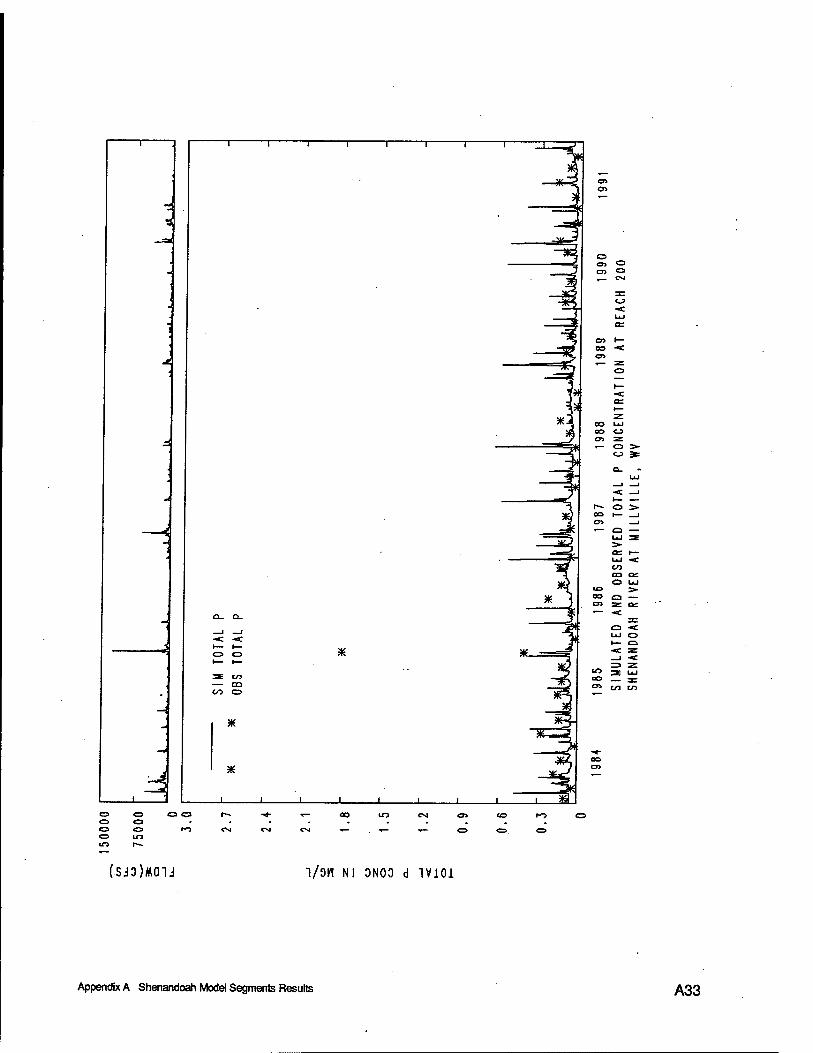
3
—*
A O «3
to r^
-c -«c I— »— <=> o
3 en — OD CO O
*
*
I-»
*
<VI CM
W)
*,
*
r» o S» CO 1— . .j
OS _j
*— a — LLJ 3 >• ee h— UJ ■<
CO m Q£ O UJ
CO I» CO a — en SE oc **— ■< -,-
o "C UJ o ►— o ■«C ä _J ■«
=3 =r iß 3= UJ CO 3= OS to en
*— oo m CM as <o
(■SJ3)M01J l/OH Nl 0N00 d IViOl
Appendix A Shenandoah Model Segments Results A33
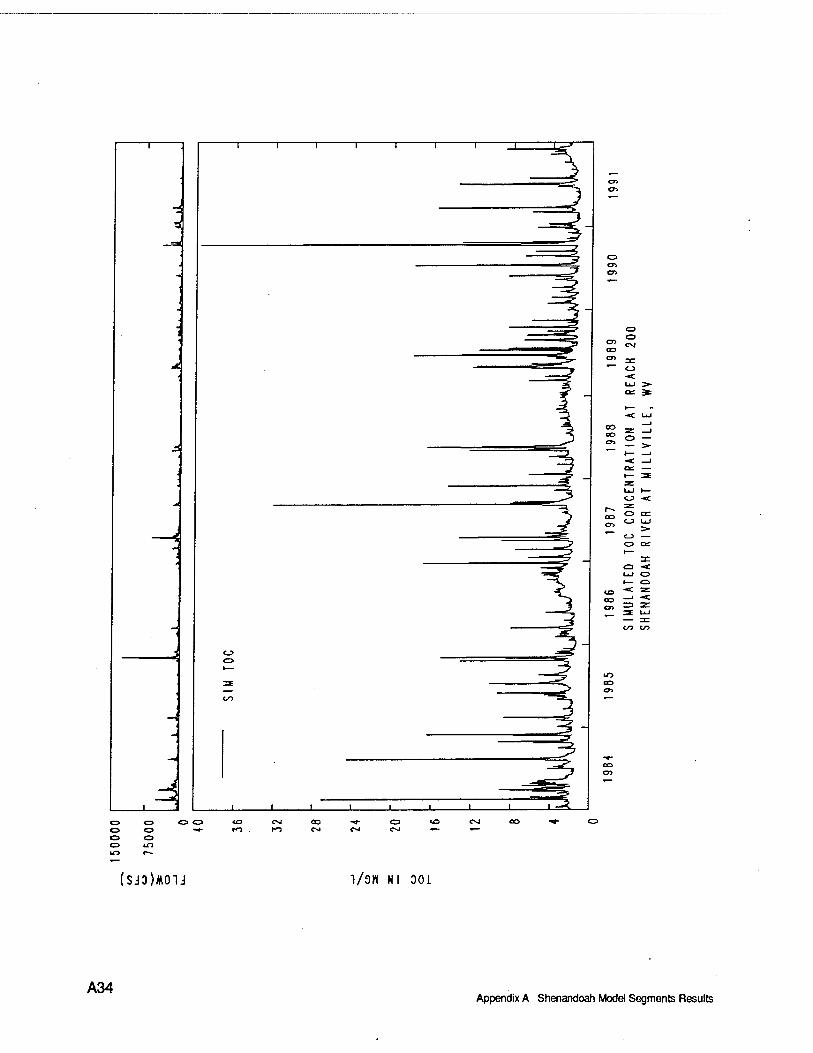
1 1 1 1 -r
A
CD
-< o£ 3c
J I I L.
S = -J O —
■«c QtT
cr> " £ "~ C_3
CO Cx>
CO
CO CO
o o o a o in
C*4 ■* O <0 CVI CO C*4 Cvl •— ••—
(SJO)MOIJ 1/9H Nl OOi
A34 Appendix A Shenandoah Model Segments Results
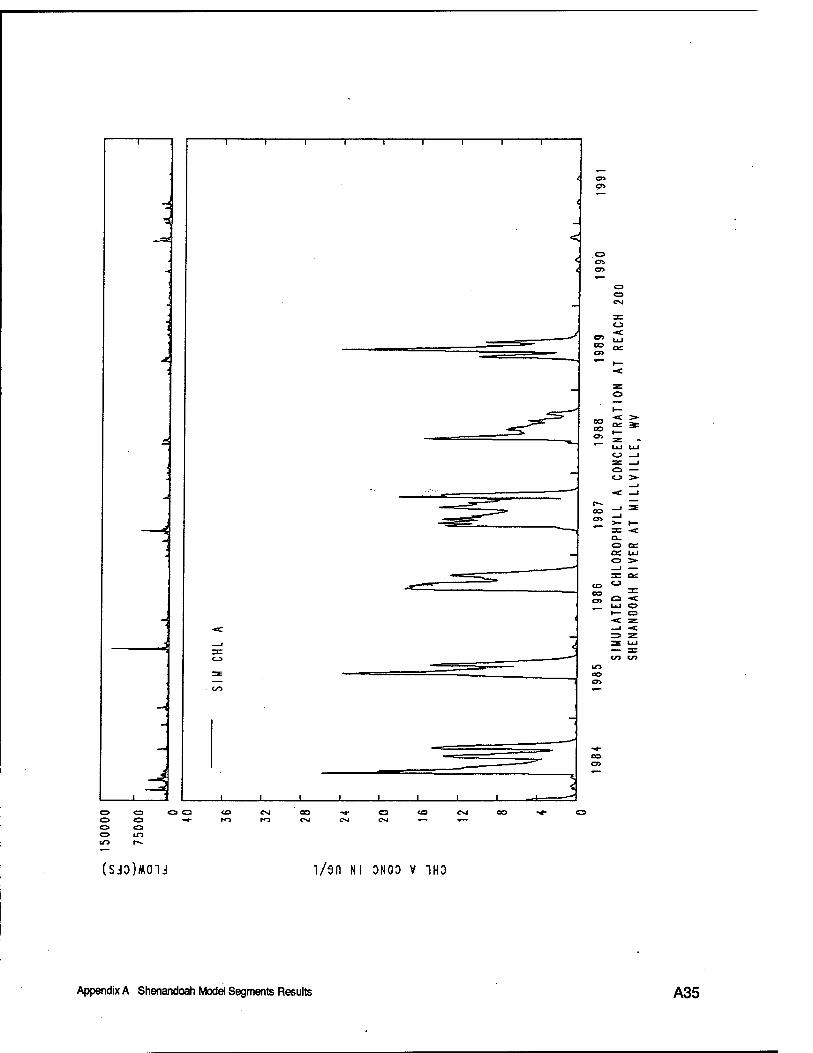
o a o a C3 in in r-*
CM
(SJO)MOU l/3(l Nl 0N00 V "IHO
Appendix A Shenandoah Model Segments Results A35
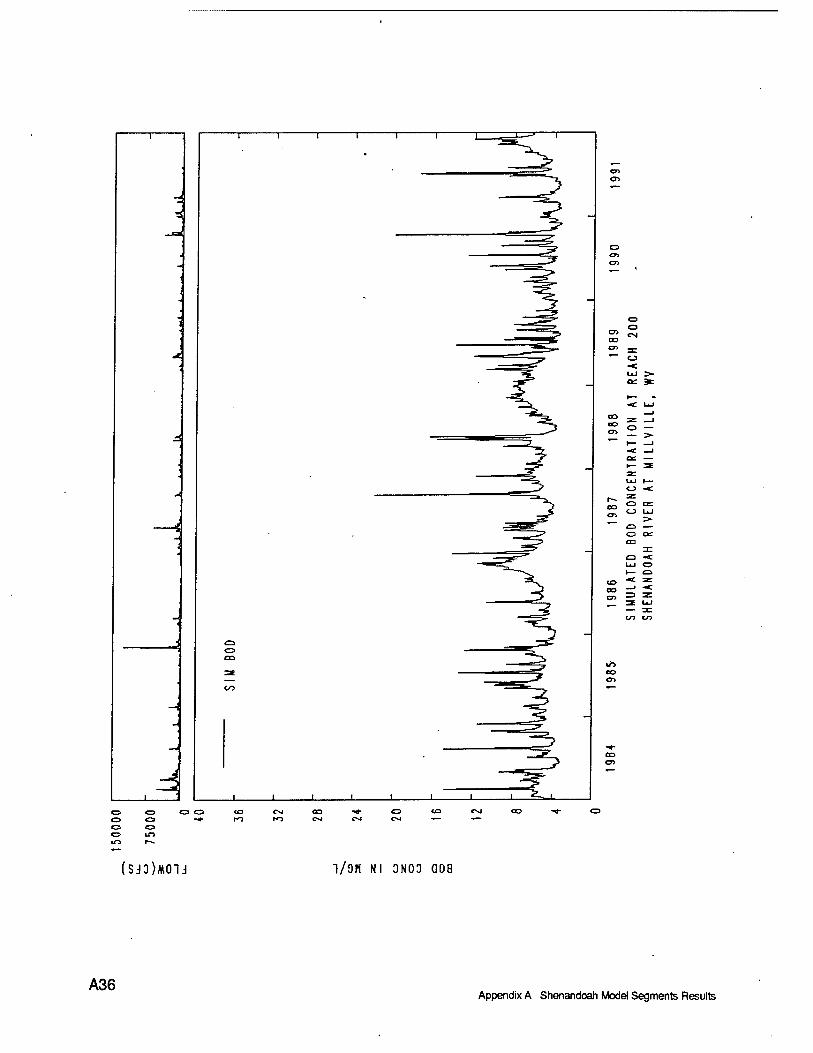
T r
-i
-
d
o a CO
en
o
CO oo en
o CM
Qi *
2 = ->
on
C3 ■«£ UJ CP
to oo en
to
oo en
J 1_ _l |_
o <o
1T3 r-^
OO -<- C3 <0 CXI OO Cvt Ol CXI ••— -—
(SJO)MOU "l/OH Nl 3NO0 dOB
A36 Appendix A Shenandoah Model Segments Results
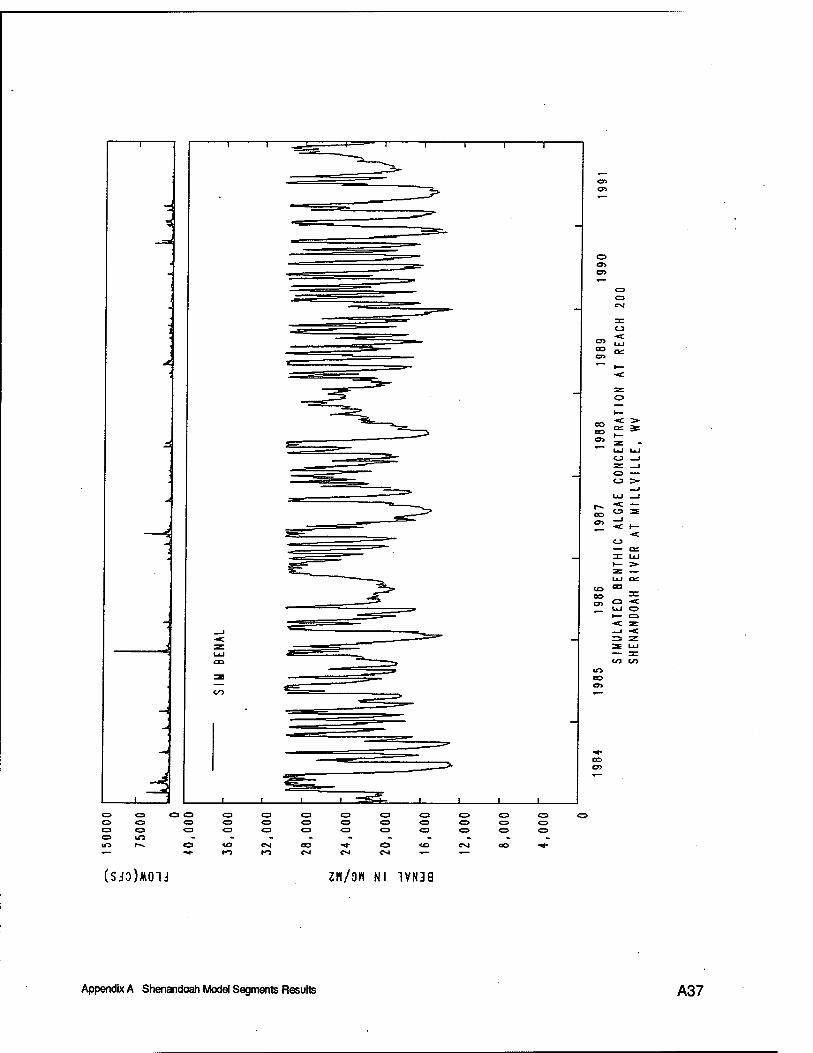
(SJD)*01J ZH/9H Nl 1VN38
Appendix A Shenandoah Model Segments Results A37
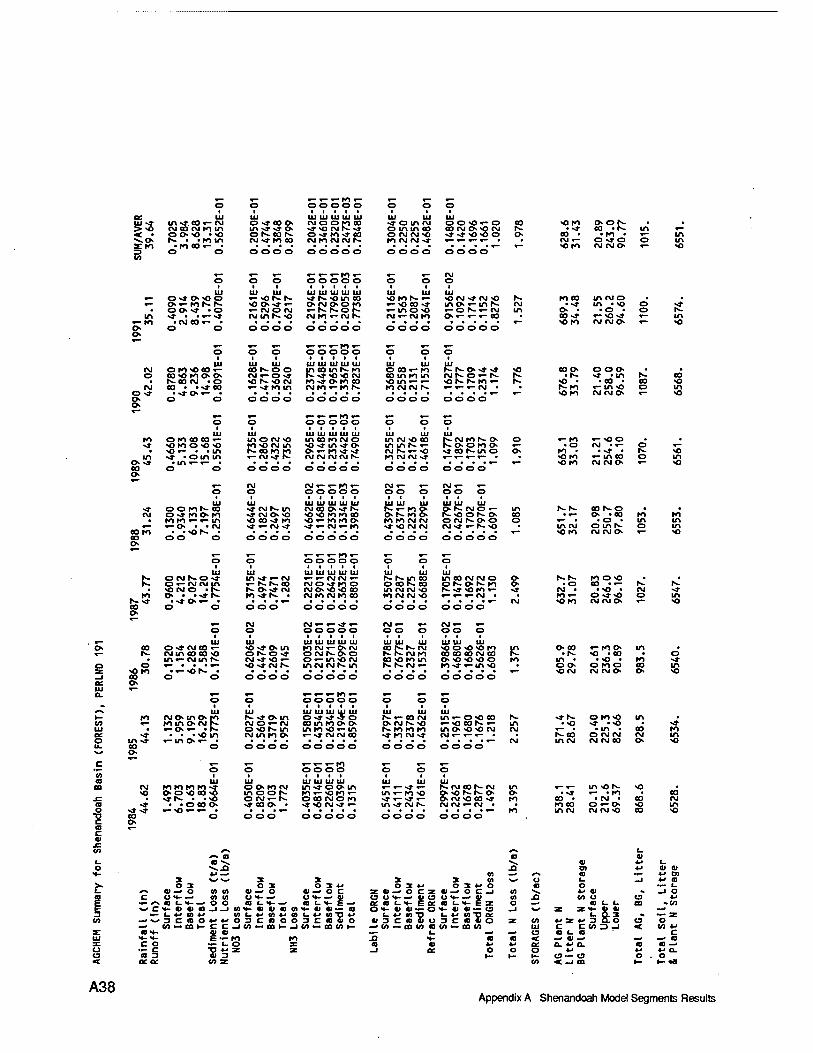
S3 in- UJ
i CM to in o o -o • -o h- • -to in
• toco»- • o o
o «» oo o in «* *» o OSON CM >»to co
o o o o
HI HI III I nioomn
O •* to «» 00 PJM(MC\1S
o o oo o
»» o m CM o in in oo o CM CM -o tO CM CM «»
o o o o
oO'O'-o 00 CM O ^ CM
o o o o
R o
oos 00 •!--
«OKI ,- • -» oo • !-- m «-
oo • • to • «- in CM •- o «» o o in <o to CM CM o «- -o
«- »-CM
o o
0<f»<00 O»- to t^ N- O O «» • O «* • • «- v»
• CMOO«- • O O
UJ ui
t-NON IM tnf- -o
o ooo
lit III III III HI >» r~- >oin oo o CM oo to
CM Kl «-CM K-
OO OOO
UJ UJ
«- >o oo «* <-ino« CM «-CM tO
O O O O
« CM -*CM <0 N- to 00 m CMO • • in»«-mN CM • •* m • <o o sf ^OS>-N in o • • o • o h- o»- «-«- oo ■ oo «» «- »o *» »— in »— <o to CM CMO »— o o o oo o
CM O
CM o>» O O
OK1<00<- oo >o to o o S- oo CM . o 00 • • »* 00
• »»o«- • o o
UJ UJ oNoo CM «-O -» <OS<ON «- •*to in
o oo d
in in HI HI in in co mh» to F-. »r -o-o CM K)>»O>K100 CM tO »-IO l>-
c5dddd
UJ UJ OCOi-M oo in to in >0 in «- «- to CM CM r>-
o o o o
o
o o o o
S- N-fO «- s 00 o o o o ■ • • f- •* -in h- oo
*o • • oo > oo *o t^ to «- m-o o in «O tO CM CMO «- *0
o -» oo o
UJ o to €0 00 «- >o to o <o <o •o «- • • in »» • o in in
• m«—«— • o o
HI m HI HI in in oo to CM o -0~» m»» o O «— fO>» ■* CM CM CM CM t—
oooo ooooo
to "O CM in K oo to to «— CM-* K-
m CM "O oo
CM t«- «- >o tO CM CM -*
oooo oooo
t^cM to r— o N- o o to o -fCOSino
o
o
^M r-OO • O CM •«- O «-
to • • «* • t>- «o -o ro «- in oo o in >0 CO CM CM O «- <0
oomso o«» to o to to to «-«- in «- O • "CM
• "OS • O O O
»» CM N. in stNOX! •o oo -* to •» »-CM »»
III I Ill HI CM CO O»» N- «o -o to to 00 «o «- to to o -»«- CM»- tO
oooo ooooo
UJ UJ UJ F- «- to o o f-» to o IO tO CM CM •»•OlMfU
oooo
UJ UJ UJ or- CM o «- t-- >0 Of- O O CM t^-O O CM »» «—I*" O
ooooo
h- K- 00 t-O •«— o »oo
in CM oi/tN o in •O IO CM CM O «— -O
ooooo
Ul Ul Ul Ul UJ UJ 111 Ul UJ UJ
fc OMNO-t in •» »-CM »- «— CM CM •- f-- r-~ui oo O 00 S- 00
in 00 CM CM o o t--t>- to o -o O«- CM CM u-1 «O CM O "f- O • ••* K
«- N-t- co CMO »»tO O ososn o • o 00 •»- r^ I- ON» CM CMO -O-O 00 in CM CM <o t--» -o to •- ~» CM • .^) . CM
. M to>»r-- . CM IO CM tO 00 IO CM CM vO «-»- »-CM • to «- o »»^ O f^>» • •*o«- • CM -o to CM CM O »— 00 o
O O ooo OOOOO oooo OOOO
«— «— o
1 Ul
CM o
1 Ul
(M<-r--tT- OOOOO ■ ■III
Ul Ul Ul Ul UJ E-0
2 E
-01
E-0
1
E-0
2 E
-01
E-0
1
o 00 ON* CM 00 «- «o v»o m tO CM *- O CM oo r» r>- CM r^ r^ CM to
<o o -o >o to IC ooo •-too m N- CM m CO CO -O O S-O v* OlMStKO 00 00 00 CM 00 • h- -o «oo •
in«- CM in s- (M-t«t- o»- m-o CM oo -o to m o -o -o >o o to m • . -o ■ to o O «•»NS in CM CM t>- in f^ S.CM «- M-» »-in -o o o o too 00 St »o to "". «^ «o r»!". ■ • • • -O CM CM CM O o —1 00 O o OOOO ooooo oooo ooooo Of o
o -* in •O
UJ «-
ooooo rf^k UJ
fü %» O in ÜJ ÜJ UJ UJ ÜJ o>»>»5 o
UJ Ul Ul 1— to CMO mo to ^ •- 00 CM Ul«- 0<0 00 CO to in OCM K- CM O»- CM oo into o o ONN<0 «--o oo f>- «- UJ • «-0 »- • K- o<iSin into -o»- m N- to to to in o <o >o CM ec •* • • >-o in CM in to o »-»» CM CM oo »» IO CM »» CM »- «-«- • o in ~» «— in o »- • u. 00
o o oooo ooooo OOOO oooo
C »— ._ ,_ «-»-»-to «— «— ^_
V) (0
o o oooo O O o UJ Ul UJ UJ Ul UJ Ul UJ w
CO CM to to to to ■•» O O IO CM in -» o o in t»- CM 00f- CM -O oo*ooo>o moos
O CM»- S. to »- oto «- in «- to «O
J= >»K ■ -o O 00 CMO to »»»--»«- O CM *0 00 -* CO >» • • O 00 o >to» • >»<0 CM«» «- in -» CM f-- CM CM »-CM • o ■* »r «— ^o »— »— • • • ■ »— ■ • ■ • »—
? 00 o
o ooo ooooo oooo oooo
>*h- o to>o m ■ • <o «» -o ■ N»
• in • co to t»-co O CM CM CM in mcM CM CM CO o •o
m o to
»-«- in -o t*- -O • • •» «- «to • 00
00 • • CM • 00 CM to co o»- o o m mcM CM CM <o CO <o
CO »-
^\ CO I. «0 ^s o ^.ja <»- 4-» —»
2 V* v-» 3 3 3 3 >. O 3 O 3 O 3 *J O 3 «-» o L. ^N «—< o «1 U) 01—> O 41- O C z «i — o c z 11 — s C OH- — Ul B) OH- —' UH-w O
a CM- —• a t- *- £ —• a: co c H- E« üt-
•"««L»- O O «J u g v^ C H- O «1 9-1-1 »«- « « a BV ti *— co O H- «1 Cl — o H- Cl
~- C *-> CO «-* 01 LV«M0L4>«]T]iJ scaooDcaSo II 3 C CO S o
c ♦-» CO -• w 3 C «0 O *•» *-» o 3 C
—> CO x CO »- C C—!</>•— COl-_ltO»-CD</>l- — CO — 00 CO CO CO *- z co«»- V «I «»- 1- Ul H- **- to to J3 H- 3C c o ^- «- o z a o U C9
•- c CO D "8S z —i a:
< oc at co se
a 01 ^ 01 4-1 c_ ja O) 4-< 01 01
0) ^s CO 4-» Ol IA u t- -J 4-> O
3 *» O CO o ••- C_ O C -l (A ^■» 4-i 01 -J O
Cl« ■a J3 CO U C3 4J o a L. L. CO »CO
«i— a -i z ZM- 9 01
coo L. a .3 •— z
z CO «J z v 3 £ O (3 o CO (0 Ul c C «0 3 —1 < CO »-»
u CO L. CO c CO CO < «1 —' a 4-i *J a: a •M O. CO a —• o o o ♦J 4-» 4-> O. t- l— i— (3 a O . o
CO < -j m »- t-oa
A38 Appendix A Shenandoah Mode) Segments Results
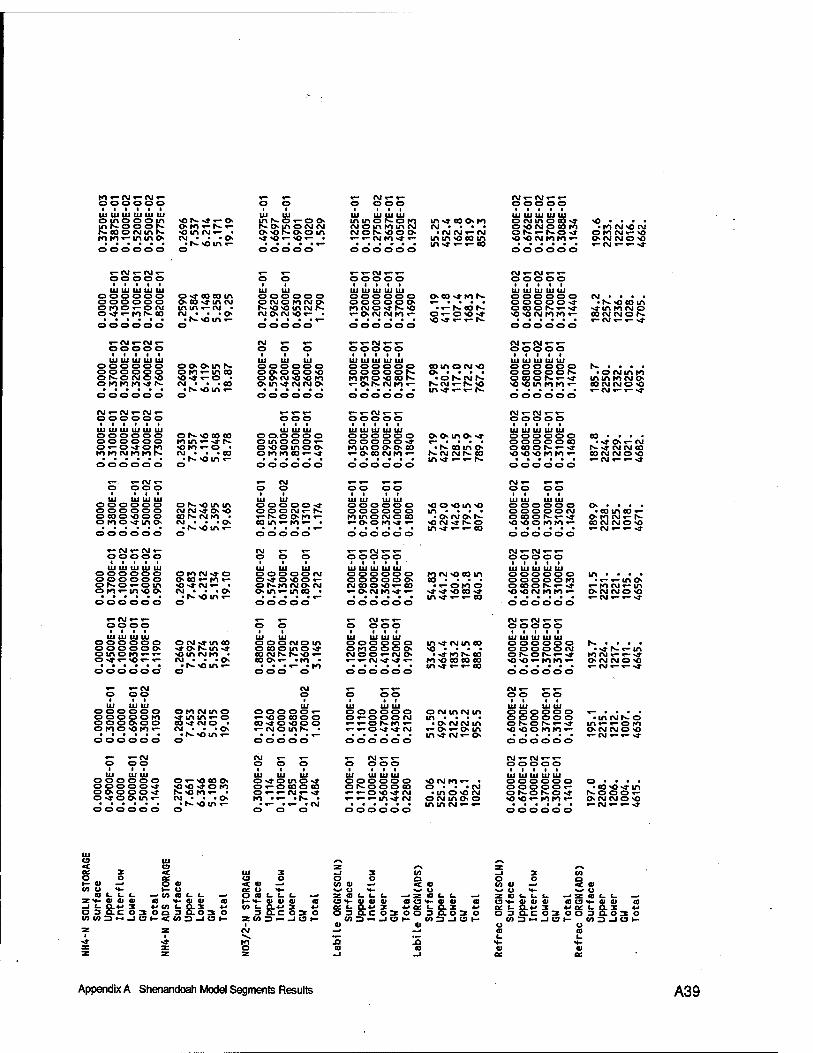
ro«- (M «- CM «- O OO OO O I I I I I I
lit til HI til III It! oinoooin in S. o o o f- stooiMink roro«-minc^ o oo oo o
UJ UI ON^i-» inNOi-O» Oro«-|s-«- r» ~ "' CM . . .O
• is. so in «- ... - o o o o oo
. oin OCM CM
«~ fM «-«- o ooo
I III UI UI Ui UJ mmosoro iMOuiminiM NONOOO «- *- CM ro *» «— o oo o o o
in»» eo oro CM • ■ • •
• fM fvl»- fM mm ooo in in%» «-«- co
fM«-fM«-«- o oo oo I ■ I I I
ttl III III III III ONIAOD4 o <oru o co ro OS<-SOvt <o «o CM ro ro «- o oo oo o
■ ro (M«O (M OrO CM«- «5 OCM (MO O «-CM «~«-s»
«-CM «- CM«- OO OOO I I I I I
HI III III III III O O O O O O O OO oo o OMOi-ON o •*«- ro r- co oooooo
o»t oooo in O CO si-in CM mm «—fM • CM • • • o>
■ •>- so in •- o
UJ UJ oooooo O CMO rofM o Is. NO NO in CM Is. f\l OfM SO«- ■
O OO OO
III III lit III III oooooo oscostrors. oooooo «— • • " " miMOsts<o • «-rs-eois. «-OCMfMrO«- Oi-COst ...... so s» «— «— Is.
oooooo
III III lit III III oooooo O OOOO -J o oo o rs.«—s* ««NMKH- o oo oo o
CM,' • • . • 's. so eo m
s»m ro CM o COCMCMO fs. «-CM*-«- s»
UJ UJ UI UJ UJ oooooo o o O m fs- oooooo oro«-moo Ors-OCMOsO so>»«-o • o ro ro ro >* rs. CM • • • co ...... • fs« so m «—
oooooo o
IM «— «- ooo
O OO OO so o OCM soso ro »in-» fMfM o OOOOOO
«-«-fM«-«- OOOOO
ooooors. ro roo so co K «- o fs. CM ro «- oooooo
eomorviso o ....
• O rs. fMN. Is. CM «-ts-sO in\t<-t-K
CM «-CM«-«- OOOOO • i i i i
UJ UJ UJ UJ UI OOOOOO ooo o o rs- OOON«-st «OOUlMMr- OOOOOO
Is. ... . • o (Mm ro
mmrofM o coru CMO so «-CM «-«- s»
UJ UJ UJ UJ UJ UJ oooooo oooooo 0<-OstOM ro ro <M ro ro rs. oooooo
o Is. so co oo ro in «- s» N- so ro «-o ■ fM ... oo
• fs-soin «- o
ooo ■ • ■
UJ UJ UJ o oo ooo o mo o o «- o soo mo o oioro co«- s»
oooooo
UJ UJ UJ UJ UI oooooo ootno-st O O O O O s» «- . . . . roinoooco «rs-oomo «-OOOCMrO«- ls.fMfMN.0O ...... in s» «— «— is. oooooo
UJ UJ UJ UJ UJ oooooo o oo OO CO O 00 O Is-«- s» sososororo «- oooooo
co ... . •s» O«- CM
Is-sf CMfM CO CO IM NO sO «-CM «-«-«a-
UJ UJ UJ UJ oooooo o rs. so m m OOOOOO fMfMsJ-OsO OCOOsOOO COIs-CMrO • oroos»mo CM • • -o ...... • rs. so in «—
oooooo o
III ttl ttl lit III OOOOOO OMNstO oooooo ooo«-ro«- o rs-o «-o m so sj. CM «- « oro«-msoo fM • • .o ...... . is. so m «- oooooo o
«-CM «-«- oooo I I I I
UJ ui ui UJ oooooo ofMstinco oooooo s»ors-ins» o in o ro «—«- so m tM ro • o s»«— so «— «- CM ■ ■ «o ...... . is. so m «—
oooooo o
«- «-fM o oo
• II UJ UI UJ
oooooo orofMmo oooooro »*inin«-o OOOOOO COstlMO • oroosoro«- CM • • -o
«- CM O O o o oo o o oo UI UI O OO OO s» O OO fM «- Is. «- |s-o oro «- co m«-ro»- • o oo oo
UI UI UJ UI oooooo oooooo ro mo NO co «- oo rost «- oooooo
so o so m so in • • • •
■ O fMO fs- sOfM «* ts- O ms» «-«- co
UI UJ Ul UI oooooo O O O OO fM O CO O Is.«- s» NO NOO roro «- oooooo
o • • • • • co in co «-
oro CM «- is. CO CM CM O-O «- fM «- «- s»
fM «- «- ooo o oo oo
(M «-(M «-«- o o o o o
UJ UJ UJ O OO OO fM O sj-o sOO «- O Is. to CMO fM Oin«- in CO •
o oo oo
III III III III lit oooooo oooooo CM COO SO«- CO «- o f« ro s» «- OOOOOO
ro IN so co in CO ... .
• «-oro o stsfOCOst inst«-«, oo
lit III ttt til III oooooo o oo ooro o ooo rs-«-s» NONOfMioro «- oooooo
in ■ • ■ • • «-«-mo
«-ro fM«- m OCM CMO NO «- fM«-«- si-
«— «— o o
«- fM «-«- o ooo
fM«-fM «-«- o oo oo
0.88
00E-
0.92
80
0.17
00E-
1.75
2 0.
3600
3.145
UI UI UI UI oooooo o nooo o fMOO «-CM O «— «— CM "st sf «—
oooooo
ins» tM in eo NO ... .
• s» rols. co ro NO oo co eo in NT «-«— oo
■ tl III ttt lit ttt oooooo O OO OO fM O fs-O tS.«-N» so so«- roro «- OOOOOO
rs. ... • • s» is.«- m
KlN«-«-st OfM fMO so «-CM«-«- s»
fM O o oo
fM «- «-«- o o oo
OOOOOO • N.Nom «-
o oo oo «- «- soo ooo o COst O NOO O «- fM o mfs. .
o oooo *~
oooooo ofMiniMin o«—ooofM m • ■ • • «-«-ois-ro«- -orMfMrn «—«—Os»s»fM «— O «— o m
• . . ■ • . m s» CM «— o oooooo
ui ui ui ui oooooo oooooo o Is. o rs.«- s» sosoororo«- oooooo
• in CM is- o m«— «- o ro OfM (MO so «-fM »-«- st
ui ui ui OOOOOO O«-N0C0O ocsooos» so so si o ro ooooo-st is-soro«- • o s» o o in «- CM ■ • "O ...... • is. so m «—
oooooo o
Ul I
UI UJ o s»o mo s» o «-o co o oo O «-«- CM«- s» ro •«— »is- •
• «— . «— • fM ooo
UI Ul Ul Ul oooooo sotMro«- • Ols-OOOOO O • • • fM «-«-OsOsffM ■ in O NO CM «-«-«-in s» CM ocMinoo
• ••■•• mmcM«—«— oooooo
CM «-CM «-«- ooo oo I I I I I
III III III ttt III oooooo o oo oo «- osorsost so so «-roro «- oooooo
o • • • ■ .00 so s» m
SOOOt- OfM CMO NO «-CM«-«-s»
UI C9 Ul ^N «c o ^N DC 3 «I Ul 3 -1 3 CO O O ec a o o o o 1— 01 —• O 01 < at —• CO 01 —> < 01 CO O NV. 1— o a: o H- N^ O H- N^ O
C UL L —< co co e- t- —' O CO c c c mm* z a c c c —' z «a ZH- 0» 01 01 CO H- OJ 01 CO
«J co i. a. 3 «J O o 3 fXO 3 O
i—Nt. a» oi ai co L. a.« 3
3 Ec O 3 m 13 1- 01 01 01
en c. S.*» 3 O 3 EC O 3
«0 O N>- -J <- Q.4J 3 O 3 O.C O 3
*J 4J Of L. o O O 3
»MD--10H<<n3-10H zns«JUH U3~JO 01
1- U) 01
z z CM 1 1 S
st s» ro J3 J3 z s: o a a
C L. —«
O CO 01
c u —>:
o < ai
a L L —' CO o H- 01 01 CO OH-CUOJO) COOH-CJIOI CO VCCLQ.} ** Oft. Q.V 3 VELai 4J 003CL030 03(XC03003ao30
JOh »3-iai- CO 3 _l C3 H-
01 01 DC
Appendix A Shenandoah Model Segments Results A39
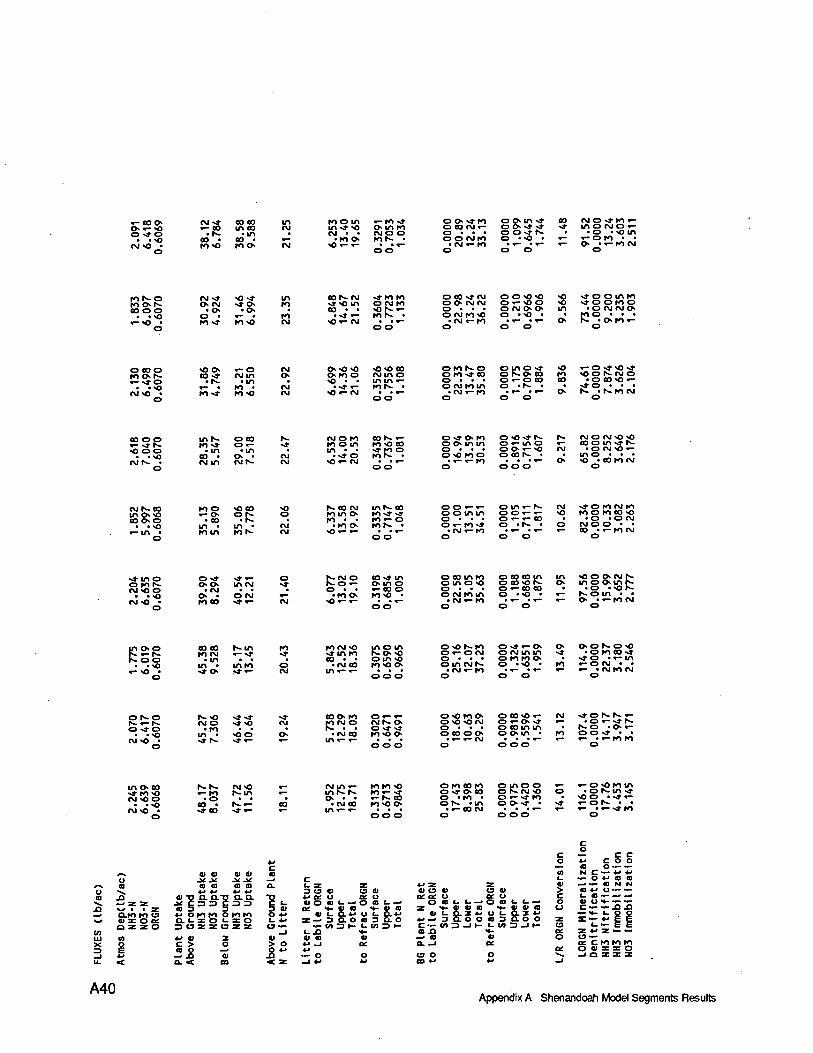
«- ooo o«-<o o -*o
• -<o «M<0 •
O
2« eo oo in mom «-ro -» in oo CM in-* «O o m ro
• N- CM • • NOO 00 • 00 • *r- • ro O roN- • ro «o ro o CM «O«-«-
oo
oo«*ro o»m<» —> O -" - oo CM o •* ro «— O 00 CM *- O O-* «* «* lAOIMOi- O • • • O O-* N- • -O •««! oocMro o -«o • «- >-OM • •
■ CM «— ro • *—•«- «— o • »- ro CM o o o o
ro N-p ro r>r- oo oo . .*> «- <o .
CM •* «o •* o CM «* o
• O • f> o • »- • ro-* ro-o
in ro
oos.ru -* *o in -S OO'*«! OO««
OOCVIN O <r--OO O • • ■ O CM O O in o CM ro «o o »<o ■ •
• CM »- ro .«-•»- o o o o
•* o o in ro v» o o ro o
• o r\j <M o roo
o coo WON «- -*o CM<0 •
o
«» «-O oo «a- (Mm
• N. «in *- • ro • ro ■* ro >o
o*o*o <o <o oo •>ro o Nino «o • • in in *-
• -* •- ro N- • «o «- CM • ■ «r-
oo
oroN-o o m o •* o ro •* co OSO.« o • • • Ot-OOO o IM rom o -N- •
• CM •*- ro • *— • *— o o o
>o »- o ■* «o •* ro »o o N-CM o oo •oo>o<-
•4-0 • • • o N- • N-rO CM o
00 oo in r— o eo «--*N- ro •* o «- <o o o • in • in
oo • o • IMS ■ CM m (MS
«- •* ro o ro oo N- «- ro o in ro <o co in • • -j-ro o
• -* o roN- • •o «- CM • • %—
o o
o**oro o*o*ts o o in in o «—in o o • • • o o«- *o osoroo ocos •
• *— *r- ro • • ■*"" o o oo
N- CM O CM -O *0 «- coomstN- CM • O CM «O «—
in o • • • o <o • oo ro CM
o
m o* oo o<
ro o "-» • eo
<o co •o N-00 CM
°.fc o ro in o ro • •
CM • ro o- ro N- CM •o«-*-
mN- eo ro-* «* ro»- o KIN •
o o«—«- om«-N. CM -*orocMro o o in in o o •—»- *c ro o ro co *o o • • • o «— •— co • «o • o CM o»— ro -* o • N- • o CMOO««
• cM^ro • »- ■ »- «- oo -«-toiM o o o o
o •* -* «- o NlMO oo-j- in O fO N- o o in CM •* N-O «- o in o
• CM o • • • ■ -o O • OCM *T—' • ro o ro<o •
CM -O • ro eo •*«- CM -o»-*- • • -r- O
oooinro o oo oo in o in o-o o oo *o N- o • • • o «- eo oo .. _ co CM ro in co »*o • •*- Nom
• CM«—ro • *- •«~ *— °* • •!—ro CM o o o o
o o o CMN- m o Oin N-
• O "ON-
in oo 00 00 r«- in ro fOCM <0 in o in N-o <o f- «r-N. ro CM «-■* •* •j-m ro
NOO 00 • • om «o m • inro o • CM 00 ro>o o
«r- «O • -* o .-*«- CM m*-«- O
o<ON-ro o-*«-o o OON.O>O or-oiM ocMinm •* »orooo-* o ■ • • o ro ro o • -*o >«-tn oincMN. o »-o • ro «- o CM • •
• CM •-ro •«- • *r- *T- •- • CM ro CM o o o o
O N-O N-<0 -*•* ■* co o ro 0I"^• N- »-N CM O -*<o CM R~° CMN- O O •* O • ro O -J- -*
in • <o o o • CM 00 ro<o o CM -O • •tfN- •*«- •^ in •— r-
o<oroo o oo <o T- CM .J-ON-N-«- 0*0*OCM CO^^O«* w- »0»r*»*N- o • • • o co in in • N-o • o «- o eo o o o o in • ro o o «* • •
• «J— «T- CM • • • *- «- •■- • «-ro ro o o o o o
in ooo •* ro<o CM «oo
. .«o CM «O •
o
• o oo • «» oo
CM*0 N- in
•* «—
CM in >r- tnN- N- o • •
• CM 00 in*- i-
roro <o ro«— -J- •j-N- co ro<o o
ooo
o ro co ro oinoo «- «-ojoroin o ** o oo co N- CM *o o • o N-in s» o • ro • o«- »a- ro • <o o ••*«- ^ N- • m ocv*t • •* «T-o N- • •
•«— oo CM • • • *— *- «- • *—>* ro o ooo o
c o
01 Cl
co <o
D.K1 Cl X
u
I "U Q. Q.-C
5l = =i
01 s> jut a a
CLO. 01
• z a 5 3 5 oi roo «wororoororo o<-< oo: aLio i-io t- <w z o 30ZZOZZ a •-
3 O
oi o
13 01 ec o
t- —• o n i- —• - - - a
oi a at cc
o L LwQ a LL-< **- Of « H- 01 M Z H- 0» *» 10 •*- Ot 01 CO
«LD.VULO.t' IILaiVULO.}» —' 3 aO 8 3 So *J—•3fi00«l30^00 Z— 3 0:o C 3 Ö. O -M3l-L»3f- C~-
_ ^ H- « .0. *J oi 3 ot Ota oi —•co c > o > o «w _i or a. —i
_• .0 oi ^J-^O o oo a.« co <i -i« <w oo *J
tO => -I H- LU3JH
L. — O OI > c o u
o cc o
c c coo o — •-
ra c— <v> «J 4J a at N o — • a *J o — —
i_ ca ••- —• —<
C- —^J XI
O «II _i o z z z
A40 Appendix A Shenandoah Model Segments Results
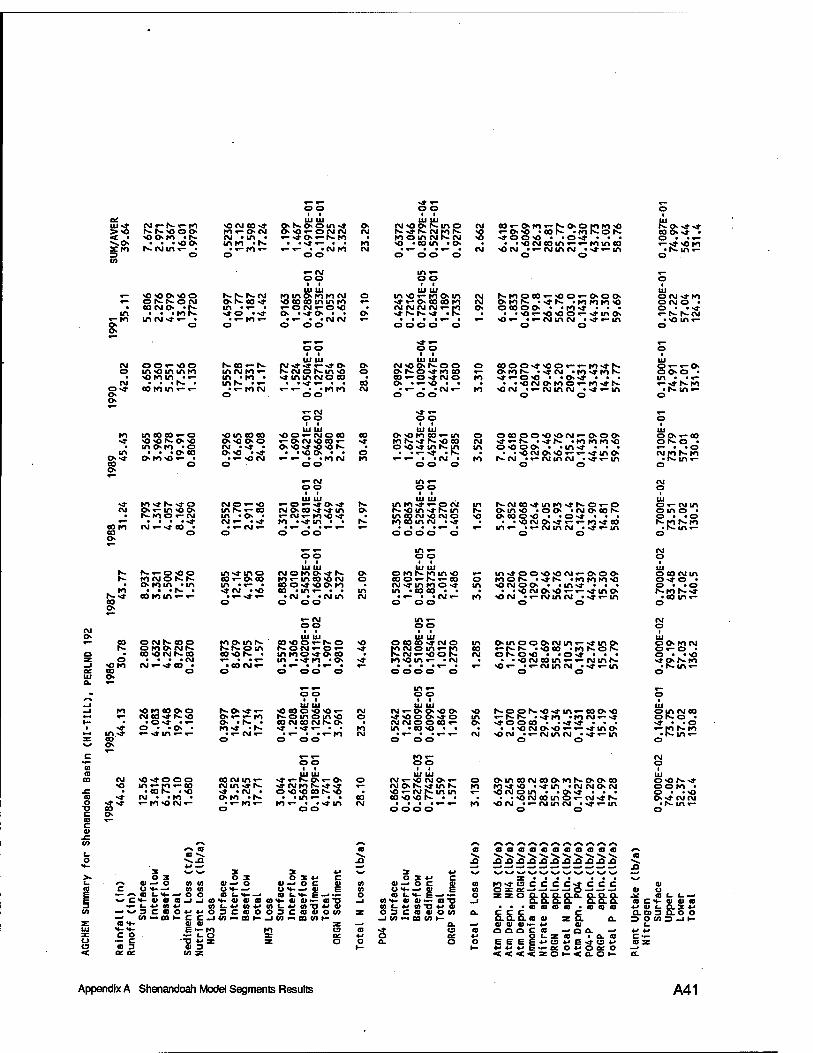
or
£o XKl
CO
7.67
2 2.
971
5.3
67
16
.01
0.97
93
0.52
36
13.1
2 3.5
98
17
.24
1.19
9 1.
467
-01
0
.491
9E
-02
0
.110
0E
2.72
5 3.3
24
o IM
Kl CM 0.
6372
1.
046
-05
0
.857
9E
-01
0
.522
7E
1.73
5 0.
9270
CM
3 CM
«— in
«-KI o o
5.8
06
2.2
76
4
.97
9
13.0
6 0.
7720
0.4
597
10
.77
3.1
87
14
.42
0.91
63
1.08
5 0.
4289
E
0.91
53E
2.
053
2.63
2 O «— 0° «—
0.42
45
0.72
16
0.72
91E
0.
4283
E
1.18
9 0.
7335
CM CM O
«— «— «— o o t 1
st«- oo i ■
CM O
(M Ost o> O
8.6
50
3
.36
0
5.55
1 17
.56
1.13
0
0.5
557
17
.28
3.33
1 2
1.1
7 UI UI
cMst st «-st o NIMOSin'O st mm CMO co
«-"«-* ■'"•KIKl O O
o O
CO CM 0.
9892
1.
176
0.10
09E
0.
6447
E
2.23
0 1.
080 o
Kl
Kt
«— «~CM O O
St *- o o
Kl St
in Ost CO o
9.56
5 3.9
68
6.3
78
19
.91
0.80
60
0.92
96
16.6
5 6.4
98
24
.08
1.91
6 1.
690
0.64
21E
- 0.
9662
E-
3.6
80
2.
718 CO
st
o Kl 1.
039
1.67
6 0.
1443
E-
0.45
78E
- 2.
761
0.75
85
O CM in
Kl
«- CM o o I 1
m «- o o i i
st <M
COM CO o
2.79
3 1.
314
4.05
7 8.
164
0.42
90
0.25
52
11.7
0 2.
911
14.8
6
0.31
21
1.29
0 0.
4181
E
0.53
44E
1.
649
1.45
4 t-- O
«—
0.35
75
0.88
63
0.52
54E
0.
2641
E
1.27
0 0.
4052
in
«— «— «— o o
in «- o o
UI UI r- i^«-o <oo m^mo (Mono>4S o 0- KICMOM^. eo«-oco KI «-ineo«o CM o . OKim «m in •«— • tOO-t-OO.M •
. •*• «»CM «<o in N-st MMint-«- • «-st«- •CM • •(Mm CM co o o o o o>
«-CM o o
CM o «—
1 1
P> OlMSOO Ki oinr«- ' t-t-oin
O-OOr-NO •a r- OIO<MMS t— 0CM«-0 «- •st
o . eo <OCM r>- co »x)S • inioo sto co z o .... CM w— . • «— in «st KI «o «a- _J "OKI cM«-st co • • COCM«- «— or CO o o o o o o UI o
UI UI o Kit— pi in «o «- eo o«-K«- co o CM st in KIO st in in • co co • • *
• «- • .CM «- Kl o o o
UI UI o coco st CM o m RCMO in«-Ki co
Ni-«Ot> CM Ki-om «- -CM •
C0«-OKI«-t-OOKIKIj0 <-o«o «COS- -nKos st O O «O • ■ O «4* • • •
• • o CM co in «-«-KI in co >0 CM »«-CMincM ••»«-in
o o
r--KIOeO«-«00«-000 OKit>- »str- »KIKIKHO o co o o • • KI st • • •
• • *o«- «o«o o«- stin o «o «- •«-CM in CM »st«—in
o o
eooostsoo«-«-Kistr> OMOS 'SfCM •KIStKllV st «— o «o • • o st ...
• • «O CM O K) O «- Kl si-1>- vo CM -«-CMincM '^«-m
o o
OCOOO«OM>CM«-OOO sf«-f>- '-JS •KtKIKIvO o«o oo • •in^a- • • •
• >«3NO«OT»T-stinO» s-CM •«-CM in CM • st«-in
o o
r--CM00sMnKisi-l>.o«-o Om-vO -OO -NOON 0(00*0 • 'Ost* • * ■
• • -o CM o -a- «- «- KI »a- co in«- »«-CMincM »*a-«-in
o o
instOO>0>OCM«-000 Kior- .«a-t-- •KIKIKI*O <ONOO> • • in st ...
• • <o CMO<O «-«-stino <o CM »«-cMtncM «sr«-in
o o
oinooocMin«-stino «-N.f- "OCO -MSOS C5 l^- O *«0 ■ • *^ "»i^ ■ • •
• • >o CM co in «- «— CM in N. «o«- •«—CMincM •-*«-in
o o
ui isostst co o st • o • •«- «-St «OKI
• N. in«- o
ui ON St Kl O CM O • O • «St «-(*- N-CM
• >0 m«- o
UI o«- «-o ooo • in • ■«- <-jtS«
• N-in«- o
oo «-co O r«. o • «- . .o CMKIN-K1
• K. in «- o
UI o«- cMm om o • p • •© IVKI r—KI
• S-in«- o
ui oco CMm ost o • o • >o f»KI IV st
• co m«- o
ui OO KICM O«- O • o • • «o st Of>-KI
• h* in«- o
-J Kl »OKieooo M>vt<- •O COO <OvO «- CM CM cost »-«o 0«-«-KI h-oinoinvo
CO CM CO CMN-O o
1— •Ost •«- o •r»i- 1 St o • -o • KISt •S Kl
in st «-st in «-«- •«- CM«- . »- . »«-Kl CM Z CO O o o o %^ o
c c— «—
ID
OO
CO CM <o sto o o co CM m«- o <o in «-KI«-CO
• eor- ->o CMin stN- st CM Kl 1*-st st «—
.e st • CM • O -O «O CO IV «o a -a- CM • »Kl • OKI •!»- • • in«— • • co o cS**
o
«-KI>OCM«- •«-Kl«- KI «- • «st in CM
c o OO
is c IP
«—
CM CMO O 00 «- O in • eo «o • • •
• «-••«-«- CM O O O
CM «-NO CM O «- O CM o f— «a- in is. KI SO «-CMK.U1 in «— CO «O *0 N- • • •
• •••«—«— Kl O OO O
soos<o>tin»-eoo>o «-tVIV »StKI «KICM«—a- stO OCO ■ .st«4- • • •
• • «o CM 0«0 «-«- st in o ■o CM ««-CMincM • st «- in o o
OinOOCMCOOKlN-OOCO KlSfO • st m ■IMNOMM •O CM om • -Ost • • •
• • «o CM oo in o «- CM st r— >OCM -«-CMincM •st»-in
o o
ui o in CM co or», o ■ st • *o «-KI f«-KI
• N-in«- o
UI
OOKI • O • • vo Ost CM CM
• t»- in «- O
^N ID a ID -^ »»« VÜ J3 *J —<
3 v^ s^ 3 3 4J \* 3 O 3 O 3 O 3 »J C O
^N 01 -~ O (A CO at—' o oi —• o c w ON • OH--»« e (0 I-H-— (0 I-H- e—> —
tt> 01 — c on-—» in n (0 OH- — rt ffl l-H- —' O O o <D C wCI-lltlJJj C0H-0l«ICS«)H-4iai— «DTJ -J 0) H- 01
«•LPIDf CO scaoosccaSoco
0) L. «-* —• w 3 C <D O *-• 4-> o z o 3 C _ n-cüKCC-i««coi-^«xo(nH -I CO — 10 H- 01 01 z <*-•*- e — •o Kl C3 (D st CO — l_ o Z OC 4J o
— C -TJ *» «0 3 Jj 3
z Z O o 1—
a.
met co z
0 c
01 ~- «»•D CO 01
CO CO
ÜJ CDCOCDCOCOCOCOCOCOIDITJ *^
—* _#—*—« —■ —«.^ w —• — .^ —* ja
« co Ki^a-csccccstccc ^ oi E co o z or—*—•—»—• o —' —' —' oi o
—••— o z z o O. Q. O. O.O. Q. O. O. -a a L. c—> • TJ -i D.D. 5. a; ESS aCH-oioia 4J «J . < . O O O a • g g H VULQ.IV O CO O. CCC C 0.0)30.00 •- S.Q.O.CS0I z a. a. SOMD-II-
a. —> oi oi oi •*- «J oi L. C3 CO OOOCCD —'OO- —' *J 4J or *» Qc-zcD i a. co c■— O O E EEEUCU'E^OP az
i— PP4J E-o: ovött O —» < < < < z o i-< o. o i- a.
Appendix A Shenandoah Model Segments Results A41
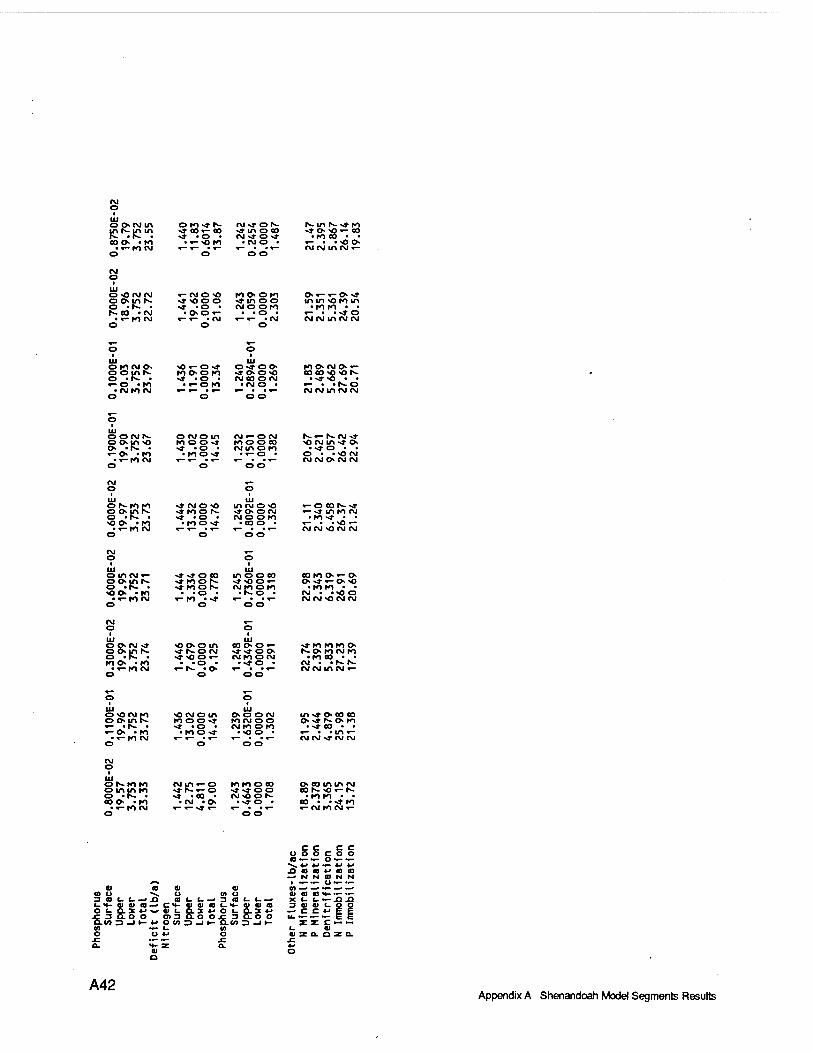
o ON in
CO O • M • «-ro «\J
o
o ro -» r- IM>»OS «*eo«-eo »»moeo «* -o • f\i^»o«*
• «-«O rO i|MO • o o o
I-- m r->» ro • ro oo • ■
*— • • »o o
O >0 N N «-NO*J rOOOrO ochinN ■* o o o •* m o o o «F- • •* "O • N o o ro r>-oo «N • o o «- • -o •
• «-rON «-«- • «M «-«- -N o o o
o»- »-o »» mm >o ro m
• ro ro • • «- • '»»0 rvi CM m<M oj
UJ o ro CM o. ooinN o -F- • «- o • ro
• Nro N o
ui -o.-o.j- ovroo roooro «*oo«o «* «o • rucooiM
• i-oro -NO • «— 1— • «— «— • • «—
o o o
ro o PJ o «- (0(O-0-0S
■ ^» -o • • «- • «r^ o CM rvi m (M <\i
OONS o NO in CM «- O CM h-«- r^ PJ •* o o in <o ro o o -» noon «o CM in ** o O ■!*- • -j- -o • Ninon • -* o • • «- o • ro • no>f • «- o • o • •^o N
• «-ro CM NNONN o o o o
CM ,_ O o UJ UJ of--roro o otn F- o -F- •
■»NO« in N o «o <-oor—» »moN «* O O N «- ** in ro N <T •<=> • CM o o ro • m >* • •
«o o • ro • ro o >* •00 o • «- . .>o «- ■ «-ro N CM CM O CM CM
o o o o
0.60
00
19.9
5 3.
752
23.7
1
1.44
4 3.
334
0.00
00
4.77
8
1.24
5 0.
7360
0.
0000
1.
318
22.9
8 2.
343
6.31
9 26
.91
20.6
9
CM o o
0.30
00E-
19
.99
3.75
2 23
.74
1.44
6 7.
679
0.00
00
9.12
5
1.24
8 0.
4349
E-
0.00
00
1.29
1 •» ro roro o p. o ro CM ro
• rn co • • PJ . •!-- N- CMCM in CM «-
UJ UJ O •OCMfO o Oin K.
<ONOin OO ON invttMom ro o o •* rocM oo 0"»M>M •» «o • Nro o ro • -* oo • •
«- o • ro •KIO^ • ^> o • «- • • in «— • «-ro CM «— «— . «— NN N» N CM
o o o o
CM o UJ o r-ro ro N in «- o
^* F-«- o ro ro o co o co in in N
o in in ro o -F- •
>» •* o o oo r-- >o«- r- v» .00 • N <o o h- • ro ro • •
co o • ro • CM • O • >» o • co • •«* ro • «-ro CM «- N ro N «-
o o o
<B U 3 CO
u co o
I 'DO
J= 3 Ö.O O O)3So0fD0.00 aws-ii-f OMD ji-aoiD-ii- LC/> Z) —1 I— *-" O CO 3 CO •— L. o o «->
c c c c o o o c o o a — — o — — jl o a v o a —• N N CO N N CA —• —>~- —' —• fll CO CO H- —- ~- X C- l_ — XI -O
j= 4-« O
A42 Appendix A Shenandoah Mode) Segments Results
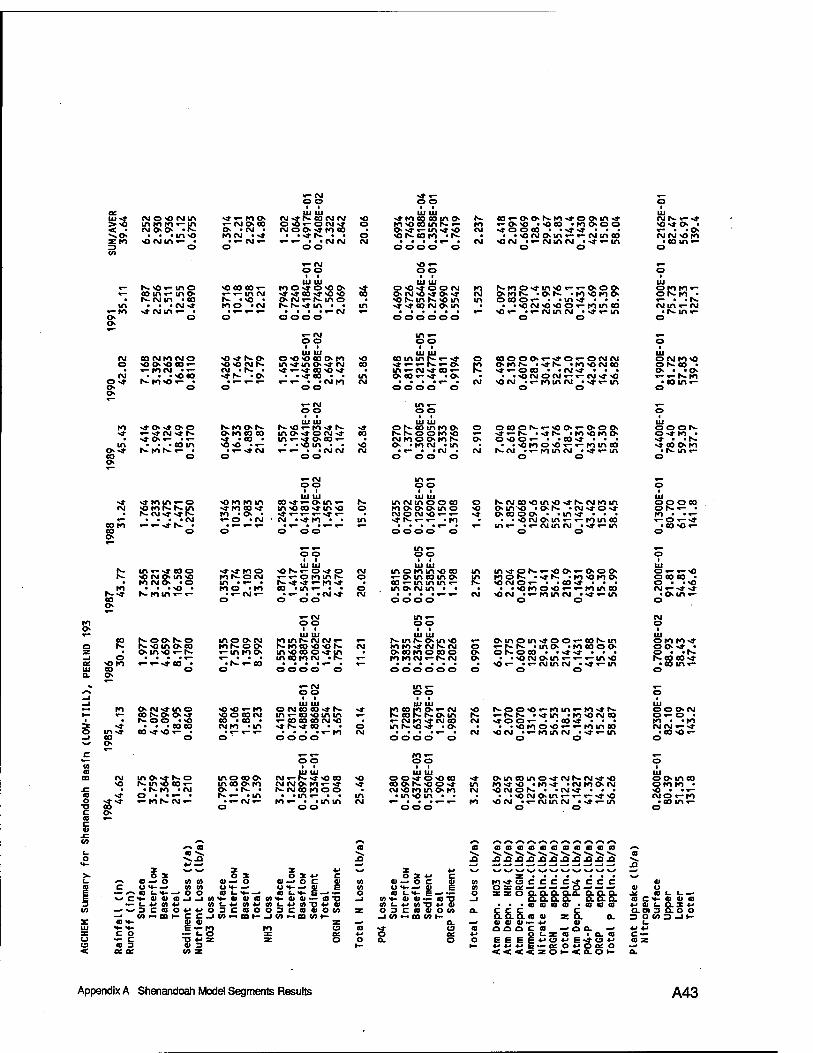
ui«£ ru o <o (Min >«o in M M «—in < • CM o o* • N- ss,o» • • • in so :EM «o CM tn«— • =3 o to
«- N>o<-ino «- Min»-ifl»
• SNIfl -co m • • • CM-*
rKi •* (Mtn «- • o
«*«— M Os «— CM o» oo o. • (M • MCM • •*
■ «- CM«- o
sO 00 CO «— «-«— incst K» • «O • MO 'CM
8:
«-«- • -CM (M
Ul UJ M0s*o«0 Os -* »* oo >* «o «o p.(M«-Smo rs-rs-s* in • •
• ■ • '«—CM oooo
s* 00
M<oe os■*«— in s* <o SOIS.COM «rs. oooo
so«- oo ■ i
UJ Ul 0 4 400N O» (M »0 s* Os «* ■osmr-yjin
oooooo
CM -if O O CO . • «*.* • • • so CM otn «— «— CM in eo
rg SOCM .«-CMineM >s*«-in o o
M rs. to o -* in so«— «- O» o o> CM t»Mls- -or«. «MsOMOs in oooo»- • »in-* • • •
■ • • <o CM <o <o o «—Mtn to «— so«— • r- C\J in CM • 's* «— in
o o
CM Is. «-s» sOst O • «— ■ • OS CM CM SOM
• co in«- o
OMM«- osn ■ «— • ■ rs. CMin «-CM
• fs-in«- o
CM 00 (MM CMO O sO Os sO 00 «—
• «— MCM •«— CM • • • >0 00
os* rs-Mso»- • o> o o>
so«*rs-o> SO so CM Is. CM • Is. ■ s*rs- »o
Ul Ul O so sO 00 O. M ins*m o*s* «M S»S-S* COSQS*
«-«- • «CMM OO
sO CO
Ul Ul oominf^«- s* s* «— «— fs. «— OS in«—CMS* oo«— o>Bfst »o>
OOOO o
O CO O O 0s«-s*0«- OCM CM OK1N '»»ts. • MsOCMOO s* «— O 00 • • CM s* • • •
• • »sO CM OCM «—«—CMs*sO CM SOCM "«-MincM «s*«—tn
o o
R OfMMsO ors. oo • Os • ■©. «-«-•s-M
• co in«— o
M s* Oss* OsO s* «-S* CM s*|s-
s* 0>«~ •«— m • • • co in
Os-* |s.Mts.«- . CO O t>
Is-M Osts. OSM COCO s* • CO • so sO • «—
•«— s*CM o
tu tu fs- SO «— M S* IS. m Os*o CM -» in «—s* oeo «—
• • so in • • «—«- • -CM CM
o o
o fs-oo inn Os |s- r- o OM so CM M O OM |s- Os "M CM >m
• «— • "CM • o o o o
O 000 ON-«—so o>«-OsO o. «- s*«-ls- •-*ls. >M «OM Os Os OsOO«— • • CO s* ■ • ■
• • • sOM OsO «— «— Min CO CM Is-CM •«—MinCM • s* «—in
O O
o o os Os*M • s* • .rs. s* 00 0>M
■ rs. in«— o
OKI CO Os
rs- CM s* s* rs. • • " • CM
«— «— s* rs. •
sOM Mtn s*M CO s* M • 0> • «-O -CM
o o I I
Ul Ul oo «*«— ostn «- in «o co s* in so s* «-«-«-s» «- CM -s» M • •
o*~oo'~*~
rs- o Ul Ul
in CM in oo co M oo> Osm o CM O CM sO«- «- «*|s.«-«- • M
OOOO O
o rs. CM eo so m so s* rs. CM M in so Osin'so • os rs. >CMS*OS* s* ocooos • 'ins* • • •
• • • so CM Otn «- «— Mm oo «— m«— •«— (MtncM • s*«— m
o o
oo o co ors.«- • M • •«— «-0«—s*
• OOsO«- o
|S-s* CO Os
in «—s* oo o sO CMOS in sQ M CMO «O
■ ■ • sO • fs- Mm «— «—
s*s* M O Mfs- O CM in •«— • MO -M
•«-CM«-
O O I I
Ul Ul so rs-«— os* o «-«-o M in IS- ls- ■*.*«- M -* co • in«— • •
•«— • 'IMst o oo
Ul Ul m OM mso co «— Os in oo m os eo «— in in in «— in ocMtn • • oooo
in ms* ON-«-«o os«-oso o> m Mors. >s*rs. •MSOMO. K sOCMO«- • • oo s* • • •
• -sOM OsO «-«-Mm oo CM sOCM •«— MinCM «s*«—m
o o
tu O«-«-s0 o co oo • o • • sO CM«— -*s*
• t> in «— o
o sOM CO Os
ms* CO Os
f> oo. rs-o f.. >o in Osco Osmso «—|s-
O iMstino CO Is. Os Os s* Is- OO -so
CO s* sO «— • O
mo os CM Mrs. o os «-m M Os
«OsO «—M SO O CO CM 00 • 00 • (MM «m
I I Ul Ul
Minr- CM CM« rs. M co so so is. msoco Os*i- m COM CM
o'ddd' •*.£
«-1M OO i i
tu tu OlMtOtOstS m «-co so in m «— co co oo CM so s*|s.s* co • •
• • > •«— M OOOO
s* «— o
fs- mis- om »o M Ms* (MS. CM O COM O 00 O MMCM«-|s-CM
OOOOOO
_ Ul Ul
RSIC£5s_ «- CMM s*CM 00 Lor-sOst • Os
«— Osm otn s*o o«-eohs-m — «-N.IS. -mos -MCOOOS
O rs. O CO • "s*s* • • ■ • • «o CM Osm «—«—«—in so
so«— •«—cMmcM ••*«— in o o o &
oooo
sO fs-O OsO «— M m«— KIstN Is. «-rs-fs. .s*m -MSOCMCO CM -too«- • ■cost • • •
_. • • ■ sOM OsO «-«-Mm oo «— ■ CM «OCM •«—MtncM •-*«— m - o o
Ul OM Ms* OOss* • o • «rs- Is-CO 00 s*
• oom«— o
OO Os CM o«-o • M • -M CM CM «-S*
•00 <o«~ o
o ■D c a c 01
s* s*s* 00 Os
Ms- O J 00«-
-M -CM 13 • • «— • «-Mr«. CM«—
inOstso is. in so oo«-
• F-f- mo coo« moo OSM Os • Is. • |s. «— • m
• «- CM«- o
oo • i
Ul Ul CM «-rs. s* <o co CM CslOsM«— s* rs. CM oo MO o
• • m«— • • M«— • «mm
o o CM «—
^s, CO l_ «0 ss. o ^J3
M- sV -^ 3 X >. O 3 O 3 (- ^■s (V —> O M CO 41—» O 41
C Ul ' 0) 0) ÜH- — O s-AC LH- O O to t- <*-_ eg £ f CH- «U «1 CO —1 —1 M H- t> V «J t» H-
— C- *J Cfl 4-1 V) LtJ MV 0) L to — v* 3 C CO 0 sV 4-» O 3 C CO O O D
—« to •— m *~ c c_i(0'—mi--Jto E COsV- g tu LU *4- sj- ■O M ZEL C O — CO 3= u s- C US Z z a CO 3 < en at c/> z
Ul Ul O Os* OsO CO eo ors. so o s* CM sOM tnOsM
■ tn so tn • >
ooo
s* o>m eomos* tvirs. CMS* so tn Ms*sO «Ms* •CMMOCM CM sOCMOrs. • "CM-* ■ • •
• • • «o CM om «—«—«— s* so M so CM .«-cMtncM «s*«—m
o o
oos mco OM M • «o • • «— CMO «-M
• oo m«- o
CO CD cocococotococococococo ^s> •«s ^ s>, s^ s^ s^ s»^-^ s^, s^ s^ s,, s^ gg SI J2 Si SI SI Si Si SI Sk SX Jl Si SI v. ^ —* —^ —•^-^-^—< ^ —«^^^ jQ
3 «J s^ 3 «J ~ ws^s^www ww www -■ O 3 *-» c O 3 4-» C z • • • • »«.w
—' O C 4> CO 0) — O C 4) (0 Ms*C3CCCCs*CCC 41 ««-—> 4) E «0 ON . OJ E 01 O 3= OS — —'—• —< O —'—' —• 41 O t-1- E —' •- o to t- «i- E — •— o ZZOQ.Q.Q. p.a. a.Q.0. it a L I—• tu 4i •— co xj _i to H- 4t 4i — a -p _i aaaa EE ix act-« tio «J to TJ «J 4i nLw«Tgv« ■ ■ • a a a a ■ a a a VIILQ.K' C eo 4» O to Z 03CDÜOIO O. CCC C 0.0)30.00 «mt/>4— -i to »• m c/> f- a.CLQ.<D(tt z o. a. soioa JI-
Z— 0_ —' 41 41 41 •— «-< 41 l_ 13 CO s* OfflQQClCtO—OO-—• f ** oe >M o o:«-> _Quzaia.ac — o o a. O O EEEivavEstof eo z
i— «— ffpg»-o£OfOo:o <^ << < «t z o i— < a. o t- a.
Appendix A Shenandoah Model Segments Results A43
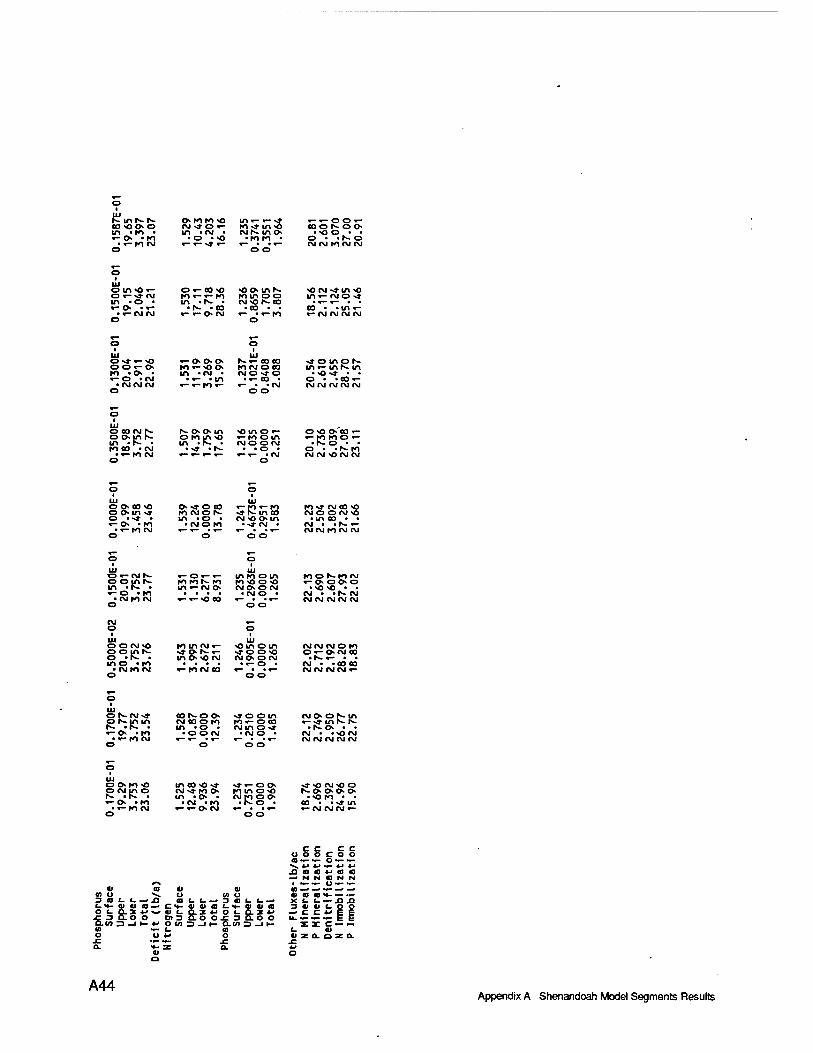
N- in r— f- »MM^J in »- «- ** to -* m ^
«-»- o o »- to««o CM •» O «- COO N- O O in -co • in • (M • cue-, m o ■ <oo • • «-O • ro ■ O • «O ■KIM • O • >f- o
. »-IO »VI »- »-»» «- CM «VI fOCM IM o O O
UJ OlftOi- Ot-«J(M m >o • «— O • «—
•«-CM CM
O »— CO «O to «-«- to in • S- •
• t- -oo r-r-MM
«o »inK to in o o CM>O c» eo
• co • • «- -»-to
o
*0 CM >* in «o
co • »in »- «- CM CM CM CM
111 O «*«- ^ o o«-o to .O ■ «- O »CM
• CM CM CM O
«— O 0s o N- »— CO CO Kl CM O CO IMO-fO
•»-CO • «- • «CM
O O
>*■ o in o N. ini-mNm
• »o ** • • o • -CO »- CM CM CM CM CM
UJ O CO CM S- O^lftN m • N- • ro eo »CM
• »-to CM o
NOOin onino in • N. •
• «» • f>-
*Omo*- «- to o in NOON
. . O • »-»- -CM
O
o <o o co «- «-flKlOr-
• s-o • • o • -r— to CM CM <0 CM CM
OOsCOv} o om »»
»-JOB «-pi«- to «»r>- in eo
to»» CM co *o KINOS CM O O CM -O
o • sr • in ■ o • CM *o o in «- o» ■ to ■ NO fO ••**■ CM • CM • -r- »—
•»-tO CM CM CM tO CM CM o o o o
O »-CM f- o oin r- m • N- •
<-Or-r- in to o in to o r«. to CM to to f1"- to to x> o <o «— o o o o m «-CM o CMO O CM
«-0 «to • rM o • CM • »C-- CM •CM to CM «-«-^ eo CM CM CM CM CM
o oo
CM •— o o
Ul Ul O O CM «O to m CM «- ^O in o in CM CM CMO tO ooins O »N. •
«* or>- »- •$■ o o<o O»- OCM 00 in 0<0 CM CM O OCM • K- «— • •
mo »to • »- o • CM • -eo eo •CM tO CM «- to CM CO «— • • »— CM CM CM CM «-
o o o
O N- CM>* ostnin h- • c*- • •— o • to
• »-IO CM O
«so» CM 00 O IO
<joom to»- o eo CMm o «a-
• CM o •
CMO OS- in »■»tinSS
• s- o • • CM ■ "<0 CM CM CM CM CM CM
Ul o o to <o
»- o »to •»-tO CM
o
m eo <o •* >*«- o < CM >» to o to in o> in • o • CM to o <
• CM «to -N. o »-»-o CM «- • •« o o
•j-owoo S- o o o o
••O IO • • oo • • >*■ in «-CM CM CM «-
01 (0 U _ -
c c c c o o o c o o <o —— o —— Vr> IJif W X a Q v a a —' N N «3 N N
1 •—' •—■ U •— •— 01
(A O oi a a >•- — •— L. — _ a t- _—< X L L-JJi}
LV « ti a-'CH-eiaia—t-aieia SOIOIC OL-MfwIILaifOLilf —• C C 4J
■c 3 cXo o nsaoorsaoo u- — — — _. > o.c : LCO 3 —I I— «■• OC03_lr-0.il > •—' — «1 I u «J o IIZU.OZCL
01 o
A44 Appendix A Shenandoah Model Segments Results
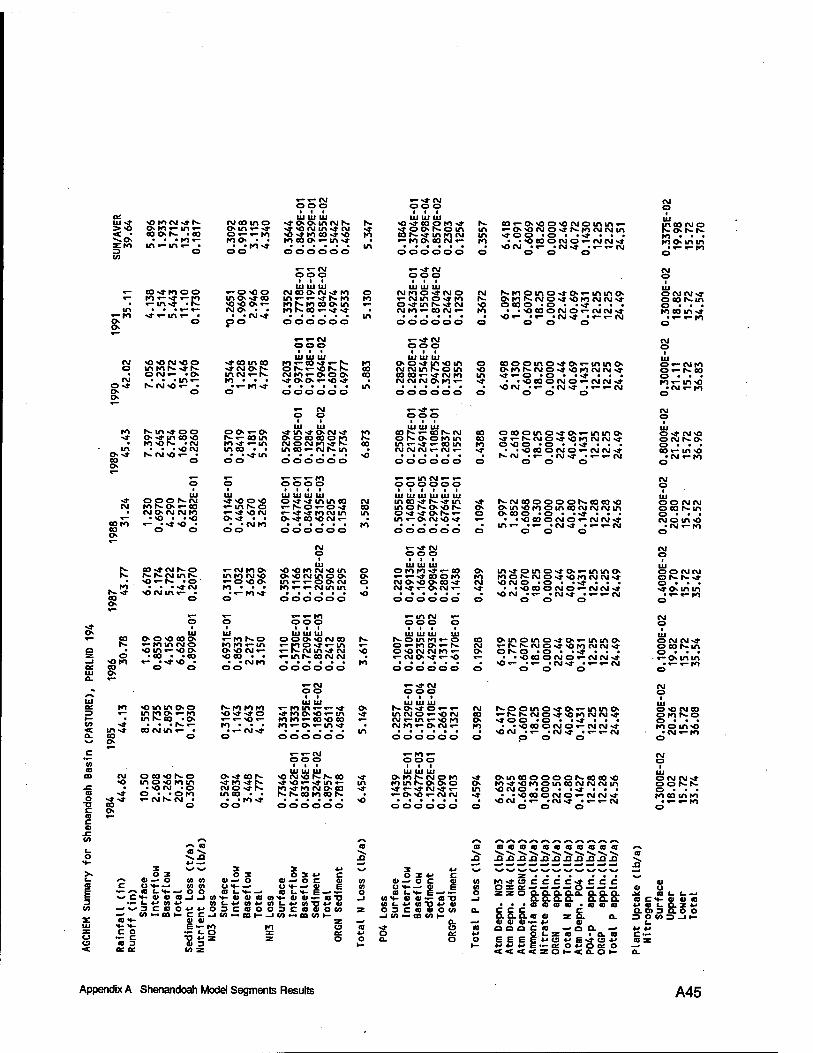
IU«* <o fOCM «*t«- > -a o»M*-m»- < • oas •« N«.O • • • IO«- acto in «-in «- • 3 o to
rvjeo mo
0«r- T-m MO> • •
• «to-* OO
»-»-CM O O O
UJ UJ UJ «* O Oin CM I«. N- 3 NO CM in«* CM «*
«» tO C0«*N0 Kl to eoo »-m «» •
.■••■• in o 00 oo o
LU LU UJ «OvtOOMvt I«. äp^som in
f«.«» in to CM in «- fO O OOCM «- to
O OO o o o o
oo»-o><oovOCMOinin»- «-OvocMosrNitocMCMin «* o o • o « • «* . • .
• • NO CO ON 0«-<MCM «» NOCM •«- 'CM-* .»-»-CM
O O O
ICc m O in in
»- Ovtnoo »- to »-«* »-to
• »-in«* -r«-
8:
»-0 -o o mo -*co «o-o o«- IMO> • ■
OO
LU LU LU CM 00O CM«» fO in «-«—«* I«, to to Nto oo o m to r» eo «-«» «»
o oo o'o'o
o to
LU LU LU CM fOO «»CM O «- CM in o-» to o «»in I«- •* CM CM to»- 00 CM «—
oooooo
CM IN. to o in o «* o«- in in o N. O tO IN. CM O «* NO fO CM CM N» NO O 00 o • o • •«» ■ • . tO • xOtOONOr-IMIMst
■ %0»- •«- »CM«* ««-»-CM O O O O
LU OCM CM«* ooosm o • • • toco m«»
• «- «-to o
CM O«* O o
ON«* co o
•OOftHOO in tot«-«*t«. O CM«- •©>
. . . in»- 1*» CMNO «- •
o
Nn«too O «»in CO «O nos -CM
■ . . NO CM |N. CMNO «- •
O
in CM «-S- to • • ■
• »-to«*
po «-o I«-»- co in to«* »-in in oo • ■
• '«*in o o
-* O O O t«-CM «*«o o «o CM to NO «-co «-m f«.o
a CM OCM CM tO »—«* NO CM »— . Nö ■ . «0 o«* • ■ eo to • -CM to CO o »—
o o oo
N. 00 «*CM t«-0 »-CM fO O N. NNNinN into CM <o
<o«-r>- .o «-o-oo . "*■ • • ■ «*CM t>-«* «o CMin»- ■ • »-to«* CO o o ON »— »—
o o «* 1 1 o LU LU «— £° OO vO coo »-fO IN-O
IV. «- to in CMO o . «o m «— «o o ONO CM«- Z o «oo • «co «oeo • • U «OfO «— • «* «o • ■ • «MtO et 00 o o O O LU O
UJ LU LU LU LU LU •o«-co«*«-t~ O I«- «- «O 1«- K-
to o o«* in NO in CM CM in (N-O in
O 00 NO
CM tO«- OO O 00 CO 00»- «* CM to in «* O O «-NO «* a IMIVINOKIr- «»
in a a • a . a O OO OO o O OO OO o O
«- CM «-«*»- o o OO O
«*m«* OCM «*
in co «- CM f«- in
oooooo
LU LU LU LU o «»«* min co «- |N- o »-0 «* «- «»«»to CM in O«*C0 NO CM «-
O O O OO o
NO NO to CM NO in O NO CM in o o in «-»-oo CM to *— «- CM in in
oooooo
R 00
CM CO
IU LU LU O OONOCM 00 «- too «*»- in »- K. CM in «* CM »- in IN. CO CM CM
oooooo
«-CM o o
LU ee. to NO in in oo «— to in «—«- «* LJ in too «-to
u-i h-co ao «ONtNtO «»to o NO «— in »-«-NO«- to IO«- 00 NO CO «» • • a N..- tO • • • to «-o«-m «» < in«» oo CMin «- a ■«-CM«»
Q. CO o o oooooo o
c «-»-CM OO o
o CD CM O CO-OfN-O O«*e0fN-
«»to «*r- «O CM NO IN- 1«- CO
•o in ONO to in f • NOCM ao NONTN to N»to CMO CO
S- I«. 00 tO CO IN- CO «* o • • o to in oo • a >»N» «-CMIN-CM • • "to«*
o 00 o oo oooooo o
LU LU LU CO f- «~ CO IN. CM o N- o o to in in «—* «- co in CM CM CM «-CM «-
oooooo
*- «— in CM «- «- oooooo
I I I I I I III III Itt HI III III in oo «» IN->» in in OIN. ONO I«. O«* «* OfN- «- in «-o CM NO «*
oooooo
LU LU UJ o to to «*«- to «-«-«* coo to CM ONO O00 «* CM «*«- OCM «-
oooooo
CO 00 to «*
o
»-in CM «- o o o o
l>- IN. o in to «- o co o«-to O«-IN. CM
N0 O NO CM CM to «- o «- CMO «*«-NO
to OOOOOO o
«-N» CM O O O
UJ LU LU O |N- 0-»0«- «- «M N» in CMO »-NO CM en «— CM «—in «- NO to o
a CM tO«- OCM «- to in
OOOOOO o
«— to «- o o o
LU LU UJ >* O IO f- CMO tO to in r«. o O o
«* in o «» «»«-«* CM «*«- in • «- ONO »-CM CM «»
oooooo
eoooino«*o»-intno OtO|N-(MO«*NOtOCMCM«* N* »— O • O a a «» a . .
• •NOCO OCM O«-CMCM-* NOCM •»- i|M«t «»-«-IM
O O O
ocoomON*o«— inmo N*«-r«.CMO«»NOtOCMCM«* O NO O «O « a«» . a a
a .NO00 OCM O«- CMCM «* h-- CM ■ «— «CM«» a«—a— CM
O O O
tN-CM00OOOO|N.C0C0N0 OinNOtoomcocMCMCMin O CO O • O ■ ««* a . a
• ■ «O 00 O CM O«-CMfM«» in«- •«- «CM«* «»-»-CM
o o o
in«*otno«*o»-inino tOO*««CMON*NOtOCMCM«* NO CM O «O • « «* a • a
• • NO CO O CM O«-CMCM«* NOCM •«- «CM«» ««-«-CM
O O O
OLnoino«*o«-inino «-|N.tN.CMON»NOfOCMCMN* O IN- O «O a a«* • a •
• • NOCO O CM 0«-CMCM «» NO«- •«- «CM«* «»-»-CM
o o o
|N.ppino«*o«-mino «-•N-tN.CMON*NOfOrNlCM«* «* O ^3 a CD « * «* • • •
• «NOCO OCMO «-CMCM«» NOCM •«- *CM«* ««-«-CM
O O O
Oineooooof-cocONO to«»NotooincocMCM<Min NO CM O • O • •«» « a a
• « NOCO OCMO«-- CMCM «* NOCM aa— «|M>» a.^»-CM
o o o
LU 0«-CMfO o«-t>- CO o • ■ • fO«- U1N0
•CM «-to
0.80
00
21.2
4 15
.72
36.9
6
CM o
0.20
00E
- 20
.80
15.7
2 36
.52
CM O
0.40
00E-
19
.70
15.7
2 35
.42
CM O
0.10
00E-
19
.82
15.7
2 35
.54
tu ONO CM CO OIO fN-O
to o in NO •CM «-IO
o
OCM CM N* OOIN.IN-
to co into • «-«-to
o
•-N CO c- a ««. o NS.J1
4-» —' 3 N^ «■* 3 X >« O X OX O X «J
«— 0) —' o w co ai — o a) —' o c C OH-—« « «i
Q LH-^ a L«> E *— «-N eg C N|- o o w C«- tl Ql CO -1 -1 CO *-oaimm<*-t>v—
"■LU« 4J 0) f_4-'(O4-*'/)t.4-'C0'O sceaooaccsaj CO — N*. 3 c CO O 4-1 4J o
LU
— u) — m a t-
NV- NV-
1— c c U 41
-1 co — cat——iio — mio
to ac C O •^ •_ O s
a — c a -3 V* z z
<: or a en z
5"2 J
N^ X o
(A o — 01 O NI- O CO «- -J WNt- 41
a LV z O 3 C
-J V) i—
(0 «» ♦J O o a.
X 4-> o c
• - «9 "P a w
-I 8 O CO
<D<D(D<D<!OtDQ)(0ID<II<Q r>
to«»occcc«»ccc
"°&8i8:&0- 8:8:8: a a • (Q Q (Q "J . CO (0 CO
S. Q. Q.« <u z Q. a. <u ct) cu *^ 4-i cj
eo o a a c a —■ o a. —> «■>*•
o EEEEVOfENtai' 02 1- 4->4-i«-iE«i-a:o«->oa:o —«
< < < < z o t- < a. o 1- a.
ai <u o ii CO ej CH- <-> «j <- Q.D) 3 .
Z> OU3-IH C
0) O CO 5.x «J ao o
Appendix A Shenandoah Model Segments Results A45
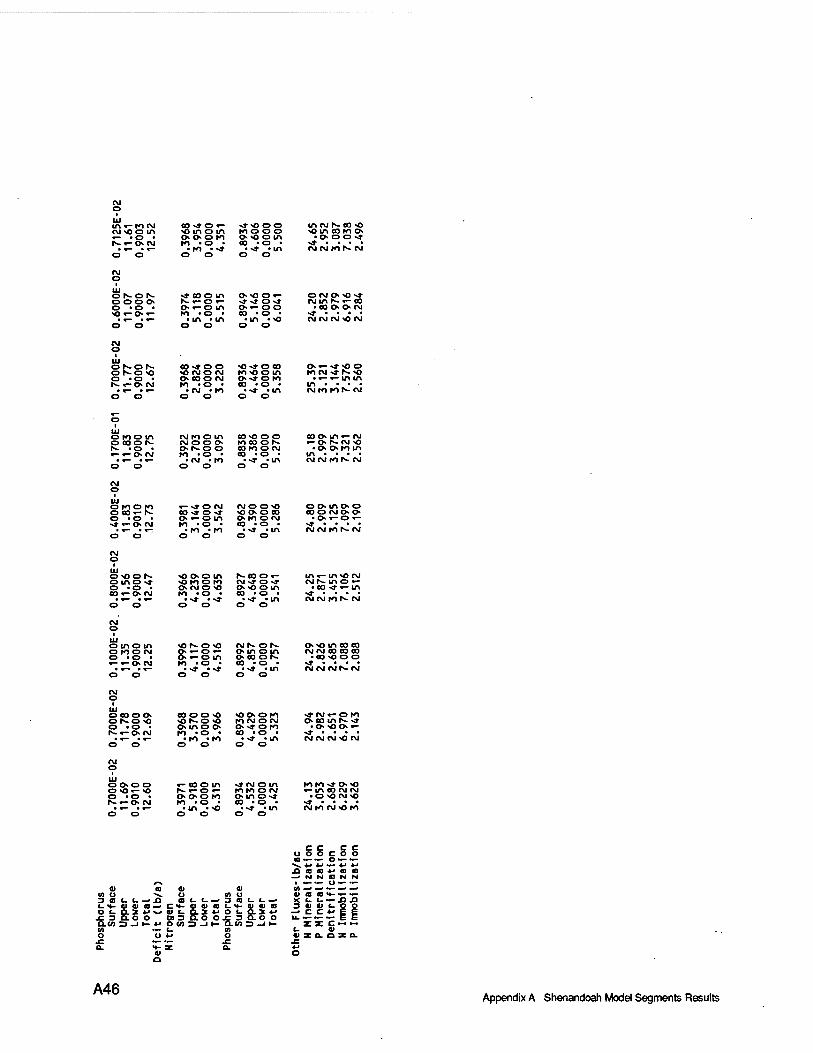
in«-tocM co -* o «- <t<oo CM 4] o in «o in o in to o o o «— "O • o o o to &<oom S<-OCM to -o • 00 -o • •«- .«- -to • »t •*» «in o o o o o o
in CM r^ oo <o «o in oo to o
• o o o st st • • • • CM CM tO f^ CM
or-os. ■* co o m o >o o «- oooo r»-«-o«- ststovt o «o • Or-om o«- oo <o«-o«- to »o • co -o • .«- •«- -in «in «in «>o
o o o o o o
O CM O <0 •» cMin r>- «- co
• oo o o CM st • • • • CM CM CM "O CM
OKOS o Ko <o
o-too -Ostoeo <OCMOCM toyjoin OOOOCM OstOfO to >o • oo • o •
• CM »to • «* -m o o o o
o»- «*«o o to CM •**». >o •«- «— in in
in • • • • CM to to t^ CM
0.1700E
11.83
0.90
00
12.7
5
0.39
22
2.703
0.00
00
3.095
0.88
38
4.38
6 0.
0000
5.270 co o in«- CM
i-o>sw>o • o o to m
m • • • • CM CM tO h- CM
CM o
4000E
1.83
9010
2.73
i-^ON
o «- o in to ■ o •
(MOO« o o o co OKI O CM CO • o •
o o in o o COO (MO o
■ o»-o«- st . . • • CM CM to r- CM
0.80
00!
11.56
0.90
00
12.47
0.39
66
4.239
0.00
00
4.635
0.89
27
4.648
0.00
00
5.54
1 in«- in »o CM CMh- m O «-
• oo >r«-in st • • • • CM CM KIN. CM
CM O
0.1000E
11.3
5 0.
9000
12.2
5
0.39
96
4.11
7 0.
0000
4.51
6
0.89
92
4.85
7 0.
0000
5.75
7 o<oinoca CM CM CO CO CO
• 00 «O O O st • ■ ■ • CM CM CM N- CM
CM O
0.7000E
11.78
0.90
00
12.69
0.39
68
3.57
0 0.
0000
3.96
6
0.89
36
4.42
9 0.
0000
5.32
3 stCM*- O to O oo m tv. st
• o«oo«- st • • • • CM CM CM -O CM
CM O
7000E
1.69
9010
2.60
«- co o m N- «- O «- O O o to to »O •
st CM oin tO Kl OCM oin Ost co • o •
to to vt o >o «-in CO CM CM
. O "O CM yO st • • • •
• *0 • st • m o o o o
CM tO CM «O tO
«I no SOLI . XI
c c c c 0 o o c o o a —— o — —
•Ss 4-* *-» —- *-» *-» £1 CO CO *■» CD CO —' N N CO N N
1 —— O — — «i ti a —•—' — —• — ü n u o o «H-'T'r: B L L^ 3 O L L-• XkU-üü
LT-ci<ia->c«-«iioi.«-t!dia 30)0)1. OI.aiVutlLQ.KJOLa.1V —• c c ** roooo nsao oroaoo u. —— ~ a.u3-iHf o(os Ji-ans JH xxc-
*> z a. o :
at a
A46 Appendix A Shenandoah Model Segments Results
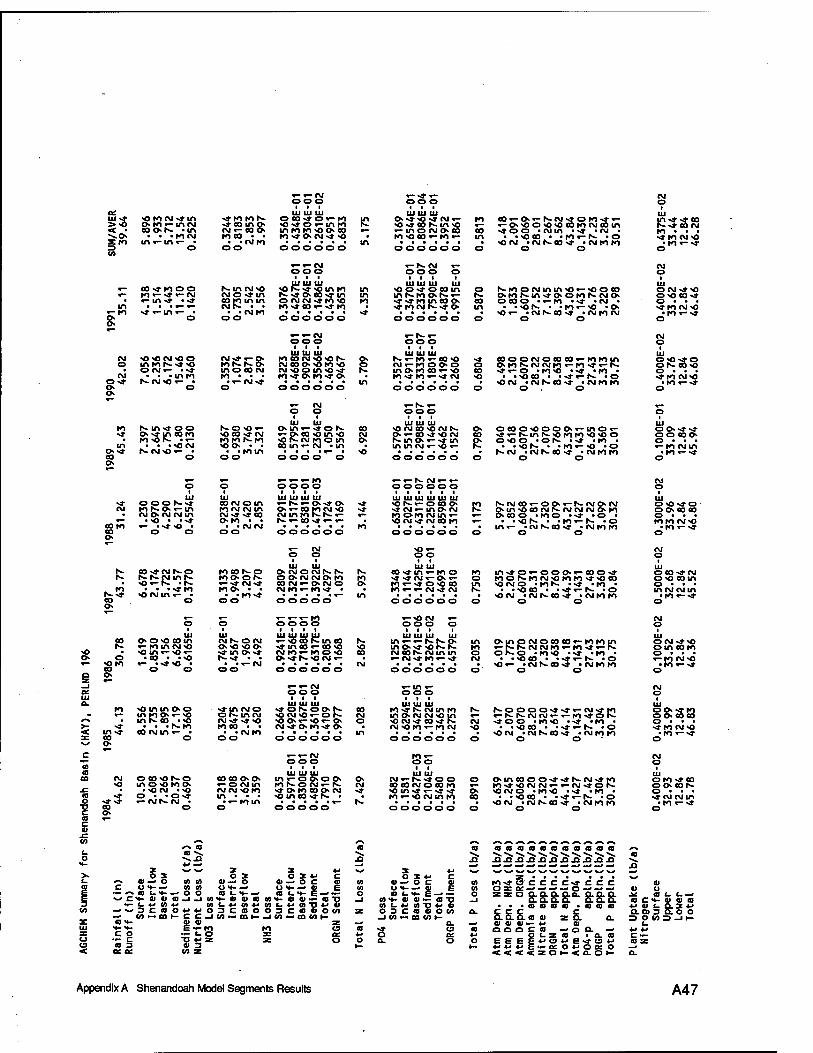
ee UIN» <o MCM «»in >«o o M«— UICM < • coo>N «in NN.O • • -M CM EM in «-in «- • o o en
«- eo^moo «- M «-«* «-CM
■ «-in»» • «» in • • • «-
»■-M «» «-m «- o &
CM «)<OIM<00 o in MN. «»«o
• o CM«- ••» CM • • «mm
o«* N. CM<O «- • o o o
M N- in«» oo «* o «»in COM
M -os ■«- in • • • %o CM
O«» N. CMNO «- • oo o o
«*MMN. «* to m o CM«- 00 O M co • ■
• -CMM oo
rC LU 111 UJ
O CO N» 0«-M •a N»o«-in to UIMM «oo co «— M «* o CM «» «a • o oo o o o
UJ iu ui KincMvo ONNfvOinM m CM o N» in N-«et o oo N» in in coroinin OMNsrei-o M
«-«- CMN. • • 10 N» co «-•* 10 • • ■cMro «*
oo oooooo
«-«-CM ooo I I I
UJ UJ HI tO CO CM NO <0 K
... - _ CM oo o>%3 to «o mo oo CM CMNOOU-INON» to • • • to•» o> to «a- o
• »— CM «» «••«•• o oooooo
IN» «-ON , l-NO o
UI UI N-ONO«— Oin«- stOS CO NO CO NI CM •—OOO NO in NO CM totoiN-to NotN-cMtoom o NO O • • co in«- CM »in •
■ • torn ■•••«-. NO o o o oo o o
ON»NON»CM«- to co «-o «-r~-CM «» O IO N» «- NON»eoh-inNO «— «-ONO o NONO co to CMco in «- mo CM o oo to NO co «-to «— oooooo
«-IN. CM «- ooo o III I
UI UJ UI UI NO ON» o co m inMoo>S<- N»N»to mco o NtMIMNNtO.
oooooo
«-IN-«- ooo ■ I I
UI UJ UI r~«-M«—co«o CM «-to o oo m oto co «-NO IO N»fO «-N» CM
oooooo
«-tN-«- oo o II I
UI UI UI «O CM CO NOCM N. ON—00 N» NO CM MA» «-N» in m in CM «-NO «- oooooo
CO N»00 >CMm ••* «CM m • • NO co • "to«-N- -o
NO CM »CMIN-CON» .CM KIM o o o
O f—M o CM in in NO*— NOO CO r- OM tN-m N»OOMIN. CMO 00 O CO O >«-M •«» «CM • m • .«ON. • .M«-N0 -O
• NO«- -CMN-CO«» .IMMCM o o o
cooocviococo«-MMin OMN.CMCMM«-MN»»-N. ■N»«-0 «MNO • «» «M •
• • NO CO • « N» «— N- «O NOCM .(MN-OON» 'CMMM
O O
o oco ONO oo o«—ino «- 00 N»N— N-in N-NO MM NO NO O O ONOO .Of- .«» .M • IN- . .NOtN- • -M«-N0 "O
• t—cM «CMN-CON» »CMMM o o o
CM o
N»MCMNO ■M «-N»
o
UI O (M N»NO ON0 C0N» o • • • N»M CM NO •M «-N»
o
o • ■ • N»M CM NO •M «-N»
o
UI O O «»«» oo co o o • • ■ «- M CM in o
N» O OO N. vt CM M IN-O «-in
CM OCM CMm N— .NO • -N»
COM «- >N» NO • CO o o o
N- CONtlMNO r— N-IN-CM inf—
NO N—tN. .fN. M • • "NTM
N-N» NO CM in «- . CO o o
UI co o ONO com IN- N—MmcMNO
NO " NO m «— NO N— O O . CO * * NO «- NOM «- .N»NO •
co o o a o
UI a.
M NOtntn oo » «- m MO«-NO
»■N ■ in fN-co «NO >- -» • • • N-M < mN» co CMm«- ■ x co o v o
CM O CONO IN-O NO m ONO M o
. ■ NO CM " NO N» O ■ • ON»
N»N» N— IMS CM • CO O O
UI conjoin MCM CM tn CMN» N»OO OM • •
• • CMCM o o
M CO IN-O MOON. »-«»CM«» MO""
• _'MN» OO
CMS. O CM ONO NOO N»m o>» |N-N» . .
• .«-CM OO
N»m CMO OSiniM CMN» N»NO MOO • •
• "CMM OO
COCO OO «- O CM m CM CM NOM
«-«-«-M O OO O
i I I I UI UI UI UI «— IN. «— O N» O N» o«-eofocM NO N» (Minn IN. IN. «- «— IN. «— CO N» «— «— .
oooooo
»- CM o o I I
UJ UI O CMO CMN- fN. IN. O OCM CM O M M 00 CM«- OCM O O CMM«-MN» . .....«— m
o oo oo
« «— «— I.I o ooo
I I I I UJ UI UI UI «- NO co N-m oo ■Ntmco «-co NO CM M«- MO NO ON» N. NO CM «- OOOOOO
«-«-CM OOO ill
UI UI UI N» ON. OO N. NO CMNO «-0 N- NO O«— NO«- O CMN»0 M«* O
oooooo
«-«-CM ooo III
UI UI UI m «-o oo o M fN-O CM»- fN. N» OM COO CM NO m co N»fN.
N- NO CO
00 CM o
o CM N»
«-«-IN. CM »- «- oooooo I I I I I I
III Itl III III lit It! NO IN.«- oco o N» CM «- m O CM M OM CMin «- NO CMN» CMCO M
OOOOOO
UJ UI co N»m «- M o N» N»CM«-0 «~ M «-N» ONO CO M«-«- CMN» CM
OOOOOO
«-NO CM «- OOO O
UI UI UI UI in «-«-N-N. o m O N» NO N. N- CM eoN.CMm in «-CMN»M«-N»
oooooo
R
M O
iC o
in M o CM
N.CMC0«-OO«-N.«MOCM OinNOCOCMN-CMCMCMOM OCOO -MO •«» "O •
■ -NON- • M«- N. "O in«- «CMNCON» .CMMM
o o
UN.N»O«-OOO«-C0ON» MO|N.MCMN0MMN»N0 00 NOCMO -MN -N» .M ■
• • NO CO " " N» «— fS. "O NOCM -CMN-CON» .CMMM
O O
OmocMococo«— nnin «-F-N.CMCMM«-MN»«-N- ON.O "MNO ■^■^■M •
• . NO 00 • • N» «-N. "O NO»- .CMN-CON» 'CMMM
O O
■ ■■ UI UI UI
MN»|N.CMU1M N- N-O OO ON»N»«-CMN»M mOCMCMNOm »- «- fN. N- CM CM «- »- M N» O N- NO CM ^ CO N» N- CM -— '^ ^N . ^* »*N - -*• . .**
OOOOO «- N.
CM NOM N—M CM
OOOOOO
M«- O O
UI UI IMt-SNfOO CO CONOCO M NO m •*«-•» N» M *—«o CMm M OOOOOO
N»00 «MNO .N» .M NO • • NO 00 • .N»«-N- «o
NOCM -CMN-CON» .CMMM o o o •
o om coo ON»-*|N. CMN»M »- MN» NOCMCM»-«-CM«*0 N. O NOCMO "MNO .N» .M • CO • " NO CO • • N» «—N- «o
• NOCM .CMIN-CON» .CMMM o o o
o NO .»o o o co co o • " • MM CM NO •M «-N»
o
OCO N» CM ONO COm
in CM CM in •M «-N»
o
OCM >»N0 om COM
«-M CNINO •M «-N»
o
UI OON»M oocooo o • • • N»M CM NO
• M «-N» o
UI OM N»CO OO CON. o • • > N» CM CMm •M «-N»
o
X N^ NV O 3
«V —> o «> to C OH--- CO CO
E £ E i*JO« ETU v «: f vvE-KOfOCC O —■ <<<<lOr-<Q.OI- CL
Appendix A Shenandoah Model Segments Results A47
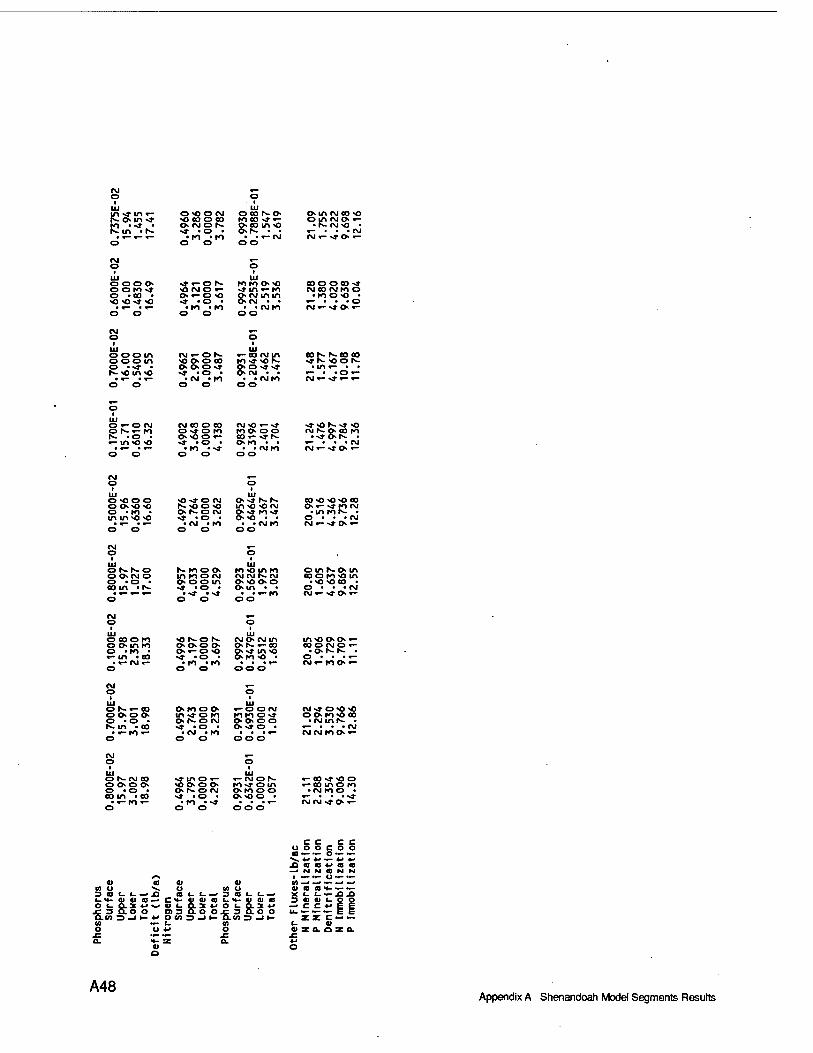
£; 040IM O CO O CO
Ul oeoso Kieo«*«- OMMON O00in<0 s» • O • O r— • •
• Kl • Kl • • «- CM O O O O
oin CMco o om NO «-
• F- CM<O • r- ... CM CM «- «a-o «-
0.60
001
16.00
0.4830
16.4
9
0.4964
3.121
0.00
00
3.61
7
0.9943
0.22
531
2.51
9 3.
536 Booeoj
CM 00 CMKI O •Kl O <0 •
«- . . . O CM«- vt O «-
CM O t
o 1
Ul o oo in o oo m o •«* • IV «o in»0 49
62
.991
0000
.487
9931
2048
E .4
62
.475
1.48
.577
.167
0.08
1.78
CM«- •»«- »-
Or-OIM O IV«- Kl tv >o • «- m<o <o
CM oo o co o «o o «- «a- »o •
"Kl • ~» O O
CM«0 «-«* Kl O O O co «- «a- r«. OKI • •
• -CMKI O O
CM r>- O00 Kl ■ N»ON •
«- . . . CM CM«- -»O «-
0.5000E
15.96
0.63
60
16.60
0.49
76
2.764
0.00
00
3.262
0.99
59
0.6464E
2.36
7 3.
427
20.98
1.516
4.34
6 9.736
12.28
CM O o
0.8000E-
15.97
1.027
17.00
0.49
57
4.033
0.00
00
4.52
9
0.99
23
0.5626E
1.97
5 3.023 o m iv o in
co o Ki <o m •<0 O CO •
O • • • CM »M«-.»0 «-
CM o
1
•r— o
1
0.1000E
15.98
2.350
18.33
0.49
96
3.19
7 0.
0000
3.69
7
0.99
92
0.3479E
0.65
12
1.68
5
20.85
1.906
3.72
9 9.
709
11.1
1
CM O o
0.70
00E-
15.97
3.001
18.98
0.4959
2.743
0.00
00
3.23
9
0.99
31
0.4930E
0.00
00
1.042 N<t0<0<0
OO KI«O 00 ■ CM inf- •
«- ■ • • CM CM CM KIO «-
O (V CM CO O OO O O -O • co m • co
»a- mo «— «o oo o o iv o CM N» ■ o •
•Kl • «* o o
■-IMOS KI«» om OKI OO oo o •
•-co -to o «-co m o KI
•CM Kl O • «- . . . »a CM CM •* O «-
30I.I.-J)
c c c c u o o c o o CO — — o — — V *J V ~- V V J3 a <D «-» <0 «3 —' N N a N N
1 — — o — — M _• —••— — w 01 CO CO H- — •—
I- I • X LL-J1J3 aico-^CH-qicicaL-H-qicjfO 3 « « .ivvtLa>voLa.iv —• c c ^oo oisEoofsSoo u.~-~- ji-voioDJha
01
o a.
X X tzo.
c — • «1 o z <
A48 Appendix A Shenandoah Model Segments Results
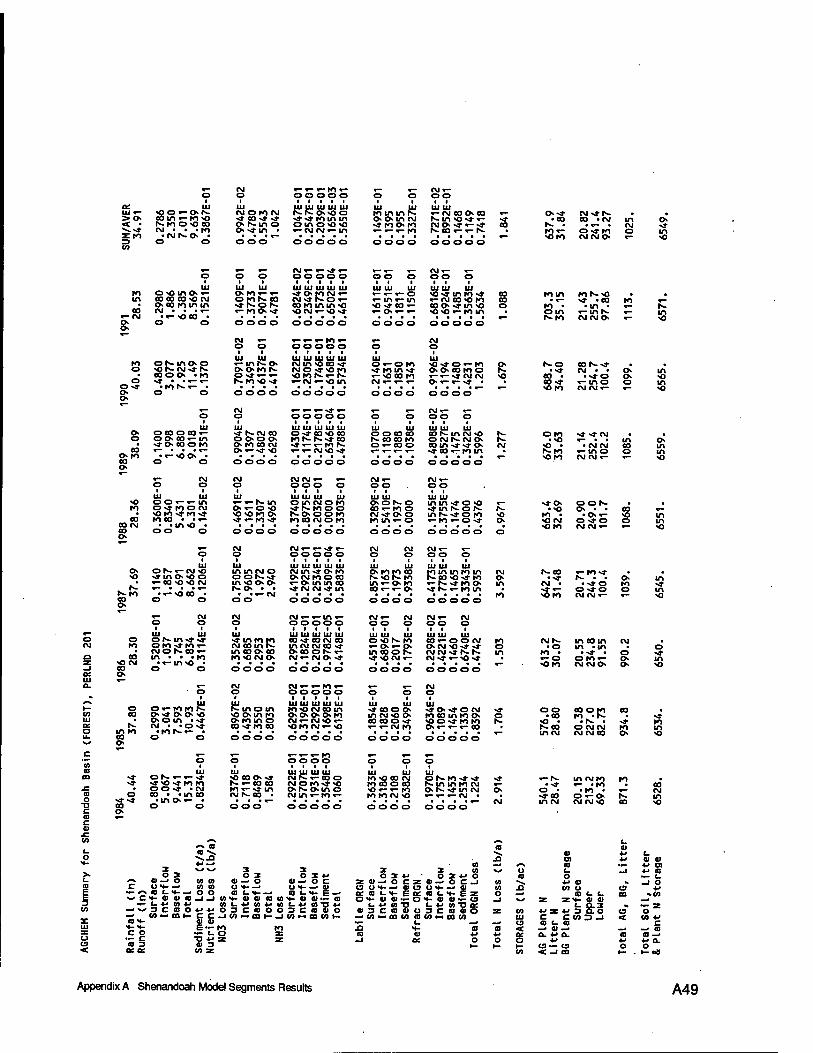
IU «- «OOr-ON >o coin «-too < • Is. to oo oo "s.s3- CM ■ • • to s:to -CMt-o ■ no o
UJ CM OtO CM xtOstvt ~« N-m o
• s»m • • • • «— ooo 85!
■ ooo stvt torn m om OO o «-CMCM«- m
OOOOO
UJ UJ
»»in CM •* to O tO CM «-«-«-fO K- o oo o
CM«- OO I I
UI UI «-CM CO » 00 Sin«'*»'
"O sr «-sfr 00 «-«- Is.
OOOOO
Os» CMxl-t»- • • • oo oo -CM m o
fs. . • «- • CM s3- to«- o s»to o m OfO CM NO «- O
o «— «— o o
CM«- «-s3-«- o o OO o So o
CM«- «- OO O
to m 03
«- CM
1 0.29
80
1.88
6 6.3
85
8.5
69
0.
1521
E-
0.14
09E
- 0.
3733
0.
9071
E-
0.47
81
0.68
24E
- 0.
2349
E-
0.15
73E
- 0.
6502
E-
0.46
11E
-
0.16
11E
- 0.
9451
E-
0.18
11
0.11
50E
-
0.68
16E
- 0.
6924
E-
0.14
85
0.35
63E
- 0.
5634
CO 00 o
torn to • om fs.fO
to fs-O s3- «CO
• in ■ «— in fs. CM CM O
to «— «—
Is. in O
CM «- o O
«-«-«-*>«- ooooo
«— o
CM O
to o o
Os»
o
0.48
60
3.0
77
7.
925
11.4
9 0.
1370
0.70
91E
- 0.
3495
0.
6137
E-
0.41
79
0.16
22E
- 0.
2305
E-
0.17
46E
- 0.
6168
E-
0.57
34E
-
0.21
40E
- 0.
1631
0.
1850
0.
1343
0.91
96E
- 0.
1194
0.
1480
0.
4231
1.
203 o
Is. o
fs-O •s3-
00 • 00 st o to 21
.28
25
4.7
10
0.4 o"
O in o m o
o CM O
«-«-«-s3- «- ooooo
«— «— o o
CM«- «- OO O
o CO
o» to CO 0.
1400
1.
998
6.88
0 9.
018
0.13
51E
-
0.99
04E
- 0.
1397
0.
4802
0.
6298
0.14
30E
- 0.
1174
E-
0.21
78E
- 0.
6346
E-
0.47
88E
-
0.10
70E
- 0.
1180
0.
1888
0.
1038
E-
0.48
08E
- 0.
8527
E-
0.14
75
0.34
22E
- 0.
5996
CM
«—
o to • o
o • ts-tO o to 21
.14
252.
4 10
2.2
in oo o «—
o* m m O
«— «- CM o o
CM O
CMCM «- «- OOO o
CM«- O O
CM«- OO
o to to
00 CM CO o>
0.36
00E
- 0.
8340
5.
431
6.30
1 0.
1425
E'
0.46
91E
- 0.
1611
0.
3307
0.
4965
0.37
40E
- 0.
8975
E-
0.20
32E
- 0.
0000
0.
3303
E-
0.32
89E
- 0.
5410
E-
0.19
37
0.00
00 UI UI
mm s3-o o stlflNON mfs-sj-o to «-to «-O sj-
ooooo
Is. o
o
sfO • o
to • O CM OfO 20
.90
249.
0 10
1.7
CO o o «—
m m o
o CM O
CM«-«-s3- «- OOOOO
CM CM O O
CM«- «- o o o
o
fs-KI CO o
0.11
40
1.85
7 6.
691
8.66
2 0.
1206
E
0.75
05E
- 0.
9605
1.
972
2.94
0
HI HI HI HI itt CMIrtsTO to &>CM too oo «-omm oo si-CM CM sf in
ooooo 0.85
79E
- 0.
1163
0.
1973
0.
9338
E-
0.41
73E
- 0.
7785
E-
0.14
65
0.33
43E
- 0.
5935
CM o m to
fs-00 •s3-
CM • s3-«- oto 20
.71
244.
3 10
0.4
to o •—
in s3- m O
«- CM O O
CM O
CM «-«-in «- ooooo
CM«- CM O O O
CM«- CM O O O
«— o CM
o —J
o to 00
O CM 00 o
0.52
00E
1.
037
5.74
5 6.
834
0.31
14E
-
0.35
24E
- 0.
6885
0.
2953
0.
9873
0.29
58E
- 0.
1824
E-
0.20
28E
- 0.
9782
E-
0.41
48E
-
0.45
10E
- 0.
6896
E-
0.20
17
0.17
93E
-
0.22
98E
- 0.
4221
E-
0.14
60
0.67
40E
- 0.
4742
to o m «—
CM Is. • O
to • «-0 OfO 20
.55
234.
8 91
.55 CM
O o s3- in o
UJ CL «—
O CM O
CM «-«-to «- ooooo
«— «— o o
CM O
i- co UJ cc o u.
o 00
fs! m to oo o<
0.29
90
3.04
1 7.
593
10.9
3 0.
4467
E-
0.89
67E
- 0.
4395
0.
3550
0.
8035
0.62
93E
- 0.
3196
E-
0.22
92E
- 0.
1698
E-
0.61
35E
-
0.18
54E
- 0.
1828
0.
2060
0.
3499
E-
UI stOstOftl to oo m to O o Os»to to O «-«—«- 00
ödäöö
s» o Is-
oo •CO
o • Is. 00 in CM
oooto to -ts.
• Is. ■ O CMCM CM CM 00
00
st
o
s» to m o
c O
«— o
•-«-«-to oo oo o o o
CO CO
sz a o
T> c
s» s»
o s*s» 00 0.
8040
5.0
67
9.
441
15.3
1 0.
8234
E
0.23
76E
- 0.
7118
0.
8489
1.
584
0.29
22E
- 0.
5707
E-
0.19
31E
- 0.
3548
E-
0.10
60
0.36
33E
- 0.
3186
0.
2108
0.
6382
E-
0.19
70E
- 0.
1757
0.
1453
0.
2534
1.
224 s3- «—
O
CM
«-fs- •s»
o • s3-CO miM 20
.15
213.
2 69
.33 to
co
cd CM m o
CO «-
•■s, CO
»s.ja
•^ ci C U "- ^N CO s^ C H-
—• w 3 -• tn «tjs-
c o •- c
CO 3 et a
3 O 3
—• O «0 CO ■*- —' CO CO «-N rOO VO O JJ »«■
3 O 3
CO —' O U si-—i
3 O 3 -w
CO— O C u ><- —< aj C LH-E-
-. tt>a)<oioH-cj«>— <o *± CO *J ULVOl^lOLIi (OTJ •> CHOVU03CH003CHIIO -mi- c C-iw-oh- -jcoi-ioacni— —
aj to
"8?;
's» cu *J C Si O) ♦J CO CO
_ CO ^s CO W O) 3 3 CO s^ u t- _J f CO O 3 -M O 3 *J O a o — c.
Z0)_>OCZ«— OC_l CO *s. 4J CO -1 o BOH—■«OO»— « CO SI CO o (9 •M OC 10 L<f- EOC O LH- |z o ILL 00 -O) Ot-tlO-OH-tlClH-u —1 Z Z<f- CO CO
t- S.3 VZf3iLO
t_ V CO "P LtJ »TJCC (3C<«03COtO z CO C9
~- Z o
-. CO —. CO C/> CO CO — CO CO UI C CC43J < CO 4J a CO C CO c
SI H- CO CO < _• CO—< —> a CO 0) *J *J cc a. <J a. CO a —■ -i ce o o o *•» *J v a. \— 1- 1- C9— C3 o o </> < —i m r- «-OB
Appendix A Shenandoah Model Segments Results A49
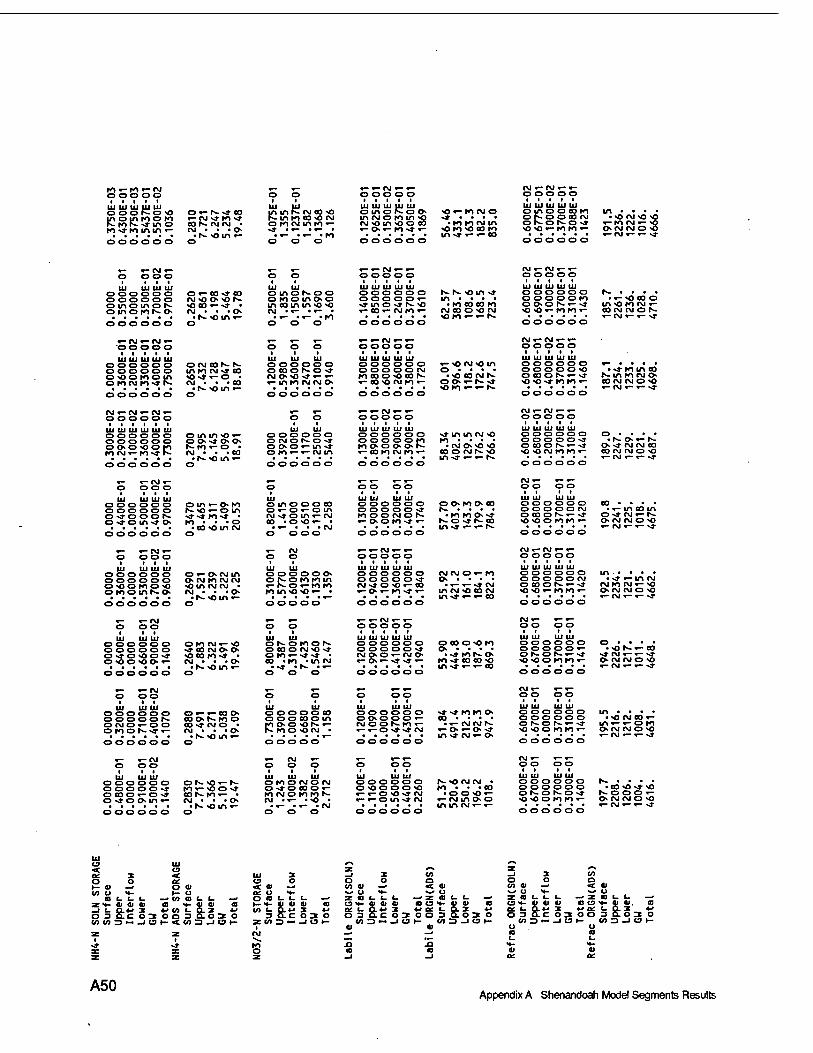
ro«-ro»-cM o oo oo ■ ■ i i i
UJ Ul UJ UJ Ul o o o F^ o o o «-r>-** oo loinrooro «-cM»»m»T . mN--j-u-io OON-CMCM •
M^Minifl'- CM • • -o • h- O m «-
o oo o o o o
tc; in in K CM oo o F- m ro oo o CM OMIMinKI'- «t . «- .«- .
»- «-CM «- «— o o o o o I ■ I I I
Ul tu UJ UJ UJ otnoN-oo <o«-rotMO lAMOmVt^Q •* • • • • NOinood ■loniMin «-O>«-MN»»- orooeorn
> • • • • • in »» «—«— oo o oo oo o
o o o o o I I I I I
UJ UJ UJ UJ UJ o in o o eo fo in oS-ooeorvj ><oi\JO' OKOf-Ov» «-rOCMi o o «— ro ro «— o CM CM <
• ••••• «— CM «— «— »a* o oo oo o
i o o
«- »- CM «~ o o o o
i it«
UJ UJ UJ UJ __ OOOOOO O «-00 «* 00 oooooo CM o o> o r«. oinomor«- oeo«-«» ■ omoKiNO' CM • • «o r>- otn »-
oooooo o
UJ m. o m o r>- o o omoinoo m oo m m o o CM •«- ■ »- ■
• «- •«- ■ rO o o o
UJ UJ UJ UJ UJ oooooo N. s. o m ■»» o o o o o «- in • • • • •j- m o •» r*- o • roeoeoro «- oo «- rj ro «- IMCOO<ON O ro «— «— h-
oooooo
I III IH III oooooo r- • • • • o o o o o ro n-ooo O>OSI--J m o ro CM «- o o «- to ro «- aiMiMOS «- CM «- «- >»
oooooo
«-CM «-CM «- ooooo I I I I I
III III III III III oooooo o(MON-r<- oooooo tnrocM*»eo ooorooin o«*«-o • orocMro-*F-. CM • • -co
• ■•■•• • r- o in «— oooooo o
UJ UJ UJ oooooo o<aoso<i- CM OO »»■«- «- •- mro CM CM o
oooooo
«-«-<M«-»- ooo oo ■ i i • i
in in in in m OOOOOO l--ON»Oin O O O O O CM O • • • • tO CD O O 00 h- ••OCOCMS «-eoocMro»- oo«-r^»» o ro «-«- r-
oooooo
CM«~CM«-«- o oooo • i i i i
UJ UJ UJ UJ UJ oooooo «— • • • • oooooo ivtMino ooos«->t r-inKiiMO oo-j-roro«- OOCMCMOO T-CM «— «- •*
oooooo
CM T- CM «- CM «- oooooo
I I I I I I III III III III III III oooooo o m in o «- oooooo o o-» o o oooooro r>-fo«-o • ro CM«- to■* r- CM • • • eo «N. o in «— oooooo o
oooooo ONOSO-» o o o «- in «^ o ro«- «- CM m oooooo
ro • • • ■ .._ _. • CM o o o «-eo ro CM ro «- eo o CM f-o
■ ■ • • • • in ** «-«— r- oooooo
UJ UJ Ul UJ UJ oooooo o • • • • oooooo • r*. o «— r*- OCOOSi->J O-tf CM CM 00 o o CM to ro «- OOCMCMOO «- CM «- «- -*
oooooo
o o o o CM«- •—«- o o o o
UJ UJ UJ UJ oooooo om«-oro oooooo S«i-om oooooo- »T«3-ro>» • o«»oin^o ro ■ • -o
■ ■•■•• •CO'OI/IN oooooo o
o mo oo eo Or-oi-om CM >»o in«- CM co >o o«- • .«- . • ■ CM
o o o o
UJ UJ UJ UJ _ oooooo o o ro c> oo OOOOO«» N- • • • • ro o o CM o r- »roroo»? «-o o ro ««r *- r*-o-* rw oo in **«-«- Jv
oooooo
UJ UJ UJ UJ O O O O O O 00 • • • • OOOOOCM -«-meoin ocoor«.«—* o ^» CM «-r— ooororo«- OIMNO-O «-CM «-«- ~»
oooooo
«- «-CM «— o o o o I III
UJ UJ UJ UJ oooooo o«-o«Min oooooo o CM ro CM CM OOOKIOO OU1CMCM • oioomso <*•_• • • *> • ■■••« • N- o in «— oooooo o
oooooo o f>-o ro ro in «- K-o «-ro to to in»o >0«- •
o o o o o
UJ UJ UJ UJ UJ OOOOOO CMCMO«-tO o o o o o ■* o • ■ • • CM »» O O «-CO »»-«-»»CM «-o«-ro~*«- in CM <o eo CM
• ••••• in sj* «— «— co oooooo
UJ Ul UJ UJ UJ oooooo m« • • • OOOOOCM •«*«-U1CM OCOOS-«—^» CMIOIM«-0 <o>o»-roro«- OCMCMO<O «-CM«-«-»»
oooooo
UJ UJ UJ oooooo orocM«-<o oooooo »»COCMOO o ^ o-o o vr -oeoto-4- • 0X30*00»- CM • • -O ■ ■■•■• «K-^oin«- o oo oo o o
Ul UJ oKonos o eo o CM<O »» o ro«->»>» . co >ro >incM
• *tf- • N. • «— o o o
HI HI III III III oooooo oooooro O O O O O vT o • • • • CMOO«-CMO '«a-ror^o «-O«-N»»»»- ro-J co eo-o
• •«••■ m »^ «— «— oo oooooo
oooooo o • • ■ ■ ooooo«- •or-«-oo ONOSi-^ -»» CM «— «— *J- ooororo«- OCMCMO-O
• ••••• «— CM «— «— *4" OOOOOO
*- «-CM O OO I ■ i
Ul UJ UJ OOOOOO o«-«-ooo oooooo- cooN-roo OCMC3«-00 B-tNO • orooN-N»-«- CM • • -o
■ !■>•• • N. o in «— oooooo o
UJ UJ o oo O O CO o oo coo in t oo oh- «-
■ ro o o CM •
ooooo
R! oooooo »*«*roroo ooooo«— oo • • • • NOOSKI«* •«•(MINIS «-«-0>»"»*CM «- O «- O »»
• ••••> in s* CM «— o oooooo
UJ UJ UJ UJ oooooo in • • • • OOOOOO «OCMCO«- o s o r*-«- ** in «-«—o ro o o o to ro «- OCMCMOO «- CM «-«- v»
oooooo
Ul UJ UJ oooooo oN-o«-r-- o o o o o vi ro«-oo«t o oo o «-o »T ooi>.ro«- • o ** o o in «- CM • • «o •r-.oin«- o oo oo o o
UJ UJ UJ o ro o NO CM O-JOOOi- ro CMO ro to »- CM •«- «o •
. «- . «- ■ CM o o o
o oo I II
UJ UJ UJ OOOOOO NiOIMN • oooooo ro • • >eo i-i-CO^N »ooo«- «-«-o in N* CM «-CM in o o in in cM«-«-
o oo oo o
UJ Ul UJ UJ oooooo r«. • . • • oooooo -eoo-j-o o r— o r>- o -» s-o o o «- oocaroro«- OCMCMOO «-CM«-«—t
oooooo
UJ <o «t a: 3 o o I- <u _ V) o >*-
CO c t- c-
o
—< CO CO C- L. W h- a— I— —' V? W •— I— "-* aef-oiCJCJ co «•« ci <o _l L. ÖL*K X V CO C Q. 3 *• 03(XC03003ao30 U«3M _IOH<(l)D JUH
2 o
I. l_ L. —i
O _ •X «I •^ Ü
CO ■U W fc» ^ — ^ w ^ •— — *- t> *> 4) COVIIII. CO L. O.♦> JE wo: i. Q.X «-1
3CLC030O3tl030 CO 3 •— —I 13 r- W3JUI-
-4- X
J3 CO 01 ft:
A50 Appendix A Shenandoah Model Segments Results
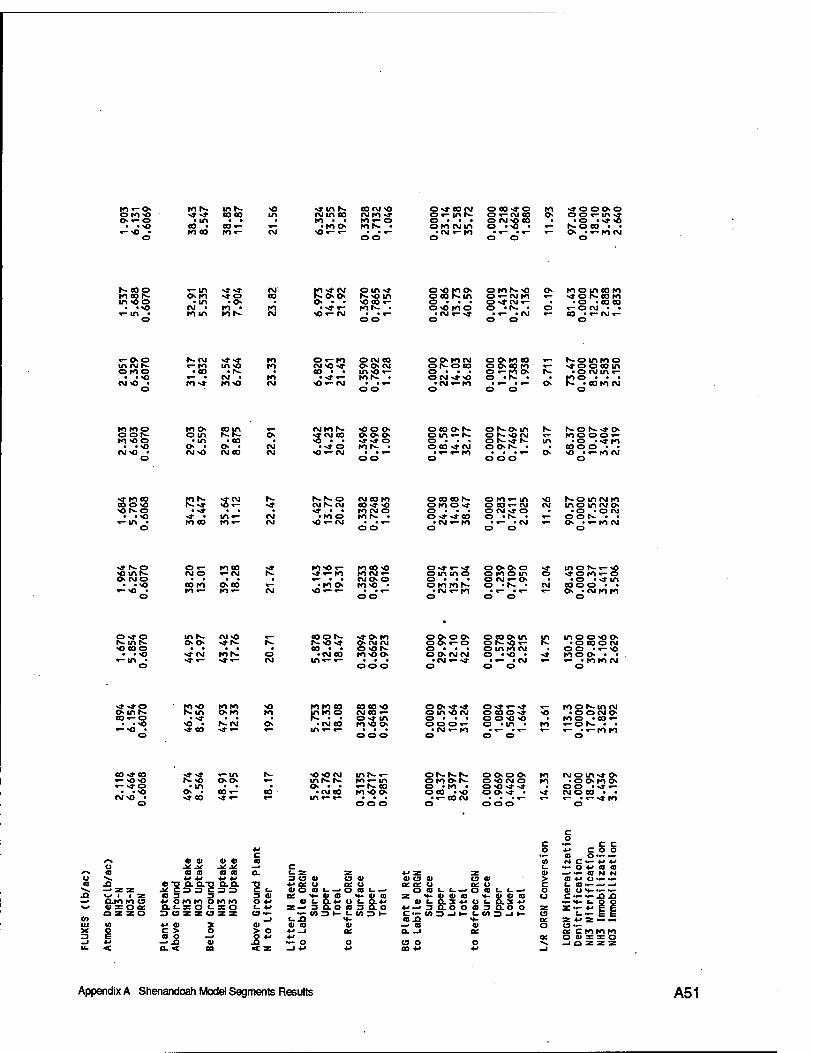
ro«-o» rot«, ins NO «»mt«. corj-o o«rcocM oeo«ro ro «»OOONQ oro-o «»«* coco in CMinco mio-» Ot-inS- o «- CM eg o> oo«-m«» o«-o «in • • • ro ■ • ro«-o o • • • ofM-pco • «o • -»-o
• ««o co • co«- «- »too» rot«- • orocMin o •■& • «- soeo • ■ «-«o • toco to«- CM «a«-«- ■ •«- 'CM«-to • «- •«- «- o> -«-rocM
o oo o o o o
N-ooo «- m «»«» CM ro«» CM oin4 0*0 K10> 0eo Kin roeor«- 0> ro «»© CO r-.NO m m <o o • in • o> o . . 0 • • •
. .NO <\i • tO • ro • «»«- Kir«- ■ oomo «- m • ro m KlS. CM NO«- CM •CM «—«»
o o o O
©ror«-NO o> Kiotneon o«-rMro «- N»or--eoro o «»CM «- • >o >oo co o -r«. • o «-©CM • •
■«- -fM «— co • «- CM «- 00 o
«-00 r«. CM ■»«a- ro o«-ro OCMOO OOMCM OOMOOO «— r«-oinroo mcMS- «-to m«o ro CM<O«» O» ON CM ONOCO ot>coro «- «»©000m o to o -co • !«- • co • • in>o«- o • ■ • ©«-too- r«. •oniin»-
• •<) «- • CM • to • «»«— tor«- • OCM«»NO o »r~ • • too • • • CM NO • to-» 10-0 CM <0«-»M • •«- •CM«-ro • «- ■ «- O» t- •COIOCM
o 00000 o
to too to 0- sie oos 0 in to>oo • in •CO
. .«0 O • 0 • CM-O • CM-0 CM CO
0
«- cMror«. «ooo« 000 or- oN-o-u-i t«. r«.or«.«»o« O- «»CMCO o-o-o- Oinr-S OSOIM «- mooo«- • -0 • • «» «* o o • • • or«-«»r«- in «o >«»ro
CM '«»O tON- • O 00 N* CM OO-t— • • CO O O • • CM N0«-CM • • «— .«-«-tO • • • «- O "O '«-tOCM
00 o 000 O
«»toco RS «»CM r«. S.N.O CM CO to O CO CON- 0 ro«- m «0 r-o m CM to oo<o NO«- «» CMS. CM co«» «0 OKI Ovf O CO«- CM CM mo m CM 0- >o r-o • «» «4- . . IO CM O 0 ■ " • O CM«» O •O •© CM
. .%o «» • m«- CM • too tor«. • 0«» «»co © •!"- • «— ©or- • • «- in • to CO to«- CM «0 «- CM •CM «- tO ■ «— -CM ON • «-tO CM
0 0 0 0 0 0 0
«» 1«-© 0 «- roco «0 mr«. CM O «-CM 0> CM©
. .«0 co to oco «-«0 • ro«- to«-
0
«* ro«o«- roco «0 ©«»«-«» ©000 «» m 0 r—«— %o r«. «»«-to tOCM «- oinino 0 to 0 in 0 «» 0 ro«-o
(MOO 0 • • • 0 CM«- 0 «— • to 0- ro«o • oto tor«. 0 • t«. • CM co © 0 ■ • CM «0«-«- • CM «-ro «— 0- "CM roto
00 0 0 0 0
o«»o inN. CM-O «_ OON «»0 ro 00. 0 o> 00- «—0 MnS o>o> «»r«. N. t«.<o«» OIM CM
-0 coo 0-0 r«. 0 • • • . . «0 «»CM ror«. O •CM 00 ro«o 0» OO CM CM
«-in • «» «- «»«- CM in«- «- •CM«-«* 0 000 O
o eo o in in in o © «o o or-.NO«- r«- «ocoocM omtocM • 00 .«-«o o -«o • «» too ON • •
• «- -CM «- «- -torocM 00 o
«»«»p ro«o roro NO toroco OOCONO 00«»«» ©«»«-«» «- roor«.incM omr«. Kin o>ro ro inroo CMCO«- oinON OMO-t «o •OOIMO co«-o •>» • • • f«. • • o«»m o • • • OONONO • ro© •»«-
• -NO NO • N.CM ON -CMCO roNoo 000«- o »in • ro «-or«. • • «-NO ■ «»co «»«- «- m«-«— • • • • CM «-ro •«- •«- «- «- »«-roro
o 000 o 00 ©
OSSN 00-00 oroo>r«- ONOCMO © . tO • OvjNtNf oco -NO 00-«» • •«- CO CM • ■ • «-
o 00©
CO «»CO -»«* «—in «- NONO t-.N0 O-ON «- «»© • in
. .«0 o> • 00«- CMNO • «»CO «»«-
O
NO NO CM inr«. «— insr- ro«-m ON • • «-I«. co
■CMCO KINO o> in «- «- • • ■
^N «I 01 0) 01 c <0
Ü it ^ m* c CO a. i- z
N«. 4J 4J *J 4J 3 U 01 J3 «•5 a 0.-5 a 0.
a C Z3 = C 3 3 ■g«. VKU
—• Z 2 01 O CO «^ 1 1 z CO 3 3 3 01 er «t- Q-ro ro a ■M oro to 0 ro ro O 4J « t- UXO« CCS 0 t- SO <- f SB-» 3 0 z z 0 3 a z z (3 zz <3 — w- CO
_J I.J1 (A 4J 01 2 01 01 CO O C > O > O *J _i
(0 0 — —• Ja 01 r ♦*
4^ — 0 < a. < ea < z —1 4J
0 01 VO O o c e 0 at a o c u
_ . L^O fl L^ O a L L^O O LL-- H- 01 CO H- 01 CO Z «y. «I 0» <o NV. 0> 01 CO
«LD.VOLQ.tJ CLO.lVIILa.3« ->30.0C030:0 *•—'3O.OOC03Q.OO
'" 3 H L w 3 h C>«I3 J>- LUSJh N)- «J.O. «). 01 —• co ai et o, _i or o cs o o ♦J co «J «J
Appendix A Shenandoah Model Segments Results A51
ro CM© in«» 0 to • 0 ON to 0-
00 •«»«- «» CMO eo • • «— «- •«-«»ro 0
c 0
c «- c c 0 •M coo
co o~-— (A N C ••- *■» *■» l_ »Of«« 01 —•— CO N N > <0 4J Ü M- M- c L. CO ~-—• —■ 0 01 ü H- ••- •»- u C .- «- JJ Si
•f H- L Q Q z r-*"!! © Oi z *» z •-• ►- 0 «3 —
os croro ro ac OlIIZO «-. -1 © z z z
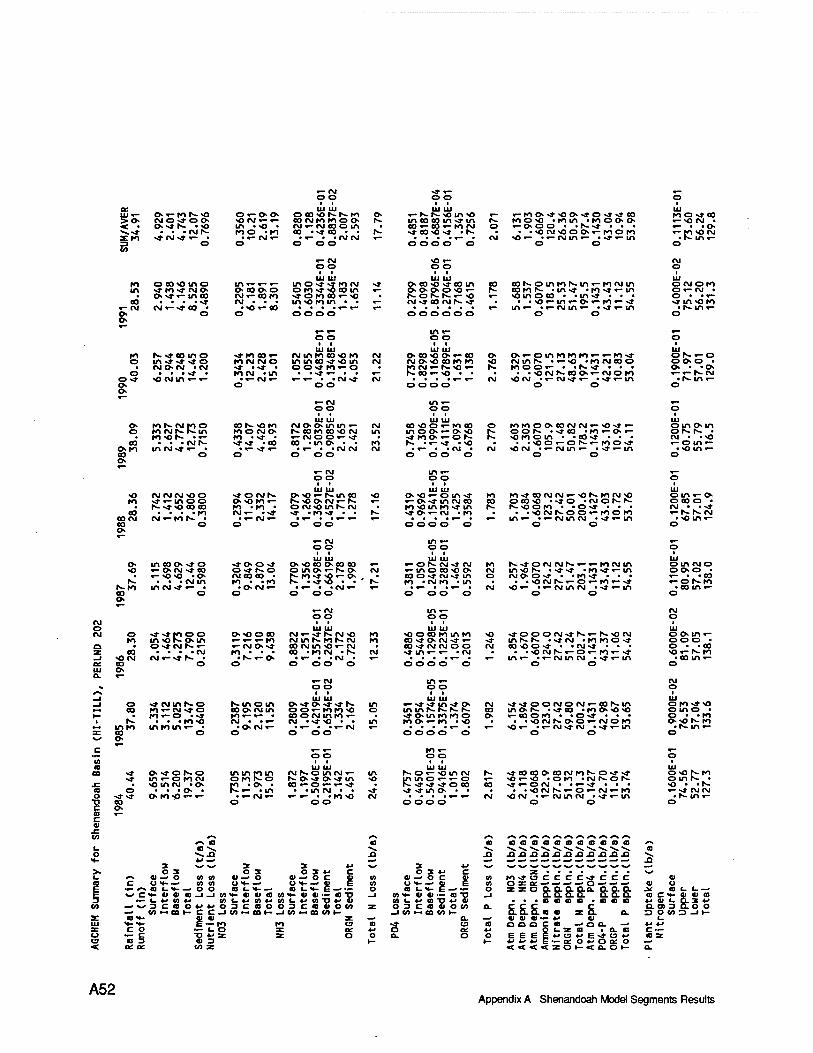
«— CM v» «— o o o o
a. Ul UJ Ul Ul Ul«- O «-ro N-sO o«- o o OCO>OSNK1 o «— r*» N- «o m «o «— >o NO-fO» so CM «- «- co cMro ro o o h» m co co in »» in r>- < • O s»ts. »so m • so ■ CM «-CM co o m co «- eb w- ro CM o •^-* • • • CMt- roo -ro CO • N» CO • • fs. «» co <o v* • r— ZKI N» CM»» «- • •«- CM«- • «- ■ -CM CM «— CM Z3 GO
O o 0
E-0
1
0
E-0
2
0 o o o o o
o o i i
Ul Ul rO o coo in o in «- «— «— in o N» N» ro CM
o ro •» so co in >» o co «o N» co m
O o o o «o •— co
m s» to N» CMO O CO o o r<- o-»«-meo CM»- coro s» o ro co«- so r-- o N- r»- •— «o «—
03 CM • • • in <o ro m • • «— CMstCOCMNst ■
«- CM CM «-N» 00 • • sO «— CO • • • ■ «— «— «— o o
O O o o o o o o o oo o «T— «— «—
o o I I
Ul Ul
m •>- o o ■ i
Ul Ul ro N-«*ooino «»ro eo«- CM into eoso ro CM O CO «o O «— CO o Ö in N»N» N» o rOCM CMO m in co N»SO in CM CM o <o oo ro ro J°
CM ON 'CM ■*•«*• o o N» ro«-o • ro CM «- r->o •— K- co«- <o • •
r>- o ro CM »in • • N»«— • •
ON» «o cMin «—«- •«- CM«- «— «— • "CM N» CM CM o o
o oo o o o o «—
«- CM o o
1 t
m «— o o
■ i
o (OSNMO ro cMfs. S-in ro so r— • «-
co r» «oro Ul Ul
CM o o in in «- CM Ul Ul
co o o «-ro oo o o ro o CMO r*- oo ro CO so CM in in o o «— o «o fc ro •«» • «- CMO O«- s» •4- ro o «-o r>- 03 • • • CMIN- s»s» -co co «in o • • ro N- •«- »» • >o
oro m CM«» «- • • «- N»«- • «- • .CM CM CM •«- • -CM • CM 03 o
o o o o o o o o o
«- CM OO
1 I
in «- o o ■ t
so CM CM CM SOO s» o CMS. Ul Ul
o so«- r-m co so Ul Ul
O «O «— o in •* ro to s» «-in o o O>OM>- N- «oo CM«- r>- «— «- o-tf m CM co oo
rs. N»«O co co ro • ro • o CM«O mr- CM • ro <o in ro -» m r>- 03 ■ • • -ro CM»- •>» N» -ro •» ■ • r~- •<t o «— CM • ro
03 CM NT-MS • •«— CM«- 03 o
o O o o o o o o o o «—
«— CM o o
1 1
Ul Ul
m «— o o
• i Ul Ul
o in coo»» o N»O ON» O »O 00 O 03 CO «— o r»- CM »» CM ro so «- ON »TOO ON» IN. o OlflOt-KO CM «- in o co <o o CM
*— so so ■ o JMC0 CO • t- ro»» «o «— o . r» • v» >o • •
■ co o *» CM N» in o _ rs! • • • CM in ro • »ro r- ro »CM ro • m |s-rO intM-*»- • •OlM«- • I- • '«M«— CM 03 o
o o o oo o o o o
«— CM in «—
CM O
o o o o Ul Ul Ul Ul
CM o •»•»MOO in<oK-o>in
»voon CM «r- N» r«- CM <0 ro •o o oo ro m ro •O rO «-«-«- ro CM in s. ro r— CM ro CO >» O CM-» «- v»
Q O «»CM 1--«- i-IMO>>t co CM in so«- CM CO •» CM CM O O CM z CO ... .CM ro • • • co «ro CM • r» CM •* in «— «- -CM —i «O CM CM «-N» Is- • •tV-T-O • «— • »CM • «— • • > • «— • «— OL 03 o o o oo o o o o o o Ul o a.
«- CM in «- N o o o o
1 I i i —1 Ul Ul Ul Ul —1 o vtNinNo Mnom O S»ON»N» ts. in «->»»» in ~» o CM
03 ro«-CMN»o coo CM in o o«-roro so o CO 1— ro «-O • «» ro«- «- • COONinKli- «» oin ro ro o O
1 fs! ■ • • ro so CM • •«— CM 's» SO • • in ro o«- ro -»o into in rom «- • •OCMi- . «- . .»-CM «— «—
X co o o O O O o o o o o N^ o c «— «— ro «- M
O O o o i ■
CO m N» O -»O N-O in in ro in
oro K- o Ul Ul
NNomrjr- in Ul Ul
h- o «— NO in CM r-- N» in «— o ro CM r>- ON» ON» in •o in in o «— «- o
^•»•»•»oeo ■c <o incM >o ro • o • r>-«- -in
co «— o *— «— N» co CD o • • • o ■ • • in CM • • N» >* »»in o • • O N»N» oro-o «-«- • «- CM»- «- «- • »ro <o CM CM
TJ 00 o o o o o o o C o ID C 01
«—
«-roo»»>oo«»o«*.»eo ro o <o • ro m «roooo •-0 o o • •»•-«» • • •
. ■ so CM «o o o «- ro o ro so«- •«-CM in «- • s» «-in
o o
eots.oinrols.m«-rocMm co ro r— ■ m >» •ro«»«-m so m o co • • m s» • • •
• • so «- m «— o •— ro •- s» in «- •«-CM m «- • s» «-in
o o
o«-omrororo«-«-ros» CMinfs. .«-so •rocMooo rooo«- • 'rs-s» . • ■
• • so CMS-oo o«-CMO ro SO CM -i-IMst <- '»»«-in
o o
rorooococMCM«-sOs»«— oos '»»co .ro«-o«- soroom • -cost ■ • •
• • so o «-o rs. «-roo s» so CM •«—CM m «- • •» »- in
o o
rO-»COCMCM«-sOts-rOCMsO O CO so • s» O •NOMs rs. so o ro • • o s» • • •
■ • so CM r--o o •— ro o ro m «- •«-CM in CM • s» «-m
o o
r-s»ocMCMr— «-«-rocMin insors. . s» s» •Mst«-m CMOOS» • •ro-» ■ • •
• • so CM r- «- o «- ro «- •* so «- ««-CMincM • s» «—in
o o
•tOOON<tS<- Is-sOCM mss '-»CM 'Kiroos» CO SO O -» • . CMs» . • .
• • so CM r-«- o«- ro «- s» in«- • «-CM in CM • s» «-in
s»s»OOCMOCM«-C0rs-in mors. • s» co • ro o so so «-CO O IO • "Os» • • •
• • so CM rN. o o «-CMO ro SO«— • «- CM N» CM • N» «-in
N»eoeooeocMror--ON»N» so «- so »oro • CM IN. o |N- N» «— O CM • • «—N» • ■ •
• ■ so CM r- «- o «— CM •— ro so CM -«-CMincM • N» •- in
o o
ro o N»CO «-SO CM • «- . «o «—ro so CM
• rs. in «—
i ui o CM oro o«— CM • o • •«- N» m so ro
• rs. m «- o
oS«-o o o o • o • • o •—«- (N-CM
• rs. in «- o
ui o in o in ON rs. • CM • -SO «-o in«- • so in«- o
o m «— o o co o • CM •_ -N»
• so in «— o
Ul o in CMO o o o ■ «— • »CO «-otN.ro
• co in •— o
o o m«- o o o • o • -co so •— rs- ro
• co m«- o
o ro «»so o in o ■ o • -ro oso rs.ro
«ts. in «- o
oso fs. ro om ts. • so • ■ CN. «- N» CM CM
• r»- in «— o
*-v (0 f_ CO s«. o SS.J2
H- 4-» —' 31 S-» V* X >- O 3 O 3
L. <-s «1 _> o 0> «1 <u —• o C osj-—» CO Cfl O 1 • ~- »-S CD t-ss. O O CL«.
t s<C<- U tl CO -1 -J «It- « « ~- C- «w cc ♦J VI L. ♦-» CO
CO —• s^ 3 C «D o «s> <M o 3 C CO —• co •— m 1— c c -J co •— oa
£ «SV. «2 «l Ul SV. H- ro X c o — CO u
< — c
CD =>
0C CL CO X
X
S S. N,, N^, N^ N^ N^ «», S^ N^ N^ N^ N^ (Q SI SI SI Si SI SI SI SI SI SI SI SI SI s^. _. _. _. _^ __. _^ __._._._-J si
31 *J s^ I JJ w WN^WN^N^WWN^ www — O 3 •w C O 3 <-• C X w
oi —< o c v in oi — o c o> to ros»occcCN»ccc cu Ü H- —• 0» E 10 O H- —' CO E CO OX0C—•—•—•—'O—'—'—' 01 o
— • L«-E-"- o «LH-E-- o XXOQ.D.Q. o.a. 0- a Q. x. act ■ cocÄH-oici— co"D _i co H- o» oi •— ca "O _J a. ex SI a. a.a.O. get-« «a vnLfUTJVC Cfl I- «w CO "D «-• 4> •••COCDCDCO'COCOCO •>«!.□.>•' OO3CC0«IOb0 Z O 3 C «J «J O CO a. CCC C Q.DI3 Q.OO ►- -i co •— m c/i t- —• co •-• co GO r- aaQ.c c za. a. 30U3JH
Z —• 0L—•tlOIOI— 4-" 01 l- rO 13 «0 N» t3 0QQQC«l_.QQ.—. VV x a: *J o or «J QC.ZCOIO.COC->- z o o a. o o EEEE«Js3<v>Es»ci«-' cox
i— i— •'*'•< b-rc Or<occ o -- <<<<zoi— <o_oi— a.
A52 Appendix A Shenandoah Model Segments Results
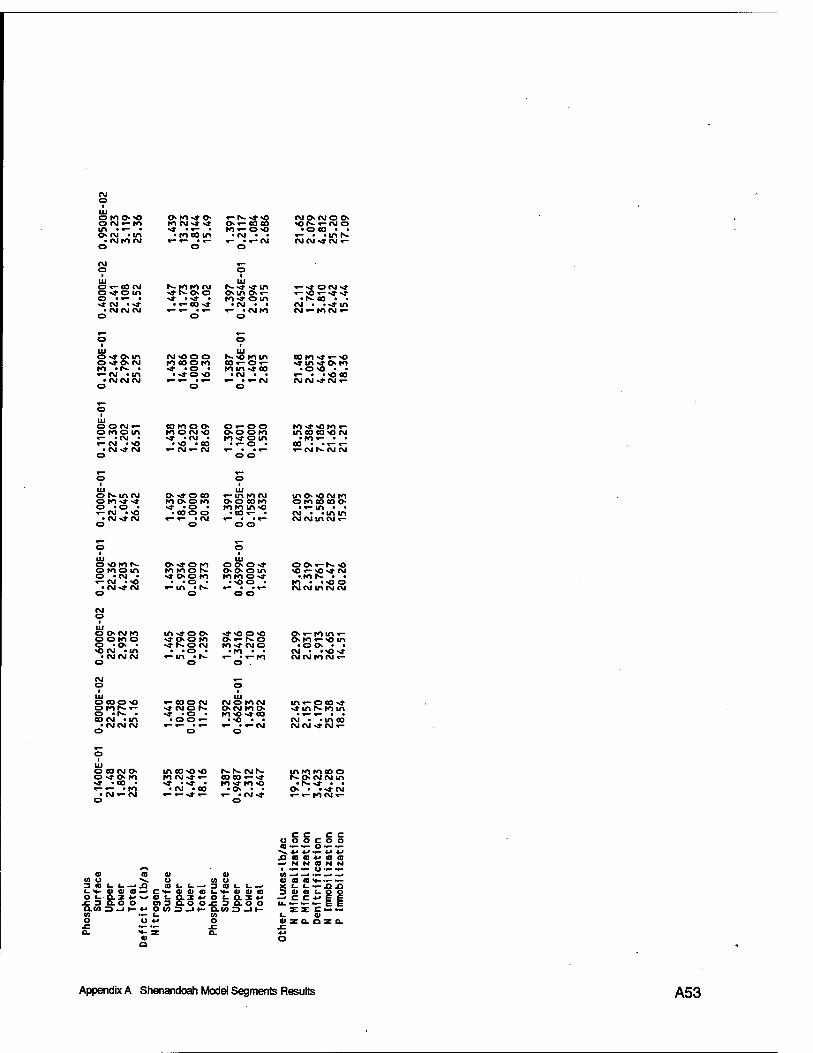
0.95
00
22.2
3 3
.11
9
25.3
6
1.43
9 13
.23
0.81
44
15.4
9
1.39
1 0.
2117
1.
084
2.68
6
21.6
2 2.
079
4.8
12
25
.20
17.0
9
CM O I
«— o
0.40
00E
22
.41
2.10
8 24
.52
1.44
7 11
.73
0.84
93
14.0
2
1.39
7 0.
2454
E
2.09
4 3.
515
22.1
1 1.
764
3.8
10
24
.42
15.4
4 O «»Oin O «» O CM tO •"«- ■ «-CM «in
• CM CM oj o
CM <0 O O to coo to •4- >0 •
. «*o «o
f-XJ IOIO CO «-O«- tom «»co
•CM • ■ «- • «-CM
o
COM «*«-«0 «*in«»o to
• o «o • • «- • »«O CO CM CM -»CM «-
UJ O OCM «- o too lit «- • CM • «-CM '«O
• CM-» CM o
co too CK IO OCM -O «» -CM •
.«o «co «— CM«- CM
O «- OO oo oto to«* oin
■ «- O •
tO «* «OfO «- moo oo«o CM
• to«- • • CO • •«— «— «-CM I«-CM CM
o r«.in CM
o -o • «- CM • «O
• CM«* CM o
o«*o 00 to oo to «* 'O • ■ coo o
«-in to CM o o co to to to in «o
■ CO «— «- «- . CM «- • •«-
mo »OCM to o to CO CO o
• «-in • • CM • «in in CM CM in CM «-
O «OfOf«- o too in O -CM • «-CM ■ «O
• CM«* CM o
111 O O Ost o o o in to to o«* "OO • «— . • «— o o
oo«-t«- «O «O «- JO«* CM
• to I«- • • to • >«o o CM CM in CM CM
LU o OCM to o o to o o • o • <o CM .in
• CM CM CM o
tn«*o o «*ooto «» t«-0 CM
• .o • «-in • t«-
o
-*-o o-o O «- N.O tO«* NO
• to • •
o«-fom «- oto «-«o in
. o o • • CM • •«£)«* CM CM tO CM i-
o coo «o o tot«- «- O •!«-. ■ oo CM «in
• CM CM CM o
«- CO O CM «•WON «* "O •
• OO «-
til NO tO CM OCM tO O to «o «*co .«£)••
«- • «-CM o
O CO CM o m co«o «o t«. t«- CMf«- o«» o to fOCM«*«- «* • 00 • «*■«*• to «* to<o «-«- -to •CM •« ■ o • •
• CM«-CM «-«-«*«- «- -CM«* o o
in to to co o NO>NNin
• I«-«» • • O • ««»CM «-«-IOCM»-
o co tu tu 0> O ««. O 0) Ü 3 <0 L. ( . jQ « L L-3 «L ( . i_H-fl>4j»D—'CH-cuajat-H-ajcua
£30.00 o)3S:oof3a.oo Q.CO 3 _l I- <-> O V> 3 _l r- O.U 3 _J 1- n •— i_ co o O «J o x: «-•— JC a. «♦- z a.
a> a
c c c c u o o c o o «0 M- ~- o — •- «V ♦*" ** *- 4-» *•>
—' N N CO N N I "- — O •— —
a a •»- •— —
(U : . oz o.
Appendix A Shenandoah Model Segments Results A53
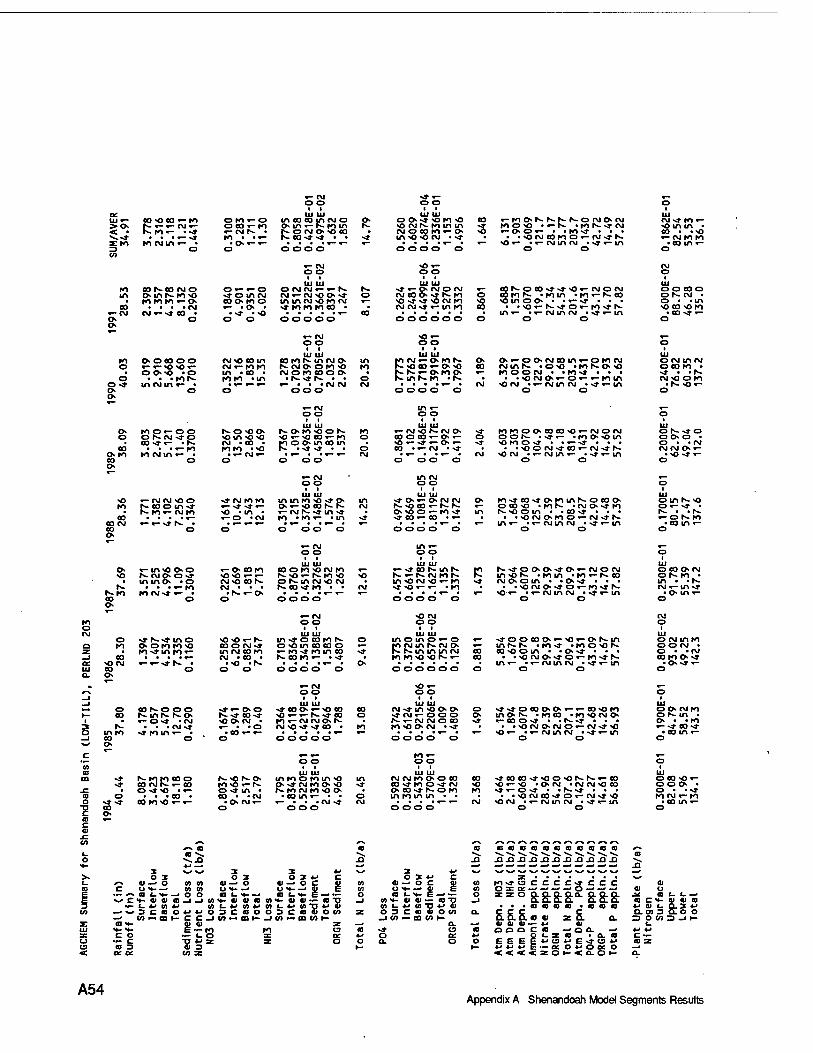
tu«— oo -oeo «- to < • KM«- • -» •-».» . ...— .» JEtO K) (Min «— • 3 o CO
to nsanio in iMnMoo
• to to to «—o oo • ■ • .«M
»-CM «M .--» 00 • o o O
to o ooo oo O •— «— «o «o «—
• oo«o »o o • ■ • tor«-
o-» m cMin «— • o o o
o to o«— o o O OSIM-JO
• 00 -» «- • N- oo . . .T-to
O to to CMin «— • 03 O o
o to «-0 o co «-to i-CMS to ■ •
• o«-«- o
:. fc
UJ UJ m oo oo in CM o O in •— f»- to in " o CM o «o oo
0O-» •» • •
o oo o
O v— «-O -» o in CM oo o- to o «- .o •
• «» --o o o
CM <o 00 in CM«— toto in • 03 • toto »in
NO«» NO m NO NO CM ' 03 • to IO "O
• «- CM«- o
UJ UJ o CMCM «- T- r-- r>- Nr-NOO»«» O in in rvj <o to (M «— -» toto to oo • ..... v— 03
o OO OO
UJ Ul eo to f-- in CM o in r-CMOoto NO to CM oro coo o
• f---» f- • • O T- • • .«V <M <M
OOO
«— IM o o f I
UJ UJ i-- oro NOO f— to NO «—-0 03 «— to O to o o moo in S- • vj- vj • ■ o
. T- . .«- »— CM
UJ UJ o o -» NO to «o NO CM f-- to in in CM o eg to «— o
o o o o o
«o «- o o ■ ■ UJ UJ
>»r-t>(MOI\l CM CO O -» f-- IO «O -» -» <0 <M tO CM CM-» «—in to o o o o o o
oo ■ I UJ UJ
i r\j«— o> to f«- ■ <oeo«-o>o .»--»— oto o • inSM • f--
o o
o oo o
UJ UJ i-N>OMVO. eoocot-O"- >o «—-»»— o •— eo • «- rvj • -» o o o o
oo
3
o 8
r-mo>s.ss.N.oro(MM to o <o • «—r— • ror--.»cM «—O O «— • .fO»* • • •
. • «O CM 00 tO O •—CM-» f«- <0 •— •«— CMU-.CM • -» »— m
o o
COSOCO-J-fOf-IMON co to r-- .iom .to«—r--eo •o m o o • •«—-» • • •
• • «o «- f-- •» o «- to -» r-- m«- • «—cMmcM «-»«—in
■ «- . CM
O«-OO«M00m«-OI0CM CMinN- -o-o -toS-o-o to O OCM • ■ to«» • • •
• • NO CM o«— o«- «-to m >o CM •»—cMincM .«»«—in
o o
1010000003-0»—IMOCM O O N- • S3- %— • to o NO in NO to O -» • • «—-» • • •
• • N£> O CM -» 00 •— CM -» t>- NO CM • N— CM m N— tstr-m
O O
UJ (MNt IO N— NQ in in ■ CO • -NO »-CM tO IO
• co in N—
o o coo o r-- CM • o • • in NO 00 NO to
• 00 -» N— o
UJ O CM in CM oeoto • NT • -N CM NO O Kl
■fN-NO«- O
UJ O N- -» O O ON O • O • • CM CM CM ON»—
•NO -* N— O
CO 00 CM CO ON
«- «MCM NO O KmoiriNt r». to»— CM to
«— «— «» fN- •
«» CM tO tO «—-»-*«- NO • in • «—o -CM
Ul UJ m in to NO N* ON Or-NOOSS *— CM h- -» U"l N» to -to «— • m o o o o
UJ UJ NC O N-ON CNI CM fN- NO 00 «— f-. |N- ON NQ O N— tO -* -» 00 N— CO • «—
o oo o o
fo-»eo-»Ofoinf--oeoo o oo NO • tor- -CMON-a-to Nvooin • ■ co »4- • • •
• • NO CM O tO O N— CM -» f- mN— • «—CMm CM -Ntr-in
o o
o in r»- NO o «—» • r- • •r-- r-ON.rO
• oo m N- o
to o CM
0 NO
tN- r«.ro 00 ON
o to
NO CM 00 O
«— mNO ONO IN- CMO. O-* in in ON • o
«»f^>» mo ON oto to NO to >*in to»-
■ ■ a . r— «— N— ^" fN- •
T-O 00 to NO NO I" «— CM NO 03 fN- CM • • •
.fN- T-O o
NONO«-fN- COOCNINT in CM oo to CM ■ 03 •
• NO • fN- o o
_ o co (N-O OO •»«—oo t— co fN- in fN- fN- ON IN-Sj- CO-»
•-ON* -CM NO O CM • a fN- • • • CM-» i- . .o o in to •tininr • . oo«— «— —J oo o o N^ ON
00 o to NO CM to NNON-NKINO o fN-in CM NO CM f>- CO N» to • • .... «— «— oooo
NO
CM
0.45
71
0.66
14
0.12
78
0.16
27
1.13
5 0.
3377
R «» •—
«—CM oo NO CM o o UJ Ul
m N»O ooto f>- o NO in co co o «— to -» to in co fN- oo to «— • -»
o oo O"~O
o -» o 0.
3735
0.
3720
0.
6555
E-
0.65
70E
0.
7521
0.
1290
«— oo 03
O
«— CM o o NO«- o o UJ UJ
•» COO «-NO 00 «O «— «— I-- N» CO Kl I-CM N ON N CM NO s» -»00 •
eo o to
Ul UJ CM -»in NO o o -» CM«— O O O fN- «— CM CMO CO tO NOO CM •>!
o o -» o o o o o oooo
N-.»O00-»0«— CMOCM in NO fN- • to in • to N—f--oo CM o o in • «ON» • • •
• • NO CM O-* O «—tO-» f-- N0 «— •«—CMincM «-»«—in
N»OOCOO«-NOV— Ofv-in infN-fN. -to-» •MONON (JOvOom • «o-» • • •
• • NO CM O-» O«—tO"» f-- m *— • «—CM in CM --»«—in
-»-»O00OO«—«-OONOtO inofN- •toco •toocMO «— 00 O -» • "fN--» • . .
• "NO CM OCM O«—CM-» NO «o«— • «—CM in CM .-»«—in
O O
UJ O 00 O CM Of-.fl« in • ••-. CM «— in -»
• o in «— o
o CM in to oo CM • O • 'CM 03 IO O -»
• O -» v— o
O O CM to ON- in • o • • to «—-»co-»
. co in •— o
o UJ UJ UJ UJ CO -* fN- toto eo o
CO CM h- N— CO N-ONtK in too to in NO in CM CM to OO CO co -» to NO «-f- O N»CM to O NO -» oo -»to O-» CM NO
■c O -» NO • «— o -» m • f--to CM to NO o • o co •» fN- o to to CO o ... CO • 00 • -CM . oo in «— • - o in to in in • • o -» -» CO to NO «— «— •O CM«— •— • • -CM •» CM CM
■o CO o ooo OOOO c o
-»ooco-»«ooNOfN.f--«—co NO«—NO -OCM •CMCMNOOO -»«— o -» • • f--sf • • •
• "NO CM C0-» O«— CM-» <o «O CM • *—CM in CM «-»«—in
o o
o co NO «— ooo • O • *N» IO CM «—to
• oo m •— o
c u
•*- I- _. w 3 -• CO CO «•-
«♦- «»- c o •- c
CO D a or
^N CO CO N-.
4J —• 3 «—' --^ O 3
—' O U 01
cv cu *■» CO ' C CO — CO {
"V,- co :
I -J « *4-
> 4-> O 3 : c -i co I CM :~-fO
c- o
3 3 *j O 3 O 3 «J C
—' O <J — O C «2 t- —■ os—• ü e t-N*-—« a L«. E-» — 0)CU<00)H-t)CI— <0"C V P)«' (A l-«J (flTJiJ fll C<oo3Ca»oia •-•COr--JCO~aiCOr-
z to o
0 IS OOQQiOQQtOQ'StS -**^ -^ -^ *v. v» •-. v» ~^—.--.«-.-v--.-^ a J3 -O XI J3 XI XI JD J3 J2 J3 JD J3 JD --, —. —• —» _«—.—>—*—#—._«_*_• —. XJ N^ 3 ♦> -^ «^ --■ «^ «^ «^ V^ «^ -^ -^ N^. W _.
O 3 4-> C ZC. -^ 0) «I —' O C «> CO KI-TCJCCCC-fCCC 0J to O *t-—. 0) E 0) O S CC—• — — — Ö —'—' -* «I o O CO «-•»- E — ~ O ZZO 0.0.11.0.0.0.(10. 31 CO C- I ' _i to •*• <u tu ~- a "p _i a. a. a. a. a. a. tx co c •*- «t> «> a
u L v «Tj v v • **nmna*nnn ** oi c o. 3 *J z o 3 C co ii o co a. Ccc C Q. en 3 C O O
_J CO «— OS CO t- Q.Q.Q.C04J ZCL a. 3 OU3 Jh —> a. —> cv cu cu — «J <u c a -» C3 CO OOQCCO—OO- -• f « 4J o a:«u oc-zcoicxac — o a. o O EEEEfOf E<»o« coz t— t— 4J*-»4-»E — K O^OK o -'
< < «t «t z o t- < a. o i- a.
A54 Appendix A Shenandoah Model Segments Results
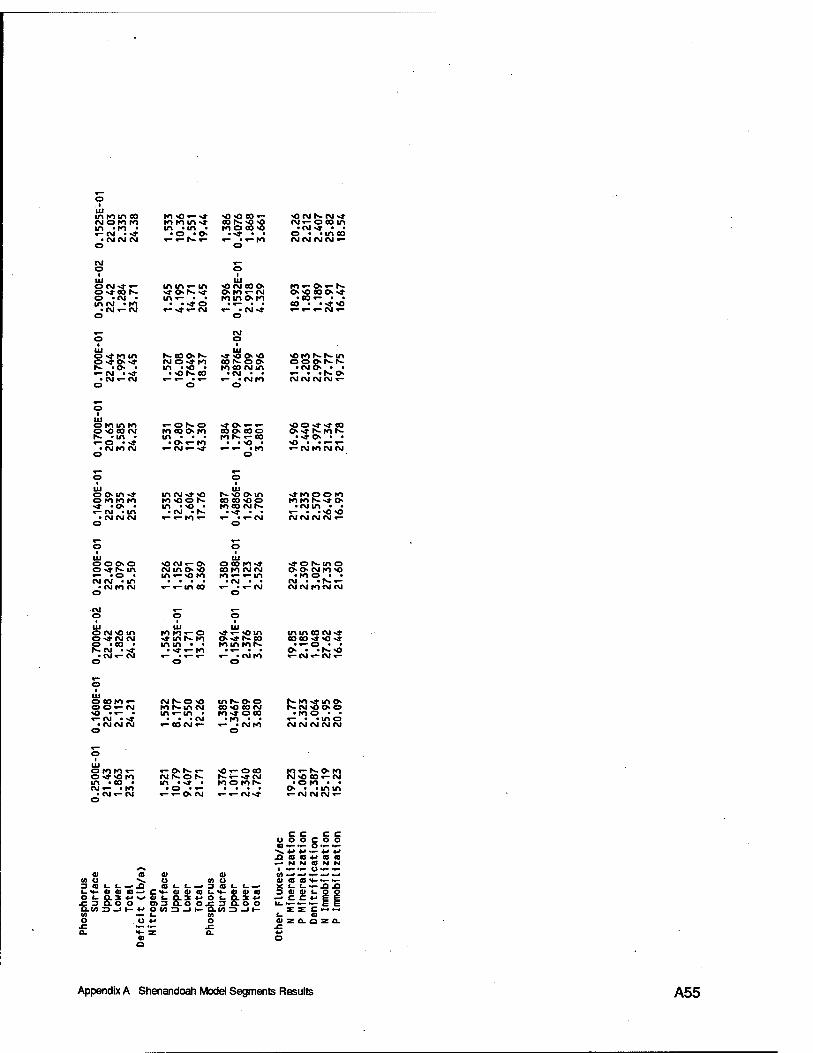
m ro in CO CM o ro ro in »ro • «-CM • «*
• CM CM CM O
M «£>«-«* to rom>» m • in •
• o -o «— «— N. «-
00 N- <0 «0 ro o co<o .-a- . . «- '»-Kl
O
«o ru r«.cM«* CM«- oca in
• CM «» • • o • -m eo CM CM CM CM «-
UJ
o «*co r» o -CM • in CM -to
■ CM «- CM o
m m «— m in«— • ■
• -«*o «-«»«-CM
«OCM oo o oro «- CM «in OKI
ro«- o«-r«. O"OC0O><t eo • • «* »o «-»-«-CM «-
Ul o «*ro m o«»o«* r«. -o • «-CM • «*
• CM«- CM O
r-caCKS CM o«* ro in "O •
• «or«-eo
UJ «*«o o«o cor«- o o rooo CM m
• CM ■ • «- -CMKI
O
«OMSSm oo or«- r«-
• CM o • • «— • • r«- o CM CM CM CM «-
ui o ro in ro O «OCO CM r«- • in • «- o • «*
• CMKI CM o
rONO Kl CO OKI
• o«-ro «- CM«- «*
•tOi-<- eo o co o rot» «-co
. • %o ■ «-«- -to
o
■oo-fsf eo o «* r»-ro r» .«*0 • • «o ■ •«— «—
«-CM ro CM CM
UJ UJ oom-t m CM«* «o N^)0>in •»noon o roro ro mioos eo co «o o KIKI r>-«» O
in • vo • roeo CMI«. • CM in • • «-CM «in • CM • I«- .,» . .
• CM CM CM «-«— ro «- «- • «-CM CM CM CM CM I- o O
O O O O O CM«- O oco ro«* NtoNmo o«»r«. in CMin o<o eo ro CM CM oo cMro -o «- .o • m«-«o ro ro«- «-m • ro o • • CM CM • m •CM • • CM • •!«.«-
•CMKI CM «- «-in co «- • «-CM CM CMKI CM CM o o
CM ,_ ,_ o o o UJ UJ UJ OM-Om to ro«- o <t«-<Oin in in oo CM«* 0«*CM CM «* ins. ro O«* r«-eo coco «*«o «* o -co ■ in in • • rom ror«. .«-o • • r«. CM • «* • «*«-ro O • • r*» «0
•CM«- CM «- -CMKI «-CM «-CM«- o o o
1X1 OCOIO«- CM N-O «O inN- oo r>ro«*in o
K-CM«So o O O«- CM ro r«-m CM 00*0 CO CM «o •«— • in «-in ■ ro«* oco • ro o • • «-CM •«» ... CM • ro • • «— • >1AO
• CM CM CM «— CO CM «- T- «cMro CM CM CM CM CM O o
O KIKI «- o «*<o ro in >co • CM «- »Kl
• CM«- CM o
«- O S- «- CM r«-o t«. in •«* • . o • »-
«-i-O CM
<o«- oco I«.«-«»CM roo ror«- «-«- CM«*
ro«-r«.oro CM vO co «-CM
• o ro • • o • • in in «-CM CM CM «-
«I CO cu (DO "«. O CO 3 <D f- « ■ Jl CO <- < ' 3 _ t-«>-aicuco—»CH-cucucac-s-OJ
c c c c u o o c o o a ~- M- o ■— ■—
JDIOWIII —■ N N CO N N I — ••- o ••- •-
CO CO H- ••- M- «- « • X «- c — -Q J3
0(.a.2«<v^<Ui.Q.3«JO<-Q.Z4-' — C C 4J j= 3 rxo o n3aoo£3aoo u.»-«-«-
c •-• — at o as a.
ai o
Appendix A Shenandoah Model Segments Results A55
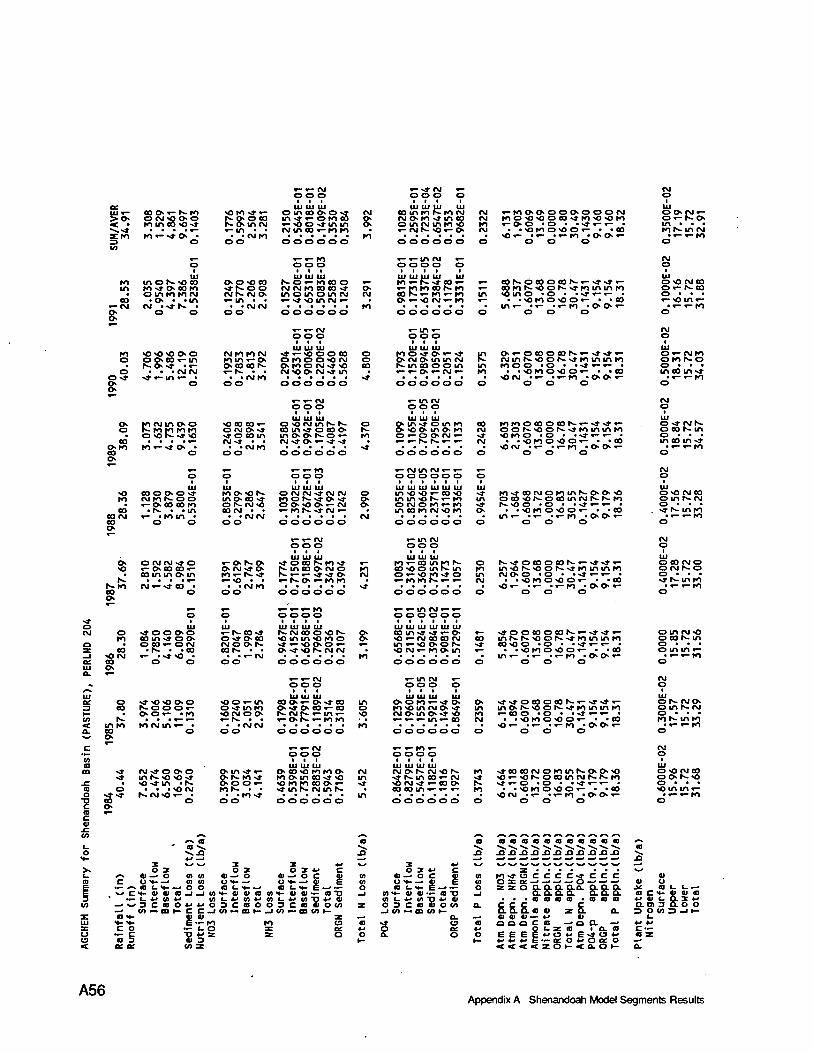
tu»- oo o«- f»- to >o o IM«© oo < • Mino>o-» -«^N» • •••«— §to to «-«* o •
o to
1U to moSMia in to «» o eoto
o into to CM oo >o • -in
«-CM CM • «» r«. ■ o o 8.
to «O'O'OO.O o o oco «-in
. NO«^ • «— O • • ■ (MCM
o «» «» «— in «— • o o o
KCM in o o to to to to
o «o t«- «» o
«* o CM
oo CMO co o
ui «o oo o o o «» tO CUMNOO
«- ooo eo to oo >h> • >m
oo CM «- • to in • eo o o o
O o CMCM «»o «o «-oco eo«-
• oo in in oin
r«.ro CM«-^N» co*^ co o o
o «» o o oo to oo m «» o o
• OOr-OfM
«O CM «— • «» «O • 00 o o o
«Oto«»«— o m co o o «» SO.OO m«»«-otoeo N. o in CM •■*oO'tini/i •-in • • CM in oo «— to to
• • CMIO oo oooooo
o o «o co «»t-o o CMK- CM o
CM tO tO CM Kimi-o OMDCON «— t*- • •
• 'CMIO o o
•geoa<- O CM O«» NtOffllfl (MNf • •
• -cMro O O
IU MO-NON mo. co -t OSN41 CO CM • •
• • CMCM o o
«— O t«. O ON CM-* ON to«-1«-«» «—NO ■ ■
■ «CMtO oo
«-t«. co-» O -t O CO CMO O f-. co IN» • «
• "»-CM OO
OOO I I I
IU IU Ui NOi-KKOO CM CM tO 00 CO «» in om om CM »■•»«oinNf
dod odd «—«- CM ooo I I I
ui UJ ui NtrOOO» o to o o«o CM ON tO O CM.» «O CM «o ON CM «» in
öööööd
tu tu UI o >o CM mf— t— oo in«» o co o in o O I«- o «- CM «» o «— «* -»
oooooo
UI UI UI O CM CM -» CM CM to o I«- «» o «» O O-O O«— (M «- tO t~- -* CM «-
oooooo
UI UI UI «» o co r-- to «» S. in eo ON CM O h- «-«—«»«» O «- t- O «- to to
oooooo
«-T-NT-tO o oo o
I I I I UI UI UI UJ MMOONON NO in tn NO to o «» «-«0 OO «- ON «t «O t- CM CM
oooooo
«- .» CM «- OOO O
CM
to 0.10
28
0.25
95E-
0.
7233
E-
0.65
47E-
0.
1353
0.
9682
E-
i-i-mrj «- o oo o o
o CM
to 0.98
13E
0.
1731
E
0.61
37E
0.
2384
E-
0.11
78
0.33
31E
«-tn «- ooo
O o>
CM «—fO OO O O OO O O CM «M to o «o «o o co-» to «o «o to tO «-OO "O • • «»«-«- • CM • •NOfOONOO«— • 'CO
• NO «— • «— • •— tO • ON O *—* o ooo
«- tofN.ooooeoN'-NjNtr- «- CO to t-<o o f«. «» to in in to in NO m o «o • • «»«—«— • «- • •«OtOONOO«- ■ «CO
• m T- • «- • T- fO • O O «~ o ooo
tO O «» ON«— «» o CM ON mm CM Smoooin «— «— O «— CM «—
OOOOOO
IC
«— m CM ooo UI UI UI
O O in «» o in to ON NO ON m t> to t~-
to Oi-OOMMr- «- T- f- f>- «~ «~ «» oooooo
oooooo UJ UI UJ UJ UI UI m NO NO *— co >o in in «o I«- «— to o CM o to «— to m oo to IM NO ro
oooooo
ui ui UJ to «- oo m to f«- co NO o m r«. m o «- «o to«* o «— to ro K-«— «—
oooooo
<---in(Mt-N- oooooo
I I I t I I UI UI UI UI UI UI co m «a- «* «— o •O T- CM CO 00 CM in T- «o ON o f«- «O CM «— to O in
oooooo
O«-OOO00S«-«tN»r- cMinr«-«00f«.«»toininto
m too o -o • • -»«—«— • to • •«onovjor- . .oo
■G CM •«— -T-tO »OO«— o ooo
co to to o eo o eo f«-«-«»«» «- CM o o r«. «o o t«- «» to m in to «* NO to o -o • •-»"-«—• CM • •onoooi- • «oo
• NO CM • «— NT-ro •o-O"- o ooo
«» to «* eo CM o to in I«-O O »O m o co NO r«-o co m CM r«-1«. to «* N-NOO -o • •«»«-•- • o . • «o to o «o o «- • • oo
• m«— •«— •■—to »oo»«— o ooo
o f-«j-o co o co f«. T-«» «» T- to m «o r«-NO o r«-«a* to m in to in CM o o «o • •«*»—«—• «M • '«OMONOOI- . .co
. >Or- •«— ««—to «00«— o ooo
«aooeooooi«-«-«*«*«- int«-r««Noor«-«Ntroininto OONOO 'O • •«*«—«— .
• •«OIOONOO«- ■ -co m «— •*— •«—to . o o «—
o o o
O ON CM«— O«- («-ON
UI O NO CM 00 O «- I«- 00 o • • • «— «o m «—
CM o
O «— CM tO OK1NO O • • • m oo in«»
• «-«— to o
O «» CM t«. ooMn
in co m «»
UI O NO CM CO oinsiM o • • • «»I«- m to
■ «- «- to o
CM o
UI O CO CMO OIMNO o • • ■ NJ Sinn
• «-«-to o
o in m «—
o ■U c CO c 01 x: to
O «» <0«0 ONO oo f«-o o o«-
■ o> o«— »to Is- ...«—«—
into to (Min «— • oo o o
«» CM-»0 O O -» ins NO «o «»
• NO -» m -t«- o ••■ NO CM
«* «» t>. CMNO «- • oo o 0>
«oo «-in o«* m to «NO» «— t«. . .
• -CMCM OO
ÖNS. tO «# t> O O «— fO t- • •
• • to -* o o
UI UI UI OOO-«- ON «»CO ON«» ON 00«- 00 I«, CM N. «— m «- «— ON fN_ «— tO tO
oooooo
ON 00 «O tO tO ON to ON tn CO «» NO
oooooo
*-« 40 f- CO ««. o ««.XI <-» —'
3 «^ «^ 3 3 >. O 3 O 3 O 3 v C ^-. (V -> O » m at _. o ai — o c CO C Ü M-—• to to Ü*. —• Ü H- —• 0»
.^ *-« m t. H- —.* o o tO C «I- —# a LH- £ >^ ct- * m o _l —1 git- ti V a «i«- oi ti-
H- L «J « W ll t-NUtO-MtOt-NN^COTJ 3COOO3C«J0i to — v^ 3 C to O *-» *•* o
—< to •-• CO t- c c —i to —■ m i— _J w — eo to z a •*- V 01 UI Nf- H- to to X c o .^ I. o z u — c T2S z z a a 3 < ec ec. CO 3
a "«. XI
t- >«-. E — — O eo ~a «w tu o <o
UI UI UI UI t>> O tO «-«» O- to «om CMO «» CM om o«» "O «—«—«— m «— co CM
OOOOOO o
«- «- to «— O O o O
UI UI UI UI CM O t«- CM «O t«- «» t-m oo «- CM «O CM«» «- CO O co oo in «-«- «-
to
it to
oooooo
3 o
01 —• I s- _ tu I t- N<- E —»
O 3 C -I CO —i
01 •— «0 T> a ü to to
«»«»ocoooof«-«—«*«»«- mON-«oot«-«»toinmto «— CO o • o • •«» «— «— ■
■ • «o to o «o o «- . .oo NO«— •«— ««—to «oo«—
o o o
N»oooocMOtomr«-oo«o «ON-NOSoeomNSMo «» «—o -O • • N» «— «— •
• • «o to o «o o «- • «oo «o CM •«- ««—to • o o «—
o o o
Of- CMO oinMM o • • • tot«, into
• «- «-to o
o «o CM co o o f-.«o o • • • .om in«— .«- «-to
o
S o
C0 tONOtOIO-QtOfiStOtOIOlO ^« »«. »«.•««»«. s«. *«."««»«."«« ~«. •«« >«, 10 XI XI XI XI XI XI XI XI XI XI xi xi ■-«, —« ^ _._»—._._•_•_»_' —# -w xi
c z «^ 0) to tO-»«3CCCC«»CCC 01 E to o = a—• — — — o — — —< oi a
a -p _i aaaa 5151 a. to c •*- 4J tu ••.totototo-toaiai v t> L ocoo. ccc c aoi3 h- o.a. a. a oi z S. o. Z3 o to 3 _i t-
o. —* oi oi o» •»- 4-* o> t- o to ooocto -o a —< v*> CC 4-" Qt.za_io.to c — O O EEE_4-»«34-'E«»«3--' to z
t- v w E--t- O^OK O —- «c<<<zOi-<a.o>- o.
tu oi to S.3 4-> O-O O
A56 Appendix A Shenandoah Model Segments Results
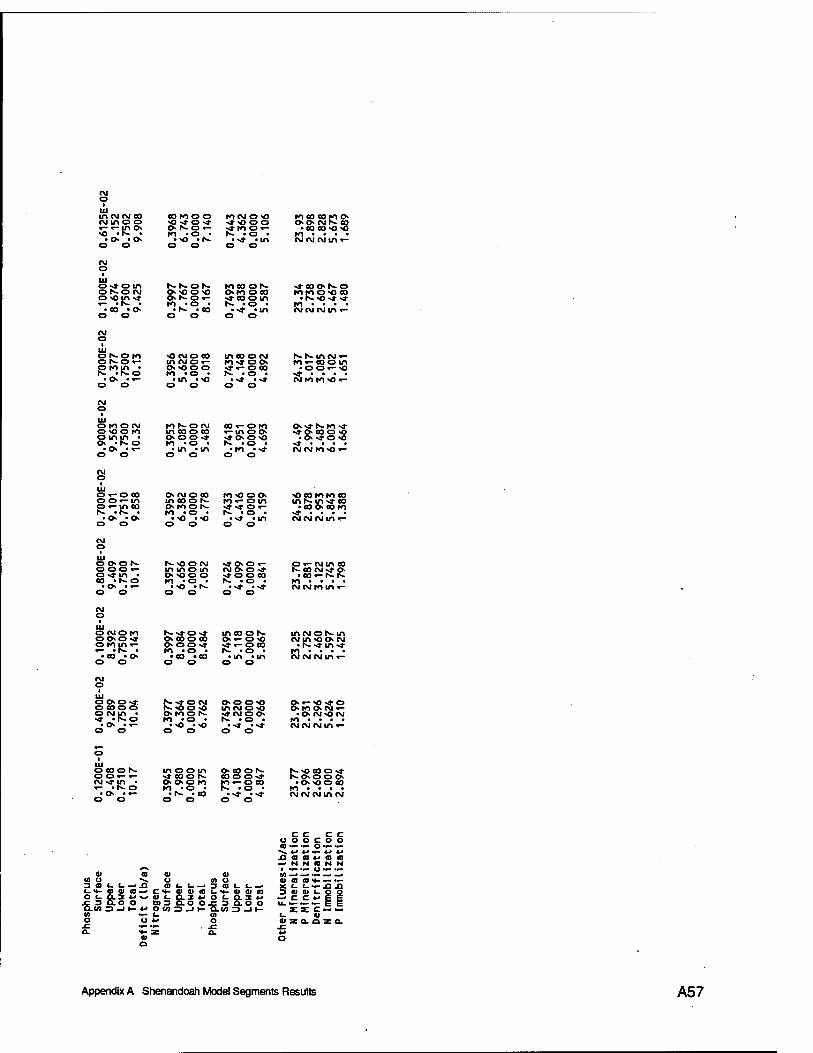
incMCMco eotooo tocMO«o Ninoo so»»os» -»-o o o <->-ino> ost—o«- <>noi- «O • r- • I<1 -O ■ |s- • o •
• os ■ os • sO • N- • sj- «m o o o o o o
ntoomck OSOMMN-CO
• eo oo-o -a to ■ • ■ ■ CM CM CM in «-
CM o
OSON o soin s»- • CO •<>
o o
f-.fs.of- nooos »<oo« OstOOCO o>|s-o«- •* co o m to -o • r-- *o •
• s- • eo • *$• .m o o o o
s»eo osf>-o to to oso oo
• r- «ON» •* ro • . . . CM CM CM in «—
oson oso<- O IOU1 • is- -F-o
• os • *"" o o
<OCMOOO ineoocM incMO«- to-joo o <o o o vtT-oeo to <o • K- • o •
• in >vo •«»••» o o o o
fs-f-mcM«- Ki<-taom <OOr4
vj- . . . . CMIOtOsO «-
O to O CM o <o o to o in in ■ Os -Is- o
• O» • «— o o
IO N-O CM in co o eo to »o • • in • m o o
OOi-OM «—moo s*o 0*0 Is. • O •
■ to • ** o o
-*o ooo vo • O s*0 <G
<(■....
CMCMfOsO «-
IU Or-OC0 OOrm o »-in oo t- • ?- • • o • o
O fOO S. to -o •
• *o "NO o o
no o o to «- o in
|s» ■ o • ■ «$■ -in o o
«O eo roto oo in Is» in s± co
• co ooo to <t • • • • CM CM CM in «-
o o-o r~- o oo «- o>»in • eo «b> o • os •*— o o
K- sOO CM in in o in o -oo o to -o • • SO -|s-
o o
>»o.Of- CMO-Ost stOOO N. »O •
•«* «s» O O
o«- CM in co fS-00 CM«* OS
• 00 «— f— Is» to • • • • CM CM to in «—
111 O CMO IO O OO s» o to in r-
• 00 • O o o
K>*Osf QsOOO 00 O OO >* to «o •
• 00 »CO o o
ineoos in CM ON- m O«- OsO CM in so os CM s*«-000 • r— •»m>t ts» • o • to • • • •
• in >m CM CM CM in«- o o
CM
UJ O OSO •* o ooo o o rju-i • •» -ts» o
• Os • «— o o
SstON S-<o o <o Os to O N-
O O
»oo« mtMoso -JIMO» S- • O •
•Nj- • »» o o
o<-<o •* o Os tO Os CM «-
■Os CM *0 CM to • • • • CM CM CM in «-
111 O 00O |s» o or- «- CM-a-m • *- -ts. O
• Os • «— O O
stOOS O OO IO Kl -O ■
• h» • 00 o o
Os 00 Ols» noost ii-oeo R'
S.-OOOS» f-OOO O
• o*oo co to • • • • CM CM CM in CM
c c c c O O O c o o a — — o •— —
«I CD O 3 a
ai (0 u
.—•3a
A a —• N
oi —• a) a x
CD 4J N a
<0«t-~-~-
cH-uaia—' et- « e a L4-« a a 3 tin. oc-g.3ws^a>i-Q.X4-'Oc.o.xw —. c c *» .C 3 Q.O O Cn3rXOO.C30.00 u_~-~-~-
LOO Z) -I I- 4J O 40 3 _l I- Q.C0 Z> _l I-
O O 4-> O
:E CI «I
■a. a:
Appendix A Shenandoah Model Segments Results A57
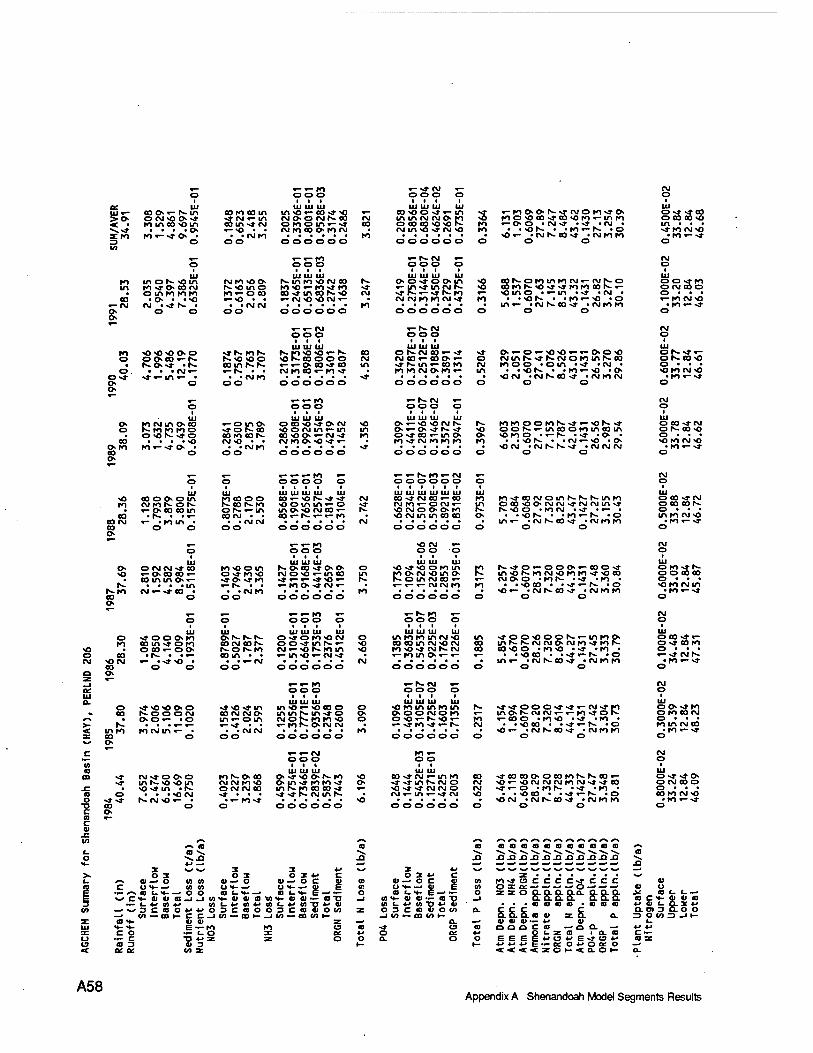
»-«- to OOO
»-s» CM »-
ec w UJ 111 Ul UJ UJ UJ UJ Hi »- eo o»- r-in co to co in in NO »— co NT >Q
f\J O O CMf- CO oo NO o >♦ »- in
>o O CMNO o -»• mmcO'Oin
** CM«- in coin >»CM
CM in in CM CM o to o oo co NO NO S- CM in NO N» CM NO
< • o to o in »- *r eo -.«a- »-NO • • CM ro eo o ro CM xto to «-«» o • • • rvito to 13 CO
o oo o o o o o o o o o o o o
^_ »-»-to «-fN. CM «- o ooo ooo o
111 UJ UJ UJ UJ UJ UJ UJ ro moN^in
fO N» O CO CM CMfO <o OK f— in to NO CM oo 1- O o>3- o o m
«- in •* in CM F- in S^Oino to NO »- to N» to N*
o into to to to»- o eo oo ■* in eo |N- NO »- (NJ NO NO CM »-
CM 00 • o . .<o »-NO • • ■ CM CM tO tO CM N»
»-ro CM ..a- r- . • • CMCM to
£ o o oo o o o oo o O O O O O O
»— «-»- f\J ooo • 1 1 mm UJ
20
87E-
01
12E
-07
88E
-02
91
14
K» NO NO NO o o >tMON f- to NO «o «- f- NOH-OOOOO
00 O 00>(0»-N N«<00 CM
CO in S-S. «- »- ON eo •» eo in •* IN. in «- oo to O. • • • cvi«- «-1- • • <M tO 00 «- tO >*■ • tO tO CM O tO «-
O«» «t«-i/ii- . • • CMIO N»
O o
o oo ooo oo O O OO OO o
»— »— »-»-to »-IN. CM «- o ooo OOO O
UJ 111 UJ UJ UJ UJ UJ UJ o> to (Mm o co
h- to to to o ooK-to
»■omO» O 00 NO •* ON CM NO o »- <o NO CM r— o >tosto NO o r\j in »- m in O »- O «» fN. »J-
co to eo r- 00 NO O »— CM -* CM to ON NO -»■ «-
to O «* 00 «- in ON CO . . . .vO CM -o • ■ ■ tO -» CM tO tO tO
oro ro «-«»• o • • -CMfO NT co O
o o o o o o oo o O O O OO o
3
o CM
IN. NO ON to
»-MOOIN-NJCMOIONJ-O tooNOco«*eONOto»-inio »-O» O • CM ** • *» "CM •
• • NO IN- • • to »- f— »o NO»- ■ CM fN. CO «* -CMtOtO
o o
00fN-OI0int0CM»-CMfN.O B3mN<ONtstnMO)rNr- NO in o -»-in • «* .CM •
• .NOI- • I|O»-N0 • O in»- -cMtN-oo-j- -CMtoro
o o
O»-O»-N0N0»-»-OON0 CMinfN-«»tN.cMOfOinfN.oo ro o o >om • •» «CM •
• «sOfN. " • tO »— NO »ON NO CM •CMf—CO-» •CMIOCM
O O
rOfOOOIOfN.N*»-NOf-N3- oor—»-incootoineoin NO to o .»-fN- .«» .o •
■ • -Of— . • CM»- NO • O NO CM 'CMf—f-»» «CMCMCM
O O
-* tO CM NO •fO »-N»
O
»-IO CM NO • to «--»
O
O f>- «»»- or- co NO o • • • NO ro CM NO
• to «-•» o
CM o
■ UJ o eo -*CM ON CO NO o • • • NO tO CM NO
• to «-«a- o
NO 00 O ON Oin ro CM tor— ON.
»- ON oo com CO -fN- . •»-
co CM «- «to in ■ 03 O O ON
UJ O OlMMNtO NO »- O00 CO «-
• co inm o»- N. ■ • ■ «m
fN-tO «M»-N» CO ■ co o o
UJ O •* o o o to to oo inN» oro
NO • O CO «- oo O 00 • fN. • . »- CM «O CM «- •>* NO •
co o o o o
fN- inn oo o
•st NO NO OO f—OO O CM O o»- -o • • • »— »— to CMm «- •
UJ UJ UJ UJ UJ UJ rocooo CO «-NO I—N»-* CM f—oo f—to NO o m in »-o ** osi-m mONOCMOo»- r- co CM • • co »- f— »- »- ro
• •CMCM •••••• CM oo oooooo
ooo III
111 UJ UJ rONOom f-o eo N» o o O«»IONO cMONO»-moo NTO-»IO N» »-»-s» NO »- «-t— • • »-toON»cM»-
• •CMro • ••••• oo oooooo
»-»-to «- ooo o
fC
Of- f-f- 00 CM OOF- fN-O f—to co m • •
• »«-CM oo
■*J MJ UJ •** o •» o IO NO CM o o ■* mfN. »- CM »-NO F-ro m »- in NO »-CM •»
oooooo
ooo iii
UJ UJ UJ Nj-NONj-in m NO »-NO co o cocMCMO iAtnSm<to in«-om CMoKrorONO »-S» • • »-ror—ocMCM
• •CMCM oo oooooo
«— «- f— ro «- CM »— oooooo o
■ If III III III III ^11 UJ 00 NJ-CM CO «- CO ro CM tO »- O CM «- K NO CM o o o ro NO CM in in co oo o
oooooo o
NO CM »- o o o
UJ UJ UJ NO -*<o O ro m r> »-»-»- CM CM IO OOOOOO
«-r- to »- OOO o I I I I
UJ UJ UJ Ul in ro ro mcM NO in eo co in CMNO CM eo tO NO N» CM fN. CM 00 «- torn o»- »- «- oooooo o
»-fN. CM »- OOO O
o o o
UJ UJ UJ UJ NO torn mro m o o o CMO ro o o «- f-NO «- • »Mvtr-N
roN^cocMomf—t—f—into OCO*OOCMCM^-(MCMinNj- IN-NOO -tOCM -%T •»- •
• -NOt— • -to»-f- -O m«- •cMN-co^* -CMtoro
o o
s«ro*-oooi-MO^ mNOtN-tocMNOtotONa-soeo CM o o -101— •-» -to •
• • NO CO • »-^»-tN- »o >o»- -iMfN-eo-» -CMtoto
o o
•*ooNOOofN-»-mfoo mlN.fN.CMCMOCMtO-»IOf- co NO o -n-o • «* -to •
• «NOCO • •**«—fN. »o in»- •cMt—eON» -CMtoro
o o
oooooo
«- mo t—CM CM»-»-tO NJ-O I ro »-ooo -roNO -N» -to CM • • o co • »~»»-N. >o
NO»- ■CMIN-CO^- •CMtoro o o o
UJ O CO -* CM ococos o • ■ • m to CM NO
• tO »"NJ- o
OKl-fS o o eo oo o • • • NO ro CMm
• ro»-Nj- o
OOONfr- o N» co ro o ■ • • «->t CMt—
•fO »-N» o
O O N» to oro co CM o • • • to in CM co
• to »—j- o
o
•* CM«» O O O N3- in I— NO NO m
• NO N* in • f— o • • • NO CM
•*«*■ f- CM NO »- • co o o
UJ UJ UJ ro t—o oo ONTNOofN-ro CMCMIO-O o in-* to ro-■» OCMCMCO m F-to eo co ^t ■st • • • «*\tsojmN
• »- to N» o oooooo
UJ UJ NO cOstrur-mM o srvtinswo
«NtNtlMIMO • CM »- m «— ■* CM
oooooo
sj-oocooocotofN-iN-co»- NO»-NOCMCMCMrOCM%»srCO »»»-o •rot- •-* -to •
• • «O CO • "-*»-fN- «o NO CM •CMf— 00-J- •CMtOlO
UJ o>j- ^- o OCM CO O o • • • co ro CMNO
• tO »-NJ- o
J*N 10 CO ^ •V.J3 ♦J —'
o 3: ^N O —# O (A (0 _ c o «I—. can o *-_. o>«—> j> E ^CVIIOJOJJB*««»»».««-«!]
•»- i. *J m +J tnc-4^«>4-'a)c.»j«)"p«^ai — v3C0)O»>»'O3CC0OO3CC0«IOC4 —' «•—mi— ccjio»ni--im-mwi-
2 O X
ai — o 3 V O X <-" c
tt—OC JJ OH • V £
O «I
c o ~- c a D ee. a.
u
tt) CO o
a *-* o
CO OOffJOOflflOOIDQ ^N N- •—^,-, ^. v, «^, .^ »^ »s.-» —. CO ja J3XI ja JDXI si si xi ja ja JQ -, _# —»—.—#—-—*—* -^ _._._. _• ja
O 3 -M C SE N-' V — O C V 10 tONfCSCCCCNfCCC «I o N>- — a B o) OZK-._<__. o —- — —• t) o a c- NV. £ _. •— o zzoQ-Q-Q. Q.Q. a. Q- O. a a
co Nj- CJ 0> — BJ -p _i E (X O.a. a! (X Q. co C N>- vt c- *^ « *a *-• ai • • • • c a o c • a« a *■> ai i- o 3 c io i> o co a. CCC C 0.013 jui-mioi- S.Q.S.O 11 za. a. 3 o en z> —11-
O. —• V 01 CJ — *J 01 L- -4- OdSOOOCQ^'OO.—*4^*J o ee *J o 1- z a _ ■ 0. a c — D. O O EEEE4->C)'MEN3-C>4-' eoz
< «c < < z o 1- < a. o H- 0.
a» «1 a 0.1 v CL O O
A58 Appendix A Shenandoah Model Segments Results
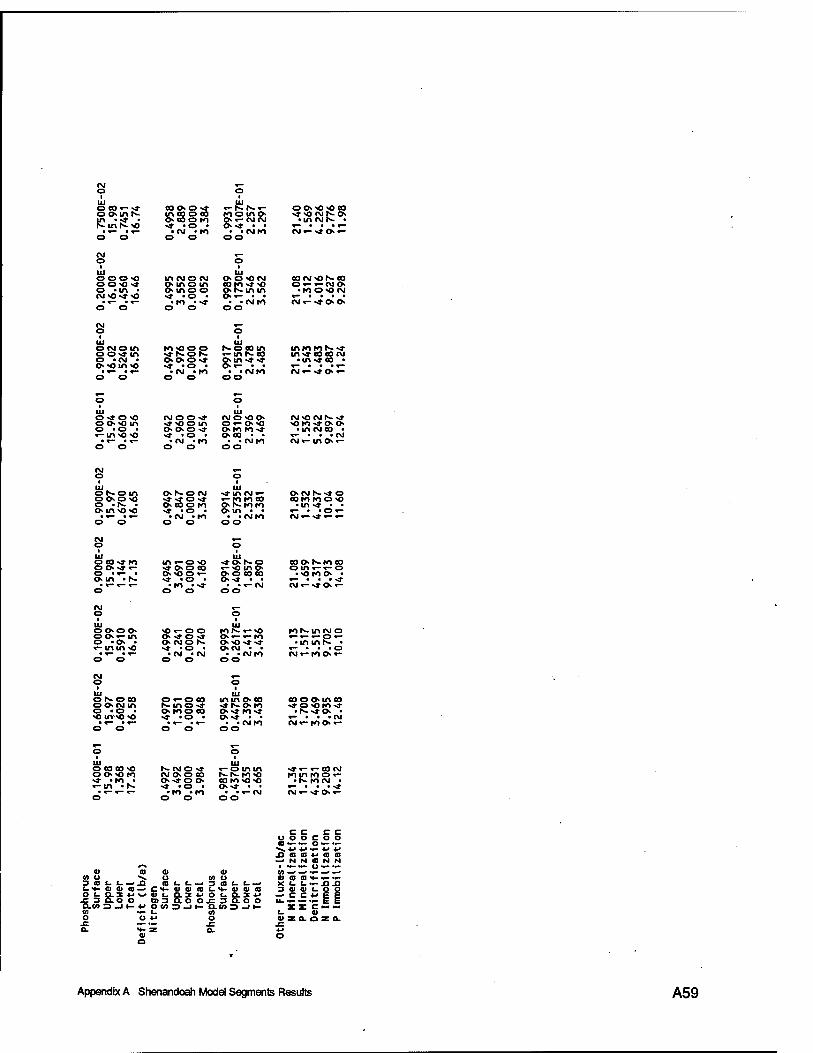
I UJ
ooins • inr- O (C, »<
«a-
io < >o I • o
mo mo »»- CMCM »«» . .
• • rum oo
o » « *o oo ■J">0 «Mf> o
»— , . . «— CM«- »*»«-
CM o
o o o >o o o<o •* o «in « CM osi-o
in CMO CM p. mo in Oino o N» -o •
. m • •* o o
111 oo <o CM C0Kl>»O ~»N- in in 8t'
oo CMMJN-CO O«- r-(MCh
• mo<o(M
CM«- «*o o
oNOin o o>» m o 'CM • o so in o
ro-oop ■* r~o r~ ooo-a- sr -o •
• CM • m o o
KoiOin «-in r>-eo ~»tn •*»» 8:52'
inmmr--* in«a-eo eo rvi • m^eo •
0-» o <o o o >o in o "O • *- in o >o
NOO<f >*• >0 o in O oo >* «* <o •
• CM .m o o
NO«» o«- »<o om msr o oo • • ■ • rum oo
MO CMS-»» «m-a-o »
• in (Moo • r- . • .(M CM «-mo «-
CM o
o N. o in o o o <o o -N. • (Mn*o*o
»SON •*«*o •* o co o m vi- .o ■
• CM -m o o
«-m moo or~ mm om ■ •
• • cum oo
»MS-JO com moo ■ in »» • ■ «- • .o»- CM «-•»«-«-
0.90
00
15.9
8 1.
144
17.1
3
0.49
45
3.69
1 0.
0000
4.
186
0.99
14
0.40
691
1.85
7 2.
890
21.0
8 1.
659
4.31
7 9.
913
14.0
8
cu o o
0.10
00E
15.9
9 0.
5910
16
.59
0.49
96
2.24
1 0.
0000
2.
740
0.99
93
0.26
17E-
2.
411
3.43
6
21.1
3 1.
517
3.51
5 9.
702
10.1
0
CM O o
0.60
00E
15..9
7 0.
6020
16
.58
0,49
70
1.35
1 0.
0000
1.
848
0.99
45
0.44
75E-
2.
399
3.43
8 eoo »inco •tfo-om»» • f^-tf o . «— • • « CM CM «-mo«-
UJ 003COO o oo m »* >m • »-in -s-
f- CMO •* CM oo oo o^ro o sj- .o •
• m «m o o
in «— o mm r-N- mo com <oo »>*• • •
• • «-CM oo
•* «- «-00 CM mm mo «- • F-mcM ■ «- . . ..*
CM«-s*»«-
C C C C o o o c o o ca — ~- o — •-
«I CO u 3 co t-t- o c - 3
CO o
JZ a.
CO 41 o co •^ o co o co
tm —»xt ot.i.M'SaLL'^ x ciaiio—' et- o ai to LH- a « a 3 &jvv/*i.ajwoi.a>v —•
OO DI3aOO£3aOO u. — O CO 3 _J ►— CLOT 3 —I I—
•— L. (A L. U 4-> O 01
•— •— JZ JZ <f- SE O. -M CI O O
i 4-> a I CS N . o —•
JZ 3 Q.O O Q.CO 3 —I I— 4J
CD 10 N- ~- ..- L. I. —XI XI
z a. a z a.
Appendix A Shenandoah Model Segments Results A59
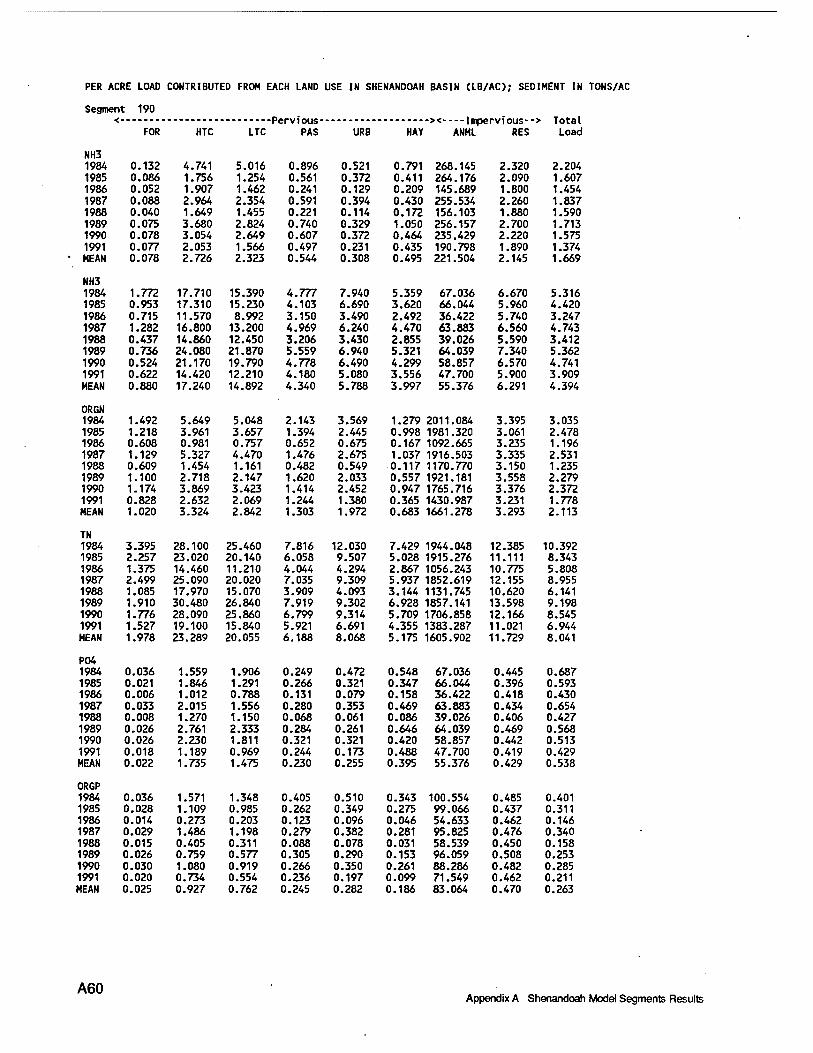
PER ACRE LOAD CONTRIBUTED FROH EACH LAND USE IN SHENANDOAH BASIN (LB/AC); SEDIMENT IN TONS/AC
Segment 190 < Pervious >< Impervious--> Total
FOR HTC LTC PAS URB NAY ANHL RES Load
NH3 1984 1985 1986 1987 1988 1989 1990 1991 MEAN
0.132 0.086 0.052 0.088 0.040 0.075 0.078 0.077 0.078
4.741 1.756 1.907 2.964 1.649 3.680 3.054 2.053 2.726
5.016 1.254 1.462 2.354 1.455 2.824 2.649 1.566 2.323
0.896 0.561 0.241 0.591 0.221 0.740 0.607 0.497 0.544
0.521 0.372 0.129 0.394 0.114 0.329 0.372 0.231 0.308
0.791 0.411 0.209 430 172 050 464 435
0.495
268.145 264.176 145.689 255.534 156.103 256.157 235.429 190.798 221.504
2.320 2.090 1.800 2.260 1.880 2.700 2.220 1.890 2.145
2.204 1.607 1.454 1.837 1.590 1.713 1.575 1.374 1.669
NH3 1984 1985 1986 1987 1988 1989 1990 1991 MEAN
1.772 0.953 0.715 1.282 0.437 0.736 0.524 0.622 0.880
17.710 17.310 11.570 16.800 14.860 24.080 21.170 14.420 17.240
15.390 15.230 8.992
13.200 12.450 21.870 19.790 12.210 14.892
4.777 4.103 3.150 4.969 3.206 5.559 4.778 4.180 4.340
7.940 6.690 3.490 6.240 3.430 6.940 6.490 5.080 5.788
5.359 3.620 2.492 4.470 2.855 5.321 4.299 3.556 3.997
67.036 66.044 36.422 63.883 39.026 64.039 58.857 47.700 55.376
6.670 5.960 5.740 6.560 5.590 7.340 6.570 5.900 6.291
5.316 4.420 3.247 4.743 3.412 5.362 4.741 3.909 4.394
ORGN 1984 1985 1986 1987 1988 1989 1990 1991 MEAN
1.492 1.218 0.608 1.129 0.609 1.100 1.174 0.828 1.020
5.649 3.961 0.981 5.327 1.454 2.718 3.869 2.632 3.324
5.048 3.657 0.757 4.470 1.161 2.147 3.423 2.069 2.842
2.143 1.394 0.652 1.476 0.482 1.620 1.414 1.244 1.303
3.569 2.445 0.675 2.675 0.549 2.033 2.452 1.380 1.972
1.279 0.998 0.167 1.037 0.117 0.557 0.947 0.365 0.683
2011.084 1981.320 1092.665 1916.503 1170.770 1921.181 1765.716 1430.987 1661.278
3.395 3.061 3.235 3.335 3.150 3.558 3.376 3.231 3.293
3.035 2.478 1.196 2.531 1.235 2.279 2.372 1.778 2.113
TN 1984 1985 1986 1987 1988 1989 1990 1991 MEAN
3.395 2.257 1.375 2.499 1.085 1.910 1.776 1.527 1.978
28.100 23.020 14.460 25.090 17.970 30.480 28.090 19.100 23.289
25.460 20.140 11.210 20.020 15.070 26.840 25.860 15.840 20.055
7.816 6.058 4.044 7.035 3.909 7.919 6.799 5.921 6.188
12.030 9.507 4.294 9.309 4.093 9.302 9.314 6.691 8.068
7.429 5.028 2.867 5.937 3.144 6.928 5.709 4.355 5.175
1944.048 1915.276 1056.243 1852.619 1131.745 1857.141 1706.858 1383.287 1605.902
12.385 11.111 10.775 12.155 10.620 13.598 12.166 11.021 11.729
10.392 8.343 5.808 8.955 6.141 9.198 8.545 6.944 8.041
P04 1984 1985 1986 1987 1988 1989 1990 1991 MEAN
0.036 0.021 0.006 0.033 0.008 0.026 0.026 0.018 0.022
1.559 1.846 1.012 2.015 1.270 2.761 2.230 1.189 1.735
1.906 1.291 0.788 1.556 1.150 2.333 1.811 0.969 1.475
0.249 0.266 0.131 0.280 0.068 0.284 0.321 0.244 0.230
0.472 0.321 0.079 0.353 0.061 0.261 0.321 0.173 0.255
0.548 0.347 0.158 0.469 0.086 0.646 0.420 0.488 0.395
67.036 66.044 36.422 63.883 39.026 64.039 58.857 47.700 55.376
0.445 0.396 0.418 0.434 0.406 0.469 0.442 0.419 0.429
0.687 0.593 0.430 0.654 0.427 0.568 0.513 0.429 0.538
ORGP 1984 1985 1986 1987 1988 1989 1990 1991 MEAN
0.036 0.028 0.014 0.029 0.015 0.026 0.030 0.020 0.025
1.571 1.109 0.273 1.486 0.405 0.759 1.080 0.734 0.927
1.348 0.985 0.203 1.198 0.311 0.577 0.919 0.554 0.762
0.405 0.262 0.123 0.279 0.088 0.305 0.266 0.236 0.245
0.510 0.349 0.096 0.382 0.078 0.290 0.350 0.197 0.282
0.343 0.275 0.046 0.281 0.031 0.153 0.261 0.099 0.186
100.554 99.066 54.633 95.825 58.539 96.059 88.286 71.549 83.064
0.485 0.437 0.462 0.476 0.450 0.508 0.482 0.462 0.470
0.401 0.311 0.146 0.340 0.158 0.253 0.285 0.211 0.263
A60 Appendix A Shenandoah Model Segments Results

Segment 190 . . > Total
FOR HTC LTC PAS URB HAY ANML RES Load
TP 1984 0.071 3.130 3.254 0.654 0.982 0.891 335.181 0.930 1.156 1985 0.049 2.956 2.276 0.528 0.670 0.622 330.220 0.833 0.971 1986 0.020 1.285 0.990 0.254 0.176 0.204 182.111 0.880 0.613 1987 0.061 3.501 2.755 0.559 0.735 0.750 319.417 0.910 1.058 1988 0.023 1.675 1.460 0.156 0.139 0.117 195.128 0.856 0.625 1989 0.052 3.520 2.910 0.588 0.551 0.799 320.197 0.977 0.887 1990 0.056 3.310 2.730 0.587 0.671 0.680 294.286 0.924 0.857 1991 0.039 1.922 1.523 0.480 0.370 0.587 238.498 0.881 0.689 MEAN 0.046 2.662 2.237 0.476 0.537 0.581 276.880 0.899 0.857
BOD 1984 14.795 123.300 74.700 11.010 28.860 25.200 4692.528 27.450 25.313 1985 12.537 116.100 72.300 7.350 19.770 20.490 4623.079 24.750 21.486 1986 6.305 20.520 11.730 3.450 5.460 3.810 2549.551 26.160 8.551 1987 10.579 141.300 80.700 7.650 21.630 21.000 4471.839 26.970 22.137 1988 5.959 32.100 23.490 2.646 4.440 3.120 2731.798 25.470 9.315 1989 10.832 75.000 45.900 8.460 16.440 12.690 4482.755 28.770 17.875 1990 10.940 113.700 68.400 7.410 19.830 19.350 4120.003 27.300 20.567 1991 8.009 69.900 36.000 6.390 11.160 8.280 3338.969 26.130 13.978 MEAN 9.995 86.490 51.653 6.796 15.949 14.243 3876.315 26.625 17.403
SED 1984 0.097 1.680 1.210 0.305 0.291 0.469 0.000 0.000 0.291 1985 0.058 1.160 0.864 0.193 0.189 0.366 0.000 0.000 0.198 1986 0.018 0.287 0.178 0.089 0.043 0.062 0.000 0.000 0.054 1987 0.078 1.570 1.060 0.207 0.215 0.377 0.000 0.000 0.233 1988 0.025 0.429 0.275 0.064 0.032 0.046 0.000 0.000 0.058 1989 0.056 0.806 0.517 0.226 0.149 0.213 0.000 0.000 0.157 1990 0.081 1.130 0.811 0.197 0.193 0.346 0.000 0.000 0.205 1991 0.041 0.772 0.489 0.173 0.100 0.142 0.000 0.000 0.124 MEAN 0.057 0.979 0.676 0.182 0.152 0.253 0.000 0.000 0.165
Appendix A Shenandoah Model Segments Results A61
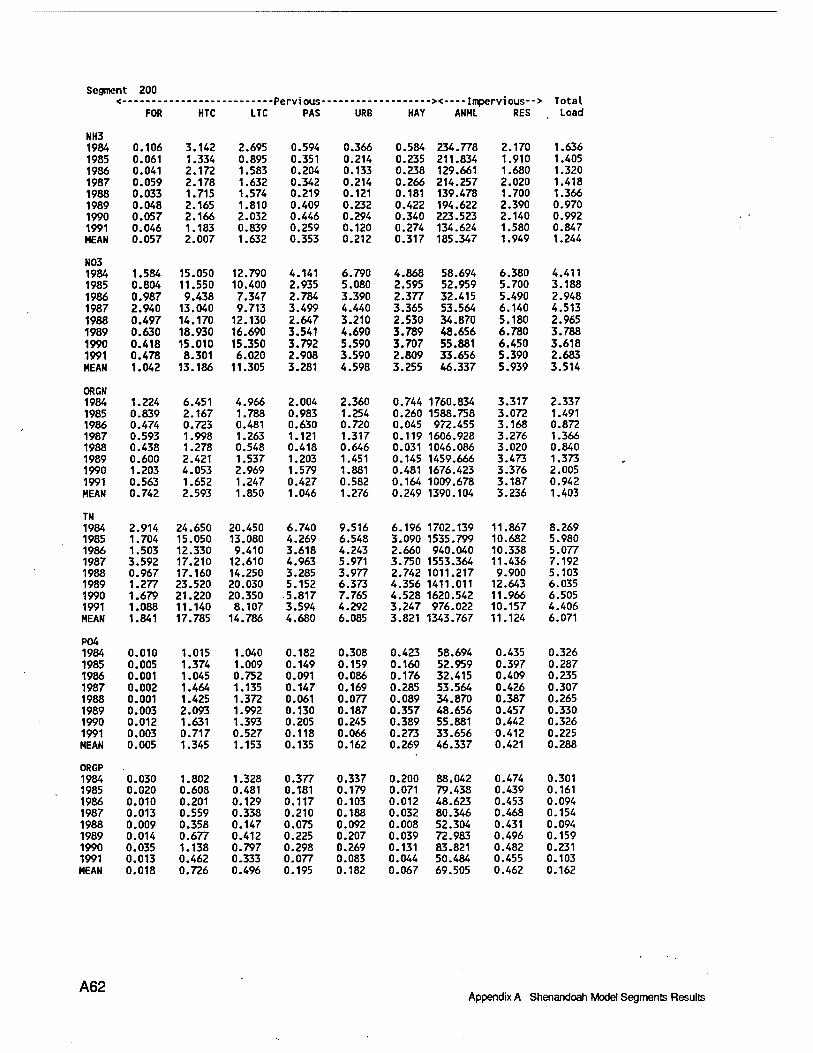
Segment 200 < - Pervious-
FOR HTC LTC PAS URB >< Impervious--> Total HAY ANHL RES Load
NH3 1984 1985 1986 1987 1988 1989 1990 1991 MEAN
0.106 0.061 0.041 0.059 0.033 0.048 0.057 0.046 0.057
3.142 1.334 2.172 2.178 1.715 2.165 2.166 1.183 2.007
2.695 0.895 1.583 1.632 1.574 1.810 2.032 0.839 1.632
0.594 0.351 0.204 0.342 0.219 0.409 0.446 0.259 0.353
0.366 0.214 0.133 0.214 0.121 0.232 0.294 0.120 0.212
0.584 0.235 0.238 0.266 0.181 0.422 0.340 0.274 0.317
234.778 211.834 129.661 214.257 139.478 194.622 223.523 134.624 185.347
2.170 1.910 1.680 2.020 1.700 2.390 2.140 1.580 1.949
1.636 1.405 1.320 1.418 1.366 0.970 0.992 0.847 1.244
N03 1984 1985 1986 1987 1988 1989 1990 1991 MEAN
1.584 0.804 0.987 2.940 0.497 0.630 0.418 0.478 1.042
15.050 11.550 9.438 13.040 14.170 18.930 15.010 8.301
13.186
12.790 10.400 7.347 9.713
12.130 16.690 15.350 6.020
11.305
4.141 2.935 2.784 3.499 2.647 3.541 3.792 2.908 3.281
6.790 5.080 3.390 4.440 3.210 4.690 5.590 3.590 4.598
4.868 2.595 2.377 3.365 2.530 3.789 3.707 2.809 3.255
58.694 52.959 32.415 53.564 34.870 48.656 55.881 33.656 46.337
6.380 5.700 5.490 6.140 5.180 6.780 6.450 5.390 5.939
4.411 3.188 2.948 4.513 2.965 3.788 3.618 2.683 3.514
ORGN 1984 1985 1986 1987 1988 1989 1990 1991 MEAN
1.224 0.839 0.474 0.593 0.438 0.600 1.203 0.563 0.742
6.451 2.167 0.723 1.998 1.278 2.421 4.053 1.652 2.593
4.966 1.788 0.481 1.263 0.548 1.537 2.969 1.247 1.850
2.004 0.983 0.630 1.121 0.418 1.203 1.579 0.427 1.046
2.360 1.254 0.720 1.317 0.646 1.451 1.881 0.582 1.276
0.744 1760.834 0.260 1588.758 0.045 972.455 0.119 1606.928 0.031 1046.086 0.145 1459.666 0.481 1676.423 0.164 1009.678 0.249 1390.104
3.317 3.072 3.168 3.276 3.020 3.473 3.376 3.187 3.236
2.337 1.491 0.872 1.366 0.840 1.373 2.005 0.942 1.403
TN 1984 1985 1986 1987 1988 1989 1990 1991 MEAN
2.914 1.704 1.503 3.592 0.967 1.277 1.679 1.088 1.841
24.650 15.050 12.330 17.210 17.160 23.520 21.220 11.140 17.785
20.450 13.080 9.410 12.610 14.250 20.030 20.350 8.107
14.786
6.740 4.269 3.618 4.963 3.285 5.152 5.817 3.594 4.680
9.516 6.548 4.243 5.971 3.977 6.373 7.765 4.292 6.085
6.196 1702.139 3.090 1535.799 2.660 940.040 3.750 1553.364 2.742 1011.217 4.356 1411.011 4.528 1620.542
976.022 1343.767
247 ,821
11.867 10.682 10.338 11.436 9.900 12.643 11.966 10.157 11.124
8.269 5.980 5.077 7.192 5.103 6.035 6.505 4.406 6.071
P04 1984 1985 1986 1987 1988 1989 1990 1991 MEAN
0.010 0.005 0.001 0.002 0.001 0.003 0.012 0.003 0.005
1.015 1.374 1.045 1.464 1.425 2.093 1.631 0.717 1.345
1.040 1.009 0.752 1.135 1.372 1.992 1.393 0.527 1.153
0.182 0.149 0.091 0.147 0.061 0.130 0.205 0.118 0.135
0.308 0.159 0.086 0.169 0.077 0.187 0.245 0.066 0.162
0.423 0.160 0.176 0.285 0.089 0.357 0.389 0.273 0.269
58.694 52.959 32.415 53.564 34.870 48.656 55.881 33.656 46.337
0.435 0.397 0.409 0.426 0.387 0.457 0.442 0.412 0.421
0.326 0.287 0.235 0.307 0.265 0.330 0.326 0.225 0.288
ORGP 1984 1985 1986 1987 1988 1989 1990 1991 MEAN
0.030 0.020 0.010 0.013 0.009 0.014 0.035 0.013 0.018
1.802 0.608 0.201 0.559 0.358 0.677 1.138 0.462 0.726
1.328 0.481 0.129 0.338 0.147 0.412 0.797 0.333 0.496
0.377 0.181 0.117 0.210 0.075 0.225 0.298 0.077 0.195
0.337 0.179 0.103 0.188 0.092 0.207 0.269 0.083 0.182
0.200 0.071 0.012 0.032 0.008 0.039 0.131 0.044 0.067
88.042 79.438 48.623 80.346 52.304 72.983 83.821 50.484 69.505
0.474 0.439 0.453 0.468 0.431 0.496 0.482 0.455 0.462
0.301 0.161 0.094 0.154 0.094 0.159 0.231 0.103 0.162
A62 Appendix A Shenandoah Model Segments Results
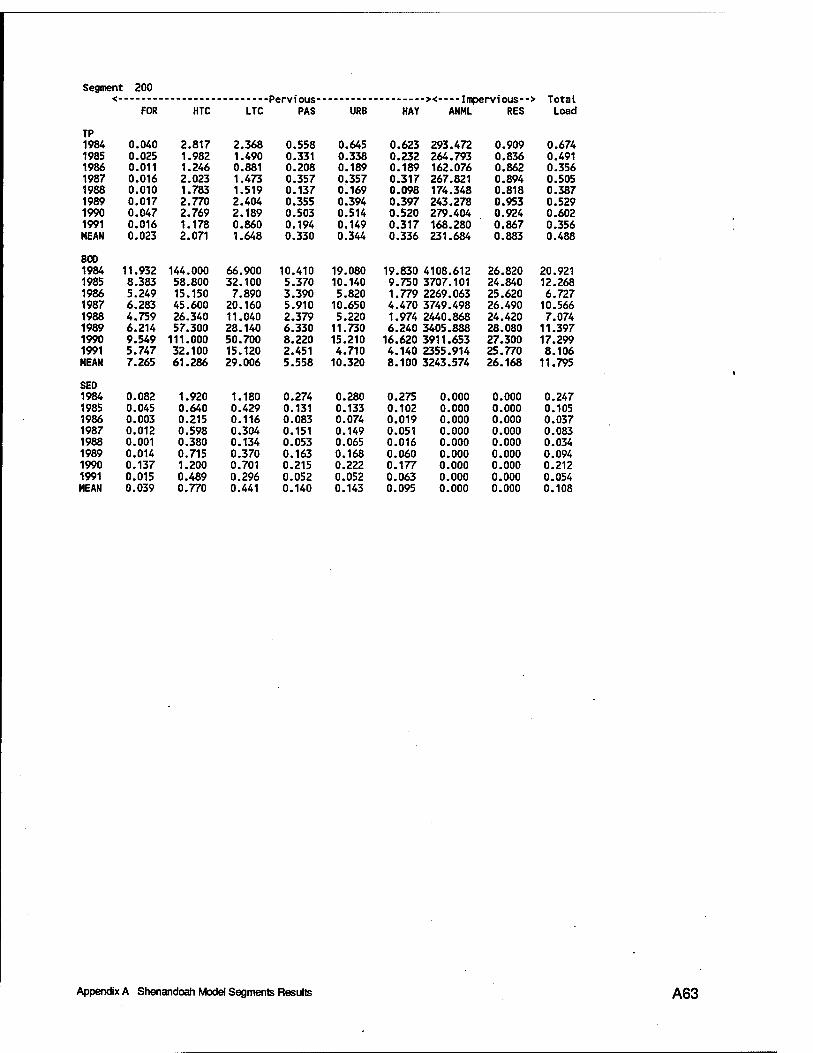
Segment 200 > Total ^
FOR HTC UTC PAS URB HAY ANML RES Load
TP 1984 0.040 2.817 2.368 0.558 0.645 0.623 293.472 0.909 0.674 1985 0.025 1.982 1.490 0.331 0.338 0.232 264.793 0.836 0.491 1986 0.011 1.246 0.881 0.208 0.189 0.189 162.076 0.862 0.356 1987 0.016 2.023 1.473 0.357 0.357 0.317 267.821 0.894 0.505 1988 0.010 1.783 1.519 0.137 0.169 0.098 174.348 0.818 0.387 1989 0.017 2.770 2.404 0.355 0.394 0.397 243.278 0.953 0.529 1990 0.047 2.769 2.189 0.503 0.514 0.520 279.404 0.924 0.602 1991 0.016 1.178 0.860 0.194 0.149 0.317 168.280 0.867 0.356 MEAN 0.023 2.071 1.648 0.330 0.344 0.336 231.684 0.883 0.488
BOO 1984 11.932 144.000 66.900 10.410 19.080 19.830 4108.612 26.820 20.921 1985 8.383 58.800 32.100 5.370 10.140 9.750 3707.101 24.840 12.268 1986 5.249 15.150 7.890 3.390 5.820 1.779 2269.063 25.620 6.727 1987 6.283 45.600 20.160 5.910 10.650 4.470 3749.498 26.490 10.566 1988 4.759 26.340 11.040 2.379 5.220 1.974 2440.868 24.420 7.074 1989 6.214 57.300 28.140 6.330 11.730 6.240 3405.888 28.080 11.397 1990 9.549 111.000 50.700 8.220 15.210 16.620 3911.653 27.300 17.299 1991 5.747 32.100 15.120 2.451 4.710 4.140 2355.914 25.770 8.106 MEAN 7.265 61.286 29.006 5.558 10.320 8.100 3243.574 26.168 11.795
SED 1984 0.082 1.920 1.180 0.274 0.280 0.275 0.000 0.000 0.247 1985 0.045 0.640 0.429 0.131 0.133 0.102 0.000 0.000 0.105 1986 0.003 0.215 0.116 0.083 0.074 0.019 0.000 0.000 0.037 1987 0.012 0.598 0.304 0.151 0.149 0.051 0.000 0.000 0.083 1988 0.001 0.380 0.134 0.053 0.065 0.016 0.000 0.000 0.034 1989 0.014 0.715 0.370 0.163 0.168 0.060 0.000 0.000 0.094 1990 0.137 1.200 0.701 0.215 0.222 0.177 0.000 0.000 0.212 1991 0.015 0.489 0.296 0.052 0.052 0.063 0.000 0.000 0.054 MEAN 0.039 0.770 0.441 0.140 0.143 0.095 0.000 0.000 0.108
Appendix A Shenandoah Model Segments Results A63
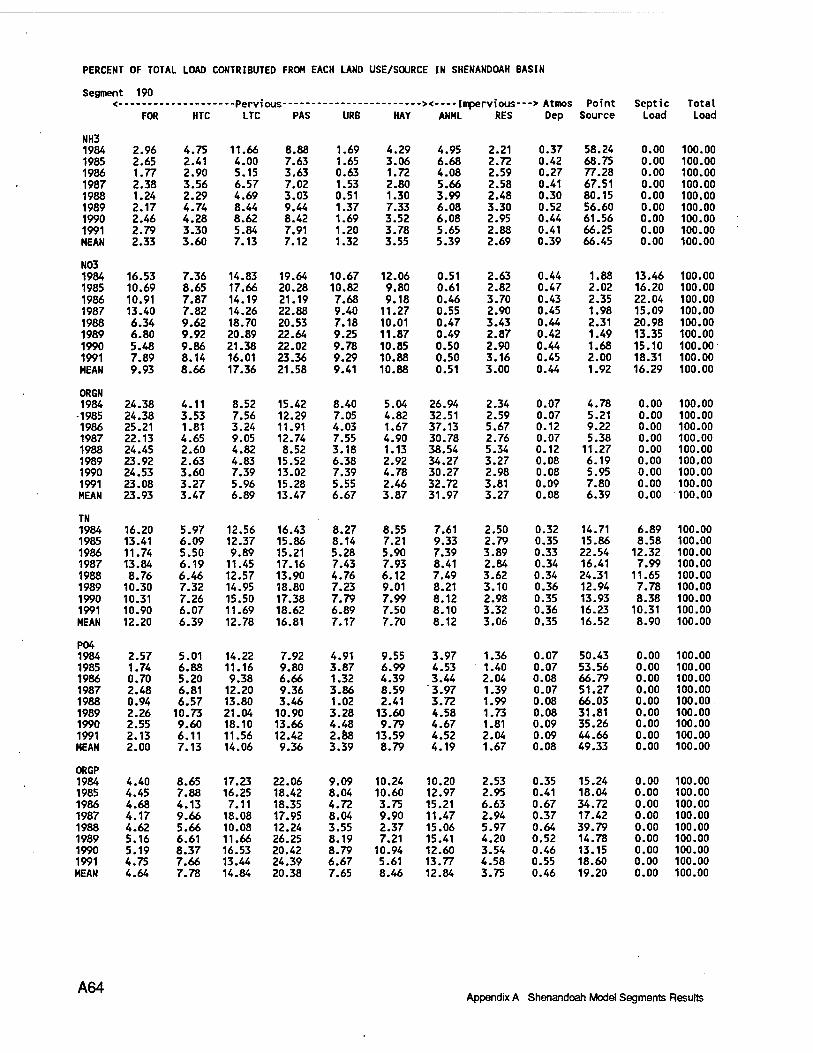
PERCENT OF TOTAL LOAD CONTRIBUTED FROH EACH LAND USE/SOURCE IN SHENANDOAH BASIN
Segment 190 . --> Atmos
Dep Point
Source Septic Load
Total Load FOR HTC LTC PAS URB HAY ANHL RES
NH3 1984 2.96 4.75 11.66 8.88 1.69 4.29 4.95 2.21 0.37 58.24 0.00 100.00 1985 2.65 2.41 4.00 7.63 1.65 3.06 6.68 2.72 0.42 68.75 0.00 100.00 1986 1.77 2.90 5.15 3.63 0.63 1.72 4.08 2.59 0.27 77.28 0.00 100.00 1987 2.38 3.56 6.57 7.02 1.53 2.80 5.66 2.58 0.41 67.51 0.00 100.00 1988 1.24 2.29 4.69 3.03 0.51 1.30 3.99 2.48 0.30 80.15 0.00 100.00 1989 2.17 4.74 8.44 9.44 1.37 7.33 6.08 3.30 0.52 56.60 0.00 100.00 1990 2.46 4.28 8.62 8.42 1.69 3.52 6.08 2.95 0.44 61.56 0.00 100.00 1991 2.79 3.30 5.84 7.91 1.20 3.78 5.65 2.88 0.41 66.25 0.00 100.00 MEAN 2.33 3.60 7.13 7.12 1.32 3.55 5.39 2.69 0.39 66.45 0.00 100.00
N03 1984 16.53 7.36 14.83 19.64 10.67 12.06 0.51 2.63 0.44 1.88 13.46 100.00 1985 10.69 8.65 17.66 20.28 10.82 9.80 0.61 2.82 0.47 2.02 16.20 100.00 1986 10.91 7.87 14.19 21.19 7.68 9.18 0.46 3.70 0.43 2.35 22.04 100.00 1987 13.40 7.82 14.26 22.88 9.40 11.27 0.55 2.90 0.45 1.98 15.09 100.00 1988 6.34 9.62 18.70 20.53 7.18 10.01 0.47 3.43 0.44 2.31 20.98 100.00 1989 6.80 9.92 20.89 22.64 9.25 11.87 0.49 2.87 0.42 1.49 13.35 100.00 1990 5.48 9.86 21.38 22.02 9.78 10.85 0.50 2.90 0.44 1.68 15.10 100.00 1991 7.89 8.14 16.01 23.36 9.29 10.88 0.50 3.16 0.45 2.00 18.31 100.00 MEAN 9.93 8.66 17.36 21.58 9.41 10.88 0.51 3.00 0.44 1.92 16.29 100.00
ORGN 1984 24.38 4.11 8.52 15.42 8.40 5.04 26.94 2.34 0.07 4.78 0.00 100.00 -1985 24.38 3.53 7.56 12.29 7.05 4.82 32.51 2.59 0.07 5.21 0.00 100.00 1986 25.21 1.81 3.24 11.91 4.03 1.67 37.13 5.67 0.12 9.22 0.00 100.00 1987 22.13 4.65 9.05 12.74 7.55 4.90 30.78 2.76 0.07 5.38 0.00 100.00 1988 24.45 2.60 4.82 8.52 3.18 1.13 38.54 5.34 0.12 11.27 0.00 100.00 1989 23.92 2.63 4.83 15.52 6.38 2.92 34.27 3.27 0.08 6.19 0.00 100.00 1990 24.53 3.60 7.39 13.02 7.39 4.78 30.27 2.98 0.08 5.95 0.00 100.00 1991 23.08 3.27 5.96 15.28 5.55 2.46 32.72 3.81 0.09 7.80 0.00 100.00 MEAN 23.93 3.47 6.89 13.47 6.67 3.87 31.97 3.27 0.08 6.39 0.00 100.00
TN 1984 16.20 5.97 12.56 16.43 8.27 8.55 7.61 2.50 0.32 14.71 6.89 100.00 1985 13.41 6.09 12.37 15.86 8.14 7.21 9.33 2.79 0.35 15.86 8.58 100.00 1986 11.74 5.50 9.89 15.21 5.28 5.90 7.39 3.89 0.33 22.54 12.32 100.00 1987 13.84 6.19 11.45 17.16 7.43 7.93 8.41 2.84 0.34 16.41 7.99 100.00 1988 8.76 6.46 12.57 13.90 4.76 6.12 7.49 3.62 0.34 24.31 11.65 100.00 1989 10.30 7.32 14.95 18.80 7.23 9.01 8.21 3.10 0.36 12.94 7.78 100.00 1990 10.31 7.26 15.50 17.38 7.79 7.99 8.12 2.98 0.35 13.93 8.38 100.00 1991 10.90 6.07 11.69 18.62 6.89 7.50 8.10 3.32 0.36 16.23 10.31 100.00 MEAN 12.20 6.39 12.78 16.81 7.17 7.70 8.12 3.06 0.35 16.52 8.90 100.00
P04 1984 2.57 5.01 14.22 7.92 4.91 9.55 3.97 1.36 0.07 50.43 0.00 100.00 1985 1.74 6.88 11.16 9.80 3.87 6.99 4.53 1.40 0.07 53.56 0.00 100.00 1986 0.70 5.20 9.38 6.66 1.32 4.39 3.44 2.04 0.08 66.79 0.00 100.00 1987 2.48 6.81 12.20 9.36 3.86 8.59 3.97 1.39 0.07 51.27 0.00 100.00 1988 0.94 6.57 13.80 3.46 1.02 2.41 3.72 1.99 0.08 66.03 0.00 100.00 1989 2.26 10.73 21.04 10.90 3.28 13.60 4.58 1.73 0.08 31.81 0.00 100.00 1990 2.55 9.60 18.10 13.66 4.48 9.79 4.67 1.81 0.09 35.26 0.00 100.00 1991 2.13 6.11 11.56 12.42 2.88 13.59 4.52 2.04 0.09 44.66 0.00 100.00 MEAN 2.00 7.13 14.06 9.36 3.39 8.79 4.19 1.67 0.08 49.33 0.00 100.00
ORGP 1984 4.40 8.65 17.23 22.06 9.09 10.24 10.20 2.53 0.35 15.24 0.00 100.00 1985 4.45 7.88 16.25 18.42 8.04 10.60 12.97 2.95 0.41 18.04 0.00 100.00 1986 4.68 4.13 7.11 18.35 4.72 3.75 15.21 6.63 0.67 34.72 0.00 100.00 1987 4.17 9.66 18.08 17.95 8.04 9.90 11.47 2.94 0.37 17.42 0.00 100.00 1988 4.62 5.66 10.08 12.24 3.55 2.37 15.06 5.97 0.64 39.79 0.00 100.00 1989 5.16 6.61 11.66 26.25 8.19 7.21 15.41 4.20 0.52 14.78 0.00 100.00 1990 5.19 8.37 16.53 20.42 8.79 10.94 12.60 3.54 0.46 13.15 0.00 100.00 1991 4.75 7.66 13.44 24.39 6.67 5.61 13.77 4.58 0.55 18.60 0.00 100.00 MEAN 4.64 7.78 14.84 20.38 7.65 8.46 12.84 3.75 0.46 19.20 0.00 100.00
A64 Appendix A Shenandoah Model Segments Results
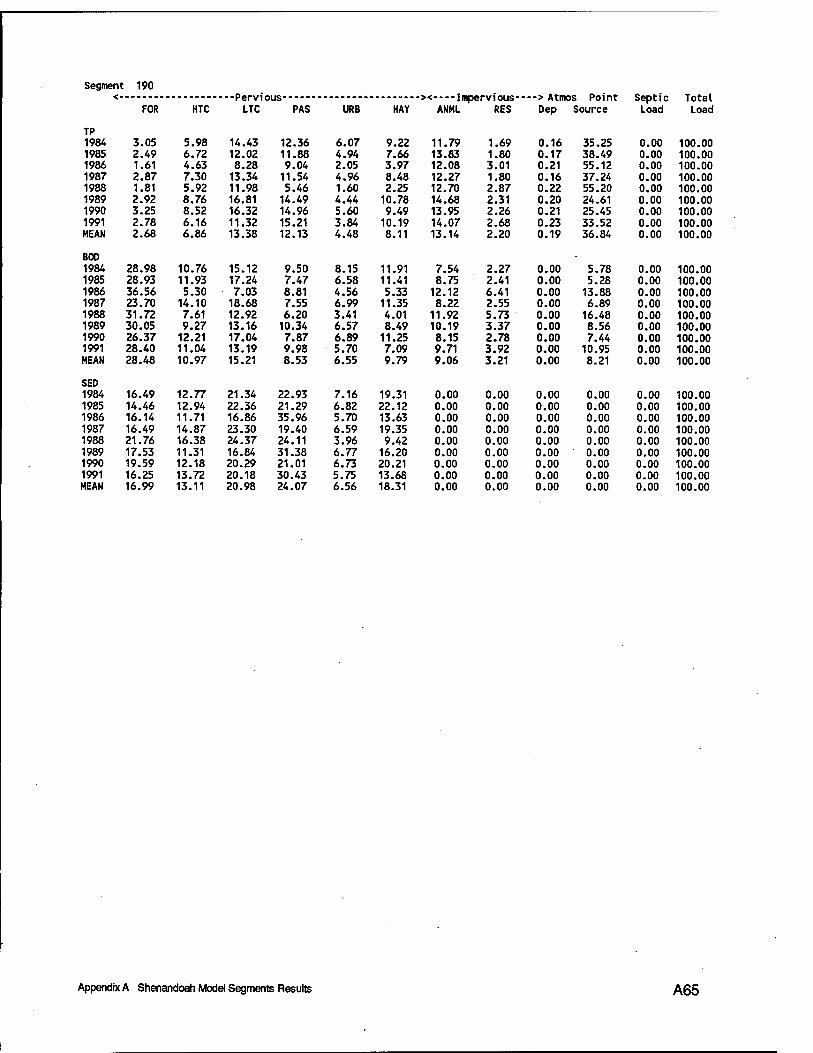
Segment 190 . Septic Total -*" Miniua ru mi
FOR HTC LTC PAS URB HAY ANML RES Dep Source Load Load
TP 1984 3.05 5.98 14.43 12.36 6.07 9.22 11.79 1.69 0.16 35.25 0.00 100.00 1985 2.49 6.72 12.02 11.88 4.94 7.66 13.83 1.80 0.17 38.49 0.00 100.00 1986 1.61 4.63 8.28 9.04 2.05 3.97 12.08 3.01 0.21 55.12 0.00 100.00 1987 2.87 7.30 13.34 11.54 4.96 8.48 12.27 1.80 0.16 37.24 0.00 100.00 1988 1.81 5.92 11.98 5.46 1.60 2.25 12.70 2.87 0.22 55.20 0.00 100.00 1989 2.92 8.76 16.81 14.49 4.44 10.78 14.68 2.31 0.20 24.61 0.00 100.00 1990 3.25 8.52 16.32 14.96 5.60 9.49 13.95 2.26 0.21 25.45 0.00 100.00 1991 2.78 6.16 11.32 15.21 3.84 10.19 14.07 2.68 0.23 33.52 0.00 100.00 MEAN 2.68 6.86 13.38 12.13 4.48 8.11 13.14 2.20 0.19 36.84 0.00 100.00
BOO 1984 28.98 10.76 15.12 9.50 8.15 11.91 7.54 2.27 0.00 5.78 0.00 100.00 1985 28.93 11.93 17.24 7.47 6.58 11.41 8.75 2.41 0.00 5.28 0.00 100.00 1986 36.56 5.30 7.03 8.81 4.56 5.33 12.12 6.41 0.00 13.88 0.00 100.00 1987 23.70 14.10 18.68 7.55 6.99 11.35 8.22 2.55 0.00 6.89 0.00 100.00 1988 31.72 7.61 12.92 6.20 3.41 4.01 11.92 5.73 0.00 16.48 0.00 100.00 1989 30.05 9.27 13.16 10.34 6.57 8.49 10.19 3.37 0.00 8.56 0.00 100.00 1990 26.37 12.21 17.04 7.87 6.89 11.25 8.15 2.78 0.00 7.44 0.00 100.00 1991 28.40 11.04 13.19 9.98 5.70 7.09 9.71 3.92 0.00 10.95 0.00 100.00 MEAN 28.48 10.97 15.21 8.53 6.55 9.79 9.06 3.21 0.00 8.21 0.00 100.00
SED 1984 16.49 12.77 21.34 22.93 7.16 19.31 0.00 0.00 0.00 0.00 0.00 100.00 1985 14.46 12.94 22.36 21.29 6.82 22.12 0.00 0.00 0.00 0.00 0.00 100.00 1986 16.14 11.71 16.86 35.96 5.70 13.63 0.00 0.00 0.00 0.00 0.00 100.00 1987 16.49 14.87 23.30 19.40 6.59 19.35 0.00 0.00 0.00 0.00 0.00 100.00 1988 21.76 16.38 24.37 24.11 3.96 9.42 0.00 0.00 0.00 0.00 0.00 100.00 1989 17.53 11.31 16.84 31.38 6.77 16.20 0.00 0.00 0.00 0.00 0.00 100.00 1990 19.59 12.18 20.29 21.01 6.73 20.21 0.00 0.00 0.00 0.00 0.00 100.00 1991 16.25 13.72 20.18 30.43 5.75 13.68 0.00 0.00 0.00 0.00 0.00 100.00 MEAN 16.99 13.11 20.98 24.07 6.56 18.31 0.00 0.00 0.00 0.00 0.00 100.00
Appendix A Shenandoah Model Segments Results A65
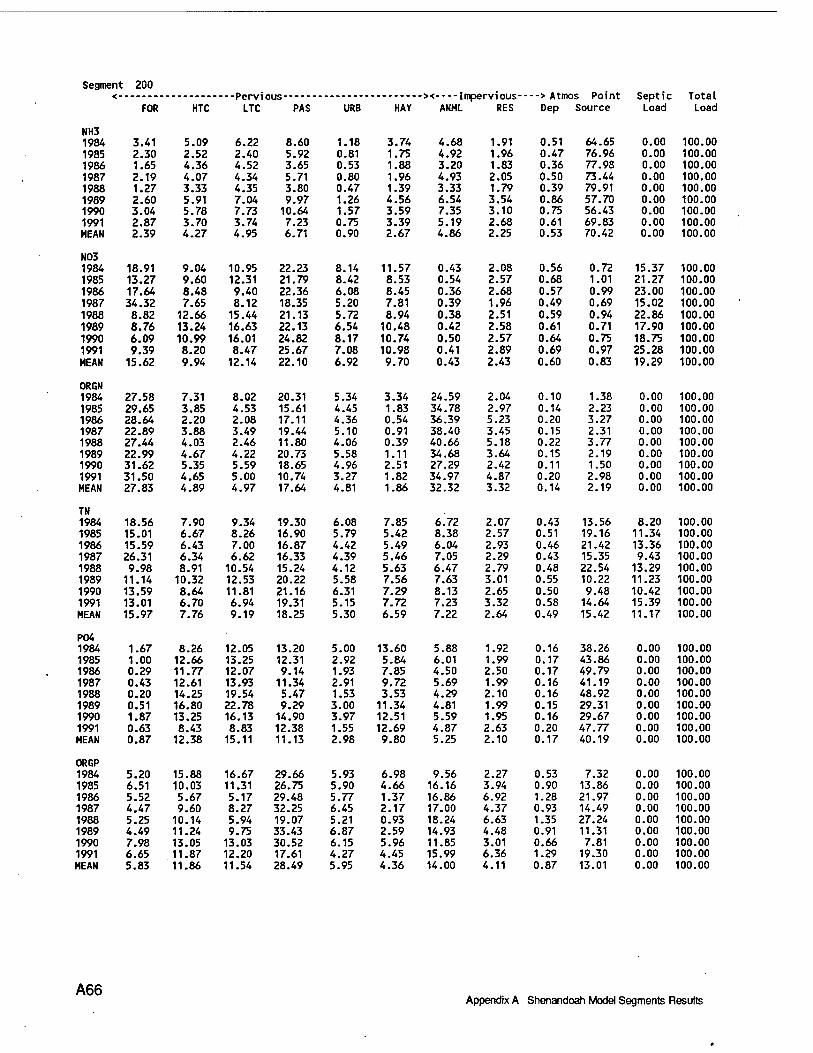
Segment 200 . . _ _ _ s. A f m/\p DAI nf Septic Total -•r^ Ill^i TIVU9 ■fo ruini
FOR HTC LTC PAS URB HAY ANHL RES Dep Source Load Load
NH3 1984 3.41 5.09 6.22 8.60 1.18 3.74 4.68 1.91 0.51 64.65 0.00 100.00 1985 2.30 2.52 2.40 5.92 0.81 1.75 4.92 1.96 0.47 76.96 0.00 100.00 1986 1.65 4.36 4.52 3.65 0.53 1.88 3.20 1.83 0.36 77.98 0.00 100.00 1987 2.19 4.07 4.34 5.71 0.80 1.96 4.93 2.05 0.50 73.44 0.00 100.00 1988 1.27 3.33 4.35 3.80 0.47 1.39 3.33 1.79 0.39 79.91 0.00 100.00 1989 2.60 5.91 7.04 9.97 1.26 4.56 6.54 3.54 0.86 57.70 0.00 100.00 1990 3.04 5.78 7.73 10.64 1.57 3.59 7.35 3.10 0.75 56.43 0.00 100.00 1991 2.87 3.70 3.74 7.23 0.75 3.39 5.19 2.68 0.61 69.83 0.00 100.00 MEAN 2.39 4.27 4.95 6.71 0.90 2.67 4.86 2.25 0.53 70.42 0.00 100.00
N03 1984 18.91 9.04 10.95 22.23 8.14 11.57 0.43 2.08 0.56 0.72 15.37 100.00 1985 13.27 9.60 12.31 21.79 8.42 8.53 0.54 2.57 0.68 1.01 21.27 100.00 1986 17.64 8.48 9.40 22.36 6.08 8.45 0.36 2.68 0.57 0.99 23.00 100.00 1987 34.32 7.65 8.12 18.35 5.20 7.81 0.39 1.96 0.49 0.69 15.02 100.00 1988 8.82 12.66 15.44 21.13 5.72 8.94 0.38 2.51 0.59 0.94 22.86 100.00 1989 8.76 13.24 16.63 22.13 6.54 10.48 0.42 2.58 0.61 0.71 17.90 100.00 1990 6.09 10.99 16.01 24.82 8.17 10.74 0.50 2.57 0.64 0.75 18.75 100.00 1991 9.39 8.20 8.47 25.67 7.08 10.98 0.41 2.89 0.69 0.97 25.28 100.00 MEAN 15.62 9.94 12.14 22.10 6.92 9.70 0.43 2.43 0.60 0.83 19.29 100.00
ORGN 1984 27.58 7.31 8.02 20.31 5.34 3.34 24.59 2.04 0.10 1.38 0.00 100.00 1985 29.65 3.85 4.53 15.61 4.45 1.83 34.78 2.97 0.14 2.23 0.00 100.00 1986 28.64 2.20 2.08 17.11 4.36 0.54 36.39 5.23 0.20 3.27 0.00 100.00 1987 22.89 3.88 3.49 19.44 5.10 0.91 38.40 3.45 0.15 2.31 0.00 100.00 1988 27.44 4.03 2.46 11.80 4.06 0.39 40.66 5.18 0.22 3.77 0.00 100.00 1989 22.99 4.67 4.22 20.73 5.58 1.11 34.68 3.64 0.15 2.19 0.00 100.00 1990 31.62 5.35 5.59 18.65 4.96 2.51 27.29 2.42 0.11 1.50 0.00 100.00 1991 31.50 4.65 5.00 10.74 3.27 1.82 34.97 4.87 0.20 2.98 0.00 100.00 MEAN 27.83 4.89 4.97 17.64 4.81 1.86 32.32 3.32 0.14 2.19 0.00 100.00
TN 1984 18.56 7.90 9.34 19.30 6.08 7.85 6^72 2.07 0.43 13.56 8.20 100.00 1985 15.01 6.67 8.26 16.90 5.79 5.42 8.38 2.57 0.51 19.16 11.34 100.00 1986 15.59 6.43 7.00 16.87 4.42 5.49 6.04 2.93 0.46 21.42 13.36 100.00 1987 26.31 6.34 6.62 16.33 4.39 5.46 7.05 2.29 0.43 15.35 9.43 100.00 1988 9.98 8.91 10.54 15.24 4.12 5.63 6.47 2.79 0.48 22.54 13.29 100.00 1989 11.14 10.32 12.53 20.22 5.58 7.56 7.63 3.01 0.55 10.22 11.23 100.00 1990 13.59 8.64 11.81 21.16 6.31 7.29 8.13 2.65 0.50 9.48 10.42 100.00 1991 13.01 6.70 6.94 19.31 5.15 7.72 7.23 3.32 0.58 14.64 15.39 100.00 MEAN 15.97 7.76 9.19 18.25 5.30 6.59 7.22 2.64 0.49 15.42 11.17 100.00
P04 1984 1.67 8.26 12.05 13.20 5.00 13.60 5.88 1.92 0.16 38.26 0.00 100.00 1985 1.00 12.66 13.25 12.31 2.92 5.84 6.01 1.99 0.17 43.86 0.00 100.00 1986 0.29 11.77 12.07 9.14 1.93 7.85 4.50 2.50 0.17 49.79 0.00 100.00 1987 0.43 12.61 13.93 11.34 2.91 9.72 5.69 1.99 0.16 41.19 0.00 100.00 1988 0.20 14.25 19.54 5.47 1.53 3.53 4.29 2.10 0.16 48.92 0.00 100.00 1989 0.51 16.80 22.78 9.29 3.00 11.34 4.81 1.99 0.15 29.31 0.00 100.00 1990 1.87 13.25 16.13 14.90 3.97 12.51 5.59 1.95 0.16 29.67 0.00 100.00 1991 0.63 8.43 8.83 12.38 1.55 12.69 4.87 2.63 0.20 47.77 0.00 100.00 MEAN 0.87 12.38 15.11 11.13 2.98 9.80 5.25 2.10 0.17 40.19 0.00 100.00
ORGP 1984 5.20 15.88 16.67 29.66 5.93 6.98 9.56 2.27 0.53 7.32 0.00 100.00 1985 6.51 10.03 11.31 26.75 5.90 4.66 16.16 3.94 0.90 13.86 0.00 100.00 1986 5.52 5.67 5.17 29.48 5.77 1.37 16.86 6.92 1.28 21.97 0.00 100.00 1987 4.47 9.60 8.27 32.25 6.45 2.17 17.00 4.37 0.93 14.49 0.00 100.00 1988 5.25 10.14 5.94 19.07 5.21 0.93 18.24 6.63 1.35 27.24 0.00 100.00 1989 4.49 11.24 9.75 33.43 6.87 2.59 14.93 4.48 0.91 11.31 0.00 100.00 1990 7.98 13.05 13.03 30.52 6.15 5.96 11.85 3.01 0.66 7.81 0.00 100.00 1991 6.65 11.87 12.20 17.61 4.27 4.45 15.99 6.36 1.29 19.30 0.00 100.00 MEAN 5.83 11.86 11.54 28.49 5.95 4.36 14.00 4.11 0.87 13.01 0.00 100.00
A66 Appendix A Shenandoah Model Segments Results
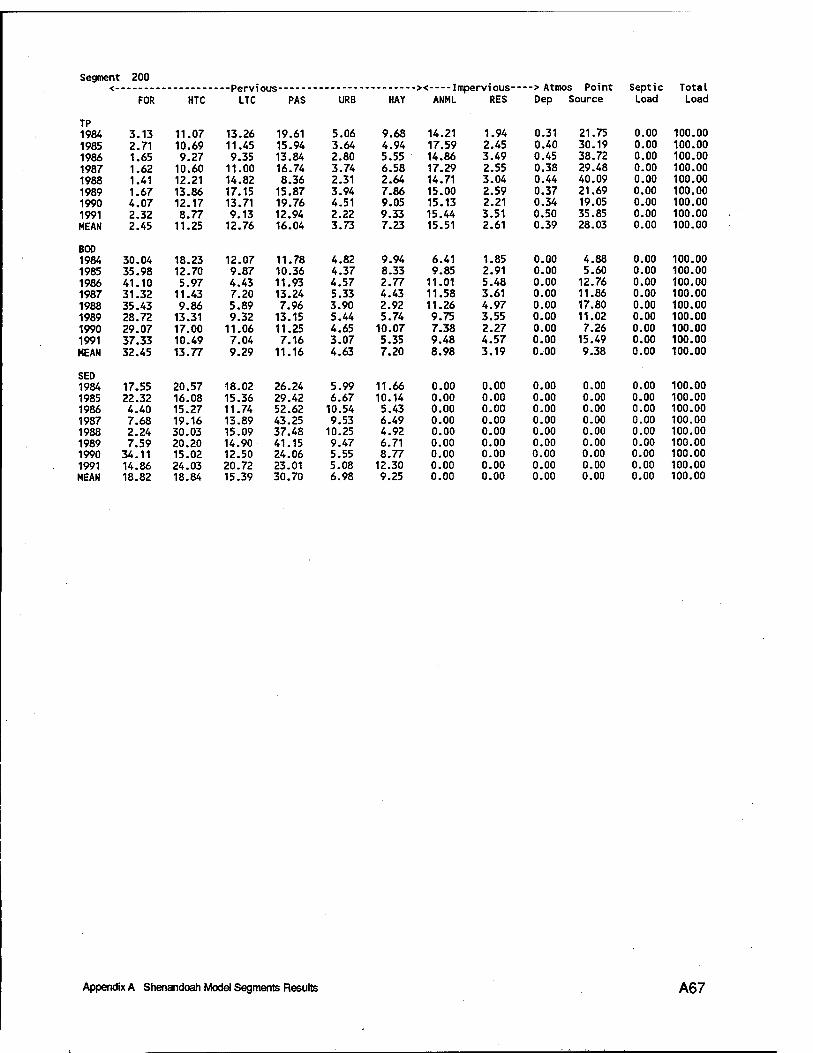
Segment 200 --s. Itmnc' Dmnt Sept i c
Load Total Load
< FOR HTC LTC PAS URB HAY ANML RES Dep Source
TP 1984 3.13 11.07 13.26 19.61 5.06 9.68 14.21 1.94 0.31 21.75 0.00 100.00 1985 2.71 10.69 11.45 15.94 3.64 4.94 17.59 2.45 0.40 30.19 0.00 100.00 1986 1.65 9.27 9.35 13.84 2.80 5.55 14.86 3.49 0.45 38.72 0.00 100.00 1987 1.62 10.60 11.00 16.74 3.74 6.58 17.29 2.55 0.38 29.48 0.00 100.00 1988 1.41 12.21 14.82 8.36 2.31 2.64 14.71 3.04 0.44 40.09 0.00 100.00 1989 1.67 13.86 17.15 15.87 3.94 7.86 15.00 2.59 0.37 21.69 0.00 100.00 1990 4.07 12.17 13.71 19.76 4.51 9.05 15.13 2.21 0.34 19.05 0.00 100.00 1991 2.32 8.77 9.13 12.94 2.22 9.33 15.44 3.51 0.50 35.85 0.00 100.00 MEAN 2.45 11.25 12.76 16.04 3.73 7.23 15.51 2.61 0.39 28.03 0.00 100.00
BOD 1984 30.04 18.23 12.07 11.78 4.82 9.94 6.41 1.85 0.00 4.88 0.00 100.00 1985 35.98 12.70 9.87 10.36 4.37 8.33 9.85 2.91 0.00 5.60 0.00 100.00 1986 41.10 5.97 4.43 11.93 4.57 2.77 11.01 5.48 0.00 12.76 0.00 100.00 1987 31.32 11.43 7.20 13.24 5.33 4.43 11.58 3.61 0.00 11.86 0.00 100.00 1988 35.43 9.86 5.89 7.96 3.90 2.92 11.26 4.97 0.00 17.80 0.00 100.00 1989 28.72 13.31 9.32 13.15 5.44 5.74 9.75 3.55 0.00 11.02 0.00 100.00 1990 29.07 17.00 11.06 11.25 4.65 10.07 7.38 2.27 0.00 7.26 0.00 100.00 1991 37.33 10.49 7.04 7.16 3.07 5.35 9.48 4.57 0.00 15.49 0.00 100.00 MEAN 32.45 13.77 9.29 11.16 4.63 7.20 8.98 3.19 0.00 9.38 0.00 100.00
SED 1984 17.55 20.57 18.02 26.24 5.99 11.66 0.00 0.00 0.00 0.00 0.00 100.00 1985 22.32 16.08 15.36 29.42 6.67 10.14 0.00 0.00 0.00 0.00 0.00 100.00 1986 4.40 15.27 11.74 52.62 10.54 5.43 0.00 0.00 0.00 0.00 0.00 100.00 1987 7.68 19.16 13.89 43.25 9.53 6.49 0.00 0.00 0.00 0.00 0.00 100.00 1988 2.24 30.03 15.09 37.48 10.25 4.92 0.00 0.00 0.00 0.00 0.00 100.00 1989 7.59 20.20 14.90 41.15 9.47 6.71 0.00 0.00 0.00 0.00 0.00 100.00 1990 34.11 15.02 12.50 24.06 5.55 8.77 0.00 0.00 0.00 0.00 0.00 100.00 1991 14.86 24.03 20.72 23.01 5.08 12.30 0.00 0.00 0.00 0.00 0.00 100.00 MEAN 18.82 18.84 15.39 30.70 6.98 9.25 0.00 0.00 0.00 0.00 0.00 100.00
Appendix A Shenandoah Model Segments Results A67
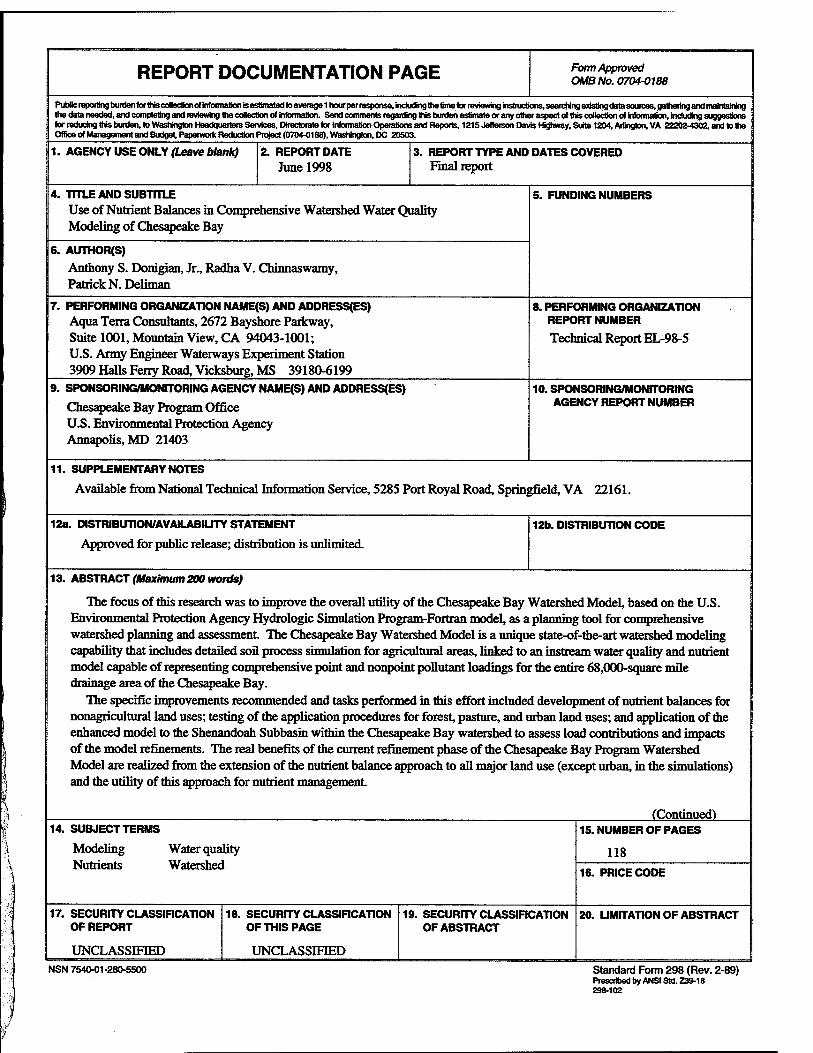
REPORT DOCUMENTATION PAGE Form Approved OMB No. 0704-0188
Pubfcrep(xtingbuidenfbr1hiscaaectkinofinfoimal»nisestiniat8dtoaveiage1 hourperresponse.indudingtrietiirieförreviewirginstr^^ J the data needed, and completing and reviewing the collection of information. Send comments regairjng this burden estimate or any other aspect oil this cotlectkxi of Homiatkxi, incfudmg suggestions | for reducing this burden, to Washington Headquarters Services, Directorate for Informatkxi Operations and Rerxxts, 1215 Jeffei^ 22202-4302, and to the I Office of Managemerrtand Budget Paperwork Reduction Project (0704-0188), Washington, DC 20503. j
1. AGENCY USE ONLY (Leave blank) 2. REPORT DATE June 1998
3. REPORT TYPE AND DATES COVERED 1 Final report
4. TITLE AND SUBTITLE Use of Nutrient Balances in Comprehensive Watershed Water Quality Modeling of Chesapeake Bay
5. FUNDING NUMBERS
6. AUTHOR(S)
Anthony S. Donigian, Jr., Radha V. Chinnaswamy, Patrick N. Deliman
7. PERFORMING ORGANIZATION NAME(S) AND ADDRESSES) Aqua Terra Consultants, 2672 Bayshore Parkway, Suite 1001, Mountain View, CA 94043-1001; U.S. Army Engineer Waterways Experiment Station 3909 Halls Ferry Road, Vicksburg, MS 39180-6199
8. PERFORMING ORGANIZATION REPORT NUMBER
Technical Report EL-98-5
9. SPONSORING/MONITORING AGENCY NAME(S) AND ADDRESSEES)
Chesapeake Bay Program Office U.S. Environmental Protection Agency Annapolis, MD 21403
10. SPONSORING/MONITORING AGENCY REPORT NUMBER
11. SUPPLEMENTARY NOTES
Available from National Technical Information Service, 5285 Port Royal Road, Springfield, VA 22161.
12a. DISTRIBUnON/AVAlLABILTTY STATEMENT
Approved for public release; distribution is unlimited.
12b. DISTRIBUTION CODE I
13. ABSTRACT (Maximum 2O0 words)
The focus of this research was to improve the overall utility of the Chesapeake Bay Watershed Model, based on the U.S. Environmental Protection Agency Hydrologie Simulation Program-Fortran model, as a planning tool for comprehensive watershed planning and assessment The Chesapeake Bay Watershed Model is a unique state-of-the-art watershed modeling capability that includes detailed soil process simulation for agricultural areas, linked to an instream water quality and nutrient model capable of representing comprehensive point and nonpoint pollutant loadings for the entire 68,000-square mile drainage area of the Chesapeake Bay.
The specific improvements recommended and tasks performed in this effort included development of nutrient balances for nonagricultural land uses; testing of the application procedures for forest, pasture, and urban land uses; and application of the enhanced model to the Shenandoah Subbasin within the Chesapeake Bay watershed to assess load contributions and impacts of the model refinements. The real benefits of the current refinement phase of the Chesapeake Bay Program Watershed Model are realized from the extension of the nutrient balance approach to all major land use (except urban, in the simulations) and the utility of this approach for nutrient management
(Continued) 14. SUBJECT TERMS
Modeling Nutrients
Water quality Watershed
15. NUMBER OF PAGES
118 16. PRICE CODE
17. SECURITY CLASSIFICATION OF REPORT
UNCLASSIFIED
18. SECURITY CLASSIFICATION OF THIS PAGE
UNCLASSIFIED
19. SECURITY CLASSIFICATION OF ABSTRACT
20. LIMITATION OF ABSTRACT
NSN 7540-01-280-5500 Standard Form 298 (Rev. 2-89) Prescribed by ANSI Std. Z39-18 298-102
13. (Concluded).
Recommendations presented for consideration of future refinements to the Watershed Model include the following:
• Finer segmentation for all stream reaches for better process representation. • More consistent approach to organics and biochemical oxygen demand loadings for all land uses. • Revaluation of the representation of septic system loads. • Further investigation and data review for the algal simulation—benthic algae and phytoplankton. • Division of the lumped urban land use into identifiable urban categories for AGCHEM simulation. • Simulation of individual crops and elimination of the "composite crop" representation. • Review of nutrient application rates and procedures. • Extension of the forest nitrogen simulation procedures to include phosphorus (P) simulation so that P mass
balance procedures can be applied to all land uses.