use of equations of state (eos) software -...
TRANSCRIPT
USE OF EQUATIONS OF STATE (EOS) SOFTWARE
Donald P. Mayeaux
President A+ Corporation, LLC
41041 Black Bayou Rd. Gonzales, LA USA
Introduction
Proper sample conditioning is essential to providing a representative sample of natural gas to the analyzer. Sample conditioning consists of extracting a sample from a process stream, transporting it to an analyzer, and conditioning it so that it is compatible with the analyzer. Conditioning generally consists of controlling the gas temperature, pressure, and flow rate. It also includes the removal of contaminates which may alter the sample composition and/or damage the analyzer. It is imperative that the gas sample composition is not altered or distorted during the conditioning process.
Equations of State (EOS) software programs are useful tools for modeling the behavior of natural gas as it flows through a sample system. With the use of an EOS program one can determine if conditions in a particular sample conditioning system are conducive to the proper sampling of a specific natural gas composition.
EOS software can be useful to the engineer or technician during the design, operation, and maintenance of a natural gas sampling system. This paper will discuss the types of information an EOS program can provide and how this can be utilized to solve common sample conditioning problems.
Equations of State (EOS) software
The EOS expresses the mathematical relationships which exist between the pressure, volume, and temperature of a fluid which permit the prediction of real behavior. There are several equations of state utilized by the natural gas industry. Two common ones are Peng – Robinson and Soave – Redlich – Kwong (SRK).
The typical EOS software package utilizes these equations to provide a vast amount of information for a given gas composition.
The following are examples of information which they can provide that is valuable to the analyzer engineer or technician.
• The hydrocarbon dew point temperature
• A phase diagram
• Physical properties of a complex gas mixture
• The composition, heating value (BTU content), and physical properties of both phases of a gas and liquid which are in equilibrium
• The heating value of a gas sample stream
The above information is required to answer practical questions such as:
• Is liquid entrained in the sample source?
• What is the dewpoint temperature of the sample gas at source pressure?
• Will condensation occur in the sample system?
Using a typical EOS software package
Entering the composition
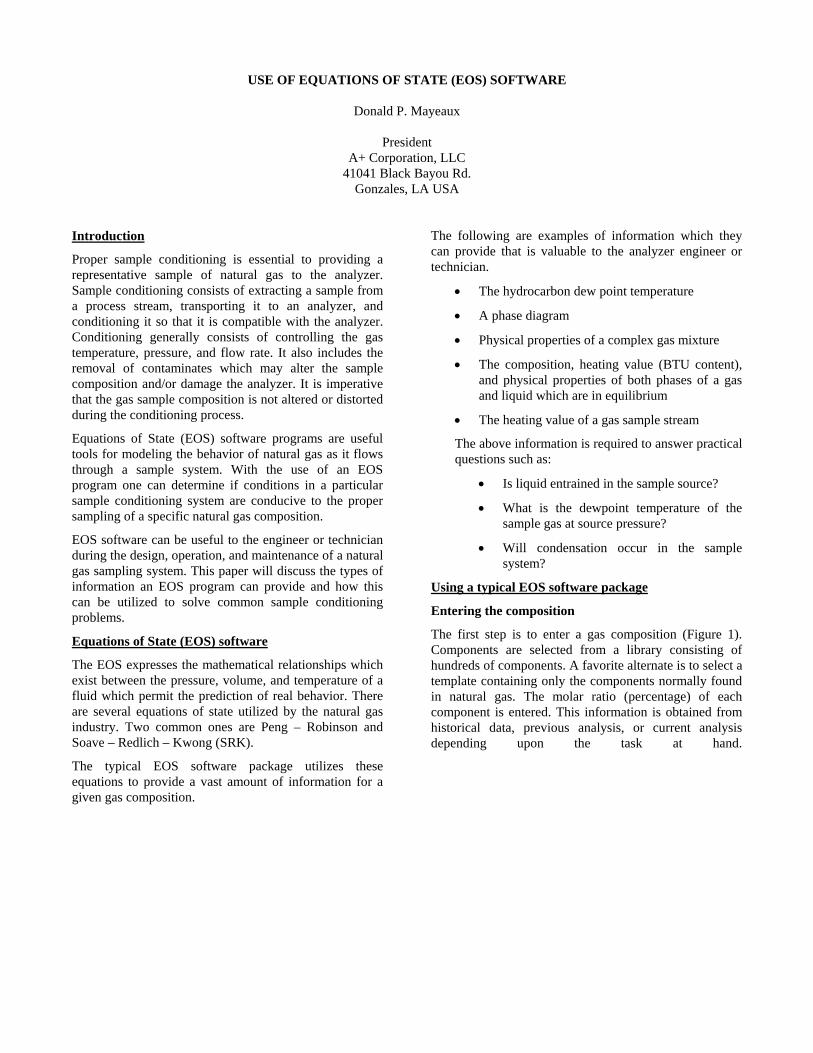
The first step is to enter a gas composition (Figure 1). Components are selected from a library consisting of hundreds of components. A favorite alternate is to select a template containing only the components normally found in natural gas. The molar ratio (percentage) of each component is entered. This information is obtained from historical data, previous analysis, or current analysis depending upon the task at hand.
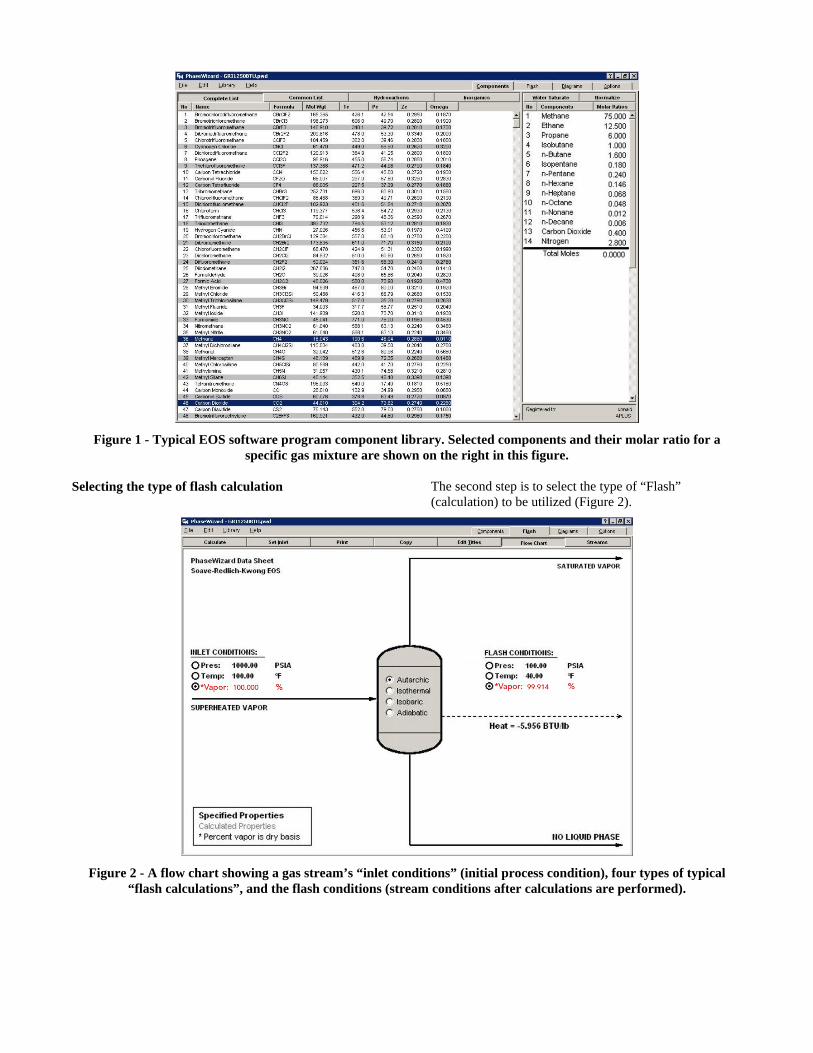
Figure 1 - Typical EOS software program component library. Selected components and their molar ratio for a
specific gas mixture are shown on the right in this figure.
Selecting the type of flash calculation The second step is to select the type of “Flash” (calculation) to be utilized (Figure 2).
Figure 2 - A flow chart showing a gas stream’s “inlet conditions” (initial process condition), four types of typical
“flash calculations”, and the flash conditions (stream conditions after calculations are performed).
The typical types of flash calculations are listed in Figure 3 with a brief description of each. The autarchic condition was selected for this example.
Autarchic Autarchic means independent. The two conditions selected for the flash condition or second set of conditions can be chosen independent of the two conditions selected for the “inlet condition”.
Isothermal This means that the temperature for the flash condition is the same as the temperatures selected for the “inlet condition”.
Isobaric It means that the pressure for the flash condition is the same as the pressure selected for the “inlet condition”.
Adiabatic This means that the flash calculation will not include heat entering or leaving the system. I.e. the outlet enthalpy equals the inlet enthalpy plus the work done.
Figure 3 - A table listing four types of commonly used flash calculations.
Input inlet conditions (initial process conditions)
The third step is to enter two of the three “inlet conditions”, the third is computed by the program (Figure 2). In this case at 1000 PSIA and 100oF the sample is 100% in vapor phase.
Enter flash conditions
The fourth step is to enter two of the three flash conditions. The two conditions which can be selected will
depend upon which flash calculation method was chosen. In this case the flash conditions selected were 100 PSIA and 40oF (Figure 2).
Perform the calculations.
The fifth step is to perform the calculations. This is accomplished by a single key stroke. Within seconds a wide range of information becomes available.
At a glance, one can determine that the sample in the original (inlet) condition is 100% in vapor phase i.e. no liquid present (Figure 2). The flash condition shows less than 100% vapor so liquid will condense at the selected conditions of 100 PSIA and 40oF.
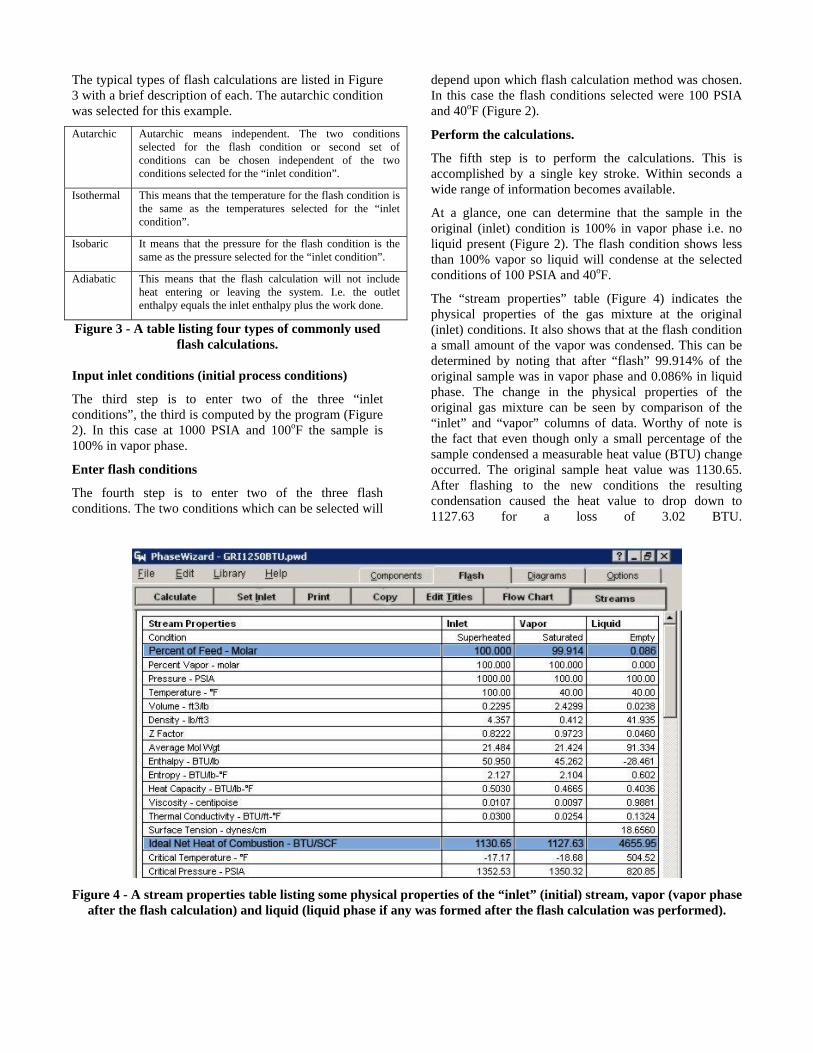
The “stream properties” table (Figure 4) indicates the physical properties of the gas mixture at the original (inlet) conditions. It also shows that at the flash condition a small amount of the vapor was condensed. This can be determined by noting that after “flash” 99.914% of the original sample was in vapor phase and 0.086% in liquid phase. The change in the physical properties of the original gas mixture can be seen by comparison of the “inlet” and “vapor” columns of data. Worthy of note is the fact that even though only a small percentage of the sample condensed a measurable heat value (BTU) change occurred. The original sample heat value was 1130.65. After flashing to the new conditions the resulting condensation caused the heat value to drop down to 1127.63 for a loss of 3.02 BTU.
Figure 4 - A stream properties table listing some physical properties of the “inlet” (initial) stream, vapor (vapor phase
after the flash calculation) and liquid (liquid phase if any was formed after the flash calculation was performed).
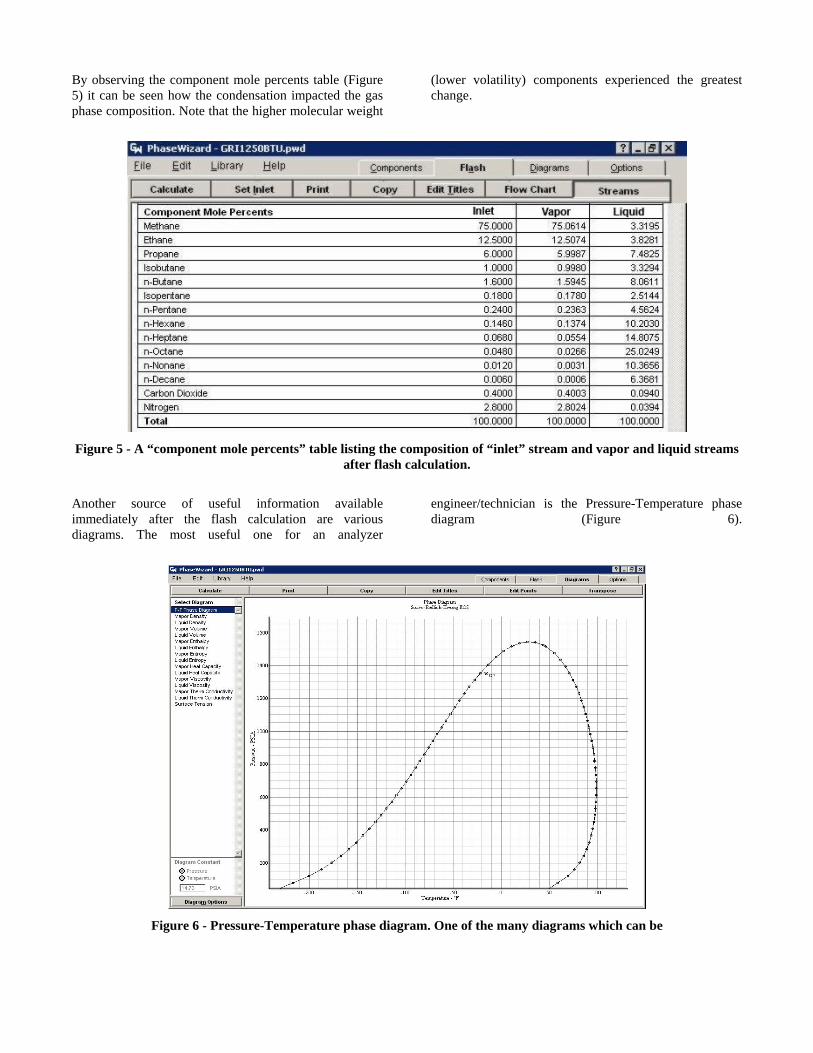
By observing the component mole percents table (Figure 5) it can be seen how the condensation impacted the gas phase composition. Note that the higher molecular weight
(lower volatility) components experienced the greatest change.
Figure 5 - A “component mole percents” table listing the composition of “inlet” stream and vapor and liquid streams
after flash calculation.
Another source of useful information available immediately after the flash calculation are various diagrams. The most useful one for an analyzer
engineer/technician is the Pressure-Temperature phase diagram (Figure 6).
Figure 6 - Pressure-Temperature phase diagram. One of the many diagrams which can be
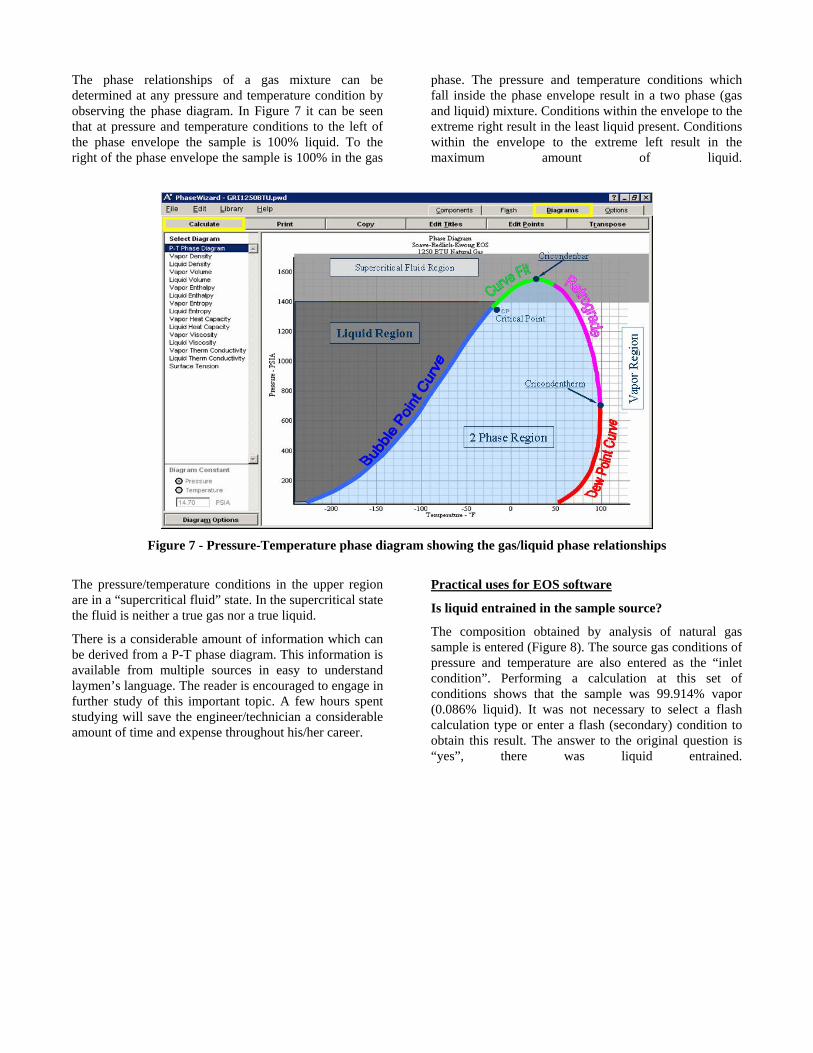
The phase relationships of a gas mixture can be determined at any pressure and temperature condition by observing the phase diagram. In Figure 7 it can be seen that at pressure and temperature conditions to the left of the phase envelope the sample is 100% liquid. To the right of the phase envelope the sample is 100% in the gas
phase. The pressure and temperature conditions which fall inside the phase envelope result in a two phase (gas and liquid) mixture. Conditions within the envelope to the extreme right result in the least liquid present. Conditions within the envelope to the extreme left result in the maximum amount of liquid.
Figure 7 - Pressure-Temperature phase diagram showing the gas/liquid phase relationships
The pressure/temperature conditions in the upper region are in a “supercritical fluid” state. In the supercritical state the fluid is neither a true gas nor a true liquid.
There is a considerable amount of information which can be derived from a P-T phase diagram. This information is available from multiple sources in easy to understand laymen’s language. The reader is encouraged to engage in further study of this important topic. A few hours spent studying will save the engineer/technician a considerable amount of time and expense throughout his/her career.
Practical uses for EOS software
Is liquid entrained in the sample source?
The composition obtained by analysis of natural gas sample is entered (Figure 8). The source gas conditions of pressure and temperature are also entered as the “inlet condition”. Performing a calculation at this set of conditions shows that the sample was 99.914% vapor (0.086% liquid). It was not necessary to select a flash calculation type or enter a flash (secondary) condition to obtain this result. The answer to the original question is “yes”, there was liquid entrained.
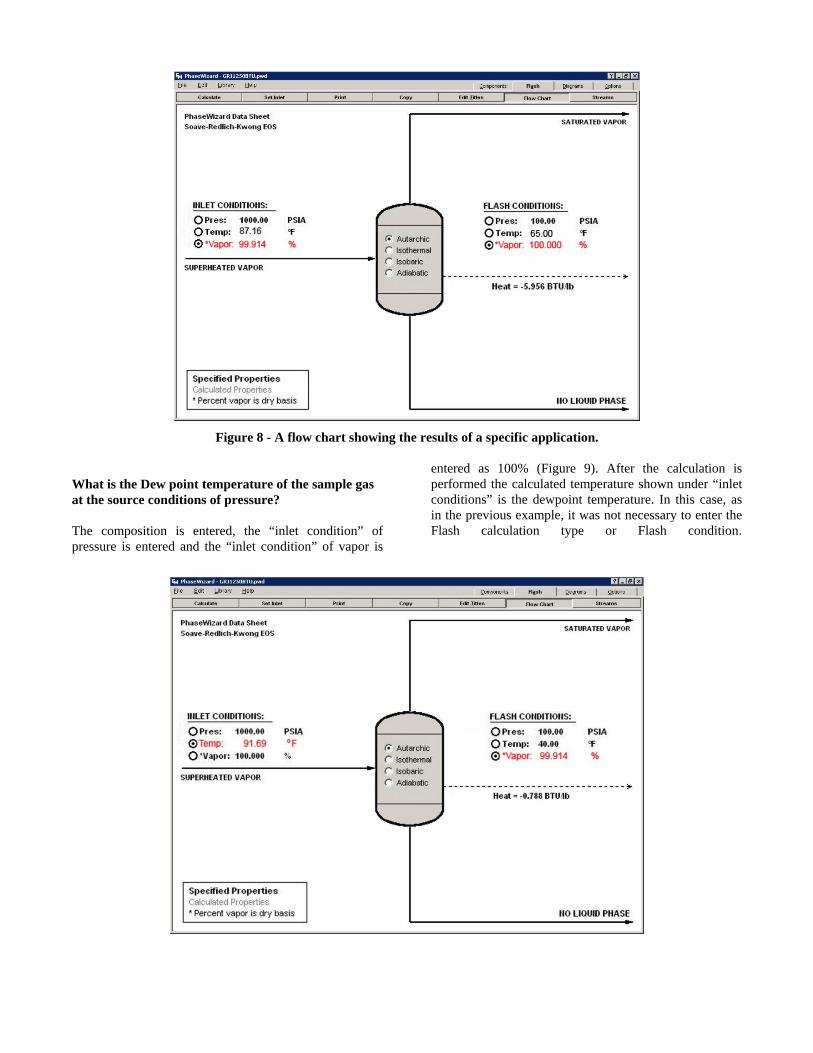
Figure 8 - A flow chart showing the results of a specific application.
What is the Dew point temperature of the sample gas at the source conditions of pressure? The composition is entered, the “inlet condition” of pressure is entered and the “inlet condition” of vapor is
entered as 100% (Figure 9). After the calculation is performed the calculated temperature shown under “inlet conditions” is the dewpoint temperature. In this case, as in the previous example, it was not necessary to enter the Flash calculation type or Flash condition.
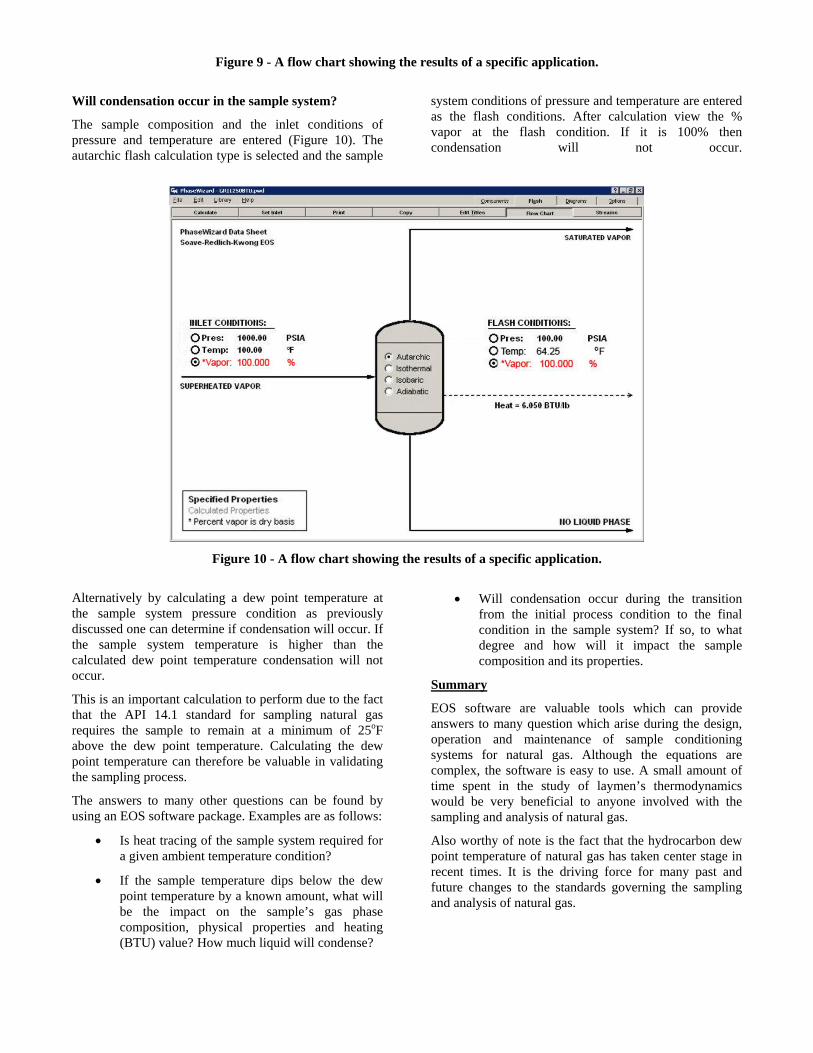
Figure 9 - A flow chart showing the results of a specific application.
Will condensation occur in the sample system?
The sample composition and the inlet conditions of pressure and temperature are entered (Figure 10). The autarchic flash calculation type is selected and the sample
system conditions of pressure and temperature are entered as the flash conditions. After calculation view the % vapor at the flash condition. If it is 100% then condensation will not occur.
Figure 10 - A flow chart showing the results of a specific application.
Alternatively by calculating a dew point temperature at the sample system pressure condition as previously discussed one can determine if condensation will occur. If the sample system temperature is higher than the calculated dew point temperature condensation will not occur.
This is an important calculation to perform due to the fact that the API 14.1 standard for sampling natural gas requires the sample to remain at a minimum of 25oF above the dew point temperature. Calculating the dew point temperature can therefore be valuable in validating the sampling process.
The answers to many other questions can be found by using an EOS software package. Examples are as follows:
• Is heat tracing of the sample system required for a given ambient temperature condition?
• If the sample temperature dips below the dew point temperature by a known amount, what will be the impact on the sample’s gas phase composition, physical properties and heating (BTU) value? How much liquid will condense?
• Will condensation occur during the transition from the initial process condition to the final condition in the sample system? If so, to what degree and how will it impact the sample composition and its properties.
Summary
EOS software are valuable tools which can provide answers to many question which arise during the design, operation and maintenance of sample conditioning systems for natural gas. Although the equations are complex, the software is easy to use. A small amount of time spent in the study of laymen’s thermodynamics would be very beneficial to anyone involved with the sampling and analysis of natural gas.
Also worthy of note is the fact that the hydrocarbon dew point temperature of natural gas has taken center stage in recent times. It is the driving force for many past and future changes to the standards governing the sampling and analysis of natural gas.