use of basalt f ibers for concrete structures · pdf filedesign of concrete members reinforced...
TRANSCRIPT
Page 1 of 28
Use of basalt fibers for concrete structures
Cory Higha, Hatem M. Seliemb*, Adel El-Saftyc, Sami H. Rizkallaa
a Department of Civil, Construction and Environmental Engineering, NCSU, Raleigh, NC, USA
b Department of Civil Engineering, Faculty of Engineering, Helwan University, Cairo, Egypt
c School of Engineering, University of North Florida, Jacksonville, FL, USA
Abstract:
This study investigated the use of basalt fiber bars as flexural reinforcement for concrete
members and the use of chopped basalt fibers as an additive to enhance the mechanical
properties of concrete. The material characteristics and development length of two
commercially-available basalt fiber bars were evaluated. Test results indicate that flexural
design of concrete members reinforced with basalt fiber bars should ensure compression failure
and satisfying the serviceability requirements. ACI 440.1R-06 accurately predicts the flexural
capacity of members reinforced with basalt bars, but it significantly underestimates the
deflection at service load level. Use of chopped basalt fibers had little effect on the concrete
compressive strength, however, significantly enhanced its flexural modulus.
Keywords:
Fibers, basalt, fiber-reinforced concrete, bond, flexure, average residual strength,
Page 2 of 28
1. Introduction
Basalt fibers are produced from basalt rocks, which are melted at 1400 οC. Basalt fibers are
environmentally safe, non-toxic, and possess high stability and insulating characteristics [1].
Basalt Fiber Reinforced Polymer (BFRP) reinforcing bars have been recently introduced as an
alternative to steel reinforcement for concrete structures and as external reinforcement for
retrofitting of concrete structures. Unlike Carbon Fiber Reinforced Polymer (CFRP) and Glass
Fiber Reinforced Polymer (GFRP) materials, basalt fibers have not been widely used. The
limitation of their use may be attributed to the lack of fundamental research and extensive
testing required to establish an appropriate design recommendations and guidelines. Chopped
basalt fibers have been also introduced as an additive to concrete mixes to produce fiber
reinforced concrete (FRC).
The research presented in this paper comprises two main studies. The first study evaluated the
behavior of flexural concrete members reinforced with BFRP bars. The study included
assessments of the mechanical properties and the bond strength of two selected BFRP bars
having two different surface deformations. The first BFRP bars were ribbed and the second
were dented. The second study investigated the use of chopped basalt fibers as an additive to
concrete mix to enhance the mechanical properties of hardened the concrete. Two different
short basalt fiber products were investigated in the second study.
FIRST STUDY: FLEXURAL BEAHAVIOR OF CONCRETE MEMBERS
REINFORCED WITH BFRP BARS
2. Background
Ramakrishnan et. Al. (1998) [1] investigated the use of basalt fiber bars for reinforcing concrete
members. Test results indicated that specimens reinforced with BFRP bars with short bond
Page 3 of 28
lengths exhibited gradual slip prior to failure. Specimens with long bond lengths exhibited
sudden failures due to rupture of the BFRP bars. Patnaik (2010) [2] studied the flexural strength
of 13 concrete beams reinforced with BFRP bars and compared the measured failure loads to
those predicted by ACI 440.1R-06 guidelines. The study concluded that prediction of moment
capacities by ACI 440.1R-06 agrees well with the measured values. Ovitigala (2013) [3]
investigated the behavior of lightweight and normal weight concrete beams reinforced with
BFRP bars. The study reported that ACI 440.1R-06 [4] predicted 77 to 93 percent of the
measured moment capacities. In addition, the study reported higher deflections for BFRP-
reinforced concrete beams in comparison to steel-reinforced concrete beams with the same
flexural capacity
3. Mechanical Properties of BFRP Bars
A total of ten coupons of each of the ribbed and dented bars were tested in tension according to
ASTM D7205 [5]. The tension coupons had a 305 mm gripping length at each end and a free
length of 610 mm. The gripping length consisted of epoxy-filled steel pipes attached to each end
of the test coupon. The elongation of the tension coupons was measured using a 50 mm
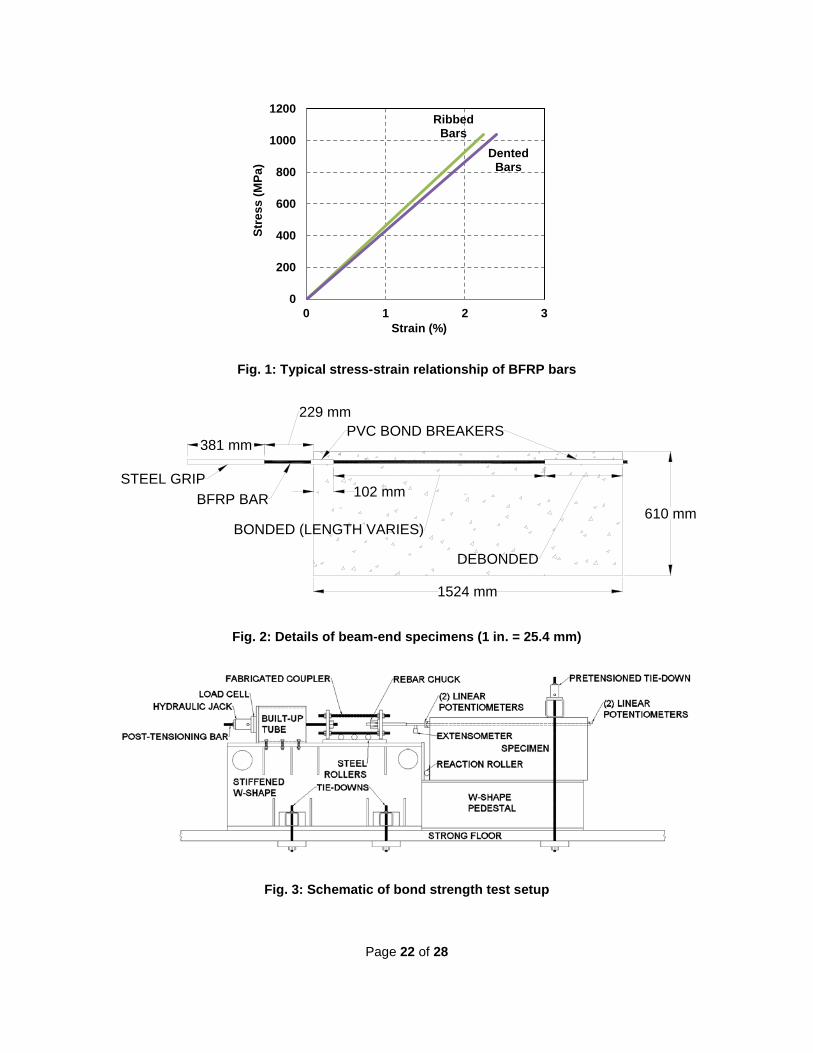
extensometer. The average engineering stress-strain relationships of the ribbed and dented
BFRP bars are shown in Fig. 1. The average measured cross-sectional area of the ribbed and
dented BFRP bars is 109 mm2. The equivalent nominal diameter of both bars is approximately
12 mm. The measured cross-sectional area and equivalent diameter of the bars were
determined by volume water displacement according to ACI 440.3R-04 [6]. It should be noted
that the ribs were excluded from the measured area.
The tension coupons exhibited a linearly elastic stress-strain relationship up to rupture of the
bars. The average measured modulus of elasticity of the ribbed and dented BFRP bars was
approximately 48.3 GPa and 41.4 GPa, respectively, therefore an average value of 45 GPa can
Page 4 of 28
be used. The average measured ultimate tensile strength for both bars was approximately 1,000
MPa. The average measured rupture strain of the ribbed and dented bars was 2.2% and 2.5%,
respectively.
4. Bond Strength of BFRP Bars
4.1 Test Specimens and Test Setup
Beam-end specimens were used to assess the bond characteristics of the two types of BFRP
bars with different surface deformations (ribbed or dented). A total of eight specimens, four
specimens for each bar type, were tested. The development length according to the equation
provided by ACI 440.1R-06 [4] for GFRP and CFRP bars was 762 mm, which is approximately
equivalent to 65 times the bars diameter. Accordingly, four different bond lengths were selected
for this study, 380 mm, 610 mm, 1015 mm, and 1270 mm, which are equivalent to 32, 51, 85,
and 106 times the bar diameter, respectively.
The concrete beam-end specimens had a total length of 1524 mm to accommodate the longest
bond length. The depth of the specimens was 610 mm to eliminate the influence of the
compressed concrete zone on the bonded length of the bar. A width of 305 mm was used to
provide enough bearing strength. The specimens were cast with the BFRP at the bottom
position and the specimens were rotated prior to testing. Details of specimens are shown in Fig.
2.
All tested bars were 2134 mm long to provide an embedment length of 1524 mm within the
specimen and an overhang length of 610 mm to grip the bar. A PVC pipe was used at the
unloaded end to break the bond and to provide the specified bond length. A 102 mm PVC pipe
was used at the loaded end to avoid possible localized failure of the concrete.
Page 5 of 28
Two linear potentiometers were attached to the loaded end of the test bar to measure the
elongation of the bar. Similarly, two linear potentiometers were attached to the unloaded end
(free end) of the BFRP bar tested to measure the slip of the bar. Elongation of the test bars was
measured using a 50 mm extensometer located within the free length of the bars. The test setup
is shown in Fig. 3.
4.2 Test Results and Discussion
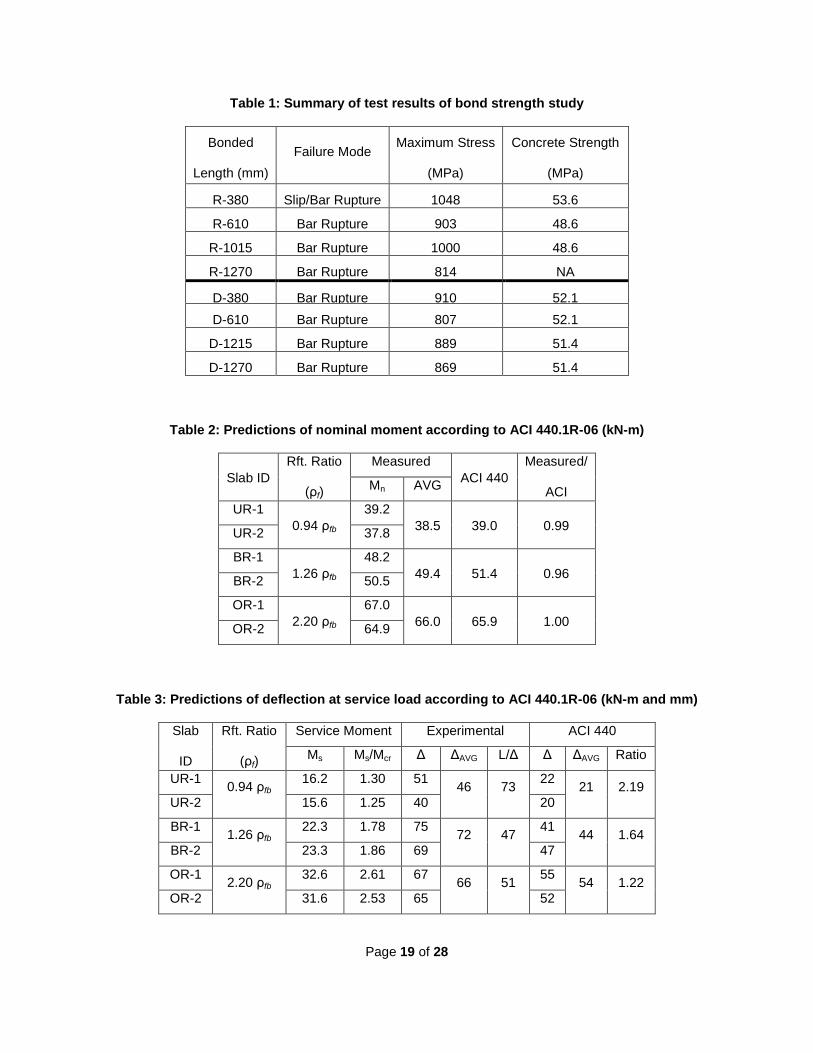
Test results of the ribbed bars “R” and the dented bars “D” are given in Table 1 including the
observed failure mode, the maximum measured stress in the bar at failure, and the measured
concrete compressive strength at the day of testing. Test results indicate that the ribbed and
dented BFRP bars have similar bond strengths. A bonded length of 380 mm, which is equivalent
to 32 times the bar diameter, was found enough to develop the full strength of the BFRP bars
used in this study.
5. Flexural Behavior of BFRP-Reinforced Members
5.1 Test specimens
Six, one-way slabs reinforced with ribbed BFRP bars only were tested in flexure up to failure.
The specimens were 3658 mm long with a cross-section of 610 mm wide and 152 mm deep.
The BFRP bars were spaced uniformly across the width of the specimens and had a clear
concrete cover of 25 mm. All specimens were tested at concrete age ranging from 58 to 63 days
and the average measured concrete compressive strength was 72.1 MPa at the day of testing.
The balanced reinforcement ratio of the slabs was computed as 0.47 percent.
Two duplicate specimens reinforced with three bars were designed to fail in tension with a
reinforcement ratio of 0.44 percent, which is 0.94 of the balanced ratio. Two duplicate
specimens reinforced with seven bars were designed to fail in compression with a reinforcement
Page 6 of 28
ratio of 1.04 percent, which is 2.20 of the balanced ratio .The last two duplicate specimens were
reinforced with four bars, resulting in a reinforcement ratio of 0.59 percent, which is 1.26 of the
balanced ratio. The ribbed bars were selected in this study due to their higher modulus of
elasticity compared to the dented bars. The measured average cross-sectional area of the
ribbed bars was 109 mm2.
5.2 Test setup and Instrumentation
The flexural specimens were tested in a four-point bending configuration with a test span of
3353 mm using one hydraulic actuator. The load was applied at two locations spaced 305 mm
apart. The specimens were supported by a pin support at one end and a roller support at the
other end.
Two string potentiometers were used to measure the deflection at mid-span. Five PI-gages
located at the mid-span section were used to measure the strain of concrete. Two PI-gages, 50
mm apart, were placed on the top and two PI-gages on the bottom surfaces of the slabs. The
fifth PI-gage was placed on the side face of the specimens at the depth of the BFRP bars to
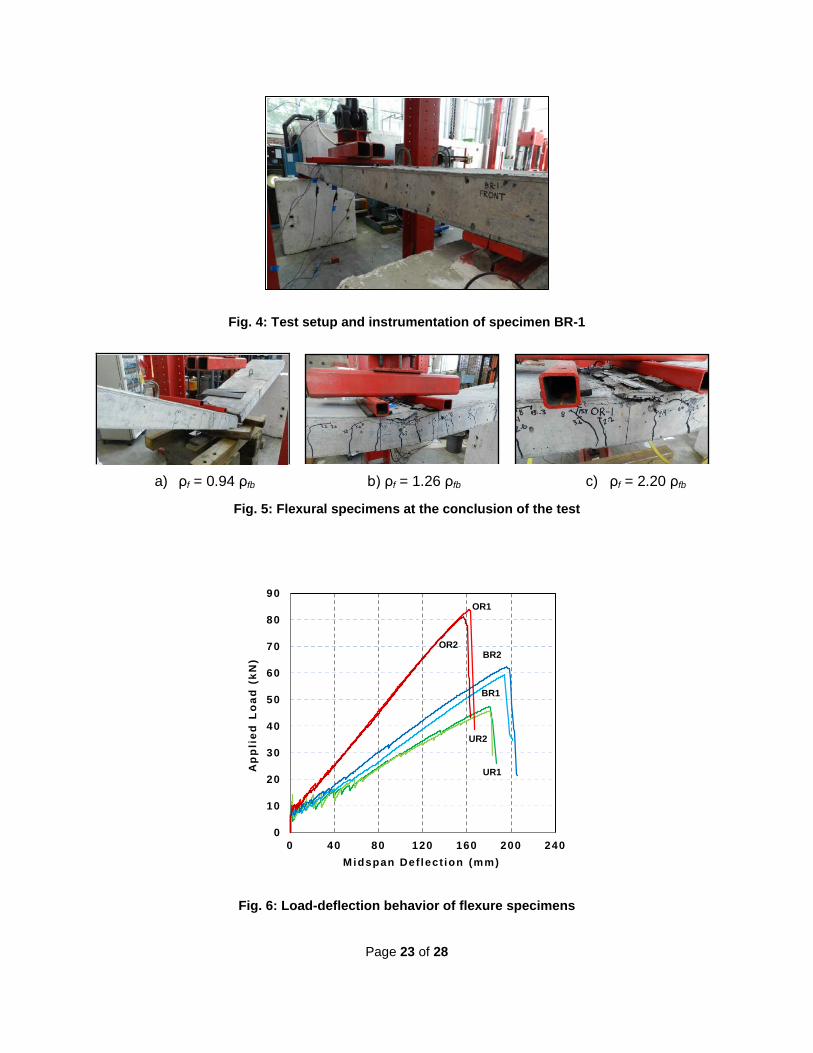
measure the concrete strain at the reinforcement level. Fig. 4 shows the test setup and the
instrumentation of typical specimen, BR-1.
5.2.1 Mode of Failure
The under-reinforced specimens (ρf = 0.94 ρfb) failed in in an abrupt manner due to the
complete rupture of all the BFRP bars as shown in Fig. 5(a). The test specimens with a
reinforcement ratio slightly higher than the balanced ratio (ρf = 1.26 ρfb) failed due to crushing of
concrete in the compression zone of the constant moment region as shown in Fig. 5(b). Partial
rupture of the BFRP bars within these two specimens was visibly evident at failure. The over-
reinforced specimens (ρf = 2.20 ρfb) failed in compression due to crushing of concrete on the top
Page 7 of 28
surface of the specimen in the constant moment region without any evidence of rupture of the
BFRP bars as shown Fig. 5(c).
5.2.2 Load-Deflection Behavior
The load-deflection behavior of the six test slabs is shown in Fig. 6. All specimens behaved
similarly up to first cracking. After cracking, the flexural stiffness was proportional to the BFRP
reinforcement ratio used in each category. The linear behavior of the load-deflection
relationship up to failure is due to the linear elastic nature of the BFRP bars.
The under-reinforced slabs had the least load carrying capacity with an average failure load of
46.3 kN and a corresponding deflection of 178 mm, which is slightly less than the slabs with a
reinforcement ratio slightly higher than the balanced ratio, due to the sudden rupture of the bars.
The slabs with a reinforcement ratio slightly higher than the balanced ratio had an average
failure load of 60.9 kN and corresponding deflection of 201 mm. The over-reinforced slabs failed
at the highest load of an average of 82.6 kN and a corresponding average deflection of 155 mm.
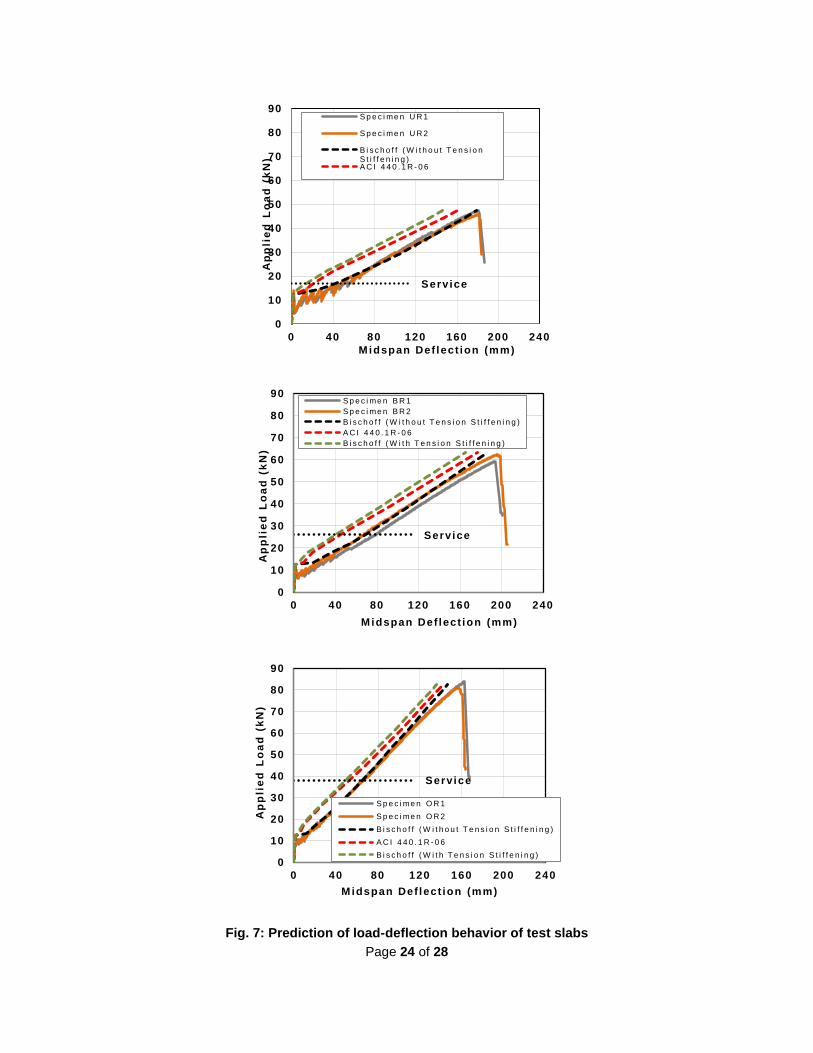
The load-deflection behavior of the test slabs was predicted using the equations proposed by
Bischoff and Gross (2013) with and without consideration of the tension stiffening [7], as well as
the equation recommended by ACI 440.1R-06. The predicted load-deflection behaviors of the
three different approached are compared to the measured behavior in Fig. 7 for the six tested
slabs with different reinforcement ratios. The Comparison clearly indicates that the equation
proposed by Bischoff and Gross (2013) without tension stiffening can accurately predict the
behavior up to failure. The equations recommended by ACI 440.1R-06 and Bischoff and Gross
(2013) with tension stiffening underestimate the deflection after cracking. The behavior of both
approaches highlights that the effect of tension stiffening of concrete is significantly reduced for
flexural members reinforced with BFRP bars due to their low modulus of elasticity.
Page 8 of 28
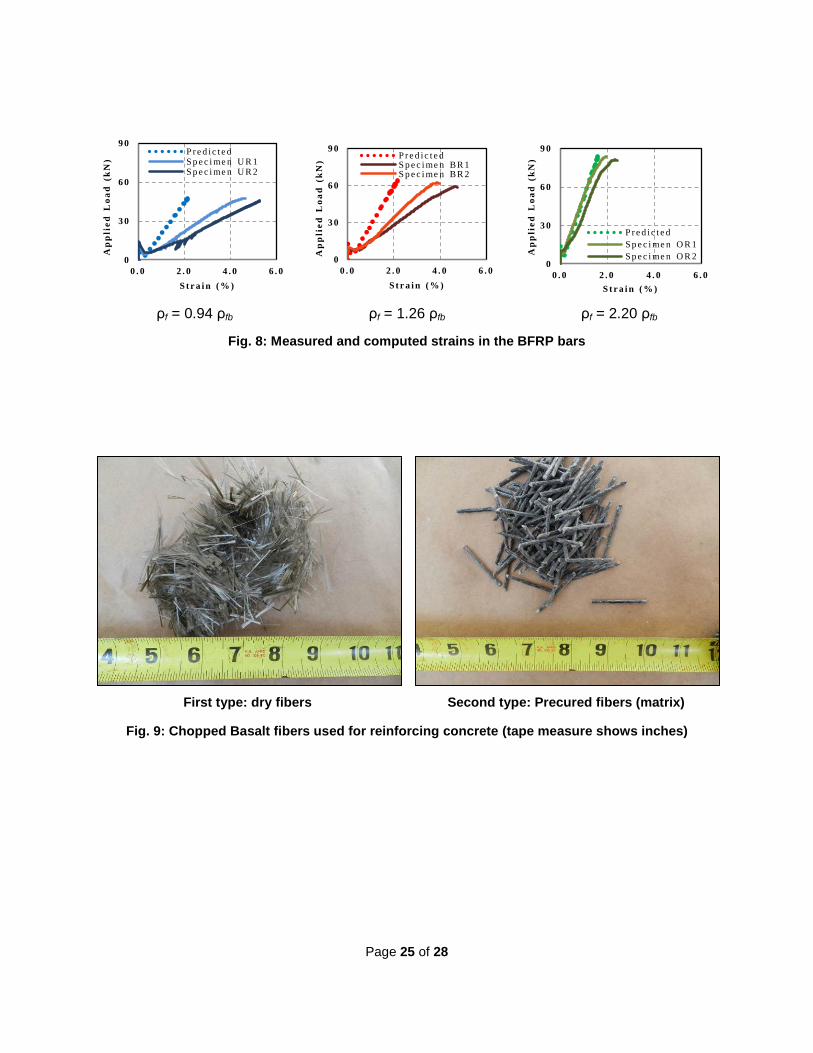
5.2.3 Measured Strain
The measured concrete strain at the level of the BFRP bars of the slabs with reinforcement ratio
of 0.94 ρfb and 1.26 ρfb were always higher than the strain of the bars at the same stress level
induced in the bars computed by sectional-analysis of the test slabs, as shown in Fig. 8. This
behavior reflects slippage of the BFRP bars for the slabs with reinforcement ratios equal to 0.94
ρfb and 1.26 ρfb due to the high stress demand of the bars at these low level of reinforcement.
The slip of the BFRP bars was verified by removing of the concrete cover and inspecting the
slabs. The performance of the over-reinforced slabs did not exhibit similar slip behavior. This
behavior highlights the necessity of designing BFRP-reinforced members to fail in compression
and with higher reinforcement ratio in comparison to the typical reinforcement ratios used for
steel.
6. Applicability of ACI 440.1R-06 Guidelines
6.1 Nominal Moment Capacity
Measured flexural capacities were compared to those predicted according to the ACI 440.1R-06
guidelines, as shown in Table 2. The nominal moment capacity was predicted using the
measured concrete compressive strength. Table 2 clearly indicates that ACI 440.1R-06 can
accurately predict the nominal moment capacity of concrete members reinforced with BFRP
bars having different reinforcement ratios.
6.2 Deflection at Service Level
The selected moment level used to compare the deflection at service load (Ms) was estimated
using the following equation:
𝑀𝑠 =∅
𝛼𝐿𝐿𝐿𝐿𝑀𝑛
Page 9 of 28
where Mn is the measured moment of the slab at failure. αLoad was equal to 1.33 based on a
dead-to-live load ratio of 2:1. According to ACI 440.1R-06, the strength reduction factor “Ф” is
0.65 for ρf ≥ 1.4ρfb and 0.55 for ρf ≤ 1.0ρfb. Therefore, estimated service moment for the three
categories of the test slabs were 0.41Mn, 0.46Mn, and 0.49Mn for reinforcement ratio of 0.94ρfb,
1.26 ρfb, and 2.20ρfb, respectively. The measured mid-span deflection at service load level, Δ,
was compared to that predicted according to ACI 440.1R-06 [4] for all test slabs as given in
Table 3.
Table 3 shows that the ACI 440.1R-06 equation significantly underestimates the deflection at
service load for members reinforced with BFRP reinforcement ratios less than or approximately
equal to the balanced ratio due to slippage of BFRP bars. However, the ACI 440.1R-06
predictions improve as the BFRP reinforcement ratio is increased as the ratio of measured to
predicted deflection reduced from 2.19 to 1.22. This is due to the reduction of stresses in the
BFRP bars and therefore, possible elimination of slippage of the bars. Table 3 also indicates
that the measured deflection-span ratio (L/Δ) at service load level significantly exceeds the
permissible deflection limit under total service load as recommended by ACI 318-11 [8]. This
indicates that the design of flexural members reinforced with BFRP may also be controlled by
serviceability requirements, due to the low modulus of elasticity of the bars.
SECOND STUDY: BASALT FIBER-REINFORCED CONCRETE (BFRC)
7. Background
Ramakrishnan et. Al. (1998) [1] investigated the use of short basalt fibers to enhance the
material properties of concrete. The study concluded that basalt fibers can be easily mixed with
concrete without any balling or segregation. In addition, there was also a noticeable increase in
the post-cracking energy absorption capacity and increase of the impact resistance.
Page 10 of 28
Ma et al. (2011) [9] conducted an experimental program to investigate the mechanical
properties of concrete with the addition of basalt fibers that were pre-soaked in epoxy. Three
different pre-soaked basalt fiber lengths (10 mm, 20 mm and 30 mm) and three different fiber
dosages (3,000 g/m3, 5,000 g/m3 and 7,000 g/m3) were examined in this study. Test results
showed that as the basalt fiber dosage and fiber length increased the measured slump
decreased. According to this study, the presence of the pre-soaked basalt fibers did not
significantly affect the compressive strength of the concrete, however, use of fibers increased
the concrete flexural modulus. This study concluded that adding 30 mm long basalt fibers to
concrete at a dosage range of 3,000 g/m3 to 5,000 g/m3 resulted in improvement of the
mechanical properties with an acceptable workability.
Borhan (2013) [10] studied the compressive and splitting tensile strengths of BFRC with fiber
volume fractions ranging from 0.1 to 0.5 percent. Test results indicated that increasing the
basalt fiber content increased the splitting tensile strength of the concrete and did not affect the
compressive strength, up to volume fractions of 0.3 percent. Decreased compressive and
splitting tensile strengths were reported for fiber volume content equal to 0.5 percent. This
study also reported a reduction in the concrete slump as the basalt fiber volume content was
increased.
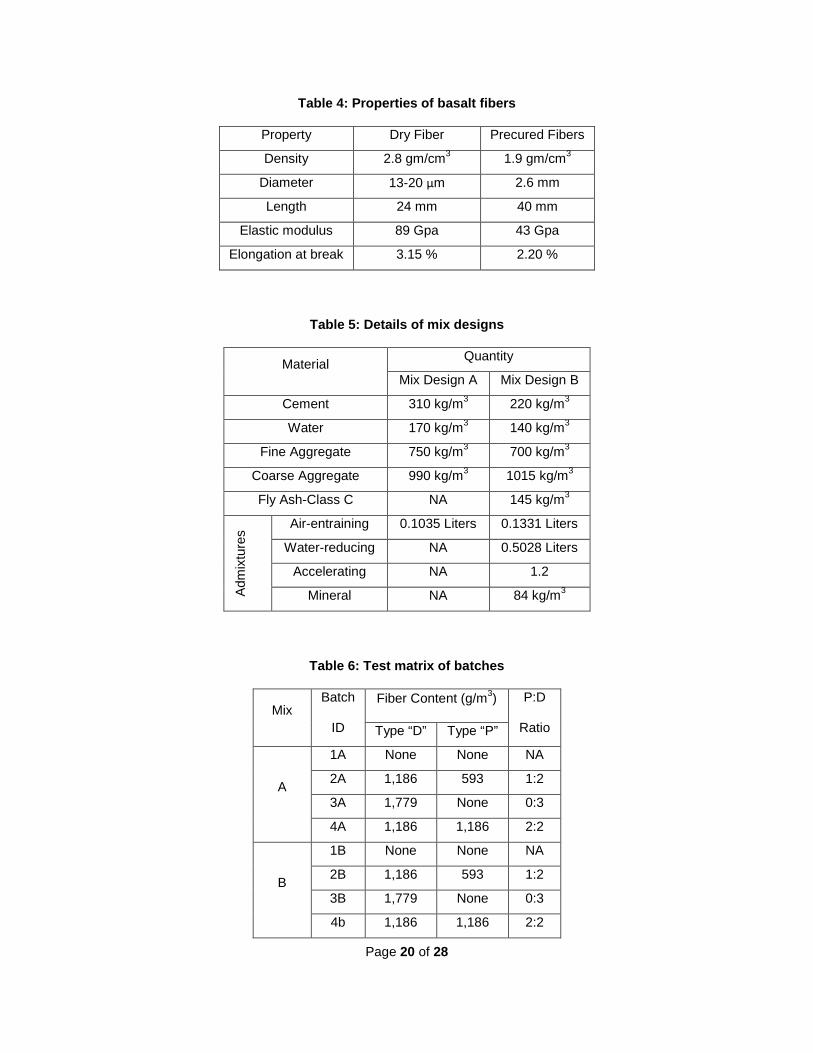
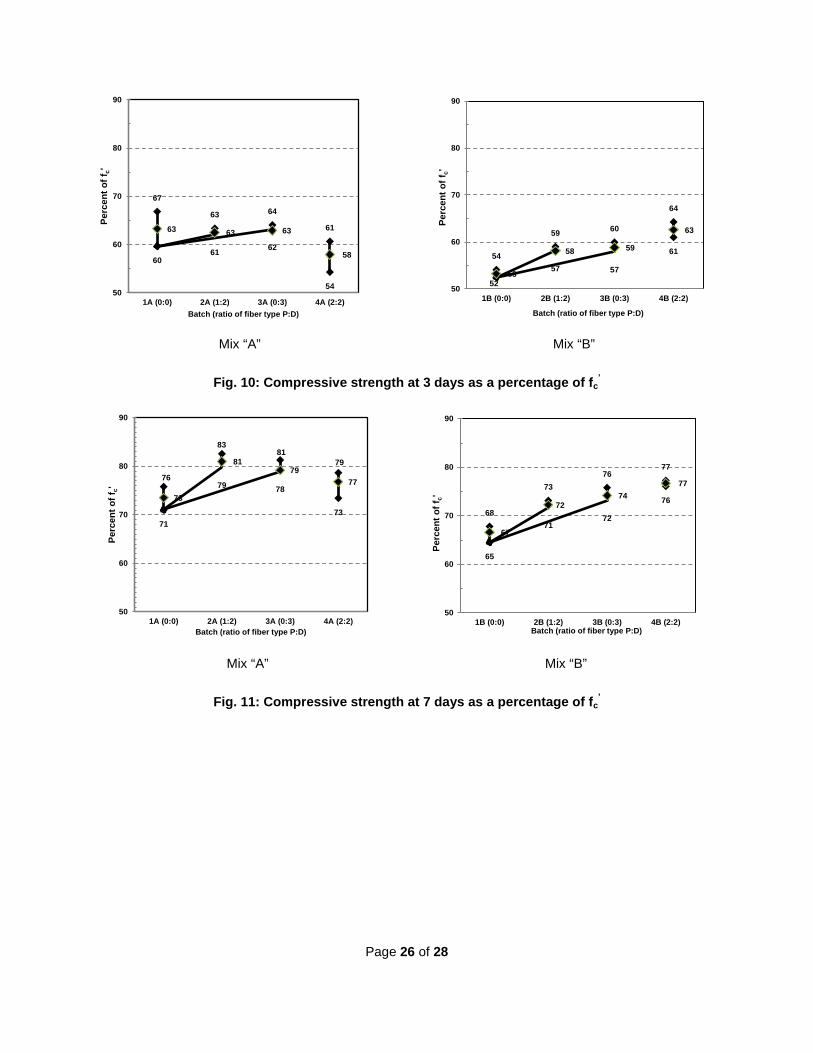
8. Properties of Basalt Fibers
Two different short basalt fiber products were used in this study. The first type consisted of
chopped dry fibers, while the second type was produced by chopping precured fibers as shown
in Fig. 9. The first type of fiber is denoted as “D” for dry and the second type as “P” for precured.
The properties of the two types of fibers are given in Table 4.
Page 11 of 28
9. Concrete Mixes and Specimens
Two concrete mixes were investigated in this study. Mix “A” was a standard concrete mix with a
target compressive strength at 28 days of 20.7 MPa. Mix “B” had the same target compressive
strength, however contained fly ash and admixtures and therefore, less cement content. Details
of the two mixes are given in Table 5.
For each mix, different contents of basalt fibers were used. The test matrix of the different
batches is given in Table 6. Batches “1A” and “1B” are control batches without any fibers. The
two different types of fiber were used together in different ratios. In order to produce uniform
batches, dry mixing of the constituents was performed prior to adding the water until blending of
the constituents was evident. Afterwards, the water containing all liquid admixtures was
gradually added and the concrete was allowed to mix until a uniform consistency was achieved
in a reasonable time. Workability of all batches for mix “A” was higher than that of mix “B”,
despite the use of admixtures in mix “B”. This could be attributed to the high water/cement ratio
used in mix “A”, which was 0.55 compared to 0.38 used for mix “B”.
Concrete cylinders of 102x204 mm and prisms of 152x152x508 mm were cast from each of the
concrete batches. Neither rodding nor internal vibration was performed during the casting to
avoid the disturbance of the distribution of the basalt fibers. However, the overfilled molds were
vibrated using a vibration table until the concrete was adequately consolidated. The casted
molds remained inside the laboratory at a constant ambient temperature of 22 +/- 2 οC and
relative humidity of 70 +/- 5%. The cylinders and the prisms were de-molded 24 hours after
casting and cured by covering them with continuously wet burlap and plastic sheets to entrain
the moisture until the designated test date.
Page 12 of 28
10. Test Results and Discussion
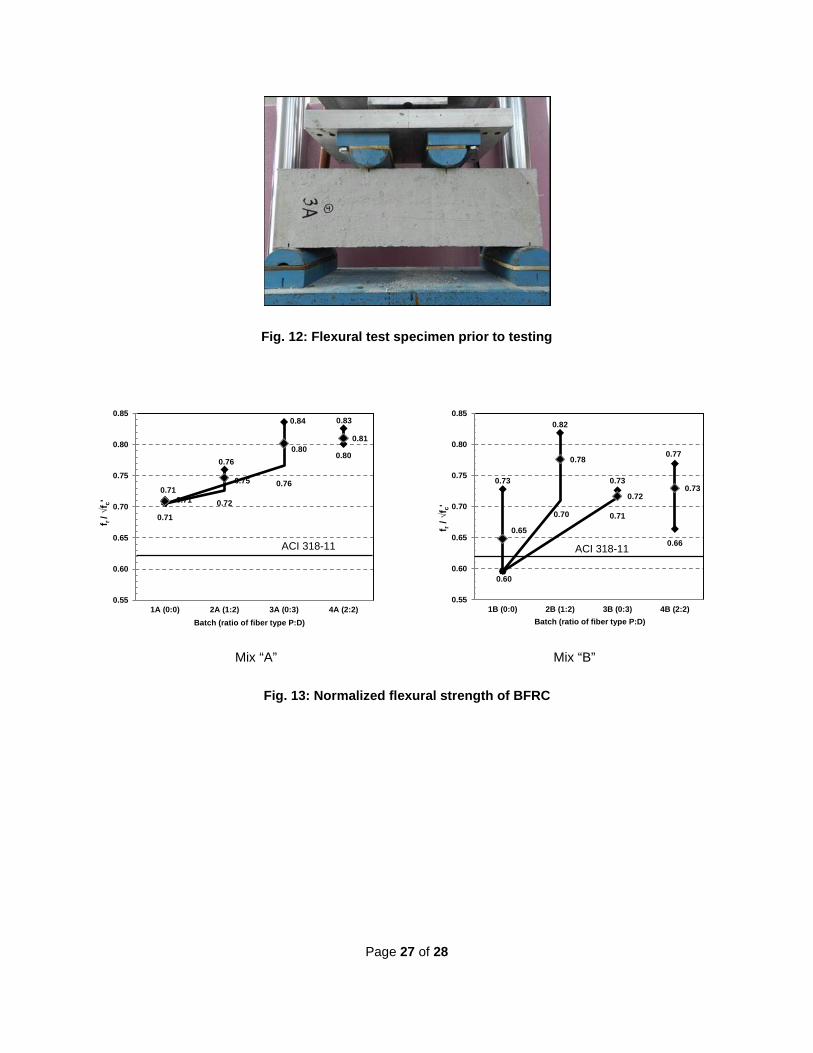
10.1 Compressive Strength
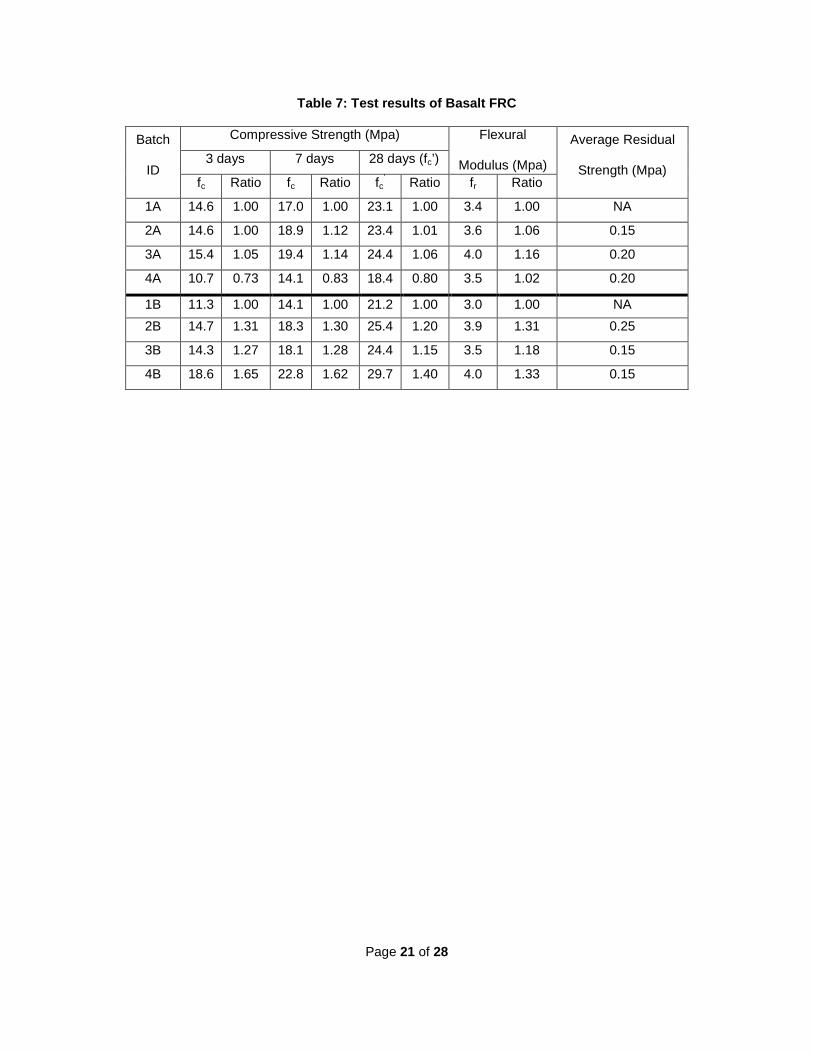
The compressive strength of each batch was measured at 3, 7 and 28 days in accordance with
ASTM C39 [11]. Average measured compressive strengths, fc, at different ages for the two
mixes with different fiber content are given in Table 7. The reported strength at ages of 3 and 7
days is an average of three individual tests, while the 28-day reported strength is an average of
six individual tests. The ratios of the measured strength of the different batches to the strength
of the control batches 1A and 1B are also given in Table 7.
The early compressive strength at ages of 3 and 7 days of mixes “A” and “B” as percent of the
28-day strength (fc’) are graphically shown in Fig. 10 and Fig. 11, respectively. The early
strength of mix “A” did not exhibit an increase due to the use of the basalt fibers. However, there
was a trend of increase of the early compressive strength for mix “B” reflected by a ratio up to
65% and 62% for batch “4B” at 3 and 7 days, respectively.
The measured compressive strength for all concrete batches exceeded the target 28-day
compressive strength of 20.7 MPa, with the exception of batch “4A”. Test results indicated that
the concrete compressive strength at 28 days (fc’) of mix “A” was not significantly affected by the
use of the basalt fibers with a maximum increase of 6% for batch “3A”. However, the effect of
the basalt fibers on fc’ was evident for mix “B” in comparison to mix “A”. The 28-day compressive
strength of batch “4B” was increased by 40% in comparison to the control batch “1B”. The
increase of fc’ of mix “B” is also proportional to the high fibers content used of both types of
chopped fibers.
Test results indicate that adding basalt fibers to concrete may slightly increase the 28-day
compressive strength (fc’) of concrete containing fly ash and admixtures with low water-cement
Page 13 of 28
ratios. In addition, test results suggest that the early strength of concrete containing fly ash and
admixtures may be significantly increased by using basalt fibers.
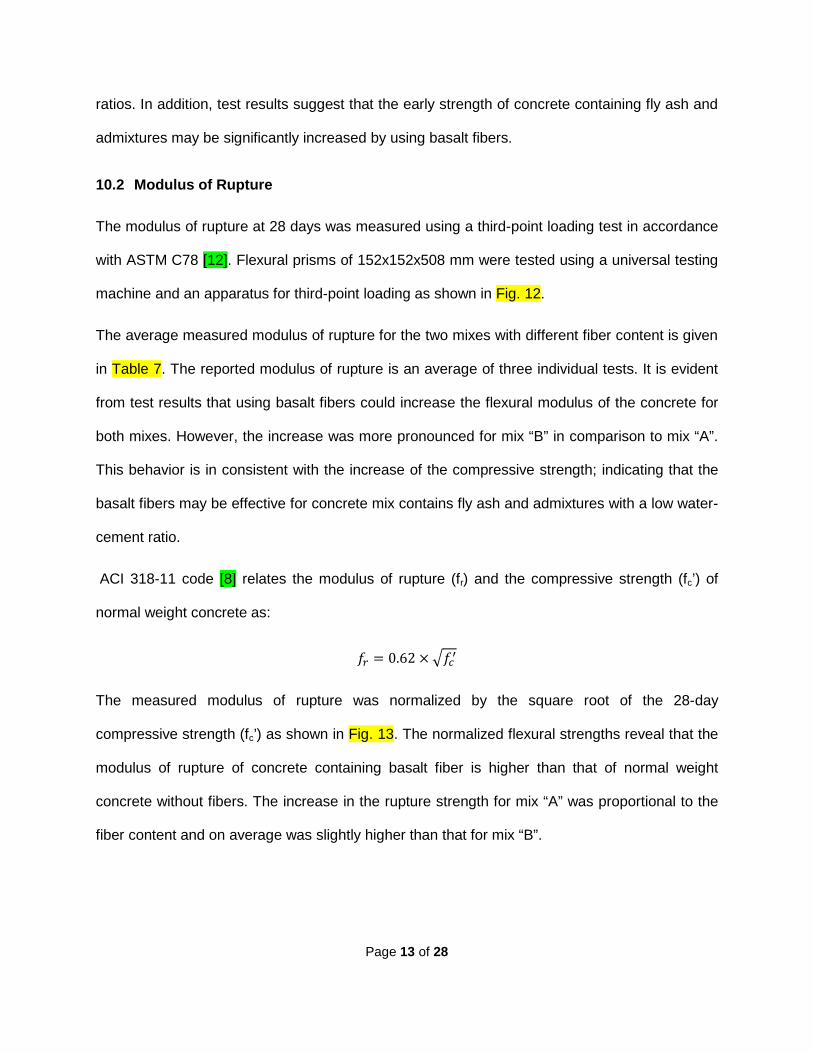
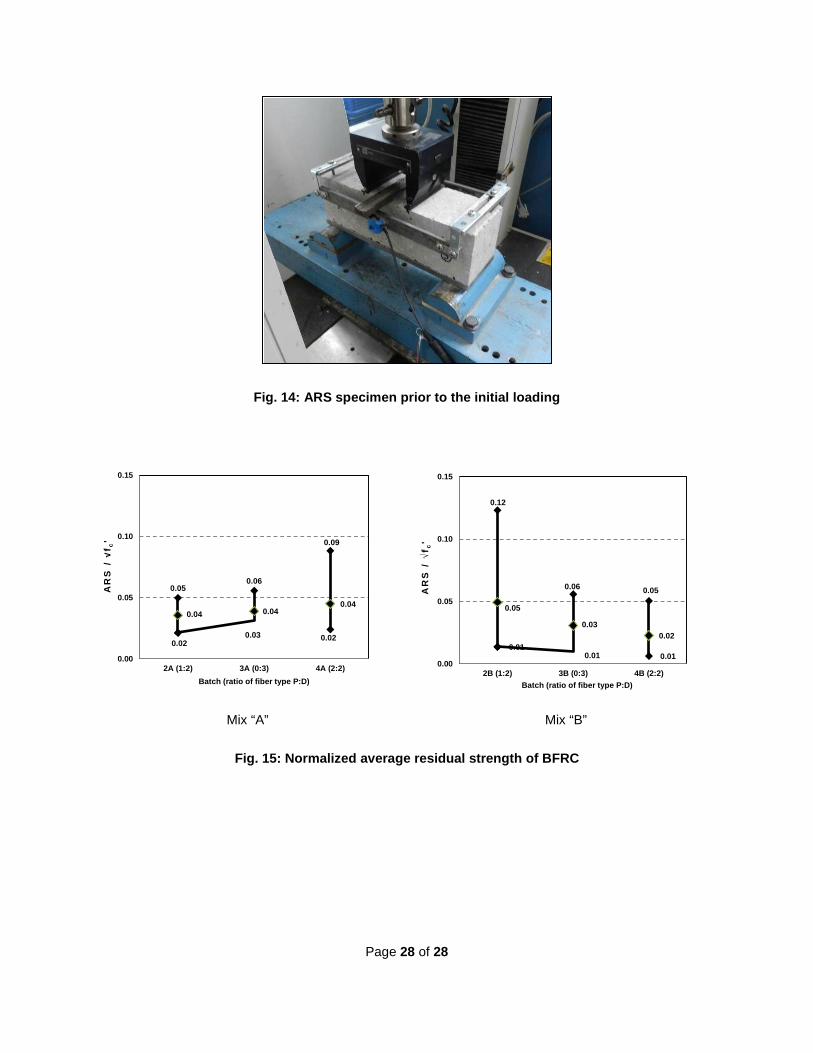
10.2 Modulus of Rupture
The modulus of rupture at 28 days was measured using a third-point loading test in accordance
with ASTM C78 [12]. Flexural prisms of 152x152x508 mm were tested using a universal testing
machine and an apparatus for third-point loading as shown in Fig. 12.
The average measured modulus of rupture for the two mixes with different fiber content is given
in Table 7. The reported modulus of rupture is an average of three individual tests. It is evident
from test results that using basalt fibers could increase the flexural modulus of the concrete for
both mixes. However, the increase was more pronounced for mix “B” in comparison to mix “A”.
This behavior is in consistent with the increase of the compressive strength; indicating that the
basalt fibers may be effective for concrete mix contains fly ash and admixtures with a low water-
cement ratio.
ACI 318-11 code [8] relates the modulus of rupture (fr) and the compressive strength (fc’) of
normal weight concrete as:
𝑓𝑟 = 0.62 ×�𝑓𝑐′
The measured modulus of rupture was normalized by the square root of the 28-day
compressive strength (fc’) as shown in Fig. 13. The normalized flexural strengths reveal that the
modulus of rupture of concrete containing basalt fiber is higher than that of normal weight
concrete without fibers. The increase in the rupture strength for mix “A” was proportional to the
fiber content and on average was slightly higher than that for mix “B”.
Page 14 of 28
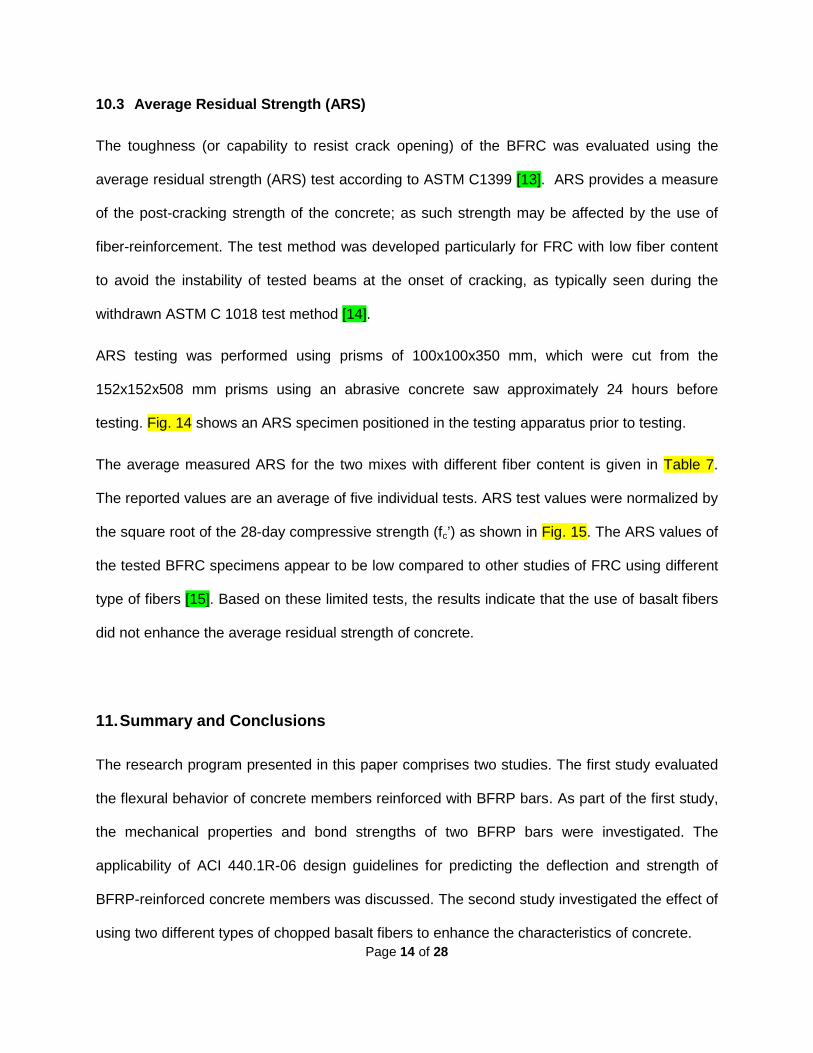
10.3 Average Residual Strength (ARS)
The toughness (or capability to resist crack opening) of the BFRC was evaluated using the
average residual strength (ARS) test according to ASTM C1399 [13]. ARS provides a measure
of the post-cracking strength of the concrete; as such strength may be affected by the use of
fiber-reinforcement. The test method was developed particularly for FRC with low fiber content
to avoid the instability of tested beams at the onset of cracking, as typically seen during the
withdrawn ASTM C 1018 test method [14].
ARS testing was performed using prisms of 100x100x350 mm, which were cut from the
152x152x508 mm prisms using an abrasive concrete saw approximately 24 hours before
testing. Fig. 14 shows an ARS specimen positioned in the testing apparatus prior to testing.
The average measured ARS for the two mixes with different fiber content is given in Table 7.
The reported values are an average of five individual tests. ARS test values were normalized by
the square root of the 28-day compressive strength (fc’) as shown in Fig. 15. The ARS values of
the tested BFRC specimens appear to be low compared to other studies of FRC using different
type of fibers [15]. Based on these limited tests, the results indicate that the use of basalt fibers
did not enhance the average residual strength of concrete.
11. Summary and Conclusions
The research program presented in this paper comprises two studies. The first study evaluated
the flexural behavior of concrete members reinforced with BFRP bars. As part of the first study,
the mechanical properties and bond strengths of two BFRP bars were investigated. The
applicability of ACI 440.1R-06 design guidelines for predicting the deflection and strength of
BFRP-reinforced concrete members was discussed. The second study investigated the effect of
using two different types of chopped basalt fibers to enhance the characteristics of concrete.
Page 15 of 28
Based on the test results, the following conclusion can be made:
1. The ribbed and dented BFRP included in this study had an average ultimate tensile strength
of approximately 1,000 MPa with an average modulus of elasticity of 45 GPa. The. The
bond strength of both BFRP bars is essentially the same and the development length is
approximately equivalent to 32 times the bar diameter.
2. Slippage of the BFRP bars could occur for low reinforcement ratio in the range of the
balanced ratio. Slippage of the bars can be avoided by using high reinforcement ratio at
least double the balanced reinforcement ratio. This behavior can be attributed to the high
stress demand on the bars of specimens with low reinforcement ratios. This behavior also
highlights the necessity for designing BFRP-reinforced flexural members to fail in
compression.
3. Design of flexural members reinforced with BFRP bars may be controlled by serviceability
requirements due to the low modulus of elasticity of the bars.
4. ACI 440.1R-06 accurately predicts the nominal moment capacity of flexural members
reinforced with BFRP bars. ACI 440.1R-06 significantly under predicts the deflection at
service load for under-reinforced and balanced reinforcement ratios. However, the ACI
440.1R-06 deflection prediction improves as the BFRP reinforcement ratio is increased.
5. The equation proposed by Bischoff and Gross (2013) without tension stiffening can
accurately predict the deflection of flexural members reinforced with BFRP bars up to failure.
The effect of tension stiffening of the concrete is negligible for flexural members reinforced
with BFRP bars due to their low modulus of elasticity.
6. Using basalt fibers slightly increased the 28-day compressive strength (fc’) of concrete
containing fly ash and admixtures with a low water-cement ratio. In addition, the early
compressive strength of concrete containing fly ash and admixtures may significantly
increase due to the use of basalt fibers.
Page 16 of 28
7. Use of basalt fibers resulted in an increase of the modulus of rupture of the concrete.
However, the increase in the flexural strength was more pronounced for concrete mix
containing fly ash, admixtures, and with low water-cement ratio.
12. Acknowledgments
The authors would like to acknowledge the Florida Department of Transportation for funding this
project and the National Science Foundation Center of Integration of Composites into
Infrastructure (CICI) at NCSU, Grant No. 2009-1644. Thanks are also due to the staff of the
Constructed Facilities Laboratory of NCSU for their help throughout the experimental program.
13. References
[1] Ramakrishnan, V., Tolmare, Neeraj S., and Brik, Vladimir B. Performance Evaluation of 3-D
Basalt Fiber Reinforced Concrete & Basalt Rod Reinforced Concrete. Final Report for
Highway IDEA Project 45, Transportation Research Board. 1998; 79.
[2] Patnaik, A., Adhikari, S., Bani-Bayat, P., and Robinson, P. Flexural Performance of Concrete
Beams Reinforced with Basalt FRP Bars. 3rd fib. International Congress, Washington D.C.
May 2010: 3821-3833.
[3] Ovitigala, T., Issa, M.A. Flexural Behavior of Concrete Beams Reinforced with Basalt Fiber
Reinforcement Polymer (BFRP) Bars. 11th International Symposium on Fiber Reinforced
Polymer for Reinforced Concrete Structures, Guimarães, Portugal. June 2013: 249-260.
[4] ACI 440.1R-06. Guide for the Design and Construction of Structural Concrete Reinforced
with FRP Bars. ACI Committee 440, American Concrete Institute, Farmington Hills, MI, USA.
2006: 44.
Page 17 of 28
[5] ASTM D7205/D7205M-06 (Reapproved 2011). Standard Test Method for Tensile Properties
of Fiber Reinforced Polymer Matrix Composite Bars. ASTM International, West
Conshohocken, PA, USA. 2011; 13.
[6] ACI 440.3R-12. Guide Test Methods for Fiber-Reinforced Polymer (FRP) Composite for
Reinforcing or Strengthening Concrete and Masonry Structures. ACI Committee 440,
American Concrete Institute, Farmington Hills, MI, USA. 2012; 40.
[7] Bischoff, Peter H. and Cross, Shwan P. Equivalent Moment of Inertia Based on Integration of
Curvature. ASCE-J of Composites for Constr. 2011; 15(3):263-273.
[8] ACI 318-11. Building Code Requirements for Structural Concrete and Commentary. ACI
Committee 318, American Concrete Institute, Farmington Hills, MI, USA. 2011; 503.
[9] Ma, Jianxun, Xuemei Qiu, Litao Cheng, and Yunlong Wang. 2011. “Experimental Research
on the Fundamental Mechanical Properties of Presoaked Basalt Fiber Concrete.” In
Advances in FRP Composites in Civil Engineering, edited by Lieping Ye, Peng Feng, and
Qingrui Yue, 85–88. Springer Berlin Heidelberg.
http://link.springer.com/chapter/10.1007/978-3-642-17487-2_16.
[10] Borhan, Tumadhir M. 2013. “Thermal and Mechanical Properties of Basalt Fibre Reinforced
Concrete.” Proceedings of World Academy of Science, Engineering and Technology (76):
313.
[11] ASTM C39/C39M-12a. Standard Test Method for Compressive Strength of Cylindrical
Concrete Specimens. ASTM International, West Conshohocken, PA, USA. 2012; 7.
[12] ASTM C78/C78M-10. Standard Test Method for Flexural Strength of Concrete (Using
Simple Beams with Third-Point Loading). ASTM International, West Conshohocken, PA,
USA. 2010; 4.
Page 18 of 28
[13] ASTM C1399/C1399M-10. Standard Test Method for Obtaining Average Residual-Strength
of Fiber-Reinforced Concrete. ASTM International, West Conshohocken, PA, USA. 2010; 6.
[14] Banthia, N. and Trottier, J.F. Test Methods for Flexural Toughness Characterization of
Fiber-Reinforced Concrete: Some Concerns and a Proposition. ACI Materials J, 1995; 92(2):
48-57.
[15] Jean-Francois Trottier, Michael Mahoney, and Dean Forgeron. Can Synthetic Fibers
Replace Welded-Wire Fabric in Slabs-on-Grade. Concrete International, 2002; 24(11): 59-
68.
Page 19 of 28
Table 1: Summary of test results of bond strength study
Bonded
Length (mm) Failure Mode
Maximum Stress
(MPa)
Concrete Strength
(MPa)
R-380 Slip/Bar Rupture 1048 53.6
R-610 Bar Rupture 903 48.6
R-1015 Bar Rupture 1000 48.6
R-1270 Bar Rupture 814 NA
D-380 Bar Rupture 910 52.1 D-610 Bar Rupture 807 52.1
D-1215 Bar Rupture 889 51.4
D-1270 Bar Rupture 869 51.4
Table 2: Predictions of nominal moment according to ACI 440.1R-06 (kN-m)
Slab ID Rft. Ratio
(ρf)
Measured ACI 440
Measured/
ACI Mn AVG
UR-1 0.94 ρfb
39.2 38.5 39.0 0.99 UR-2 37.8
BR-1 1.26 ρfb
48.2 49.4 51.4 0.96 BR-2 50.5
OR-1 2.20 ρfb
67.0 66.0 65.9 1.00 OR-2 64.9
Table 3: Predictions of deflection at service load according to ACI 440.1R-06 (kN-m and mm)
Slab
ID
Rft. Ratio
(ρf)
Service Moment Experimental ACI 440
Ms Ms/Mcr Δ ΔAVG L/Δ Δ ΔAVG Ratio
UR-1 0.94 ρfb 16.2 1.30 51 46 73 22 21 2.19
UR-2 15.6 1.25 40 20
BR-1 1.26 ρfb 22.3 1.78 75 72 47 41 44 1.64
BR-2 23.3 1.86 69 47
OR-1 2.20 ρfb 32.6 2.61 67 66 51 55 54 1.22
OR-2 31.6 2.53 65 52
Page 20 of 28
Table 4: Properties of basalt fibers
Property Dry Fiber Precured Fibers
Density 2.8 gm/cm3 1.9 gm/cm3
Diameter 13-20 μm 2.6 mm
Length 24 mm 40 mm
Elastic modulus 89 Gpa 43 Gpa
Elongation at break 3.15 % 2.20 %
Table 5: Details of mix designs
Material Quantity
Mix Design A Mix Design B
Cement 310 kg/m3 220 kg/m3
Water 170 kg/m3 140 kg/m3
Fine Aggregate 750 kg/m3 700 kg/m3
Coarse Aggregate 990 kg/m3 1015 kg/m3
Fly Ash-Class C NA 145 kg/m3
Adm
ixtu
res
Air-entraining 0.1035 Liters 0.1331 Liters
Water-reducing NA 0.5028 Liters
Accelerating NA 1.2
Mineral NA 84 kg/m3
Table 6: Test matrix of batches
Mix Batch
ID
Fiber Content (g/m3) P:D
Ratio Type “D” Type “P”
A
1A None None NA
2A 1,186 593 1:2
3A 1,779 None 0:3
4A 1,186 1,186 2:2
B
1B None None NA
2B 1,186 593 1:2
3B 1,779 None 0:3
4b 1,186 1,186 2:2
Page 21 of 28
Table 7: Test results of Basalt FRC
Batch
ID
Compressive Strength (Mpa) Flexural
Modulus (Mpa)
Average Residual
Strength (Mpa) 3 days 7 days 28 days (fc’)
fc Ratio fc Ratio fc’ Ratio fr Ratio
1A 14.6 1.00 17.0 1.00 23.1 1.00 3.4 1.00 NA
2A 14.6 1.00 18.9 1.12 23.4 1.01 3.6 1.06 0.15
3A 15.4 1.05 19.4 1.14 24.4 1.06 4.0 1.16 0.20
4A 10.7 0.73 14.1 0.83 18.4 0.80 3.5 1.02 0.20
1B 11.3 1.00 14.1 1.00 21.2
1.00 3.0 1.00 NA 2B 14.7 1.31 18.3 1.30 25.4 1.20 3.9 1.31 0.25
3B 14.3 1.27 18.1 1.28 24.4 1.15 3.5 1.18 0.15
4B 18.6 1.65 22.8 1.62 29.7 1.40 4.0 1.33 0.15
Page 22 of 28
Fig. 1: Typical stress-strain relationship of BFRP bars
Fig. 2: Details of beam-end specimens (1 in. = 25.4 mm)
Fig. 3: Schematic of bond strength test setup
Ribbed Bars
Dented Bars
0
200
400
600
800
1000
1200
0 1 2 3
Stre
ss (M
Pa)
Strain (%)
102 mm610 mm
BONDED (LENGTH VARIES)
DEBONDED
PVC BOND BREAKERS381 mm
229 mm
BFRP BARSTEEL GRIP
1524 mm
Page 23 of 28
Fig. 4: Test setup and instrumentation of specimen BR-1
a) ρf = 0.94 ρfb b) ρf = 1.26 ρfb c) ρf = 2.20 ρfb
Fig. 5: Flexural specimens at the conclusion of the test
Fig. 6: Load-deflection behavior of flexure specimens
0
10
20
30
40
50
60
70
80
90
0 40 80 120 160 200 240
Ap
pli
ed L
oad
(kN
)
M idspan Def lect ion (mm)
OR1
OR2 BR2
BR1
UR1
UR2
Page 24 of 28
Fig. 7: Prediction of load-deflection behavior of test slabs
Service
0
10
20
30
40
50
60
70
80
90
0 40 80 120 160 200 240
Ap
pli
ed L
oad
(kN
)
M idspan Def lect ion (mm)
S p e c i me n U R 1
S p e c i me n U R 2
B i s c h o f f ( W i t h o u t T e n s i o n S t i f f e n i n g ) A C I 4 4 0 . 1 R - 0 6
Service
0
10
20
30
40
50
60
70
80
90
0 40 80 120 160 200 240
Ap
pli
ed L
oad
(kN
)
M idspan Def lect ion (mm)
S p e c i me n B R 1 S p e c i me n B R 2 B i s c h o f f ( W i t h o u t T e n s i o n S t i f f e n i n g ) A C I 4 4 0 . 1 R - 0 6 B i s c h o f f ( W i t h T e n s i o n S t i f f e n i n g )
Service
0
10
20
30
40
50
60
70
80
90
0 40 80 120 160 200 240
Ap
pli
ed L
oad
(kN
)
M idspan Def lect ion (mm)
S p e c i me n O R 1 S p e c i me n O R 2 B i s c h o f f ( W i t h o u t T e n s i o n S t i f f e n i n g ) A C I 4 4 0 . 1 R - 0 6 B i s c h o f f ( W i t h T e n s i o n S t i f f e n i n g )
Page 25 of 28
ρf = 0.94 ρfb ρf = 1.26 ρfb ρf = 2.20 ρfb
Fig. 8: Measured and computed strains in the BFRP bars
First type: dry fibers Second type: Precured fibers (matrix)
Fig. 9: Chopped Basalt fibers used for reinforcing concrete (tape measure shows inches)
0
3 0
6 0
9 0
0 . 0 2 . 0 4 . 0 6 . 0
Ap
pli
ed L
oad
(k
N)
S t r a i n ( % )
P r e d ic t e d S p e c i me n U R 1 S p e c i me n U R 2
0
3 0
6 0
9 0
0 . 0 2 . 0 4 . 0 6 . 0
Ap
pli
ed L
oad
(k
N)
S t r a i n ( % )
P r e d ic t e d S p e c i me n B R 1 S p e c i me n B R 2
0
3 0
6 0
9 0
0 . 0 2 . 0 4 . 0 6 . 0
Ap
pli
ed L
oad
(k
N)
S t r a i n ( % )
P r e d ic t e d S p e c i me n O R 1 S p e c i me n O R 2
Page 26 of 28
Mix “A” Mix “B”
Fig. 10: Compressive strength at 3 days as a percentage of fc’
Mix “A” Mix “B”
Fig. 11: Compressive strength at 7 days as a percentage of fc’
67
63 64
61
60 61 62
54
63 63 63
58
50
60
70
80
90
1A (0:0) 2A (1:2) 3A (0:3) 4A (2:2)
Perc
ent o
f fc'
Batch (ratio of fiber type P:D)
54
59 60
64
52
57 57
61
53
58 59
63
50
60
70
80
90
1B (0:0) 2B (1:2) 3B (0:3) 4B (2:2)
Perc
ent o
f fc'
Batch (ratio of fiber type P:D)
76
83 81
79
71
79 78
73
73
81 79
77
50
60
70
80
90
1A (0:0) 2A (1:2) 3A (0:3) 4A (2:2)
Perc
ent o
f fc'
Batch (ratio of fiber type P:D)
68
73 76
77
65
71 72
76
67
72 74
77
50
60
70
80
90
1B (0:0) 2B (1:2) 3B (0:3) 4B (2:2)
Perc
ent o
f fc'
Batch (ratio of fiber type P:D)
Page 27 of 28
Fig. 12: Flexural test specimen prior to testing
Mix “A” Mix “B”
Fig. 13: Normalized flexural strength of BFRC
0.71
0.76
0.84 0.83
0.71
0.72
0.76
0.80
0.71 0.75
0.80 0.81
0.55
0.60
0.65
0.70
0.75
0.80
0.85
1A (0:0) 2A (1:2) 3A (0:3) 4A (2:2)
f r / √f c
'
Batch (ratio of fiber type P:D)
0.73
0.82
0.73
0.77
0.60
0.70 0.71
0.66 0.65
0.78
0.72 0.73
0.55
0.60
0.65
0.70
0.75
0.80
0.85
1B (0:0) 2B (1:2) 3B (0:3) 4B (2:2)
f r / √f c
'
Batch (ratio of fiber type P:D)
ACI 318-11 ACI 318-11
Page 28 of 28
Fig. 14: ARS specimen prior to the initial loading
Mix “A” Mix “B”
Fig. 15: Normalized average residual strength of BFRC
0.05 0.06
0.09
0.02 0.03 0.02
0.04 0.04 0.04
0.00
0.05
0.10
0.15
2A (1:2) 3A (0:3) 4A (2:2)
AR
S /
√f c
'
Batch (ratio of fiber type P:D)
0.12
0.06 0.05
0.01 0.01 0.01
0.05
0.03 0.02
0.00
0.05
0.10
0.15
2B (1:2) 3B (0:3) 4B (2:2)
AR
S /
√f c
'
Batch (ratio of fiber type P:D)