usc annenberg strategic public relations center 2002 pr generally accepted practices (gap) study...
TRANSCRIPT

The Strategic Public RelationsThe Strategic Public RelationsCenterCenter
We recommend you download the
presentation on our web site to
follow this web cast.
For more information email [email protected]
Presented via Web CastNovember 19, 2002
USC Annenberg USC Annenberg Strategic Public Relations CenterStrategic Public Relations Center
2002 PR Generally Accepted 2002 PR Generally Accepted Practices (GAP) StudyPractices (GAP) Study

SPRC STAFFSPRC STAFF
Ian MitroffJerry SwerlingJennifer Floto
Murat Alpaslan Greg Bishop
Special Thanks ToKathy Cripps, CPRF

AgendaAgenda About the SPRC
▪ History
▪ Mission
▪ Goals
▪ Research Agenda
2002 GAP Study▪ Goals
▪ Summary of Key Findings
▪ Emerging Best Practices
Final Thoughts - The Schizophrenic Profession
SPRC HISTORYSPRC HISTORY
Conceived one year ago Launched Spring, 2002 Initial partners
▪ AT&T▪ Avery Dennison▪ Council of PR Firms▪ GM▪ Raytheon▪ Weber Shandwick▪ Lohan Media/Leonard Sands
SPRC MISSIONSPRC MISSION Dramatically advance the study, practice, and
value of PR, through applied research done in partnership with others, by: ▪ Demonstrating the value of PR through
quantification ▪ Maximizing recognition of that value▪ Helping to define the evolving role of PR ▪ Elevating the skills of practitioners▪ Developing the optimal PR curricula
SPRC GOALSSPRC GOALS
1. PR Laboratory/Think Tank
2. Elevate the importance of evaluation (outcomes)
3. Identify best practices and build database Evaluation Organization Budgeting Program planning
SPRC GOALSSPRC GOALS
4. Provide rationale for an expanded, better integrated role
5. Bridge the gap between academia & profession
6. Increase the prestige of the PR profession & professionals
7. Integrate research into curriculum
8. Train PR leaders
SPRC PRELIMINARY SPRC PRELIMINARY RESEARCH AGENDA RESEARCH AGENDA
1. Generally Accepted Practices Study (Complete)
2. Post-9/11 Crisis Management Study (Complete)
3. Evaluation Best Practices, Consumer Products Category: “Hot Spots” Field Interview Study (Proposed, Q4/02 – Q2/03)
4. Evaluation Best Practices, Consumer Products Category: Broad Application Feasibility Survey (Proposed, Q2/03 – Q3/03)
5. GAP Follow-Up Study (Proposed, Q3/03)
USC SPRC/CPRF USC SPRC/CPRF GAP StudyGAP Study
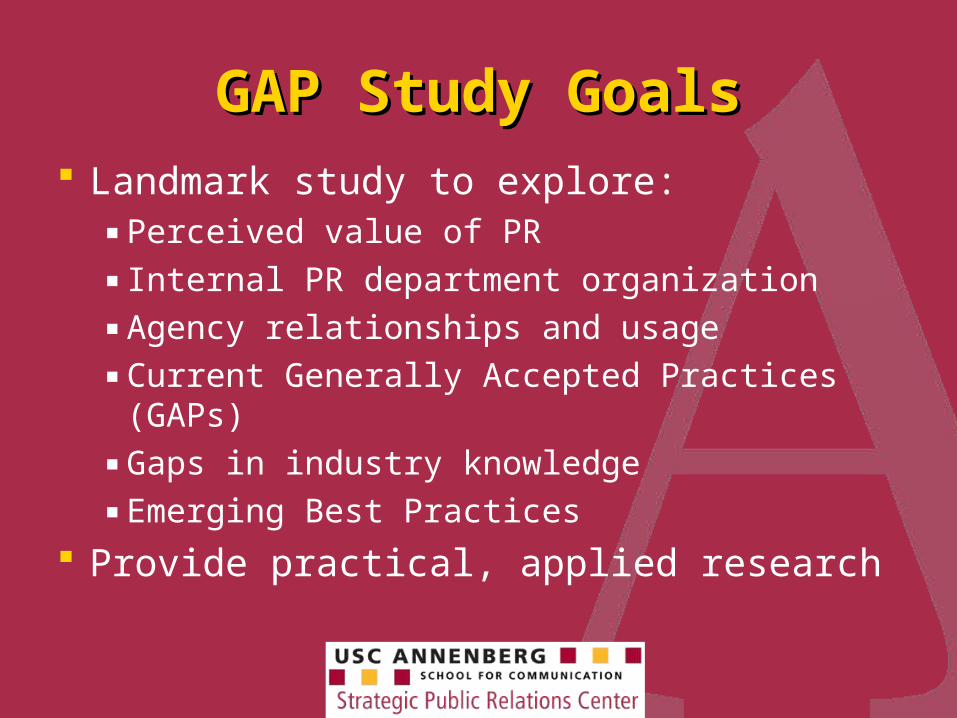
GAP Study GoalsGAP Study Goals Landmark study to explore:
▪ Perceived value of PR
▪ Internal PR department organization
▪ Agency relationships and usage
▪ Current Generally Accepted Practices (GAPs)
▪ Gaps in industry knowledge
▪ Emerging Best Practices
Provide practical, applied research

GAP Study BackgroundGAP Study Background
May/June 2002, 25-question survey sent to 4,600 U.S. senior PR professionals▪ Combination of lists
▪ Across industry categories
▪ Emphasis on “Most Admired”
▪ Written, email, web responses
More than 350 respondents (8% return)
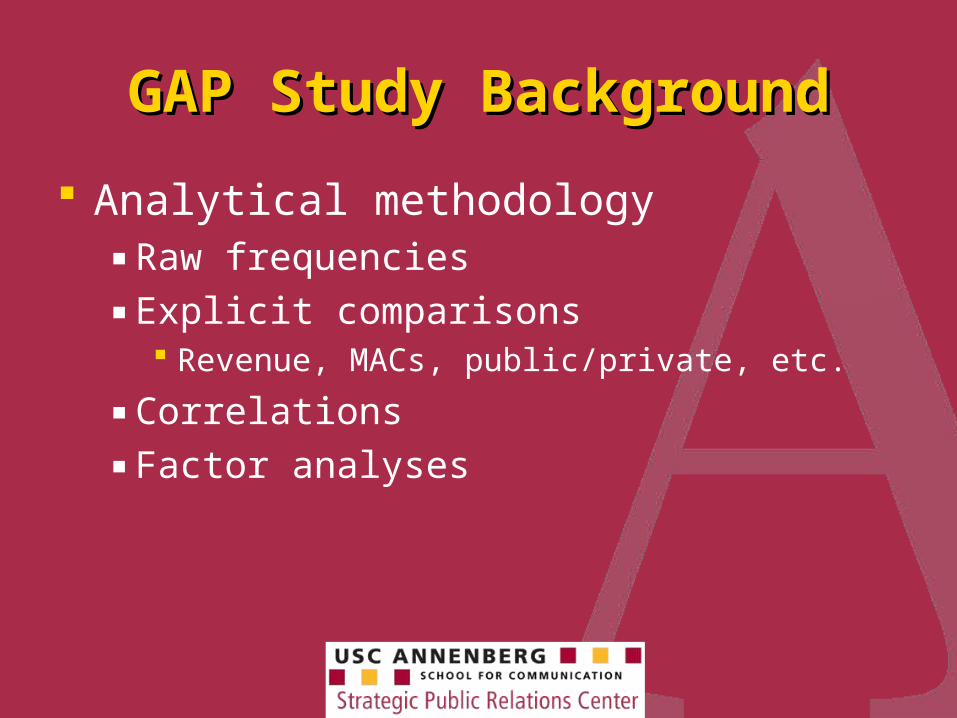
GAP Study BackgroundGAP Study Background
Analytical methodology▪ Raw frequencies
▪ Explicit comparisons Revenue, MACs, public/private, etc.
▪ Correlations
▪ Factor analyses

Respondent DataRespondent Data
61 % publicly held companies; 39 % private 69 MAC vs 257 Non MAC Averages:
▪ Gross revenues: $6.9 billion▪ ROA: 1.92 %▪ PR budgets: $3.2 million▪ PR staff: 24
Allocate 23 % of total PR budget to agency fees

Respondent Data (cont’d)Respondent Data (cont’d)Respondents by Revenue Category
25%
9%
15%18%
19%
14%
$6 Billion+
$3.1-$6 Billion
$1.6-$3.1 Billion
$580M-$1.6 Billion
$100M-$580 Million
Less than $100Million
USC SPRC/CPRF USC SPRC/CPRF GAP StudyGAP Study
Key FindingsKey Findings
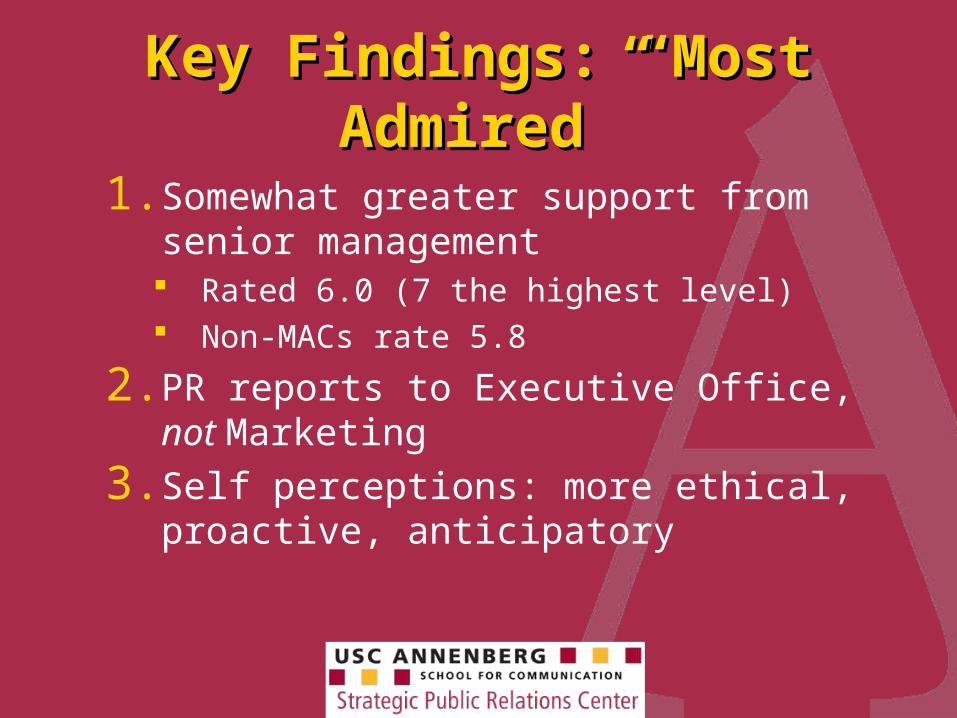
Key Findings: “Most Admired”Key Findings: “Most Admired”
1. Somewhat greater support from senior management Rated 6.0 (7 the highest level) Non-MACs rate 5.8
2. PR reports to Executive Office, not Marketing
3. Self perceptions: more ethical, proactive, anticipatory
Key Findings: “Most Admired”Key Findings: “Most Admired”
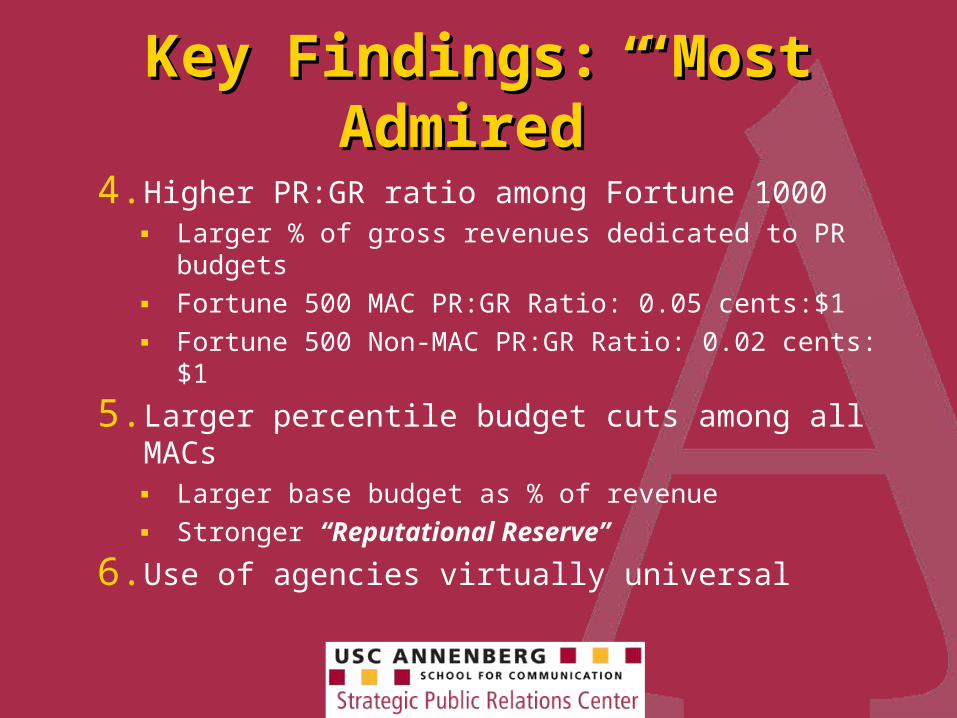
4. Higher PR:GR ratio among Fortune 1000▪ Larger % of gross revenues dedicated to PR budgets
▪ Fortune 500 MAC PR:GR Ratio: 0.05 cents:$1
▪ Fortune 500 Non-MAC PR:GR Ratio: 0.02 cents:$1
5. Larger percentile budget cuts among all MACs▪ Larger base budget as % of revenue
▪ Stronger “Reputational Reserve”
6. Use of agencies virtually universal
Key Findings: Strategic Key Findings: Strategic Positioning Positioning
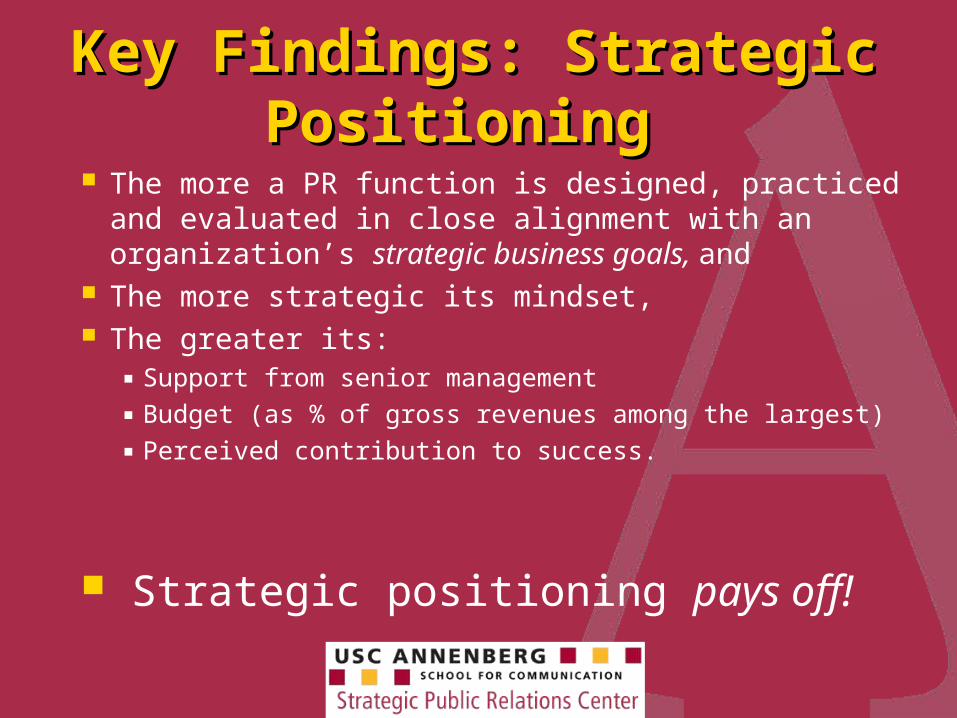
The more a PR function is designed, practiced and evaluated in close alignment with an organization’s strategic business goals, and
The more strategic its mindset, The greater its:
▪ Support from senior management
▪ Budget (as % of gross revenues among the largest)
▪ Perceived contribution to success.
Strategic positioning pays off!

Key Findings: Average BudgetsKey Findings: Average Budgets
The Fortune 500 spend significantly more on PR in total dollars, but not in terms of ratio.▪ Fortune 500 average PR budget: $8.5 million
▪ Fortune 501-1000: $2.2 million
Threshold/critical level of PR expenditures in the $1.25 - $1.75 million range.
Services sector has highest PR budgets as % of revenues (PR:GR ratio). (Size effect)

Key Findings: Key Findings: PR:GR RatiosPR:GR Ratios
New term a la A:S - PR to GR ratio, or PR:GR
Average % of Number of % of Revenue Categories Gross Revenues to PR Respondents Total Respondents
$6 Billion + 0.03% 43 23%[Fortune 500]$3.1-$6 Billion 0.05% 14 8%[Fortune 501-1000]$1.6-$3.1 Billion 0.12% 26 14%[Fortune 1001-2000]$580M-$1.6 Billion 0.13% 36 20%[Fortune 2001-5000]$100M-$580 Million 0.77% 37 20%[Fortune 5001-20000]Less than $100 Million 2.38% 27 15% [Fortune 20000+]Total 0.56% 183 100%
Average % of Gross Revenues Dedicated to PR Budgets
(MAC – 0.05%)
(MAC – 0.06%)
Key Findings: Budget Changes Key Findings: Budget Changes
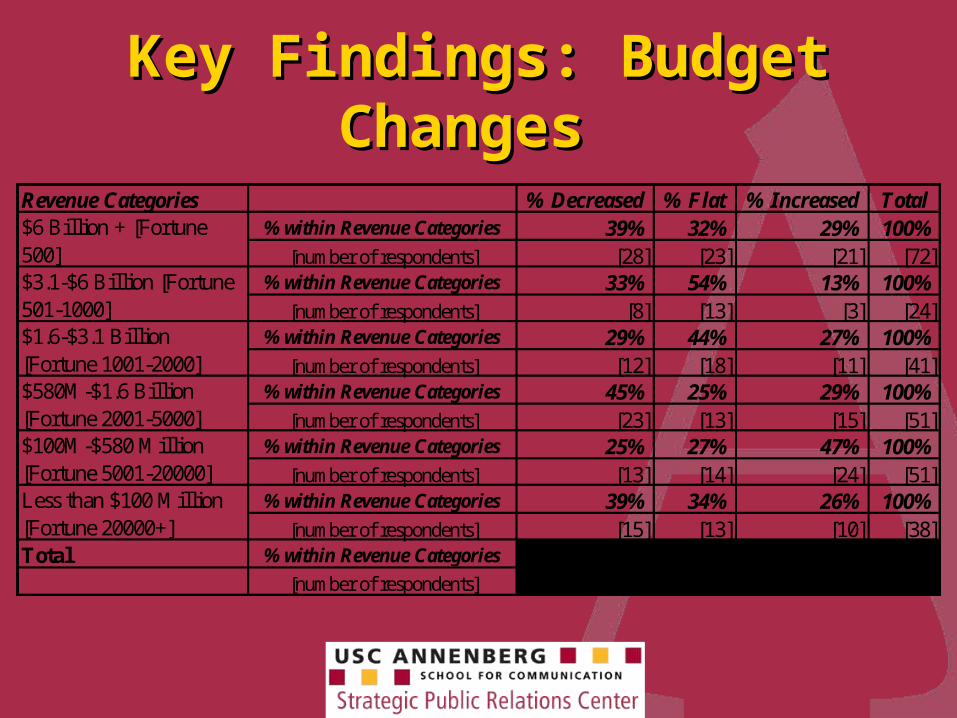
Revenue Categories % Decreased % Flat % Increased Total% within Revenue Categories 39% 32% 29% 100%
[number of respondents] [28] [23] [21] [72]% within Revenue Categories 33% 54% 13% 100%
[number of respondents] [8] [13] [3] [24]% within Revenue Categories 29% 44% 27% 100%
[number of respondents] [12] [18] [11] [41]% within Revenue Categories 45% 25% 29% 100%
[number of respondents] [23] [13] [15] [51]% within Revenue Categories 25% 27% 47% 100%
[number of respondents] [13] [14] [24] [51]% within Revenue Categories 39% 34% 26% 100%
[number of respondents] [15] [13] [10] [38]Total % within Revenue Categories 36% 34% 30% 100%
[number of respondents] [99] [94] [84] [277]
$580M-$1.6 Billion [Fortune 2001-5000]$100M-$580 Million [Fortune 5001-20000]Less than $100 Million [Fortune 20000+]
$6 Billion + [Fortune 500]$3.1-$6 Billion [Fortune 501-1000]$1.6-$3.1 Billion [Fortune 1001-2000]
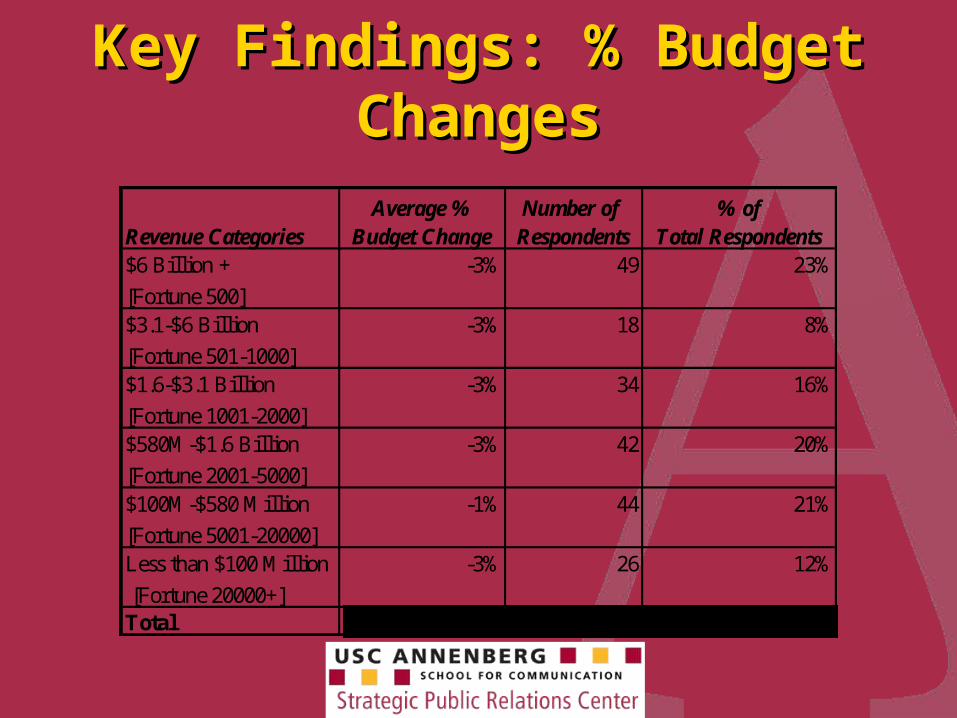
Key Findings: % Budget Key Findings: % Budget ChangesChangesAverage % Number of % of
Revenue Categories Budget Change Respondents Total Respondents$6 Billion + -3% 49 23%
[Fortune 500]$3.1-$6 Billion -3% 18 8%
[Fortune 501-1000]$1.6-$3.1 Billion -3% 34 16%
[Fortune 1001-2000]$580M-$1.6 Billion -3% 42 20%
[Fortune 2001-5000]$100M-$580 Million -1% 44 21%
[Fortune 5001-20000]Less than $100 Million -3% 26 12%
[Fortune 20000+]Total -3% 213 100%
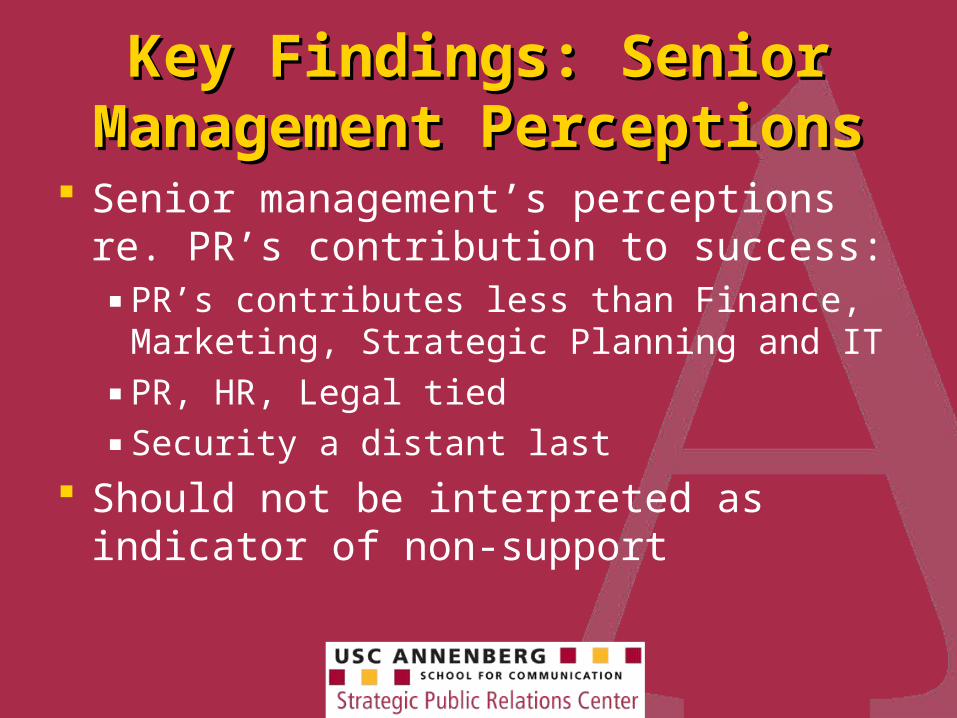
Key Findings: Senior Key Findings: Senior Management PerceptionsManagement Perceptions
Senior management’s perceptions re. PR’s contribution to success:▪ PR’s contributes less than Finance, Marketing,
Strategic Planning and IT
▪ PR, HR, Legal tied
▪ Security a distant last
Should not be interpreted as indicator of non-support
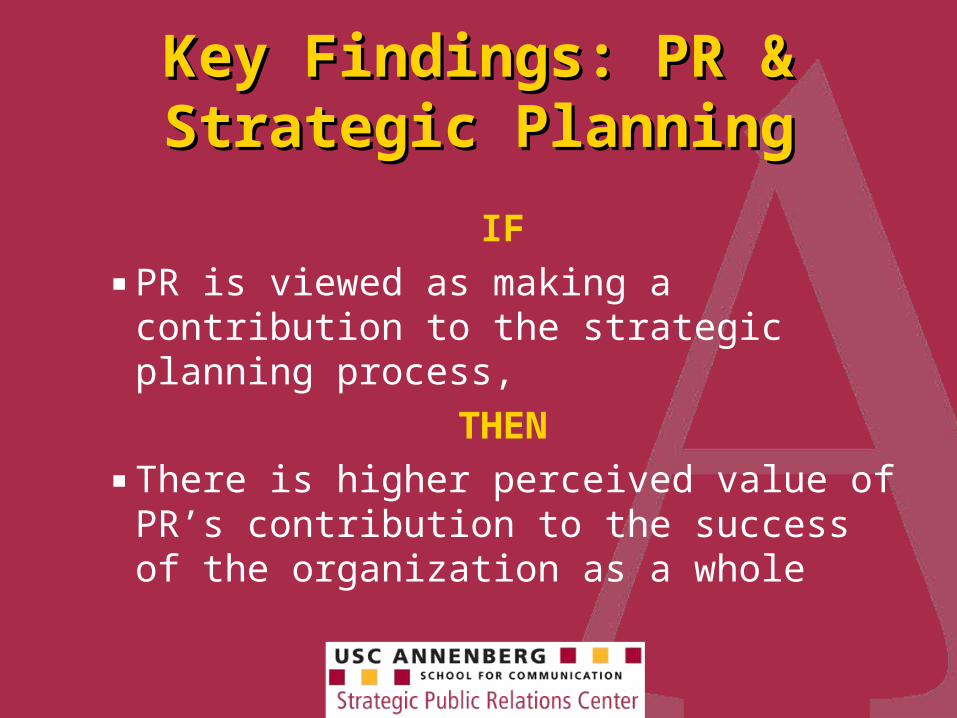
Key Findings: PR & Strategic Key Findings: PR & Strategic PlanningPlanning
IF
▪ PR is viewed as making a contribution to the strategic planning process,
THEN
▪ There is higher perceived value of PR’s contribution to the success of the organization as a whole
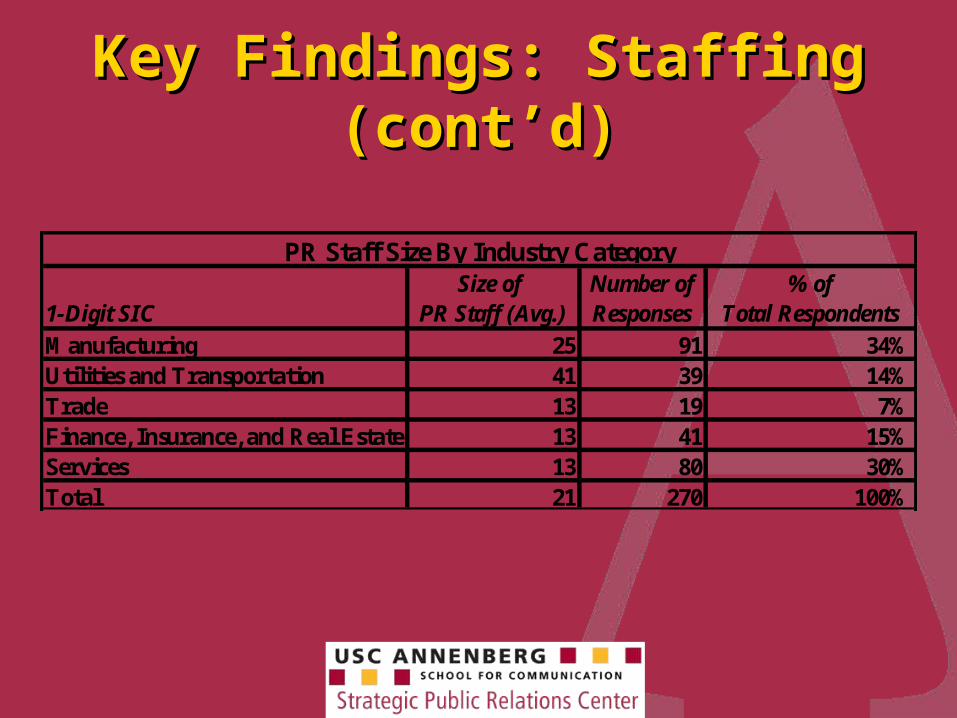
Key Findings: Staffing (cont’d)Key Findings: Staffing (cont’d)
Size of Number of % of1-Digit SIC PR Staff (Avg.) Responses Total Respondents
Manufacturing 25 91 34%Utilities and Transportation 41 39 14%Trade 13 19 7%Finance, Insurance, and Real Estate 13 41 15%Services 13 80 30%Total 21 270 100%
PR Staff Size By Industry Category
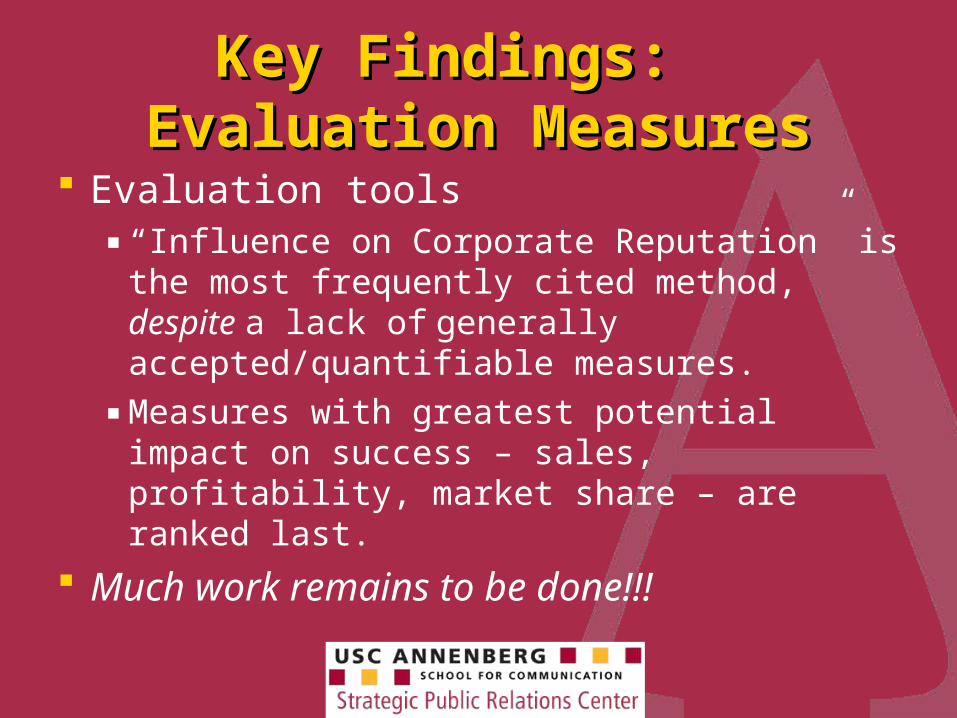
Key Findings: Key Findings: Evaluation MeasuresEvaluation Measures
Evaluation tools▪ “Influence on Corporate Reputation” is the most
frequently cited method, despite a lack of generally accepted/quantifiable measures.
▪ Measures with greatest potential impact on success – sales, profitability, market share – are ranked last.
Much work remains to be done!!!

Key Findings: Key Findings: Evaluation Measures (cont’d)Evaluation Measures (cont’d)
Those with larger PR budgets: “influence on corporate culture and stakeholder attitudes”
Those with smaller PR budgets: “ad equivalency of clips” (imprecise)
Other top measures: ▪ Employee attitudes/morale
▪ Content analysis of media clips
▪ Share of voice
But how measured?

Key Findings: Key Findings: Evaluation Measures (cont’d)Evaluation Measures (cont’d)
Least used measures are those with greatest potential impact on corporate success:▪ Contribution to sales/profitability
▪ Market share
▪ Influence on stock performance
New methodologies are needed!!!
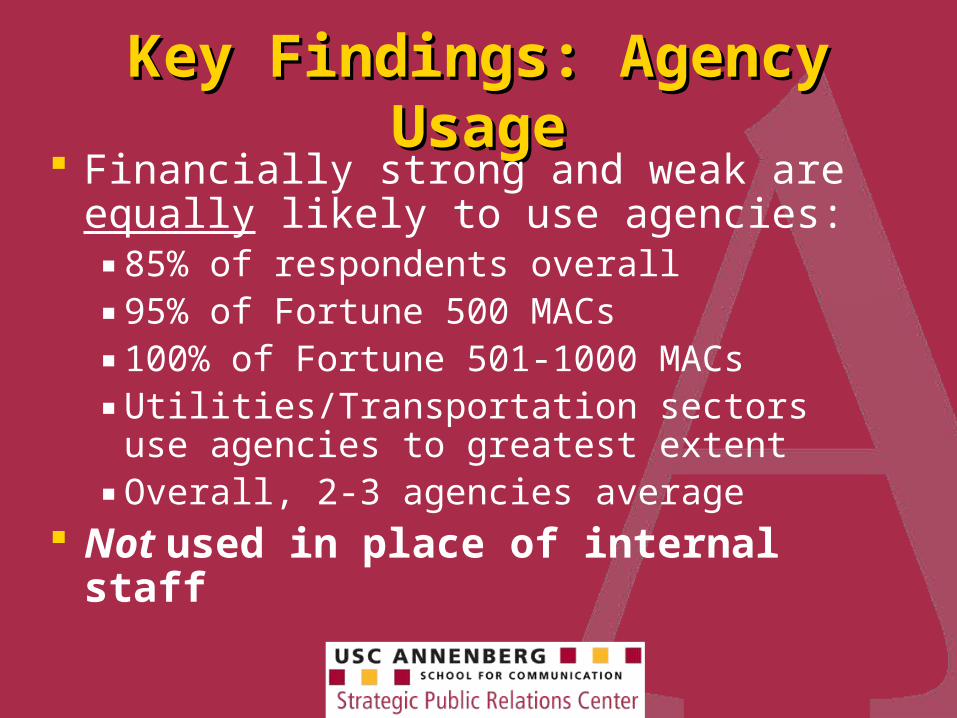
Key Findings: Agency UsageKey Findings: Agency Usage Financially strong and weak are equally likely
to use agencies:▪ 85% of respondents overall▪ 95% of Fortune 500 MACs▪ 100% of Fortune 501-1000 MACs▪ Utilities/Transportation sectors use agencies to
greatest extent▪ Overall, 2-3 agencies average
Not used in place of internal staff

Key Findings: Agency Usage Key Findings: Agency Usage (cont’d)(cont’d)
Top reasons for using agencies (in rank order):1. Strategic/market insight
2. Offset limitations of internal staff
3. Objectivity
4. Cheaper than adding staff
5. Easier than adding staff
6. Ability to quantify results
7. Senior management expectation

Key Findings: Agency Usage Key Findings: Agency Usage (cont’d)(cont’d)
Top concerns about using agencies:1. Cost
2. Lack of knowledge/market insight
3. Perceived ROI
4. Junior teams
5. Staff turnover
6. Ability to quantify results
7. Vague about conflicts
2% said “no concerns”
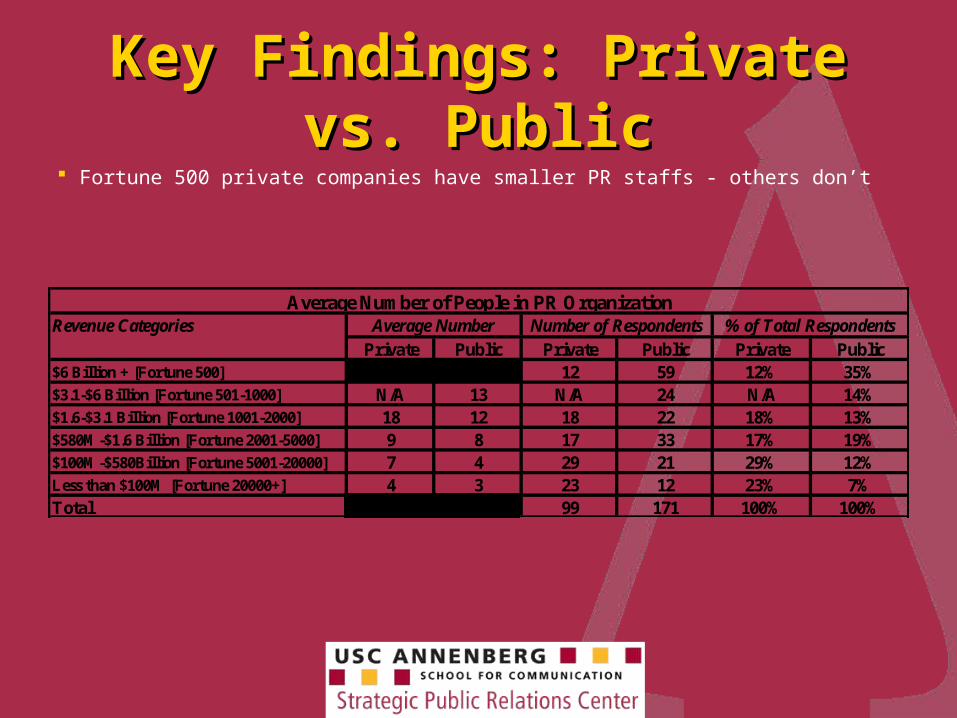
Key Findings: Private vs. PublicKey Findings: Private vs. Public Fortune 500 private companies have smaller PR staffs - others don’t
Revenue Categories
Private Public Private Public Private Public$6 Billion + [Fortune 500] 21 78 12 59 12% 35%$3.1-$6 Billion [Fortune 501-1000] N/A 13 N/A 24 N/A 14%$1.6-$3.1 Billion [Fortune 1001-2000] 18 12 18 22 18% 13%$580M-$1.6 Billion [Fortune 2001-5000] 9 8 17 33 17% 19%$100M-$580Billion [Fortune 5001-20000] 7 4 29 21 29% 12%Less than $100M [Fortune 20000+] 4 3 23 12 23% 7%Total 11 33 99 171 100% 100%
Average Number of People in PR OrganizationAverage Number Number of Respondents % of Total Respondents
Key Findings: Key Findings: Organizational FunctionsOrganizational Functions
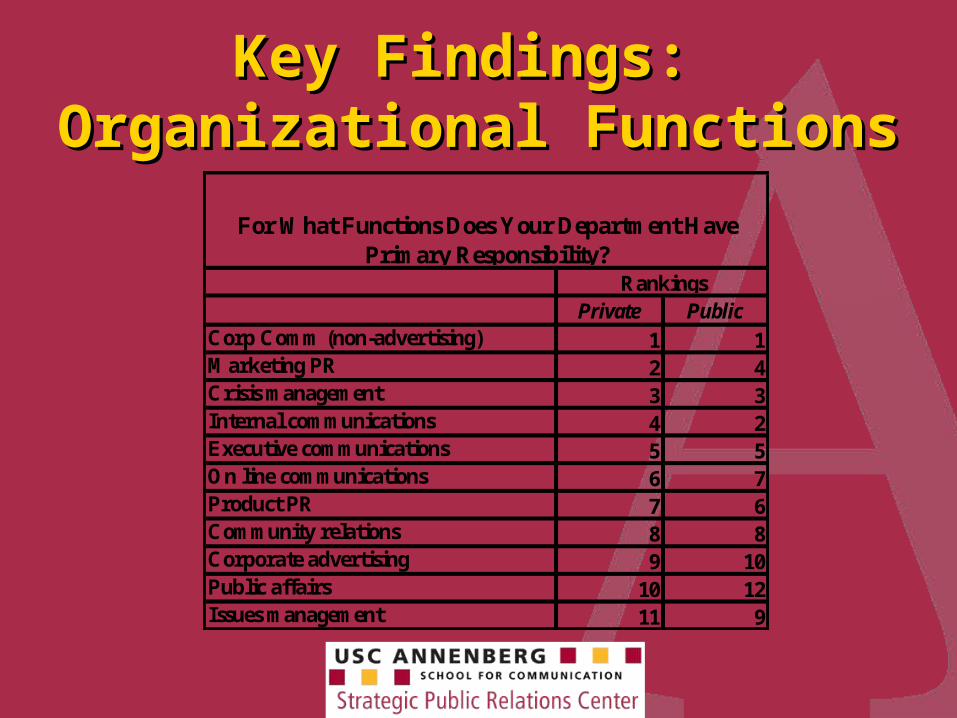
Private PublicCorp Comm (non-advertising) 1 1Marketing PR 2 4Crisis management 3 3Internal communications 4 2Executive communications 5 5On line communications 6 7Product PR 7 6Community relations 8 8Corporate advertising 9 10Public affairs 10 12Issues management 11 9
For What Functions Does Your Department Have Primary Responsibility?
Rankings
Key Findings: Key Findings: Organizational FunctionsOrganizational Functions
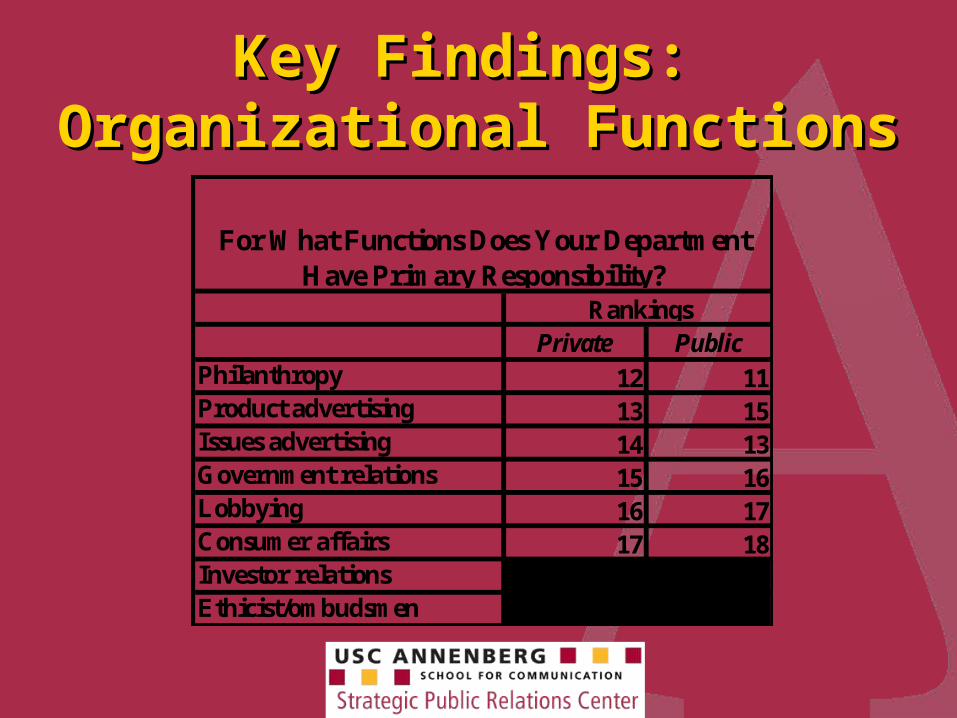
Private PublicPhilanthropy 12 11Product advertising 13 15Issues advertising 14 13Government relations 15 16Lobbying 16 17Consumer affairs 17 18Investor relations 18 14Ethicist/ombudsmen 19 19
For What Functions Does Your Department Have Primary Responsibility?
Rankings

Key Findings: Key Findings: Organizational CultureOrganizational Culture
First study of its kind Respondents ranked their organizations using specific
sets of adjectives Helps us understand what PR professionals think
about culture/business philosophy of their companies.

Key Findings: Key Findings: Organizational CultureOrganizational Culture
Organization Self-Description
1 2 3 4 5 6 7
Unethical – Ethical
Poor external reputation – Goodexternal reputation
Unprofitable – Profitable
Cold – Warm
Short-sighted – Visionary
Rigid – Flexible
Homogeneous – Diverse
De
sc
rip
tio
n R
an
ge
Rating Scale
Average Rating
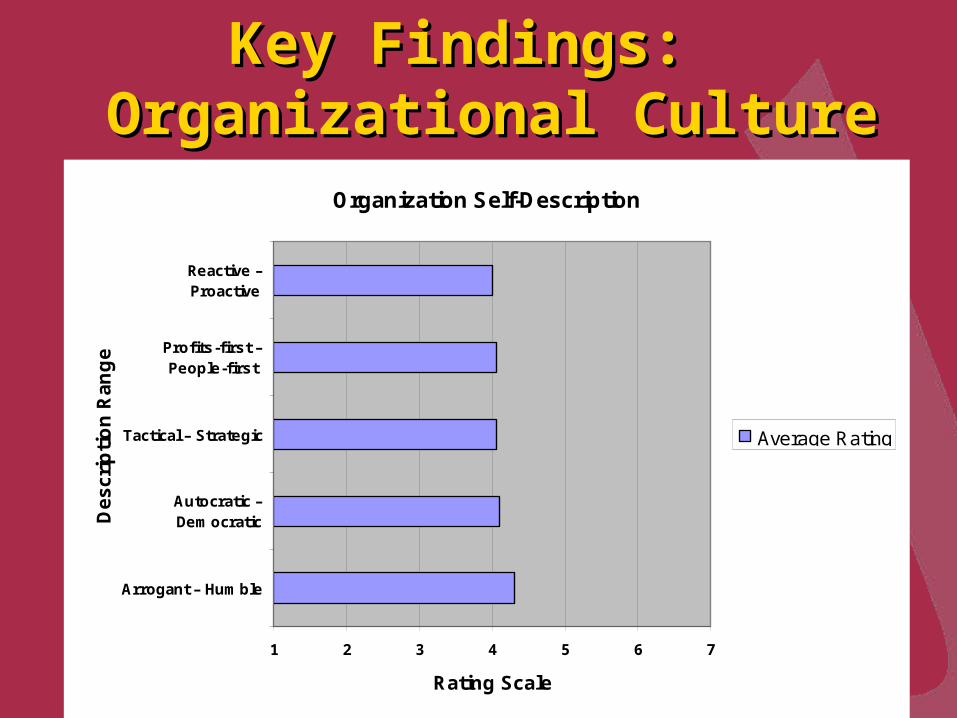
Key Findings: Key Findings: Organizational Culture Organizational Culture
Organization Self-Description
1 2 3 4 5 6 7
Arrogant – Humble
Autocratic –Democratic
Tactical – Strategic
Profits-first –People-first
Reactive –Proactive
De
sc
rip
tio
n R
an
ge
Rating Scale
Average Rating

Self perceptions if report to Executive Office▪ People-first, ethical, humble, warm, democratic,
diverse, strategic
Self perceptions if report to Marketing▪ Less calm, less visionary, more reactive and
more inflexible
Key Findings: Key Findings: Organizational Culture Organizational Culture
Self perceptions of organizations that use PR agencies:▪ Flexible
▪ Democratic
▪ Visionary
▪ Proactive
And turbulent!
Key Findings: Key Findings: Organizational Culture Organizational Culture
Key Findings: Emerging Best Key Findings: Emerging Best PracticesPractices
Generally Accepted Practices not the same as Best Practices, despite widespread use▪ Generally Accepted = widely used
▪ Best = proven effective by valid means
“Most Admired” status a good starting point Much work to be done in identifying,
validating Best Practices
Key Findings: Emerging Best Key Findings: Emerging Best PracticesPractices
1. Forge a strategic role for PR
2. Seek the right reporting line
3. Know your PR:GR ratio
4. Use PR agencies appropriately Select based on strategic ability Ongoing vs. sporadic relationship Review cost/staffing in the beginning
Key Findings: Emerging Best Key Findings: Emerging Best PracticesPractices
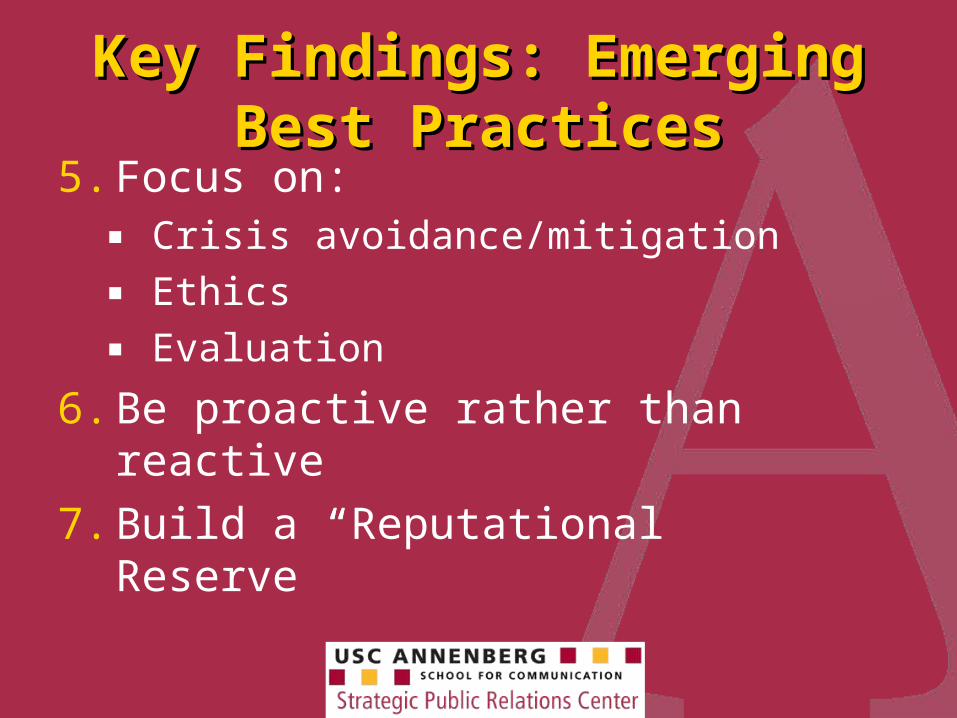
5. Focus on:▪ Crisis avoidance/mitigation
▪ Ethics
▪ Evaluation
6. Be proactive rather than reactive
7. Build a “Reputational Reserve”
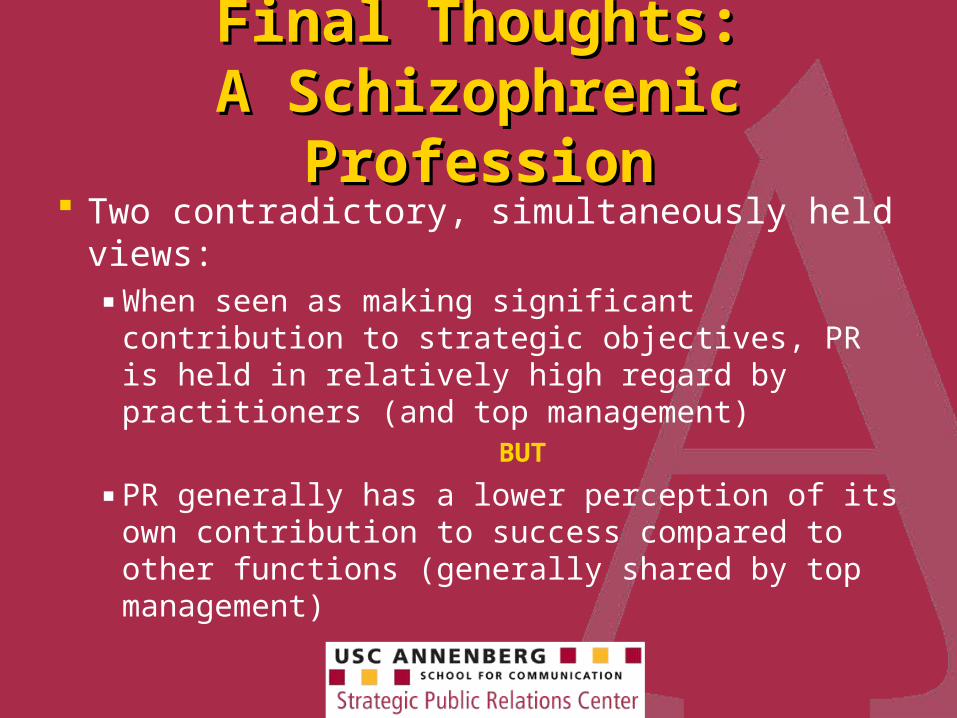
Final Thoughts:Final Thoughts:A Schizophrenic ProfessionA Schizophrenic Profession
Two contradictory, simultaneously held views:▪ When seen as making significant contribution to
strategic objectives, PR is held in relatively high regard by practitioners (and top management)
BUT
▪ PR generally has a lower perception of its own contribution to success compared to other functions (generally shared by top management)
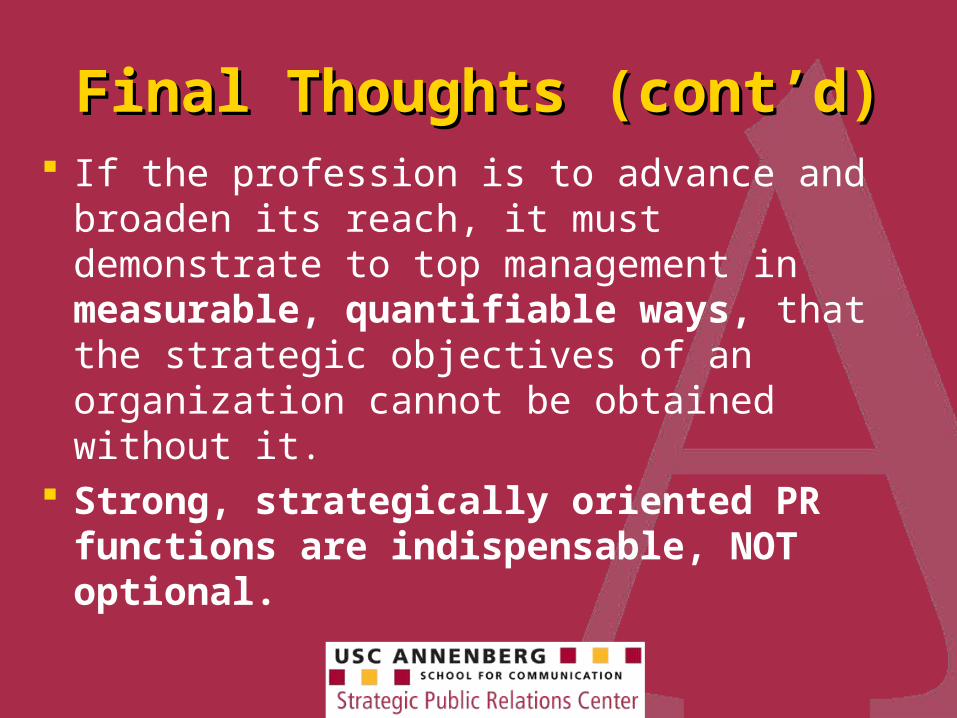
Final Thoughts (cont’d)Final Thoughts (cont’d) If the profession is to advance and broaden its
reach, it must demonstrate to top management in measurable, quantifiable ways, that the strategic objectives of an organization cannot be obtained without it.
Strong, strategically oriented PR functions are indispensable, NOT optional.