u.s. jones act compliant offshore wind turbine ... · pdf fileu.s. jones act compliant...
TRANSCRIPT

U.S. Jones Act Compliant Offshore Wind Turbine Installation Vessel StudyA Report for the Roadmap Project for Multi-State Cooperation on Offshore Wind
October 2017 Report 17-13

Cover Image: Courtesy Deepwater Wind

U.S. Jones Act Compliant Offshore Wind Turbine Installation Vessel Study
A Report for the Roadmap Project for Multi-State Cooperation on Offshore Wind
Final Report
Prepared for:
New York State Energy Research and Development Authority
Massachusetts Clean Energy Center
Massachusetts Department of Energy Resources
Rhode Island Office of Energy Resources
Clean Energy States Alliance
Prepared by:
GustoMSC
Houston, TX
Brian Cheater Project Manager
NYSERDA Report 17-13 October 2017

ii
DOE Disclaimer This material is based upon work supported by the U.S. Department of Energy award number
DE-EE0007220. This report was prepared as an account of work sponsored by an agency of the
United States Government. Neither the United States Government nor any agency thereof, nor any
of their employees, makes any warranty, expressed or implied, or assumes any legal liability or
responsibility for the accuracy, completeness, or usefulness of any information, apparatus, product,
or process disclosed, or represents that its use would not infringe privately owned rights. Reference
herein to any specific commercial product, process, or service by trade name, trademark, manufacturer,
or otherwise does not necessarily imply its endorsement, recommendation, or favoring by the United
States Government or any agency thereof. The views and opinions of authors expressed herein do
not necessarily state or reflect those of the United States Government or any agency thereof.
NYSERDA Notice This report was prepared by BVG Associates, LTD in the course of performing work contracted for
by the New York State Energy Research and Development Authority (NYSERDA), and reflects
collaboration between NYSERDA and representatives of the Massachusetts Department of Energy
Resources, the Massachusetts Clean Energy Center and the Rhode Island Office of Energy Resources (the
Participating States) and the assistance of the Clean Energy States Alliance. The opinions expressed in
this report do not necessarily reflect those of NYSERDA, the State of New York, or any of the
Participating States, and reference to any specific product, service, process, or method does not constitute
an implied or expressed recommendation or endorsement of it. Further, NYSERDA, the State of New
York, the Participating States and the contractor make no warranties or representations, expressed or
implied, as to the fitness for particular purpose or merchantability of any product, apparatus, or service, or
the usefulness, completeness, or accuracy of any processes, methods, or other information contained,
described, disclosed, or referred to in this report. NYSERDA, the State of New York, the Participating
States and the contractor make no representation that the use of any product, apparatus, process, method,
or other information will not infringe privately owned rights and will assume no liability for any loss,
injury, or damage resulting from, or occurring in connection with, the use of information contained,
described, disclosed, or referred to in this report.
iii
NYSERDA makes every effort to provide accurate information about copyright owners and related
matters in the reports we publish. Contractors are responsible for determining and satisfying copyright
or other use restrictions regarding the content of reports that they write, in compliance with policies and
federal law. If you are the copyright owner and believe this report has not properly attributed your work
to you or has used it without permission, please email [email protected].
Information contained in this document, such as web page addresses, were current at the time of
publication.
Acknowledgements Greg Matzat of NYSERDA provided project management. Members of the Steering Committee for the
Multi-State Offshore Roadmap project contributed to the development of this study and reviewed the
drafts. The Steering Committee members and other staff of participating state agencies who contributed
information and served as reviewers were Christen Anton, Nils Bolgen, and Bill White (Massachusetts
Clean Energy Center); Farhad Aminpour, Michael Judge, and Joanne Morin (Massachusetts Department
of Energy Resources); Doreen Harris and Greg Matzat (NYSERDA); Christopher Kearns (Rhode Island
Office of Energy Resources); Warren Leon and Val Stori (Clean Energy States Alliance); and Paul
Gromer (Peregrine Energy Group).
GustoMSC would like to thank the members who collaborated on “A Roadmap for Multi-State
Cooperation on Offshore Wind Development: A Strategy to Achieve a Regional Market of Scale,” an
effort funded in part by the U.S. Department of Energy’s FY 2015 State Energy Program Competitive
Award to New York, in partnership with Massachusetts, and Rhode Island.”
In particular, GustoMSC would like to thank Greg Matzat at NYSERDA for supporting this study.
GustoMSC would also like to thank the following for their contribution:
• World Marine – Ronald Schooner, Joe Roche, Howard Van and Jeffrey Gehrmann • Edison Chouest Offshore/Bollinger – Roger White and Chris Blackwell • Conrad Shipyard – Gary Lipley and Travis Aucoin • Offshore Liftboats – Gary Callais

iv
Abstract This study created a framework for understanding what is required of a wind turbine installation
vessel (WTIV) on the East Coast from technical and financial perspectives.
A pipeline of wind farm projects was based on offshore wind development areas identified in New
York, Rhode Island, and Massachusetts. This pipeline provided a framework to define physical
parameters such as number, size, and weight of turbines; water depth; and type, size and weight
of the foundations.
These parameters fed into a study to define an installation methodology and a set of functional
requirements for the installation vessels using both a feeder barge and a transit unit transportation
option. Based on these functional requirements, designs were finalized and estimating packages were
sent to U.S. shipyards. Indicative prices of $87 million (feeder barge) and $222 million (WTIV) were
received for Jones Act compliant vessels. Operational expenses were estimated assuming the vessels
were U.S. flagged.
This pipeline of work and cost data was used to create a basic cash flow model from the perspective
of a vessel owner. Based on this model, at least 10 years of work, or a pipeline of approximately
3,500 to 4,000 megawatts of offshore wind capacity, would be required by a WTIV owner to provide
a reasonable combination of day and internal rates of return.
This will require that a group of states and developers coordinate on an identified pipeline of projects.
However, if the full potential of the offshore wind areas on the East Coast is realized, including areas
not considered in this study, several vessels may be justified.

v
Table of Contents DOE Disclaimer ........................................................................................................................ ii NYSERDA Notice ..................................................................................................................... ii Acknowledgements .................................................................................................................iii Abstract ....................................................................................................................................iv
List of Figures .........................................................................................................................vii List of Tables .......................................................................................................................... viii Acronyms and Abbreviations .................................................................................................ix
Executive Summary ................................................................................................................. 1
1 Introduction ....................................................................................................................... 1
2 Study Approach and Methods ......................................................................................... 2
3 Regional Wind Farm Developments ................................................................................ 4 3.1 Water Depth Survey ...................................................................................................................... 4 3.2 Wave, Wind and Current Conditions ............................................................................................. 6 3.3 Soil Conditions .............................................................................................................................. 9 3.4 Wind Turbine ............................................................................................................................... 10 3.5 Turbine Foundations ................................................................................................................... 11 3.6 Regional Pipeline of Wind Farm Projects ................................................................................... 15 3.7 Staging Port................................................................................................................................. 16 3.8 Installation Campaigns ................................................................................................................ 16 3.9 Experience Factors ..................................................................................................................... 21 3.10 Waiting on Weather (WoW) Factors ........................................................................................... 22 3.11 Transportation Strategies ............................................................................................................ 23
3.11.1 Feeder Barge Option ........................................................................................................... 23 3.11.2 Transit Unit Option .............................................................................................................. 27 3.11.3 Build-out Schedules for Transit and Feeder Options .......................................................... 34
4 Functional Requirements for Installation Vessel ...........................................................36 4.1 Philosophy ................................................................................................................................... 36 4.2 Core Functional Requirements for both Options ......................................................................... 36
4.2.1 Rules ................................................................................................................................... 36 4.2.2 Elevated Conditions ............................................................................................................ 37 4.2.3 Afloat ................................................................................................................................... 38 4.2.4 Jacking and Preloading ....................................................................................................... 38 4.2.5 GeoTechnical Data.............................................................................................................. 38

vi
4.2.6 Design Temperatures .......................................................................................................... 38 4.2.7 Principal Dimensions, Capacities, and Deck Loads ............................................................ 38
4.3 Specific Requirements for Wind Turbine Installation Vessel (WTIV) .......................................... 39 4.4 Specific Requirements for Feeder Barge .................................................................................... 40
5 Design Details of Wind Turbine Installation Vessel .......................................................41
6 Design Details of Feeder Unit .........................................................................................44
7 CAPEX and Schedule Estimates .....................................................................................45
8 Crewing Cost Estimates ..................................................................................................47
9 Business Model for the WTIV ..........................................................................................48
10 Business Model for the Feeder Barge .........................................................................57
11 Conclusions ..................................................................................................................65
12 References ....................................................................................................................66
Appendix A – Product Brochure – NG-9800C-US ............................................................... A-1
Appendix B – Product Brochure – NG-3750C ..................................................................... B-1

vii
List of Figures Figure 1. Occurrence of Water Depths over the Northeast Study Area ...................................... 5 Figure 2. Distribution of Project Water Depths (including Europe) (Musial, 2013) ....................... 6 Figure 3. Time Series of Surface Currents New York (AWS Truepower LLC, 2010) .................. 9 Figure 4. Indicative Stratification of Seabed (AWS Truepower LLC, 2010) ................................10 Figure 5. Foundation Type by Water Depth and Turbine Rating (Aaron Smith, 2015) ...............12 Figure 6. Campaign 1 Pile Installation Sequence ......................................................................18 Figure 7. Campaign 2 Jacket Installation Sequence ..................................................................19 Figure 8. Campaign 3 Turbine Installation Sequence ................................................................20 Figure 9. Plot of Experience Factors .........................................................................................21 Figure 10. Rendering #1 of two NG-9800C-US installing foundations .......................................42 Figure 11. Rendering #2 of two NG-9800C-US installing foundations .......................................42 Figure 12. Rendering #3 of two NG-9800C-US installing turbines .............................................43 Figure 13. Rendering #4 of two NG-9800C-US installing turbines .............................................43 Figure 14. Indicative Construction Schedule for the NG 9800C .................................................45 Figure 15. Indicative Construction Schedule for the NG-3750 ...................................................46 Figure 16. Sample Cash Flow Time Series for Day Rate of $220,000 per day ..........................50 Figure 17. WTIV Variation in NPV and IRR with day rate of $200k and Unit Sold after
10 years ........................................................................................................................51 Figure 18. WTIV Variation in NPV and IRR with day rate of $200k and Unit Sold after
20 years ........................................................................................................................52 Figure 19. WTIV Variation in NPV and IRR with day rate of $220k and Unit Sold after
10 years ........................................................................................................................53 Figure 20. WTIV Variation in NPV and IRR with day rate of $220k and Unit Sold after
20 years ........................................................................................................................54 Figure 21. WTIV Variation in NPV and IRR with day rate of $240k and Unit Sold after
10 years ........................................................................................................................55 Figure 22. WTIV Variation in NPV and IRR with day rate of $240k and Unit Sold after
20 years ........................................................................................................................56 Figure 23. Feeder Variation in NPV and IRR with day rate of $80k and Unit Sold after
10 years ........................................................................................................................59 Figure 24. Feeder Variation in NPV and IRR with day rate of $80k and Unit Sold after
20 years ........................................................................................................................60 Figure 25. Feeder Variation in NPV and IRR with day rate of $85k and Unit Sold after
10 years ........................................................................................................................61 Figure 26. Feeder Variation in NPV and IRR with day rate of $85k and Unit Sold after
20 years ........................................................................................................................62 Figure 27. Feeder Variation in NPV and IRR with day rate of $90k and Unit Sold after
10 years ........................................................................................................................63 Figure 28. Feeder Variation in NPV and IRR with day rate of $90k and Unit Sold after
20 years ........................................................................................................................64
viii
List of Tables Table 1. Distribution of Water Depths over the Northeast Study Area ........................................ 5 Table 2. Metocean Parameters for Six Sites (Damiani, 2016) .................................................... 7 Table 3. Monthly Wave Statistics Buoy 44025 (NOAA, 2017) .................................................... 7 Table 4. NOAA Buoy 44025 Cumulative % Frequency of Occurrence ....................................... 8 Table 5. Summary of Wind Turbine Characteristics ..................................................................11 Table 6. Jacket Weight vs. Turbine Size ...................................................................................13 Table 7. Jacket Weight vs. Water Depth ...................................................................................13 Table 8. Jacket Weight by Turbine Size and Water Depth ........................................................14 Table 9. Theoretical Capacity of Study Area (Number and Power of Wind Turbines) ................16 Table 10. Experience Factors for Repetitive Operations ...........................................................21 Table 11. Vessel Availability and Waiting on Weather Factors ..................................................22 Table 12. Feeder – Campaign 1 Operational Breakdown ..........................................................24 Table 13. Feeder – Campaign 2 Operational Breakdown ..........................................................25 Table 14. Feeder – Campaign 3 Operational Breakdown ..........................................................25 Table 15. Feeder Option Time to Install 100 Turbines ...............................................................26 Table 16. Transit Option – Campaign 1 Operational Breakdown ...............................................28 Table 17. Transit Option – Campaign 2 Operational Breakdown ...............................................30 Table 18. Transit Option – Campaign 3 Operational Breakdown ...............................................31 Table 19. Transit Option Time to Install 100 turbines ................................................................33 Table 20. Available Vessel Years of Work vs. Max Water Depth with Transit Option ................34 Table 21. Available Vessel Years of Work vs. Max Water Depth with Feeder Option ................35 Table 22. Summary of Elevated Condition Design Values for NYS Winter Storm
(see Table 2) .................................................................................................................37 Table 23. Principal Particulars of NG9800C ..............................................................................41 Table 24. Principal Particulars of NG-3750C .............................................................................44 Table 25. Indicative Crewing Costs for NG9800C US ...............................................................47 Table 26. Summary of IRR for WTIV .........................................................................................49 Table 27. Summary of NPV for WTIV ........................................................................................49 Table 28. Summary of IRR for WTIV .........................................................................................58 Table 29. Summary of NPV for WTIV ........................................................................................58
ix
Acronyms and Abbreviations BOEM Bureau of Ocean Energy Management CAPEX Capital Expenditure Hs Significant Wave Height IRR Internal Rate of Return NPV Net Present Value NREL National Renewable Energy Laboratory Tp Peak Wave Period (sec) te metric tonne (1,000kg) USCG United States Coast Guard VDL Variable Deck Load WOW Waiting on Weather WTIV Wind Turbine Installation Vessel

ES-1
Executive Summary There is significant wind power potential off the East Coast of the United States, which is distributed
over several states. Suitable vessels to construct offshore wind farms are key for the successful
development of this resource. The Jones Act requires any vessel transporting cargo between U.S. ports
be built and flagged in the U.S. For the purposes of the Jones Act, a bottom founded wind turbine
foundation is considered a U.S. port. Consequently, a non-Jones Act wind turbine installation vessel
(WTIV) is not able to transport components from an on-shore port to a turbine foundation. To use a
foreign, non-Jones Act vessel, components from a U.S. port must be loaded onto a U.S. built feeder
barge. The feeder barge is brought out to the project site where the foreign WTIV may lift the
components off the feeder barge onto the foundation without moving. This strategy allows the use
of foreign flagged vessels, but it requires additional Jones Act compliant feeder barges and costs.
This study examines the required functionality and financial considerations of both a Jones Act compliant
WTIV and a feeder barge for input into a vessel owner’s risk assessment. It is impossible to predict
which individual projects will move forward or the associated timelines. Instead, this study looks at
the maximum physical wind capacity (that could theoretically be developed) in the area and does not
differentiate by state, developer, or project. It is an examination of the total capacity of the East Coast’s
offshore wind market to develop demand (in vessel-years) for a Jones Act WTIV. How and where this
demand materializes is beyond the scope of this study. This study simply takes the developable capacity
to provide perspective on the level of regional development required to justify capital investment of a
WTIV or feeder barge. It will be up to the developers and WTIV owners to identify realistic potential
pipelines and perform their own risk assessment before making any firm investment decisions.
This study took a sample of potential offshore wind development areas in the Northeast between New
York and Massachusetts that have been leased to date by the U.S. Department of Interior’s Bureau
of Ocean Energy Management (BOEM) where existing, commercially available bottom-fixed
technology may be used. Data on bathymetry, wind, wave, current, and soil conditions was identified.
Eight-megawatt (MW) turbines were laid out in a 9 x 9 rotor diameters grid to tally the number of
turbines that could theoretically be installed according to water depth range. This approach required
a model of the potential number of turbines by water depth and does not differentiate by state or
developer. From this, a design water depth of 55 m was identified for the vessel design and physical
installation scenarios.

ES-2
The installation work for an individual project was broken into three campaigns allowing year-round
utilization of the vessel (where permitted) as shown:
• Installation of pin-piles • Installation of jackets • Installation of turbines
The installation work can be completed using two options for transporting materials from port to the
project sites:
• A transiting WTIV that loads up directly in port • A field bound WTIV supplied from port by feeder barges
Typical installation procedures using these two transportation options were developed in order to
estimate the expected amount of time required to complete the installation. Based on a bottom-up
estimate of the installation schedule, it will require at least 23 vessel years (a vessel occupied
continuously for one year is one vessel year) to build out to the 55 m contour in the study area. This
is based on a self-transiting WTIV; the feeder barge concept would remove approximately five years
from the schedule, but this reduction in time would have to balance the cost of providing the feeder
barge(s). Other factors may lead to using feeder barges, such as port restrictions.
Several factors influence the design and construction of a WTIV. Installation of hundreds of turbines
will require an industrial like approach with simplified one-step operations; therefore, the WTIV should
have the crane capacity and reach to enable installation of large components as a single completed unit
(foundations for example). The vessel will have to work with available port facilities and the Jones Act
requires vessels be built in the U.S.
To satisfy the requirements for the WTIV, the GustoMSC NG-9800C-US design was tailored from
an existing proven design (the NG-9800C). It had an average U.S. shipyard estimated price of
$222 million with a construction time of approximately 34 months. The GustoMSC NG-3750C
was developed to satisfy the requirements of the feeder barge. It had an average U.S. shipyard
estimated price of $87 million and a construction time of approximately 25 months. For maximum
efficiency, two or more feeder barges could be employed depending on project requirements.
To achieve a reasonable combination of day rates ($220,000) and internal rate of return (10%), at least
10 years of work or a pipeline of approximately 3,500 to 4,000 MW of offshore wind capacity is required
for the WTIV. For the feeder barge, approximately 16 years of work at a day rate of $85,000 is required
for an internal rate of return of 10%. This requires a group of states and developers coordinate on an
identified pipeline of projects. However, if the full potential of the offshore wind areas on the East
Coast is realized, several vessels may be justified for areas not considered in this study.

1
1 Introduction There is significant potential for offshore wind power available off the East Coast of the United States.
Looking at the identified BOEM wind energy areas (WEA) in the study area, this potential is distributed
over several states. Massachusetts has the largest individual capacity in terms of the size of their WEAs
and adopted legislation calling for the procurement of 1,600 MW of offshore wind by 2027. New York
State currently has a single WEA, but committed to develop up to 2,400 MW of offshore wind by 2030
and is developing a master plan that includes identifying additional areas suitable for development.
Beyond these existing commitments, the study area can support significant additional capacity in
excess of 8,000 MW out to 55 meters of water depth.
Economic development of offshore wind power requires a large-scale industrial approach with a
combination of large turbines and ultra-efficient installation methods to drive down the Levelized Cost
of Energy of the power produced. European developers for the Borssele III and IV sites (4C Offshore,
2016) recently signed agreements at 54.5 euro/MWh (excl. 14 € / MWh transmission costs) or
$74/MWh including transmission costs. This reduction is made possible through economies of
scale and supply chain efficiency.
This study examined what type of installation vessel would fit the requirements of this regional market.
A suitable installation vessel is a key enabler for the successful development of any large-scale wind
farm. The Jones act requires any vessel transporting cargo between U.S. ports be built and flagged in
the U.S. Additionally, the Jones Act considers any facility connected to the sea bottom, such as a wind
turbine foundation, a U.S. port.
However, a WTIV is a very large investment that can only be supported with a pipeline of work. This
study will attempt to clarify what type of installation vessel would work with the local infrastructure
and the pipeline of work that is required to support construction of such a vessel.

2
2 Study Approach and Methods This study assumed a hypothetical, but realistic, set of wind farm developments in the region (based
on current identified wind areas) along with construction and installation methodologies. A set of
functional technical requirements were developed to satisfy the possible build-out scenarios. Concept
designs for both a WTIV and feeder jack-up were developed to satisfy the technical requirements.
Estimating packages were submitted to selected U.S. shipyards to obtain build prices for Jones Act
compliant vessels and a crewing model for a U.S. flagged vessel was created to provide data on
operational costs. The study then established a vessel-specific financial model tracking capital
(CAPEX) and operational expenses to generate Net Present Value (NPV), and Internal Rate of
Return (IRR). A limited number of sensitivity studies in the financial modeling were undertaken.
To be sufficiently general, the study assumed a hypothetical wind farm complete with metocean
conditions (wave heights, wind speeds, current speed) and an offshore installation strategy. This
reflected expectations about potential regional wind farms along with industry practice and trends,
but was not intended to be specific to any particular project and should be taken as indicative only.
The hypothetical scenario defined an envelope of expected construction fundamentals and operations
in which those activities are conducted. These were used to generate a set of functional requirements
for the wind farm installation vessel.
Based on the functional requirements, commercially available designs were selected, or modified
as necessary, for two construction strategies:
• Transit strategy: Installation vessel loading turbine components at the staging area, sailing to installation location, and installing components.
• Feeder strategy: Installation vessel remaining offshore and being fed with wind turbine components by feeder units that transport the components from the staging area to the installation location. The actual installation vessel may be the same as for the transit strategy or a more cost-efficient unit can be used, which does not include the features specifically required for the transit strategy.
These designs formed the basis for the indicative costs and business plan development.

3
Wind farm technology is quickly evolving as turbine sizes are expanding with 10-15 MW designs on the
horizon. Jacket designs continue to be refined and weights optimized. Monopiles are being deployed in
deeper water depths and are, therefore, growing in size and weight. The philosophy adopted in this study
was to look at the leading edge of what was commercially deployed and proven at the time. Where they
were understood and it was reasonable to accommodate them, margins for future growth in turbine size
were allowed for in the design. This study does not address wind farm installation in waters deeper than
55 m where floating foundations (which do not require a WTIV) may prove attractive.
Data for the hypothetical wind farms (including the assumed turbine size and weights) was based on
a composite picture built from several different publicly available sources. It does not, in any way,
represent a particular development; rather, it is a set of conservative assumptions chosen to frame-up
the requirements of the WTIV. Taken together, they represent a design envelope for the WTIV.
A construction and installation methodology was required to drive the functional requirements. For this
reason, several installation methodology assumptions were made. However, there are many possibilities
and individual developments may differ from the one presented here for project specific reasons.

4
3 Regional Wind Farm Developments This study took a sample of potential offshore wind development areas in the Northeast between New
York and Massachusetts (hereafter the Study Area) where existing commercially available bottom fixed
technology may be used. Data on bathymetry, wind, wave, current, and soil conditions are presented.
Eight-megawatt turbines were laid out in a 9 x 9 rotor diameters grid to tally the number of turbines that
could theoretically be installed in the sample area according to water depth range. Details of the wind
turbine and foundation are presented including installation challenges surrounding the foundations and
the strategy chosen to rectify the issue.
Alternative transportation strategies are also discussed. Installation methodologies are presented using
these strategies and used to build an overall project timeline to estimate the likely demand (in vessel
years) for installation vessels on the East Coast.
3.1 Water Depth Survey
NREL report 60942 (Musial, 2013) presents a detailed analysis of possible wind turbine layouts in
the Massachusetts wind area south of Nantucket so, this, along with the New York and Rhode Island
wind areas were chosen as the Study Area. The Musial study is comprised of the lease areas:
OCS A-0500, OCS-A 501, OCS-A 502 and OCS-A 503. The New York area is comprised of the lease
area: OCS-A 512. The Rhode Island area is comprised of the lease areas: OCS-A 486 and OCS-A 487.
Based on the areas, the distribution of water depths was calculated based on bathymetry maps and
summarized in Table 1. This table tallies the number of BOEM blocks (measuring approximately
3-mile x 3-mile) in each water depth range. From that, a distribution was derived and a cumulative
percentage of water depth was calculated and plotted in Figure 1.

5
Table 1. Distribution of Water Depths over the Northeast Study Area
Figure 1. Occurrence of Water Depths over the Northeast Study Area
STUDY AREA 15 20 25 30 35 40 45 50 55 60 65 Σ1 3 4 8 12 272 2 7 22 24 44 21 11 1313 1 2 3 6 12
Σ 2 0 4 6 11 25 22 24 44 21 11 17030 0 100 180 385 1000 990 1200 2420 1260 715 48.71
STUDY AREA 15 20 25 30 35 40 45 50 55 60 65 Σ1 0.0% 0.0% 1.8% 2.4% 4.7% 7.1% 0.0% 0.0% 0.0% 0.0% 0.0% 16%2 1.2% 0.0% 0.0% 0.0% 0.0% 4.1% 12.9% 14.1% 25.9% 12.4% 6.5% 77%3 0.0% 0.0% 0.6% 1.2% 1.8% 3.5% 0.0% 0.0% 0.0% 0.0% 0.0% 7%
Σ 1% 0% 2% 4% 6% 15% 13% 14% 26% 12% 6%CUMUL 1% 1% 4% 7% 14% 28% 41% 55% 81% 94% 100%
NUMBER OF WIND LEASE BLOCKS versus MAXIMUM WATER DEPTH (m)
PERCENTAGE DISTRIBUTION OF WATER DEPTH
0%
10%
20%
30%
40%
50%
60%
70%
80%
90%
100%
15 20 25 30 35 40 45 50 55 60 65
% o
f Are
a Le
ss T
han
Give
n De
pth
Water Depth (m)
Occurence of Water Depths in the North East Study Area ( no tide/storm surge corrections)
Percentage Distribution Cumulative Percentage

6
Water depths are observed to range from 15 m to 65 m with an average of 48.71 m. A design water
depth limit of 45 m would cover only 41% of the Study Area, whereas a depth limit of 55 m would
extend coverage up to 81%. Approximately 40% of the Study Area is between 45 m and 55 m. A final
design water depth of 55 m was taken as a reasonable upper bound for the sample area region considered.
By comparison to other projects in Europe or earlier proposed U.S. wind projects (see Figure 2), this
Study Area is in deeper water. Consequently, foundation types such as monopiles that are successful in
Europe must be requalified for the greater water depth or replaced with an alternate foundation such as a
jacket. For waters beyond approximately 65 m, floating wind solutions may start to become attractive.
Figure 2. Distribution of Project Water Depths (including Europe) (Musial, 2013)
3.2 Wave, Wind and Current Conditions
A formal metocean data report for the region was not available, but a literature search provided
some data points. An analysis of the expected metocean conditions at six sites was presented by
(Damiani, 2016). Their results are summarized in Table 2. Cases 3 and 5 are assumed representative
of the region of interest.

7
Table 2. Metocean Parameters for Six Sites (Damiani, 2016)
a. Hs is significant wave height in a winter storm as limited by breaking wave limit
b. Hmax is the maximum expected wave height as limited by breaking wave limit
c. δ is the expected 1, 000 year storm surge
Monthly distribution of expected wave heights was obtained from NOAA Buoy 44025 (Long Island)
and presented in Table 3.
Table 3. Monthly Wave Statistics Buoy 44025 (NOAA, 2017)
This data is for regular storm conditions. Tropical hurricanes are outside the design envelopes of a
WTIV and not considered here since a WTIV (as a mobile unit) is able to seek shelter in shallow
water outside the main hurricane path.
As shown in Table 3, December is the worst month with a mean significant wave height of 1.6 m and
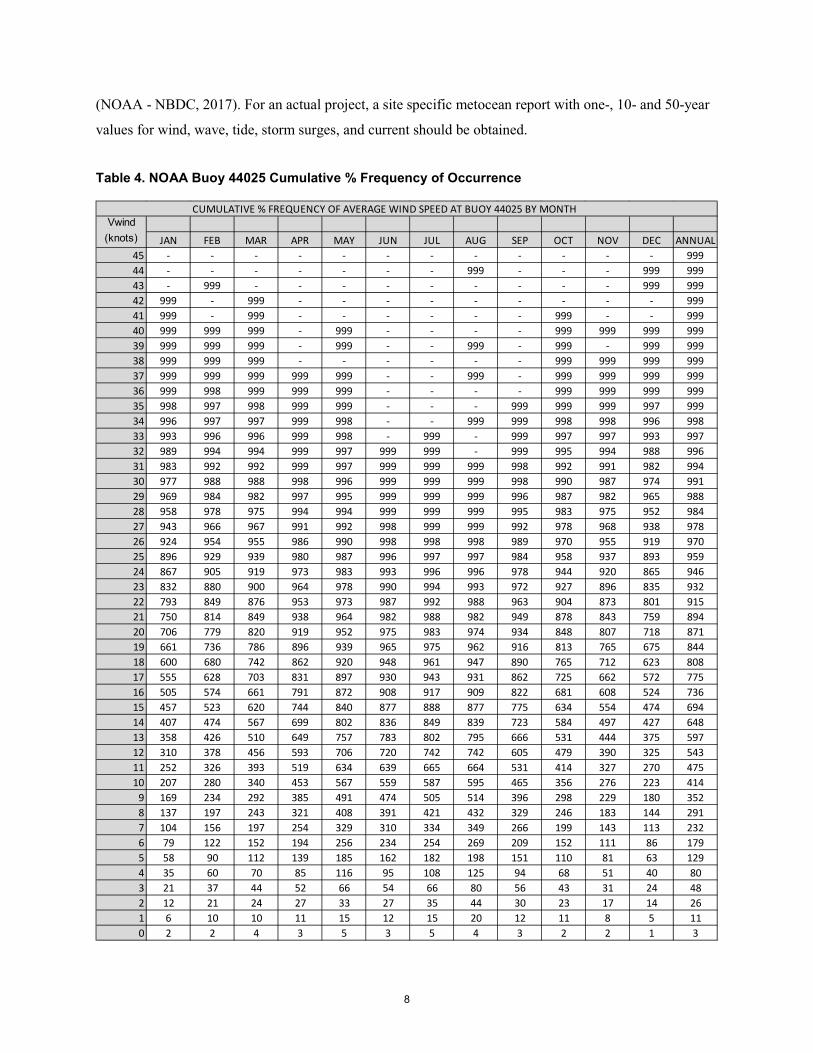
a maximum of 8.5 m. The cumulative distribution of wind speed by month and total annual is presented
in Table 4. The wind speeds reported are eight-minute averages per the National Data Buoy Center
Case Buoy Name Water Hs Hmax Tp HAT δ Hmax DeckDepth 50yr 50yr 50yr 1000yr 1000yr Height
(m) (m) (m) (sec) (m) (m) (m) (m)1 41013 Frying Pan Shoals 23.5 10.82 18.33 13.34 1.26 1.25 18.33 13.22 42035 Galveston 12.8 7.24 9.98 10.91 0.47 6 9.98 133 44025 Long Island 40.8 9.48 17.63 12.48 0.33 2.5 23.26 164 41035 Onslow Bay 9.7 10.46 7.57 13.11 0.83 0.9 7.57 75 44008 Nantucket 65.8 12.15 22.6 14.13 0.79 1.54 28.31 186 42036 W. Tampa 50.6 7.63 14.19 11.2 0.84 1.5 17.81 12.7
Buoy 44025MONTH Hs_mean Hs_max H_ext
(m) (m) (m)JAN 1.5 6.7 12.5FEB 1.5 6.1 11.3MAR 1.4 7.4 13.8APR 1.3 5.4 10.0MAY 1.1 5.0 9.3JUN 1.0 3.5 6.5JUL 1.0 5.1 9.5AUG 1.0 5.6 10.4SEP 1.3 6.7 12.5OCT 1.3 6.0 11.2NOV 1.4 6.5 12.1DEC 1.6 8.5 15.8ANNUAL 1.6 8.5 15.8
Location of Buoy 44025
8
(NOAA - NBDC, 2017). For an actual project, a site specific metocean report with one-, 10- and 50-year
values for wind, wave, tide, storm surges, and current should be obtained.
Table 4. NOAA Buoy 44025 Cumulative % Frequency of Occurrence
CUMULATIVE % FREQUENCY OF AVERAGE WIND SPEED AT BUOY 44025 BY MONTHVwind
(knots) JAN FEB MAR APR MAY JUN JUL AUG SEP OCT NOV DEC ANNUAL45 - - - - - - - - - - - - 99944 - - - - - - - 999 - - - 999 99943 - 999 - - - - - - - - - 999 99942 999 - 999 - - - - - - - - - 99941 999 - 999 - - - - - - 999 - - 99940 999 999 999 - 999 - - - - 999 999 999 99939 999 999 999 - 999 - - 999 - 999 - 999 99938 999 999 999 - - - - - - 999 999 999 99937 999 999 999 999 999 - - 999 - 999 999 999 99936 999 998 999 999 999 - - - - 999 999 999 99935 998 997 998 999 999 - - - 999 999 999 997 99934 996 997 997 999 998 - - 999 999 998 998 996 99833 993 996 996 999 998 - 999 - 999 997 997 993 99732 989 994 994 999 997 999 999 - 999 995 994 988 99631 983 992 992 999 997 999 999 999 998 992 991 982 99430 977 988 988 998 996 999 999 999 998 990 987 974 99129 969 984 982 997 995 999 999 999 996 987 982 965 98828 958 978 975 994 994 999 999 999 995 983 975 952 98427 943 966 967 991 992 998 999 999 992 978 968 938 97826 924 954 955 986 990 998 998 998 989 970 955 919 97025 896 929 939 980 987 996 997 997 984 958 937 893 95924 867 905 919 973 983 993 996 996 978 944 920 865 94623 832 880 900 964 978 990 994 993 972 927 896 835 93222 793 849 876 953 973 987 992 988 963 904 873 801 91521 750 814 849 938 964 982 988 982 949 878 843 759 89420 706 779 820 919 952 975 983 974 934 848 807 718 87119 661 736 786 896 939 965 975 962 916 813 765 675 84418 600 680 742 862 920 948 961 947 890 765 712 623 80817 555 628 703 831 897 930 943 931 862 725 662 572 77516 505 574 661 791 872 908 917 909 822 681 608 524 73615 457 523 620 744 840 877 888 877 775 634 554 474 69414 407 474 567 699 802 836 849 839 723 584 497 427 64813 358 426 510 649 757 783 802 795 666 531 444 375 59712 310 378 456 593 706 720 742 742 605 479 390 325 54311 252 326 393 519 634 639 665 664 531 414 327 270 47510 207 280 340 453 567 559 587 595 465 356 276 223 414
9 169 234 292 385 491 474 505 514 396 298 229 180 3528 137 197 243 321 408 391 421 432 329 246 183 144 2917 104 156 197 254 329 310 334 349 266 199 143 113 2326 79 122 152 194 256 234 254 269 209 152 111 86 1795 58 90 112 139 185 162 182 198 151 110 81 63 1294 35 60 70 85 116 95 108 125 94 68 51 40 803 21 37 44 52 66 54 66 80 56 43 31 24 482 12 21 24 27 33 27 35 44 30 23 17 14 261 6 10 10 11 15 12 15 20 12 11 8 5 110 2 2 4 3 5 3 5 4 3 2 2 1 3

9
There is little information available on current speed, but Figure 3 (AWS Truepower LLC, 2010) shows
current data with a maximum observed peak current is 70 cm/sec. Seasonal averages are maximum in
April, which corresponds to spring outflow from the Hudson River. This seasonal maximum may apply
to the New York lease area, but would not be expected to affect the Massachusetts area.
Note, site-specific data processed to yield the 50-year maximum current speed would be required for
an actual site assessment. For the purposes of this study, 0.7m/s is taken as an indicative value of the
maximum current in the area for preliminary sizing.
Figure 3. Time Series of Surface Currents New York (AWS Truepower LLC, 2010)
3.3 Soil Conditions
No site-specific geotechnical data is available, but indicative soil conditions from the region is included.
As shown in Figure 4, the seabed consists of sand or gravel with an additional shallow layer of clay at
the top in some areas (AWS Truepower LLC, 2010). “Below the benthic sediment layer are strata
consisting of semi-consolidated quartzose sand and gravel overlying glauconitic silty sand and clay.
It is not anticipated that the subsurface geology will impose a significant obstacle to the construction
of a wind project.”

10
Figure 4. Indicative Stratification of Seabed (AWS Truepower LLC, 2010)
Soil conditions may range from high sand content (80% to 100%) in the northern two-thirds of the
area to predominantly silt and clay content in the southern section. There is a risk of embedded rocks
and boulders at some sites. Buried channels may also be present at some sites and should be carefully
evaluated. As noted in AWS Truepower LLC, 2010, sandy sediments may present scouring issues.
All metocean, bathymetry, geophysical, and geotechnical data should be reconfirmed with site-specific
data (refer to SNAME 5-5A (SNAME 5-5A, 2008), ISO 19905-1 Appendix D (ISO 19905-1, 2012),
OGP Guidelines for the conduct of offshore drilling hazard site surveys of 2011, and ISO 19901-8:2004,
Specific Requirements for Offshore Structures – Marine Soil Investigations).
The proposed concept of preloading diagonally on two out of four legs should greatly reduce the risk of
punch-through during WTIV installation, but this should always be carefully verified (refer to SNAME
T&R 5-5A, ISO 19905-1).
3.4 Wind Turbine
Turbine characteristics based on size are presented (Elkinton C, 2014) and summarized in Table 5.
This study assumed that the wind farms use 8-MW turbines. Larger turbines are expected to become
commercially available in the future, but at the time of writing, 8-MW represents a reasonable upper
bound. Margins for future growth in turbine size were allowed for in the design of the WTIV.

11
Table 5. Summary of Wind Turbine Characteristics
3.5 Turbine Foundations
The water ranges from 15 m to 55 m over the Study Area. This is shallow for floating wind and deep
for monopile foundations. Gravity Base Structure foundations were not considered as part of this study
due to their significant weight and the amount of site preparation required to level and resurface the
site offshore.
European developers are familiar and comfortable with monopiles as they have been successful with
the smaller turbine sizes and lower water depths on earlier projects. A survey of monopile installations
to date (See Figure 5) reveals this combination of turbine size and water depth exceeds that which is
typically used currently for monopoles.
TURBINE SIZE (MW)PARAMETER 4 5 6 7 8
ROTOR DIAM (m) 120 135 150 164 175BLADE LENGTH (m) 59 66 73 80 85BLADE WEIGHT (te) 19 23 28 34 40BLADE CHORD(m) 4 5 5 6 6NACELLE WEIGHT(te) 162 239 330 390 450LIFTING FRAME (te) 16 24 33 39 45TOTAL NACELLE(te) 178 263 363 429 495NACELLE LENGTH(m) 13 16 18 20 21NACELLE WIDTH(m) 5.2 6.3 7.4 8.5 9.6TOWER LENGTH (m) 66 74 81 88 94TOWER WEIGHT(te) 185 215 250 280 500TOWER DIAM (m) 5 5.5 6 6.25 6.75TOTAL LENGTH (m) 66 74 81 88 94# SECTIONS 2 2 2 2 2SECTION LENGTH(m) 33 37 41 44 47SECTION WEIGHT(te) 93 108 125 140 250

12
Figure 5. Foundation Type by Water Depth and Turbine Rating (Aaron Smith, 2015)
Monopiles are less efficient from a structural engineering perspective, but easy to manufacture. To
provide sufficient strength against yield and buckling and adequate stiffness to keep the fundamental
natural frequency above the range of excitations, pile diameter and wall thickness increase. This increase
results in very rapid weight growth. Also, there are drivability challenges for large diameter piles and
the risk of hitting embedded boulders.
Lattice jackets are more efficient from a structural engineering perspective, but more complex to
manufacture. Lattice structures use widely spaced legs consisting of a tubular truss structure to
provide stiffness and strength at optimum steel usage.
There is active research in the monopile and jacket communities to push the frontier for both foundations,
optimizing weight and minimizing construction complexities, which makes it impossible to rule out one
or the other for future developments.
However, for the purposes of this study, the turbines will assume to be supported by jackets because they
are light enough for installation by the WTIV and are proven in the offshore oil and gas industry for these
design loads and water depth. There is also significant U.S. experience building jackets. At the current
time, monopiles are not yet considered to be commercially demonstrated for this combination of water
13
depth (55 m) and turbine size (8 MW). Monopiles and gravity base structures may be used in certain
circumstances in the U.S., such as in shallower water, but alternative methods may be required for
installation depending on size and weight. The WTIV from this study could still install the turbines
on top of the foundations.
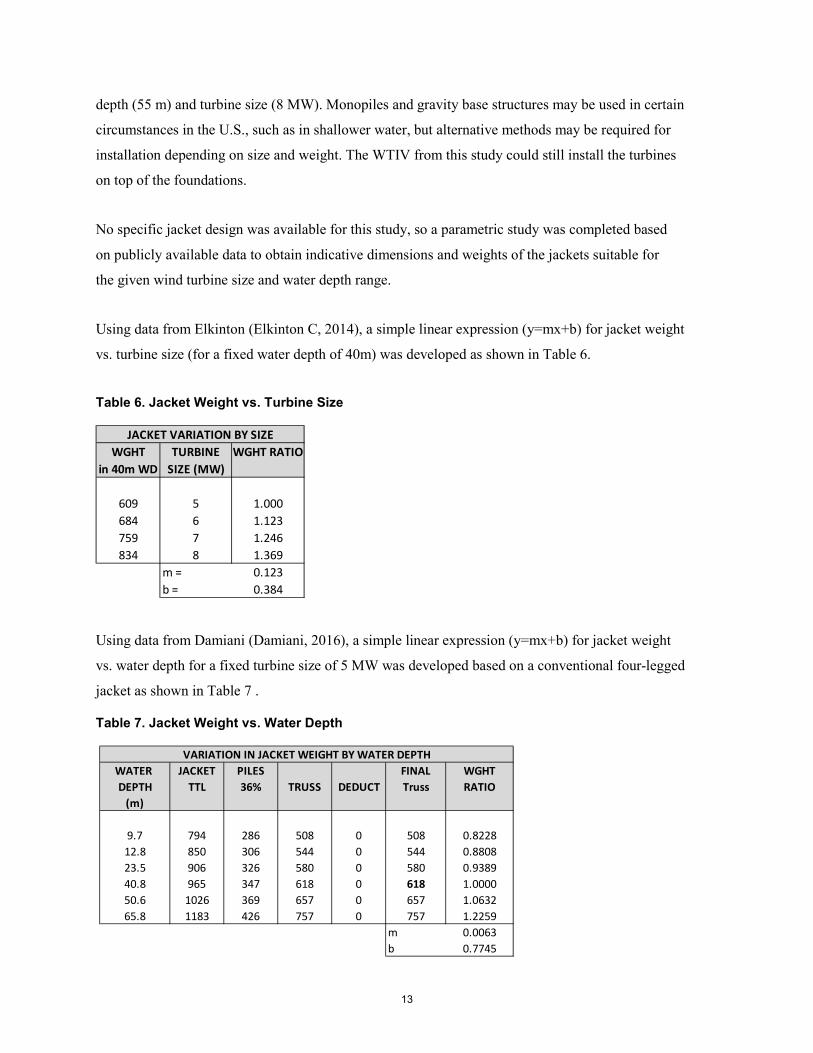
No specific jacket design was available for this study, so a parametric study was completed based
on publicly available data to obtain indicative dimensions and weights of the jackets suitable for
the given wind turbine size and water depth range.
Using data from Elkinton (Elkinton C, 2014), a simple linear expression (y=mx+b) for jacket weight
vs. turbine size (for a fixed water depth of 40m) was developed as shown in Table 6.
Table 6. Jacket Weight vs. Turbine Size
Using data from Damiani (Damiani, 2016), a simple linear expression (y=mx+b) for jacket weight
vs. water depth for a fixed turbine size of 5 MW was developed based on a conventional four-legged
jacket as shown in Table 7 .
Table 7. Jacket Weight vs. Water Depth
WGHT TURBINE WGHT RATIOin 40m WD SIZE (MW)
609 5 1.000684 6 1.123759 7 1.246834 8 1.369
m = 0.123b = 0.384
JACKET VARIATION BY SIZE
WATER JACKET PILES FINAL WGHTDEPTH TTL 36% TRUSS DEDUCT Truss RATIO
(m)
9.7 794 286 508 0 508 0.822812.8 850 306 544 0 544 0.880823.5 906 326 580 0 580 0.938940.8 965 347 618 0 618 1.000050.6 1026 369 657 0 657 1.063265.8 1183 426 757 0 757 1.2259
m 0.0063b 0.7745
VARIATION IN JACKET WEIGHT BY WATER DEPTH
14
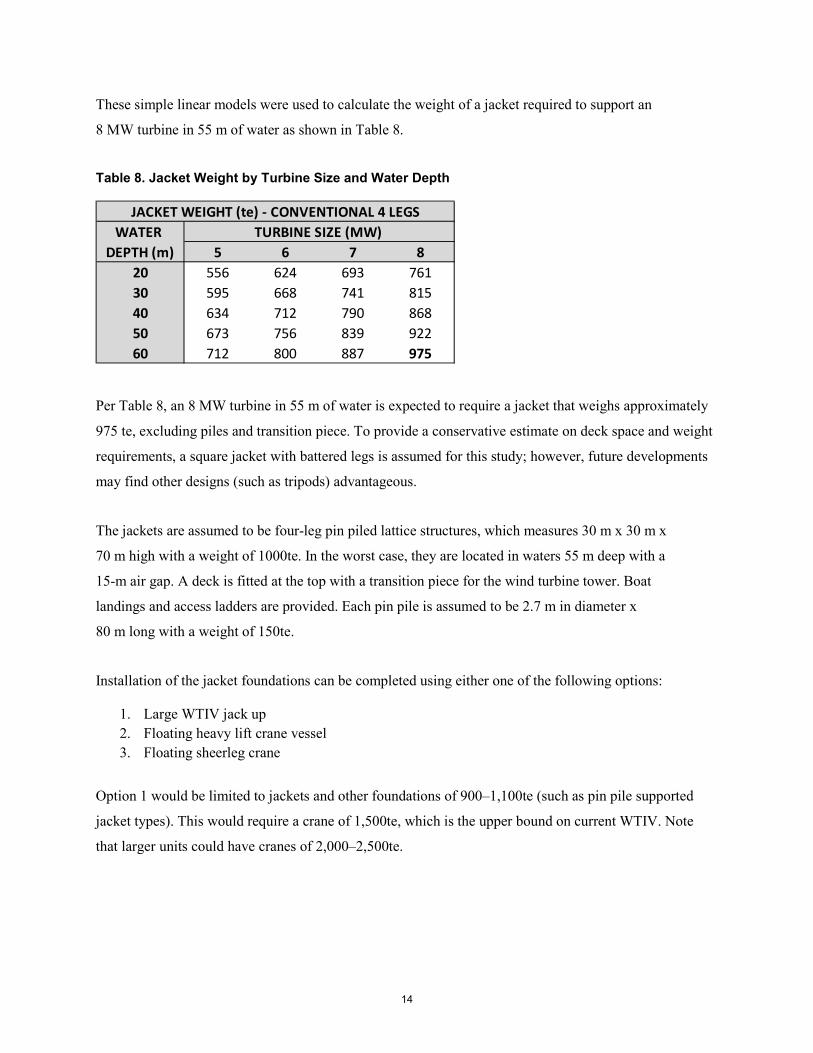
These simple linear models were used to calculate the weight of a jacket required to support an
8 MW turbine in 55 m of water as shown in Table 8.
Table 8. Jacket Weight by Turbine Size and Water Depth
Per Table 8, an 8 MW turbine in 55 m of water is expected to require a jacket that weighs approximately
975 te, excluding piles and transition piece. To provide a conservative estimate on deck space and weight
requirements, a square jacket with battered legs is assumed for this study; however, future developments
may find other designs (such as tripods) advantageous.
The jackets are assumed to be four-leg pin piled lattice structures, which measures 30 m x 30 m x
70 m high with a weight of 1000te. In the worst case, they are located in waters 55 m deep with a
15-m air gap. A deck is fitted at the top with a transition piece for the wind turbine tower. Boat
landings and access ladders are provided. Each pin pile is assumed to be 2.7 m in diameter x
80 m long with a weight of 150te.
Installation of the jacket foundations can be completed using either one of the following options:
1. Large WTIV jack up 2. Floating heavy lift crane vessel 3. Floating sheerleg crane
Option 1 would be limited to jackets and other foundations of 900–1,100te (such as pin pile supported
jacket types). This would require a crane of 1,500te, which is the upper bound on current WTIV. Note
that larger units could have cranes of 2,000–2,500te.
WATER TURBINE SIZE (MW)DEPTH (m) 5 6 7 8
20 556 624 693 76130 595 668 741 81540 634 712 790 86850 673 756 839 92260 712 800 887 975
JACKET WEIGHT (te) - CONVENTIONAL 4 LEGS

15
Option 2 could be used for larger jackets and other foundations (e.g., mat supported sleeve-piled jacket
types), but the market for large floating heavy lift crane vessels is limited. Currently, there are very few
cranes in the 1,500–2,000te range available worldwide and using one of the larger cranes over 2,000 te
would prove cost prohibitive. In addition, to justify the mobilization cost, a volume of work would have
to be guaranteed for the unit.
Option 3 could be for larger jackets and other foundations. While this would open access to the large
sheerleg market and increase leasing options, it is limited to mild weather conditions. In addition,
sheerleg cranes cannot slew and positioning of the load would be more difficult.
For the purposes of this study, option 1 was assumed so the jacket would be installed with the
WTIV. This option was chosen for the following reasons:
• Technically feasible with pin-pile jackets • Allows for more precise positioning of jackets in a wider range of weather windows • Provides full utilization of the WTIV • Removes the need for separate mobilization of a heavy lift vessel or sheerleg crane
To install the foundations, the WTIV will require a 1,500te crane with an outreach of 25 to 30 m.
The 1,500te rating is required to safely lift the 1,000te jacket with allowances for dynamic amplification
factors, splash zone effects such as wave loading and hydrodynamic added mass, lifting gear, and
uncertainties in weight.
3.6 Regional Pipeline of Wind Farm Projects
This study followed the lead of NREL Report 60942 for the purposes of developing an assumed
regional pipeline.
The Study Area from Section 3 was discretized and a pattern of turbines laid-out. The turbine spacing
was taken as 1,600 m (9D), based on 8-MW turbines, and the layout follows a simple rectangular grid
that is not optimized in any way for wake effects or directionality. This should represent an upper bound
on the potential capacity of the existing lease areas in the Study Area and demand for a WTIV. Additional
lease areas off other states outside of the Study Area and new areas leased by BOEM may further increase
demand for a WTIV.
The total number of turbines that could be laid out were tallied by water depth range (summarized
in Table 9).

16
Table 9. Theoretical Capacity of Study Area (Number and Power of Wind Turbines)
For the purposes of this study, the maximum assumed water depth shall be taken as 55 m, as shown
in Table 9, is deep enough to capture 84% of the available wind capacity. The hypothetical build-out
scenario for this study assumes 8-MW wind turbines are used.
3.7 Staging Port
Due to the length of the legs (approximately 90 meters) for a WTIV capable of installing turbines in
55 m of water depth, access to ports without overhead obstructions or concerns with air draft is required.
The Port of New Bedford in Massachusetts has no air draft limitations and a terminal designed to
accommodate offshore wind construction. For entry into port, the WTIV will require passage through
an opening no more than 45.7 m wide with vertical sides. To accommodate the Port of New Bedford,
the maximum allowable hull width is 42.0 m. The water depth in the channel has been dredged to
8.7 m with the maximum allowable draft at 8.7 m. The distance from the staging port to the furthest
point of any wind farm in the Study Area is 120 nautical miles.
3.8 Installation Campaigns
Construction activities in the Northeast are strongly influenced by season. The WTIV is designed to
operate year-round, but some construction activities are limited by season. For example, the optimal
time to install turbines is during the summer when the winds and waves are lowest, trying to install
turbines in winter would result in high downtime spent waiting on weather. Consequently, the
construction activities are divided into campaigns based on their sensitivity to weather.
PHASE WD Sub-Total CUMUL Sub-Total CUMUL CUMUL(m) [#] [#] [MW] [MW] [%]
1 25-40m 189 189 1512 1512 15%2 28-40m 100 289 800 2312 23%3 35-50m 400 689 3200 5512 55%4 50-55m 351 1040 2808 8320 84%5 55-60m 130 1170 1040 9360 94%6 60-65m 72 1242 576 9936 100%
TOTAL: 1242 @ 8MW = 9936 MW
TURBINE COUNT INSTALLED POWER

17
At a high level the installation can be considered as a series of campaigns as shown:
• Installation of piles (See Figure 6) • Installation of jackets (See Figure 7) • Installation of complete turbines (See Figure 8)
The vessel would be configured as appropriate for each campaign.
Campaign 1 requires a pile guide frame along with a survey team and possibly a ground penetrating
sonar to probe the pile locations for embedded rocks. An ROV would be necessary for site survey. The
pile installation is not as sensitive to weather and can be completed in more demanding circumstances
including typical winter conditions. Restrictions on activity due to marine mammals would have to
be considered. Mitigation techniques such as bubble curtains may allow for increased time for
pile installation.
Campaign 2 requires a grouting spread on the deck of the WTIV with a grouting team onboard. As
the lift and installation of the jacket is a weather sensitive operation, these campaigns would preferably
be conducted in early spring or late fall to minimize weather delays.
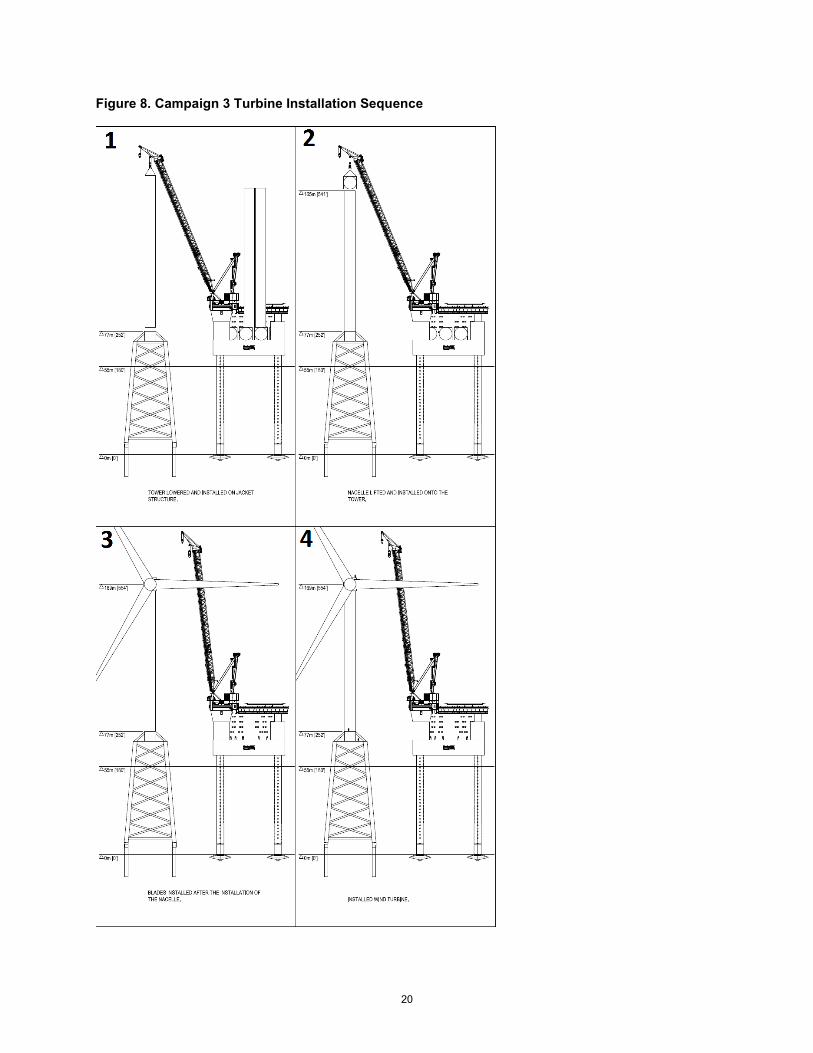
Campaign 3 requires hook-up and commissioning personnel for the wind turbine. Access from the
WTIV to the supporting foundation would be provided by gangway and could only be conducted in
summer or early fall during optimal weather conditions.
Organization by campaigns allow construction activities on units designed for year-round operations.
Also, by splitting into campaigns, the specialty crews will be more efficiently scheduled and through
repetition, become more effective as the job progresses.

18
Figure 6. Campaign 1 Pile Installation Sequence

19
Figure 7. Campaign 2 Jacket Installation Sequence
20
Figure 8. Campaign 3 Turbine Installation Sequence

21
3.9 Experience Factors
The campaigns must be completed multiple times and it is expected that as the crews gain experience,
installation times will improve. For example, in Europe a turbine install can be completed in a single
day, weather permitting. To account for this experience, the campaign times are multiplied by an
experience factor.
Equation 1 𝑻𝑻𝑻𝑻𝑻𝑻𝑻𝑻𝑵𝑵 = 𝑻𝑻𝑵𝑵𝑻𝑻𝑻𝑻𝑻𝑻𝑰𝑰𝑰𝑰(𝐥𝐥𝐥𝐥 (𝟏𝟏+𝑵𝑵))𝑻𝑻𝑬𝑬
INITIAL times and experience factors coefficients are defined in Table 10. These figures should
be updated per individual contractor practice and experience. Feeder options are expected to further
benefit from remaining “rigged up” in field.
Table 10. Experience Factors for Repetitive Operations
Figure 9. Plot of Experience Factors
TRANSIT OPTION FEEDER OPTIONACTIVITY DESCRIPTION INITIAL EF INITIAL EF
1 PIN-PILES(4) 2.55 -0.25 2.1 -0.22 JACKET(1) 3.6 -0.15 2.3 -0.153 TURBINE(1) 3.025 -0.4 2.5 -0.44 IDLE 0 0 0 0

22
3.10 Waiting on Weather (WoW) Factors
The campaigns would have to be completed in different weather conditions, which vary by the time
of year. WoW = percent of time waiting on weather in any given month. For example, this may mean
waiting for lower sea-states to go on location, weather induced delays in tug operations, or lower
wind speeds for lifting operations. Vessel availability, planned and unplanned maintenance, must
also be considered.
Table 11. Vessel Availability and Waiting on Weather Factors
The WoW factor combined with the vessel availability percent is used to determine the number of
campaigns that can be completed in any month. As conditions deteriorate going into winter, the WoW
factors increase and operations become less efficient. Operations vary in weather condition sensitivity.
Pile installation would be the least sensitive and it is assumed they can be installed year-round subject
to the installation vessel’s ability to be on location and being rated for expected storm conditions in the
given water depth. Operations will also be limited due to time-of-year restrictions by federal permitting
agencies due to factors such as marine mammals.
Jacket installations would be limited from spring to late fall. Turbine installations are the most sensitive
and restricted to summer and fall.
Vessel Waiting onHs_mean Availability Weather
(m) (%) (%)JAN 1.5 95 40FEB 1.5 95 40MAR 1.4 95 35APR 1.3 95 25MAY 1.1 95 15JUN 1.0 95 15JUL 1.0 95 15AUG 1.0 95 15SEP 1.3 95 15OCT 1.3 95 15NOV 1.4 95 35DEC 1.4 75 50
23
3.11 Transportation Strategies
Transportation of components and materials to site could be completed using two fundamentally
different strategies: feeder option or transit option. Both feeder and non-feeder options will be
examined to develop the design requirements, capital cost, and business case of each. This will
be done from the vessel owner’s perspective.
In the transit option, a self-propelled WTIV transits into port, loads components and material, and
then transits back to the work site where it will install the components. It will repeat this cycle until
construction is complete. The WTIV in this option is normally fitted with a dynamic positioning
system that can precisely hold the vessel on station (for jacking) or maneuver to a specific location.
In the feeder option, the WTIV remains in the field. A feeder unit is used to transport materials and
components to the field where the WTIV is waiting to install them. Two or more feeder units are
necessary to ensure the WTIV is constantly supplied. The feeder units would need to be jack-up units
to minimize downtime due to weather or persistent swell conditions. Ideally, they would be self-propelled
dynamic positioning units for maximum efficiency in transit and while maneuvering into position on-site
or in harbor. The actual installation vessel may either be the same as the transit strategy or a more cost-
efficient unit can be used that does not include the features specifically required for the transit strategy.
A minimum dynamic positioning class of DP2 will be required for positioning operations near another
asset (Noble Denton 0035, 2013). A DP2 system is fitted with at least two independent computer control
systems and will hold position and heading with the loss of any main single active or passive component,
such as thruster, switchboard, generator, etc. (IMO MSC Circ 64)
3.11.1 Feeder Barge Option
A high-level breakdown of the operations required to complete the campaigns using the feeder barge
strategy is given in Tables 12–15. It is assumed there are two feeder units delivering a constant supply
of material to the installation vessel in the field. It is also assumed the vessels are fully utilized on the
project with 5% downtime for maintenance.
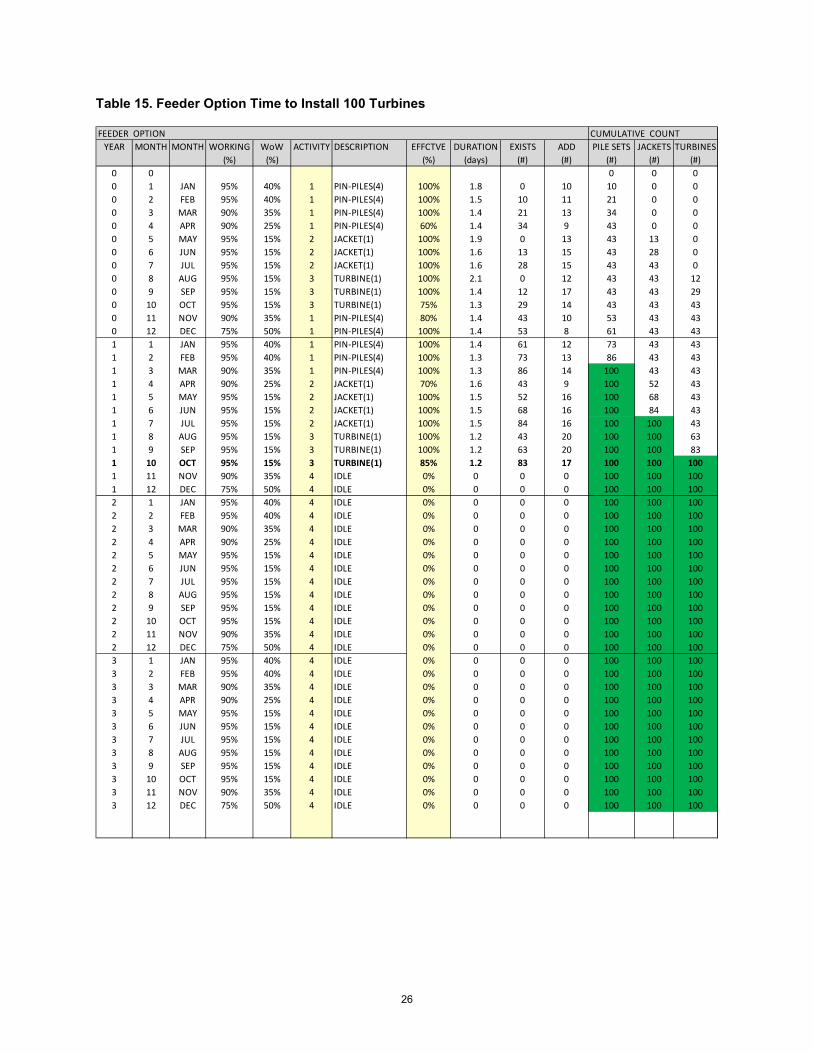
Based on the feeder strategy, it is concluded that it takes 22 months to install a set of 100 turbines,
ssuming year-round operations with two feeder barges feeding a WTIV.

24
Table 12 is for the first 100 turbines. If updated efficiency factors for later projects are applied, this
can be reduced to 21 months.
Table 12. Feeder – Campaign 1 Operational Breakdown
OPERATION A - INSTALL one(1) PILE SET ( 4 total)DESCRIPTION TIME
(hours)TASK # Total time in days: 1.8 TOTAL: 42
2000 POSITION, PRELOAD AND JACK-UP DP 42001 SITE SURVEY with ROV 12002 LIFT AND LOWER FRAME INTO POSITION ON SEABED 32003 LIFT FROM BARGE AND UPEND PILE 1 12004 DRIVE PILE 1 62005 LIFT FROM BARGE AND UPEND PILE 1 12006 DRIVE PILE 2 62007 LIFT FROM BARGE AND UPEND PILE 1 12008 DRIVE PILE 3 62009 LIFT FROM BARGE AND UPEND PILE 1 12010 DRIVE PILE 4 62011 AS-BUILT SURVEY AND METROLOGY 12012 LIFT AND SECURE FRAME 32013 JACK-DOWN AND REFLOAT READY FOR NEXT SET 2
1

25
Table 13. Feeder – Campaign 2 Operational Breakdown
Table 14. Feeder – Campaign 3 Operational Breakdown
OPERATION B- INSTALL one(1) JACKET DESCRIPTION TIME
(hours)TASK # Total time in days: 1.9 TOTAL: 45
2000 POSITION, PRELOAD AND JACK-UP DP 42001 SITE SURVEY with ROV 12002 RIG and CUT SEAFASTENINGS 32003 LIFT, LOWER, STAB AND LEVEL JACKET ON PIN PILES 42004 GROUT AND CURE 242005 UNRIG JACKET 42006 AS-BUILT SURVEY 22007 JACK-DOWN AND REFLOAT READY FOR NEXT SET 3
2
OPERATION C - INSTALL one(1) TURBINE SET (each 8MW)DESCRIPTION TIME
(hours)TASK # Total time in days: 2.1 TOTAL: 50
1000 POSITION, PRELOAD AND JACK-UP DP 41001 RIG AND CUT SEAFASTENINGS ON LOWER TOWER 21002 LIFT AND INSTALL LOWER TOWER 61003 RIG AND CUT SEAFASTENINGS ON UPPER TOWER 21004 LIFT AND INSTALL UPPER TOWER 41005 RIG AND CUT SEAFASTENINGS ON NACELLE/HUB ASSBLY 21006 LIFT AND INSTALL NACELLE/HUB ASSBLY 61007 RIG AND CUT SEAFASTENINGS ON BLADE 1 11008 LIFT AND INSTALL BLADE 1 41009 RIG AND CUT SEAFASTENINGS ON BLADE 2 11010 LIFT AND INSTALL BLADE 2 41011 RIG AND CUT SEAFASTENINGS ON BLADE 3 11012 LIFT AND INSTALL BLADE 3 41013 INTEGRATION ACTIVITIES 61014 JACK-DOWN AND REFLOAT 3
3
26
Table 15. Feeder Option Time to Install 100 Turbines
FEEDER OPTION CUMULATIVE COUNTYEAR MONTH MONTH WORKING WoW ACTIVITY DESCRIPTION EFFCTVE DURATION EXISTS ADD PILE SETS JACKETS TURBINES
(%) (%) (%) (days) (#) (#) (#) (#) (#)0 0 0 0 00 1 JAN 95% 40% 1 PIN-PILES(4) 100% 1.8 0 10 10 0 00 2 FEB 95% 40% 1 PIN-PILES(4) 100% 1.5 10 11 21 0 00 3 MAR 90% 35% 1 PIN-PILES(4) 100% 1.4 21 13 34 0 00 4 APR 90% 25% 1 PIN-PILES(4) 60% 1.4 34 9 43 0 00 5 MAY 95% 15% 2 JACKET(1) 100% 1.9 0 13 43 13 00 6 JUN 95% 15% 2 JACKET(1) 100% 1.6 13 15 43 28 00 7 JUL 95% 15% 2 JACKET(1) 100% 1.6 28 15 43 43 00 8 AUG 95% 15% 3 TURBINE(1) 100% 2.1 0 12 43 43 120 9 SEP 95% 15% 3 TURBINE(1) 100% 1.4 12 17 43 43 290 10 OCT 95% 15% 3 TURBINE(1) 75% 1.3 29 14 43 43 430 11 NOV 90% 35% 1 PIN-PILES(4) 80% 1.4 43 10 53 43 430 12 DEC 75% 50% 1 PIN-PILES(4) 100% 1.4 53 8 61 43 431 1 JAN 95% 40% 1 PIN-PILES(4) 100% 1.4 61 12 73 43 431 2 FEB 95% 40% 1 PIN-PILES(4) 100% 1.3 73 13 86 43 431 3 MAR 90% 35% 1 PIN-PILES(4) 100% 1.3 86 14 100 43 431 4 APR 90% 25% 2 JACKET(1) 70% 1.6 43 9 100 52 431 5 MAY 95% 15% 2 JACKET(1) 100% 1.5 52 16 100 68 431 6 JUN 95% 15% 2 JACKET(1) 100% 1.5 68 16 100 84 431 7 JUL 95% 15% 2 JACKET(1) 100% 1.5 84 16 100 100 431 8 AUG 95% 15% 3 TURBINE(1) 100% 1.2 43 20 100 100 631 9 SEP 95% 15% 3 TURBINE(1) 100% 1.2 63 20 100 100 831 10 OCT 95% 15% 3 TURBINE(1) 85% 1.2 83 17 100 100 1001 11 NOV 90% 35% 4 IDLE 0% 0 0 0 100 100 1001 12 DEC 75% 50% 4 IDLE 0% 0 0 0 100 100 1002 1 JAN 95% 40% 4 IDLE 0% 0 0 0 100 100 1002 2 FEB 95% 40% 4 IDLE 0% 0 0 0 100 100 1002 3 MAR 90% 35% 4 IDLE 0% 0 0 0 100 100 1002 4 APR 90% 25% 4 IDLE 0% 0 0 0 100 100 1002 5 MAY 95% 15% 4 IDLE 0% 0 0 0 100 100 1002 6 JUN 95% 15% 4 IDLE 0% 0 0 0 100 100 1002 7 JUL 95% 15% 4 IDLE 0% 0 0 0 100 100 1002 8 AUG 95% 15% 4 IDLE 0% 0 0 0 100 100 1002 9 SEP 95% 15% 4 IDLE 0% 0 0 0 100 100 1002 10 OCT 95% 15% 4 IDLE 0% 0 0 0 100 100 1002 11 NOV 90% 35% 4 IDLE 0% 0 0 0 100 100 1002 12 DEC 75% 50% 4 IDLE 0% 0 0 0 100 100 1003 1 JAN 95% 40% 4 IDLE 0% 0 0 0 100 100 1003 2 FEB 95% 40% 4 IDLE 0% 0 0 0 100 100 1003 3 MAR 90% 35% 4 IDLE 0% 0 0 0 100 100 1003 4 APR 90% 25% 4 IDLE 0% 0 0 0 100 100 1003 5 MAY 95% 15% 4 IDLE 0% 0 0 0 100 100 1003 6 JUN 95% 15% 4 IDLE 0% 0 0 0 100 100 1003 7 JUL 95% 15% 4 IDLE 0% 0 0 0 100 100 1003 8 AUG 95% 15% 4 IDLE 0% 0 0 0 100 100 1003 9 SEP 95% 15% 4 IDLE 0% 0 0 0 100 100 1003 10 OCT 95% 15% 4 IDLE 0% 0 0 0 100 100 1003 11 NOV 90% 35% 4 IDLE 0% 0 0 0 100 100 1003 12 DEC 75% 50% 4 IDLE 0% 0 0 0 100 100 100

27
Table 15 tracks the accumulation of piles, jackets, and turbines over time. The working column
represents the amount of time the vessels are available and working on-site. The WoW is a seasonal
correction for the number of days lost due to weather. The %Effective can be adjusted to account for
discretionary time lost for refits, maintenance of because of idle time due to operational reasons. Each
activity will trigger a duration to complete and tally the number of relevant items already installed. The
number added is then calculated based on this duration, corrected for %WoW and %Effective, and added
to the appropriate tally.
3.11.2 Transit Unit Option
A high-level breakdown of the operations required to complete the campaigns using the transit unit
option is displayed in the following tables.

28
Table 16. Transit Option – Campaign 1 Operational Breakdown
TRANSIT OPTIONCAMPAIGN 1 - INSTALL four(4) PILE SETS ( 16 total) - Part 1DESCRIPTION TIME
(hours)TASK # Total time in days = 9.1 / 4-sets = 2.3 days/1-set 217.2
1000 LOAD AND SECURE FRAME 4 hr 41001 LOAD 16 PILES @ 1 hr/pile 162000 TRANSIT TO SITE 120 nm @ 9 kts = 13.33000 POSITION, PRELOAD AND JACK-UP 43001 SITE SURVEY with ROV 13002 LIFT AND LOWER FRAME INTO POSITION ON SEABED 33003 LIFT AND UPEND PILE 1 13004 DRIVE PILE 1 63005 LIFT AND UPEND PILE 2 13006 DRIVE PILE 2 63007 LIFT AND UPEND PILE 3 13008 DRIVE PILE 3 63009 LIFT AND UPEND PILE 4 13010 DRIVE PILE 4 63011 AS-BUILT SURVEY AND METROLOGY 13012 LIFT AND SECURE FRAME 33013 JACK-DOWN AND REFLOAT 24000 TRANSIT TO SITE 2 3 nm @ 9 kts = 0.34001 POSITION, PRELOAD AND JACK-UP 44002 LIFT AND LOWER FRAME INTO POSITION ON SEABED 14003 SITE SURVEY with ROV 34004 LIFT AND UPEND PILE 1 14005 DRIVE PILE 1 64006 LIFT AND UPEND PILE 2 14007 DRIVE PILE 2 64008 LIFT AND UPEND PILE 3 14009 DRIVE PILE 3 64010 LIFT AND UPEND PILE 4 14011 DRIVE PILE 4 64012 AS-BUILT SURVEY AND METROLOGY 14013 LIFT AND SECURE FRAME 34014 JACK-DOWN AND REFLOAT 2
1

29
Table 16 continued
TRANSIT OPTIONCAMPAIGN 1 - INSTALL four(4) PILE SETS ( 16 total) - Part 2DESCRIPTION TIME
(hours)TASK # Total time in days = 9.1 / 4-sets = 2.3 days/1-set 217.2
5000 TRANSIT TO SITE 3 3 nm @ 9 kts = 0.35001 POSITION, PRELOAD AND JACK-UP 45002 LIFT AND LOWER FRAME INTO POSITION ON SEABED 15003 SITE SURVEY with ROV 35004 LIFT AND UPEND PILE 1 15005 DRIVE PILE 1 65006 LIFT AND UPEND PILE 2 15007 DRIVE PILE 2 65008 LIFT AND UPEND PILE 3 15009 DRIVE PILE 3 65010 LIFT AND UPEND PILE 4 15011 DRIVE PILE 4 65012 AS-BUILT SURVEY AND METROLOGY 15013 LIFT AND SECURE FRAME 35014 JACK-DOWN AND REFLOAT 26000 TRANSIT TO SITE 4 3 nm @ 9 kts = 0.36001 POSITION, PRELOAD AND JACK-UP 46002 LIFT AND LOWER FRAME INTO POSITION ON SEABED 16003 SITE SURVEY with ROV 36004 LIFT AND UPEND PILE 1 16005 DRIVE PILE 1 66006 LIFT AND UPEND PILE 2 16007 DRIVE PILE 2 66008 LIFT AND UPEND PILE 3 16009 DRIVE PILE 3 66010 LIFT AND UPEND PILE 4 16011 DRIVE PILE 4 66012 AS-BUILT SURVEY AND METROLOGY 16013 LIFT AND SECURE FRAME 36014 AS-BUILT SURVEY AND METROLOGY 26015 JACK-DOWN AND REFLOAT 37000 RETURN TO PORT 120 nm @ 10 kts = 12
1

30
Table 17. Transit Option – Campaign 2 Operational Breakdown
TRANSIT OPTIONCAMPAIGN 2 - INSTALL one(1) JACKET DESCRIPTION TIME
(hours)TASK # Total time in days: 3.5 TOTAL: 83.6
1000 LOAD AND SECURE JACKET ON CRIBBING 12 hr 1210012000 TRANSIT TO SITE 120 nm @ 9 kts = 13.33000 POSITION, PRELOAD AND JACK-UP 43001 SITE SURVEY with ROV 13002 RIG and CUT SEAFASTENINGS 33003 LIFT, LOWER, STAB AND LEVEL JACKET ON PIN PILES 43004 GROUT AND CURE 243005 UNRIG JACKET 43006 AS-BUILT SURVEY 23007 JACK-DOWN AND REFLOAT 33008 RETURN TO PORT 120 nm @ 9 kts = 13.3
2

31
Table 18. Transit Option – Campaign 3 Operational Breakdown
TRANSIT OPTIONCAMPAIGN 3 - INSTALL four(4) TURBINE SETS (each 8MW)DESCRIPTION TIME
(hours)TASK # Total time in days = 10.4 / 4-sets = 2.6 days/1-set 249.5
1000 LOAD AND SECURE 8 TOWER SECTIONS 8 hr 81001 LOAD AND SECURE 4 NACELLES 8 hr 81002 LOAD AND SECURE 12 BLADES 6 hr 610032000 TRANSIT TO SITE 1 120 nm @ 9 kts = 13.32001 POSITION, PRELOAD AND JACK-UP 42002 RIG AND CUT SEAFASTENINGS ON LOWER TOWER 22003 LIFT AND INSTALL LOWER TOWER 62004 RIG AND CUT SEAFASTENINGS ON UPPER TOWER 22005 LIFT AND INSTALL UPPER TOWER 42006 RIG AND CUT SEAFASTENINGS ON NACELLE/HUB ASSBLY 22007 LIFT AND INSTALL NACELLE/HUB ASSBLY 62008 RIG AND CUT SEAFASTENINGS ON BLADE 1 12009 LIFT AND INSTALL BLADE 1 42010 RIG AND CUT SEAFASTENINGS ON BLADE 2 12011 LIFT AND INSTALL BLADE 2 42012 RIG AND CUT SEAFASTENINGS ON BLADE 3 12013 LIFT AND INSTALL BLADE 3 42014 INTEGRATION ACTIVITIES 62015 JACK-DOWN AND REFLOAT 33000 TRANSIT TO SITE 2 3 nm @ 9 kts = 0.33001 POSITION, PRELOAD AND JACK-UP 43002 RIG AND CUT SEAFASTENINGS ON LOWER TOWER 23003 LIFT AND INSTALL LOWER TOWER 63004 RIG AND CUT SEAFASTENINGS ON UPPER TOWER 23005 LIFT AND INSTALL UPPER TOWER 43006 RIG AND CUT SEAFASTENINGS ON NACELLE/HUB ASSBLY 23007 LIFT AND INSTALL NACELLE/HUB ASSBLY 63008 RIG AND CUT SEAFASTENINGS ON BLADE 1 13009 LIFT AND INSTALL BLADE 1 43010 RIG AND CUT SEAFASTENINGS ON BLADE 2 13011 LIFT AND INSTALL BLADE 2 43012 RIG AND CUT SEAFASTENINGS ON BLADE 3 13013 LIFT AND INSTALL BLADE 3 43014 INTEGRATION ACTIVITIES 63015 JACK-DOWN AND REFLOAT 3
3
32
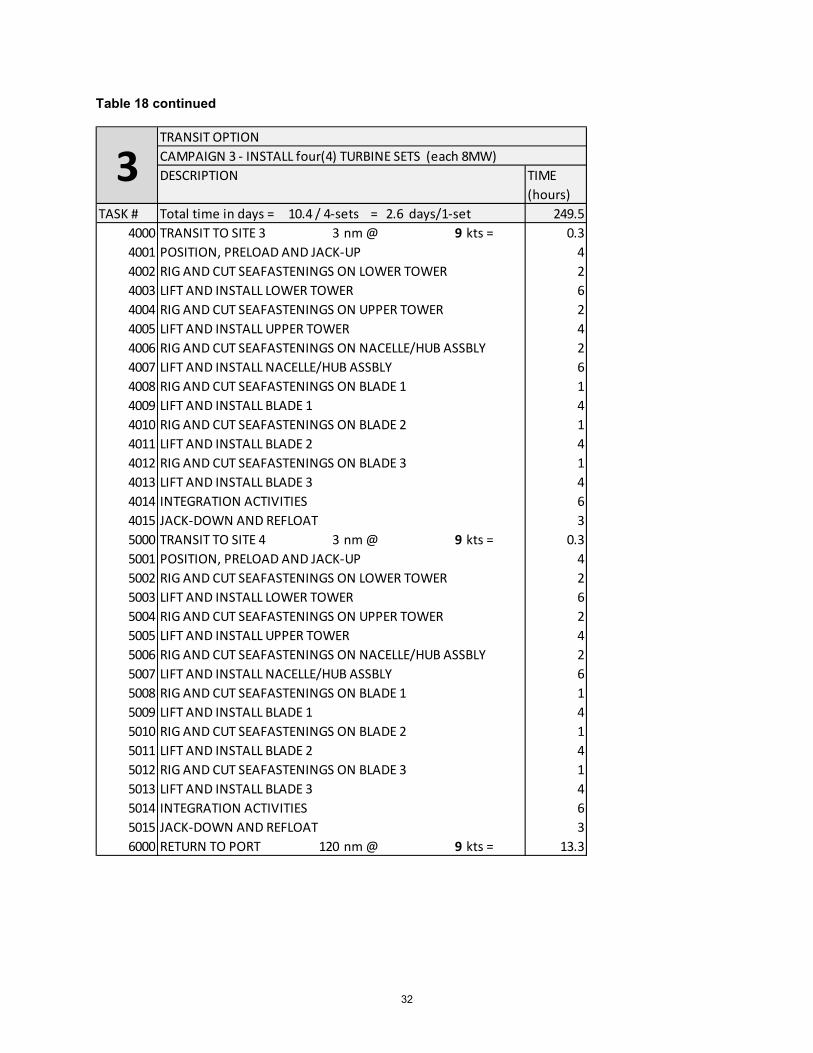
Table 18 continued
TRANSIT OPTIONCAMPAIGN 3 - INSTALL four(4) TURBINE SETS (each 8MW)DESCRIPTION TIME
(hours)TASK # Total time in days = 10.4 / 4-sets = 2.6 days/1-set 249.5
4000 TRANSIT TO SITE 3 3 nm @ 9 kts = 0.34001 POSITION, PRELOAD AND JACK-UP 44002 RIG AND CUT SEAFASTENINGS ON LOWER TOWER 24003 LIFT AND INSTALL LOWER TOWER 64004 RIG AND CUT SEAFASTENINGS ON UPPER TOWER 24005 LIFT AND INSTALL UPPER TOWER 44006 RIG AND CUT SEAFASTENINGS ON NACELLE/HUB ASSBLY 24007 LIFT AND INSTALL NACELLE/HUB ASSBLY 64008 RIG AND CUT SEAFASTENINGS ON BLADE 1 14009 LIFT AND INSTALL BLADE 1 44010 RIG AND CUT SEAFASTENINGS ON BLADE 2 14011 LIFT AND INSTALL BLADE 2 44012 RIG AND CUT SEAFASTENINGS ON BLADE 3 14013 LIFT AND INSTALL BLADE 3 44014 INTEGRATION ACTIVITIES 64015 JACK-DOWN AND REFLOAT 35000 TRANSIT TO SITE 4 3 nm @ 9 kts = 0.35001 POSITION, PRELOAD AND JACK-UP 45002 RIG AND CUT SEAFASTENINGS ON LOWER TOWER 25003 LIFT AND INSTALL LOWER TOWER 65004 RIG AND CUT SEAFASTENINGS ON UPPER TOWER 25005 LIFT AND INSTALL UPPER TOWER 45006 RIG AND CUT SEAFASTENINGS ON NACELLE/HUB ASSBLY 25007 LIFT AND INSTALL NACELLE/HUB ASSBLY 65008 RIG AND CUT SEAFASTENINGS ON BLADE 1 15009 LIFT AND INSTALL BLADE 1 45010 RIG AND CUT SEAFASTENINGS ON BLADE 2 15011 LIFT AND INSTALL BLADE 2 45012 RIG AND CUT SEAFASTENINGS ON BLADE 3 15013 LIFT AND INSTALL BLADE 3 45014 INTEGRATION ACTIVITIES 65015 JACK-DOWN AND REFLOAT 36000 RETURN TO PORT 120 nm @ 9 kts = 13.3
3
33
Table 19. Transit Option Time to Install 100 turbines
TRANSIT OPTION CUMULATIVE COUNTYEAR MONTH MONTH WORKING WoW ACTIVITY DESCRIPTION EFFCTVE DURATION EXISTS ADD PILE SETS JACKETS TURBINES
(%) (%) (%) (days) (#) (#) (#) (#) (#)0 0 0 0 00 1 JAN 95% 40% 1 PIN-PILES(4) 100% 2.3 0 7 7 0 00 2 FEB 95% 40% 1 PIN-PILES(4) 100% 1.9 7 9 16 0 00 3 MAR 90% 35% 1 PIN-PILES(4) 100% 1.8 16 10 26 0 00 4 APR 90% 25% 2 JACKET(1) 100% 3.5 0 6 26 6 00 5 MAY 95% 15% 2 JACKET(1) 100% 3.2 6 8 26 14 00 6 JUN 95% 15% 2 JACKET(1) 100% 3 14 8 26 22 00 7 JUL 95% 15% 2 JACKET(1) 100% 2.9 22 8 26 30 00 8 AUG 95% 15% 3 TURBINE(1) 100% 2.6 0 9 26 30 90 9 SEP 95% 15% 3 TURBINE(1) 100% 1.9 9 13 26 30 220 10 OCT 95% 15% 3 TURBINE(1) 40% 1.6 22 6 26 30 280 11 NOV 90% 35% 1 PIN-PILES(4) 70% 1.7 26 7 33 30 280 12 DEC 75% 50% 1 PIN-PILES(4) 90% 1.7 33 6 39 30 281 1 JAN 95% 40% 1 PIN-PILES(4) 100% 1.6 39 11 50 30 281 2 FEB 95% 40% 1 PIN-PILES(4) 100% 1.6 50 11 61 30 281 3 MAR 90% 35% 1 PIN-PILES(4) 100% 1.6 61 11 72 30 281 4 APR 90% 25% 2 JACKET(1) 100% 2.9 30 7 72 37 281 5 MAY 95% 15% 2 JACKET(1) 100% 2.9 37 8 72 45 281 6 JUN 95% 15% 2 JACKET(1) 100% 2.9 45 8 72 53 281 7 JUL 95% 15% 2 JACKET(1) 100% 2.8 53 9 72 62 281 8 AUG 95% 15% 2 JACKET(1) 100% 2.8 62 9 72 71 281 9 SEP 95% 15% 3 TURBINE(1) 100% 1.6 28 15 72 71 431 10 OCT 95% 15% 3 TURBINE(1) 100% 1.5 43 16 72 71 591 11 NOV 90% 35% 1 PIN-PILES(4) 100% 1.6 72 11 83 71 591 12 DEC 75% 50% 4 IDLE 100% 0 0 0 83 71 592 1 JAN 95% 40% 1 PIN-PILES(4) 60% 1.6 83 6 89 71 592 2 FEB 95% 40% 1 PIN-PILES(4) 100% 1.6 89 11 100 71 592 3 MAR 90% 35% 2 JACKET(1) 100% 2.8 71 6 100 77 592 4 APR 90% 25% 2 JACKET(1) 100% 2.8 77 7 100 84 592 5 MAY 95% 15% 2 JACKET(1) 100% 2.8 84 9 100 93 592 6 JUN 95% 15% 2 JACKET(1) 80% 2.8 93 7 100 100 592 7 JUL 95% 15% 3 TURBINE(1) 100% 1.5 59 16 100 100 752 8 AUG 95% 15% 3 TURBINE(1) 100% 1.4 75 17 100 100 922 9 SEP 95% 15% 3 TURBINE(1) 45% 1.4 92 8 100 100 1002 10 OCT 95% 15% 4 IDLE 100% 0 0 0 100 100 1002 11 NOV 90% 35% 4 IDLE 100% 0 0 0 100 100 1002 12 DEC 75% 50% 4 IDLE 100% 0 0 0 100 100 1003 1 JAN 95% 40% 4 IDLE 100% 0 0 0 100 100 1003 2 FEB 95% 40% 4 IDLE 100% 0 0 0 100 100 1003 3 MAR 90% 35% 2 JACKET(1) 60% 2.8 100 4 100 104 1003 4 APR 90% 25% 2 JACKET(1) 60% 2.8 104 4 100 108 1003 5 MAY 95% 15% 3 TURBINE(1) 100% 1.4 100 17 100 108 1173 6 JUN 95% 15% 3 TURBINE(1) 60% 1.4 117 10 100 108 1273 7 JUL 95% 15% 3 TURBINE(1) 80% 1.4 127 14 100 108 1413 8 AUG 95% 15% 4 IDLE 100% 0 0 0 100 108 1413 9 SEP 95% 15% 4 IDLE 100% 0 0 0 100 108 1413 10 OCT 95% 15% 4 IDLE 100% 0 0 0 100 108 1413 11 NOV 90% 35% 4 IDLE 100% 0 0 0 100 108 1413 12 DEC 75% 50% 4 IDLE 100% 0 0 0 100 108 141

34
3.11.3 Build-out Schedules for Transit and Feeder Options
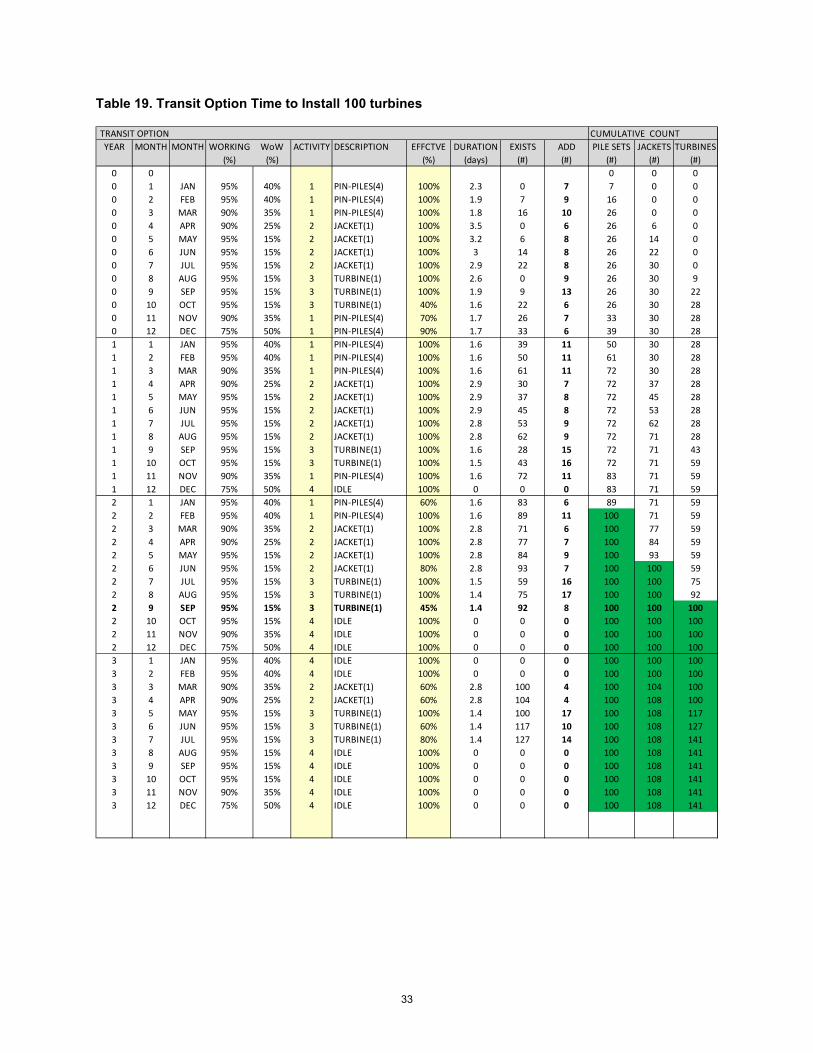
The build out rates were estimated based on the time required to install a group of 100 turbines. Using
a feeder barge option, a group of 100 turbines can be installed in approximately 22 months for the first
project and 21 months for later ones. Using a self-propelled transit WTIV option, a group of 100 turbines
can be installed in approximately 33 months for the first project and 28 months for later ones.
Assuming a full build out of the Study Area, there is at least 23 vessel years of work out to the
55 m contour and an additional three vessel years of work out to the 65 m contour based on the
transit vessel strategy (Table 20).
There is at least 18 vessel years of work out to the 55 m contour and an additional three vessel years
of work out to the 65 m contour based on the feeder strategy (Table 21).
Table 20. Available Vessel Years of Work vs. Max Water Depth with Transit Option
TRANSIT VESSEL OPTION - MAX BUILD OUT IN STUDY AREAMAX INSTALLED
PHASE GROUP WATER ANNUAL CUMUL CUMUL YEAR[m] [#] [#] [MW]
1 1 40 100 100 800 31 2 40 89 189 1512 52 1 40 100 289 2312 73 1 50 100 389 3112 93 2 50 100 489 3912 113 3 50 100 589 4712 133 4 50 100 689 5512 154 1 55 100 789 6312 174 2 55 81 870 6960 194 3 55 100 970 7760 214 4 55 70 1040 8320 235 1 60 53 1093 8744 245 2 60 8 1101 8808 245 3 60 59 1160 9280 255 4 60 10 1170 9360 256 1 65 3 1173 9384 256 2 65 4 1177 9416 256 3 65 44 1221 9768 266 4 65 21 1242 9936 26

35
Table 21. Available Vessel Years of Work vs. Max Water Depth with Feeder Option
The schedules in tables 20 and 21 were developed to feed the financial model in this study.
The actual schedules will depend on individual development decisions. There are many factors beyond
scheduling to consider when deciding on the transportation strategy, such as project economics and
how the Jones Act could be interpreted for a specific project (i.e., if exemptions/waivers are granted).
Individual developers will need project specific financing details to determine if the five years of time
saved justifies the additional cost of two feeder units. Such matters are project specific and are outside
the scope of the current study, which simply presents both options as data points for future consideration
and assessment.
FEEDER VESSEL OPTION - MAX BUILD OUT IN STUDY AREAMAX INSTALLED
PHASE GROUP WATER ANNUAL CUMUL CUMUL YEAR[m] [#] [#] [MW]
1 1 40 100 100 800 21 2 40 89 189 1512 42 1 40 100 289 2312 43 1 50 100 389 3112 63 2 50 100 489 3912 83 3 50 100 589 4712 103 4 50 100 689 5512 124 1 55 100 789 6312 144 2 55 81 870 6960 154 3 55 100 970 7760 174 4 55 70 1040 8320 185 1 60 53 1093 8744 195 2 60 8 1101 8808 195 3 60 59 1160 9280 205 4 60 10 1170 9360 206 1 65 3 1173 9384 206 2 65 4 1177 9416 206 3 65 44 1221 9768 216 4 65 21 1242 9936 21

36
4 Functional Requirements for Installation Vessel 4.1 Philosophy
The philosophy is to use a self-contained WTIV that can perform as many functions as possible required
for turbine installation. The unit should be capable of safely and securely handling the required weights
at the heights/reaches demanded from a platform designed for the on-site water depths and metocean
conditions. It should do so in a way that does not place any of the personnel or the components at
unnecessary risk.
Wind farm installation should be a repetitive assembly-line process and designed for the lowest
complexity possible with installation equipment supporting simplicity. The installation method
and equipment should:
• Reduce the risk of schedule delays through improved operability and simplicity of operation • Reduce the number of operations required offshore • Reduce personnel exposure from working in small boats, over the side, or at height • Reduce incidence of overhead loads and equipment damage risk • Maintain positive control of all loads using intelligent tugger systems, installation aids
and upending equipment/tools • Increase efficiency of operations to reduce completion time • Provide flexibility for multiple functions • Provide deck space, handling gear, transportation and accommodation to support the different
work-crews such as ROV crew, turbine installation crew, commissioning personnel, etc. • Have sufficient margin/flexibility to adapt to changing requirements • Increase weather windows • Ease loading operations in port • Support lifting operations from the back of floating barges or supply vessels • Support lowering operations through the splash zone • Allow high-accuracy positioning of components such as blades and hold them
steady throughout the connection process
4.2 Core Functional Requirements for both Options
4.2.1 Rules
The unit is required to satisfy all applicable rules and regulations for U.S. flag and the U.S. Coast Guard.
The unit will be built and classed with a recognized classification society such as American Bureau of
Shipping or Det Norske Veritas–Germanischer Lloyd.

37
Means of evacuation shall accommodate the full range of possible air gaps. Essential services such
as firewater or cooling water will be consistently provided, even while in jacked-up mode.
4.2.2 Elevated Conditions
For an actual project, a site-specific, metocean report with one-, 10-, and 50-year extreme values
for wind, wave, tide, storm surges, and current should be obtained. In addition to that, site-specific
geo-technical data should be obtained per the requirements of ISO 19901-8 “Marine Soil Investigations”
or OGPs’ “Guidelines for the conduct of offshore drilling hazard site.” The unit should then pass a
site-specific assessment using these conditions per SNAME 5-5A or ISO 19905.
For design purposes, to ensure a reasonable degree of year-round operability, the vessels will have
the ability to withstand the 50-year winter storm in the elevated condition for New York. Maximum
water depth is 50 m in winter and 55 m in summer. Any conditions exceeding these limits will require
the unit to move off-station to sheltered waters. Winter operations off Nantucket will be limited to
shallower water in accordance with the nomograms in the approved operating manual. Fifty-year
metocean values for offshore New York (see Table 2) are rounded up as shown in Table 22.
Table 22. Summary of Elevated Condition Design Values for NYS Winter Storm (see Table 2)
.
Additionally, the associated one-minute (non-hurricane) wind at 10 m is to be taken as 38 m/s (74 knots).
This value is a typical limiting wind speed for the elevated condition of large WTIV units and will ensure
a reasonable degree of year-round operability. For comparison, the 50-year site-specific wind speed was
not available; however, from Table 4, the wind speed is expected to be less than 45 knots with an annual
non-exceedance of 0.999. The maximum current is to be taken as 1.2 m/s (2.3 knots), which is a typical
limiting current speed for the elevated condition of large WTIV units. For comparison, Figure 3 shows
a peak observation of 0.7m/s.
50 yr Design Values NY Design
Hs_50yr (m) 9.48 10Hmax_50yr (m) 17.63 18Tp_50yr (sec) 12.48 14HAT (m) 0.33 0.5Storm Surge (m) 2.5 2.5

38
4.2.3 Afloat
While afloat, the vessel is required to comply with all applicable stability regulations from the
U.S. Flag administration as well as IMO MODU Code. Stability will be verified for all applicable
loading conditions. The vessel must transit at a speed of at least nine knots under its own power and
have a dynamic positioning system to facilitate port entry and positioning at the turbine locations.
4.2.4 Jacking and Preloading
While afloat, the vessels must be capable of going on location and jacking-up in sea states of at least
1.5m (Hs), surface currents of 1.5 knots and wind of 20 knots all acting collinearly. The vessel will be
supplied with a high-speed continuous jacking system suitably designed for the total elevated weight with
maximum variable deck load (VDL) and 100–150 jacking moves per year for a minimum of 20 years.
4.2.5 GeoTechnical Data
No site-specific geotechnical data is available, but indicative soil conditions from the region are given
in Section 3.3. Based on the limited information available, the design should assume limited penetration
and low spudcan fixity.
4.2.6 Design Temperatures
Design temperatures shall be suitable for year-round operation in the Northeast and the Gulf of Mexico.
Steel Design temperature: -10°C (except for leg footings) 0°C (for leg footings) For HVAC: Maximum ambient temperature: +35°C, 100%RH +50°C, 15%RH Minimum ambient temperature: -10°C Maximum seawater temperature: +35°C Minimum seawater temperature: 0°C
4.2.7 Principal Dimensions, Capacities, and Deck Loads
For design purposes, the beam of the vessels are not to exceed 42 m and the transit draft of unit should
not exceed 7.9m (including the tip of the spudcans). The staging ports are assumed to have no overhead
limits, navigational channels of 9-10m water depth, and open widths of 45.72 m, which will allow port
entry (under DPS2) for vessels up to 42m in beam subject to approval by the harbor pilots. The main
deck will be designed for uniform deck load of 5te/m^2 or higher.

39
For campaign 1, the unit will need to carry the guide frame (estimated at 30m x 30m x 6m high/300te),
four sets (four each) of piles, piling hammer, leveling and ROV equipment, and construction containers.
Total area = 3000m^2 and VDL at least 3500te.
For campaign 2, the unit will need to carry at least one jacket (30m x 30m x 70m high/1000te) complete
with lifting gear and load spreaders, as well as the ROV spread and grouting plant. It will also need to
carry miscellaneous construction containers. Allow at least 2600m^2.
For campaign 3, the unit will need to carry minimum four 8-MW turbine sets at a time. Deck area
required is approximately 2900m^2 and the VDL required is estimated at 4000te. These will need
to be stored off the bow or the stern for any vessel entering or departing port; however, for a WTIV
that remains in the field, these may be over the side.
4.3 Specific Requirements for Wind Turbine Installation Vessel (WTIV)
Suitable living accommodations, designed for a minimum of 90 people, will be provided on the WTIV
for the vessel crew required to safely operate the jack-up and for turbine contractors installing the
turbine components. The WTIV should be self-sufficient for a 21-day period and have the means to
load/discharge provisions offshore, ability to transfer crew by boat or helicopter, and a helideck
suitable for a Super Puma or Sikorski S61N/S92A. However, helicopter operations during transit
are not permitted.
The main crane should have the following installation capabilities:
• Pile installation will need to lift and upend piles that may weigh up to 150te and 80m length and then lower them down into position in the guide frame. An upending bucket may be required. The design outreach from the side of the unit for the pile installation is 48m.
• Jacket installation will need to lift jackets, which for 55m of water may weigh 1000te, stand 70m tall, and measure 30 m x 30 m at the base. It will need to have a minimum hook height of 100m above the water surface at an outreach of 21 m (= 30m/2 base + 1m margin + 5 m hull clearance) from the side of the unit. A clearance of 5 m shall be maintained between the jacket and crane boom.
• Turbine installation will need to lift 500te to an elevation of 120 m above the water surface at an outreach of 21 m from the side of the unit.
An intelligent tugger-line system will help control the load in all circumstances as recommended
by the turbine manufacturer.

40
4.4 Specific Requirements for Feeder Barge
Over-hanging cargo such as blades stored on the WTIV or feeder units should account for any obstacles
on the hurricane barrier (gate control room, posts, antennas, etc.). Blades for example, may protrude
over the bow or stern, but they must not extend over the side.
Onshore cranes will load the feeder barge in port to allow for at least 14 days of self-sufficiency.
While it is offshore, the installation vessel will perform the offloads and it does not require a main
cargo crane. However, it should be suitable for future retrofitting of a crane for wind turbine
maintenance and repair purposes.
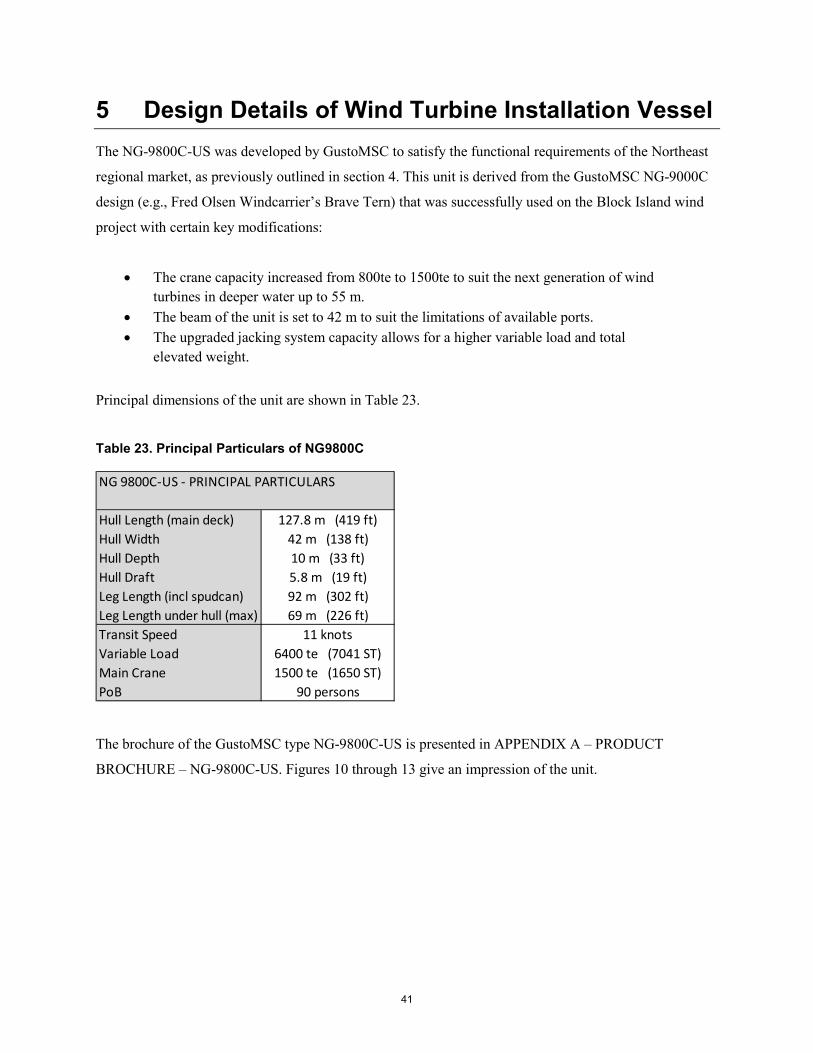
41
5 Design Details of Wind Turbine Installation Vessel The NG-9800C-US was developed by GustoMSC to satisfy the functional requirements of the Northeast
regional market, as previously outlined in section 4. This unit is derived from the GustoMSC NG-9000C
design (e.g., Fred Olsen Windcarrier’s Brave Tern) that was successfully used on the Block Island wind
project with certain key modifications:
• The crane capacity increased from 800te to 1500te to suit the next generation of wind turbines in deeper water up to 55 m.
• The beam of the unit is set to 42 m to suit the limitations of available ports. • The upgraded jacking system capacity allows for a higher variable load and total
elevated weight.
Principal dimensions of the unit are shown in Table 23.
Table 23. Principal Particulars of NG9800C
The brochure of the GustoMSC type NG-9800C-US is presented in APPENDIX A – PRODUCT
BROCHURE – NG-9800C-US. Figures 10 through 13 give an impression of the unit.
NG 9800C-US - PRINCIPAL PARTICULARS
Hull Length (main deck) 127.8 m (419 ft)Hull Width 42 m (138 ft)Hull Depth 10 m (33 ft)Hull Draft 5.8 m (19 ft)Leg Length (incl spudcan) 92 m (302 ft)Leg Length under hull (max) 69 m (226 ft)Transit Speed 11 knotsVariable Load 6400 te (7041 ST)Main Crane 1500 te (1650 ST)PoB 90 persons

42
Figure 10. Rendering #1 of two NG-9800C-US installing foundations (left) and turbines (right)
Figure 11. Rendering #2 of two NG-9800C-US installing foundations (left) and turbines (right)

43
Figure 12. Rendering #3 of two NG-9800C-US installing turbines (left) and foundations (right)
Figure 13. Rendering #4 of two NG-9800C-US installing turbines (left) and foundations (right)

44
6 Design Details of Feeder Unit The NG-3750C Feeder was developed by GustoMSC to satisfy the functional requirements of
the Northeast regional market, as outlined in section 4. It is derived from the established GustoMSC
NG-3750C design. The main crane was removed to reduce costs and increase deck space, but can be
installed at a future date for wind farm maintenance purposes. Principal dimensions of the unit are
shown in Table 24.
Table 24. Principal Particulars of NG-3750C
The brochure of the GustoMSC type NG-3750C is presented in APPENDIX B – PRODUCT
BROCHURE – NG-3750C.
NG 3750C - PRINCIPAL PARTICULARS
Hull Length (main deck) 70.5 m (231 ft)Hull Width 38 m (125 ft)Hull Depth 6.5 m (21 ft)Hull Draft m (0 ft)Leg Length (incl spudcan) 86 m (282 ft)Leg Length under hull (max) 68 m (223 ft)Transit Speed 6-7 knotsVariable Load 3400 te (3740 ST)Main Crane N/APoB 12 persons
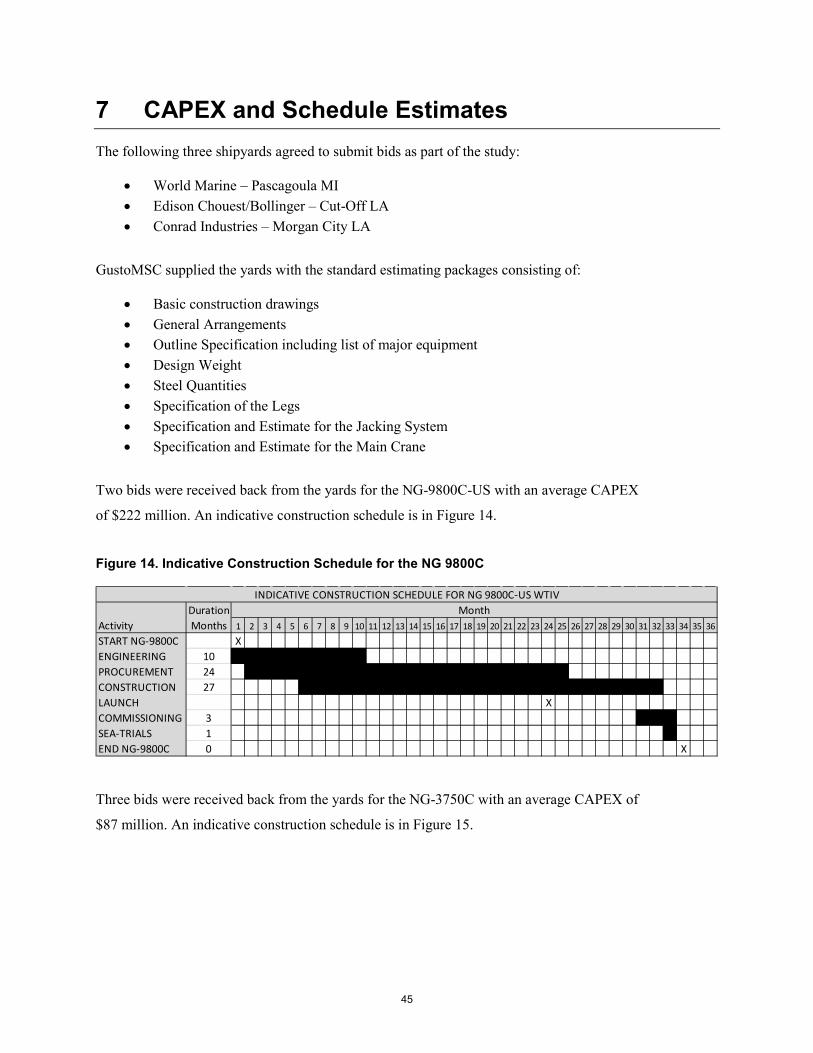
45
7 CAPEX and Schedule Estimates The following three shipyards agreed to submit bids as part of the study:
• World Marine – Pascagoula MI • Edison Chouest/Bollinger – Cut-Off LA • Conrad Industries – Morgan City LA
GustoMSC supplied the yards with the standard estimating packages consisting of:
• Basic construction drawings • General Arrangements • Outline Specification including list of major equipment • Design Weight • Steel Quantities • Specification of the Legs • Specification and Estimate for the Jacking System • Specification and Estimate for the Main Crane
Two bids were received back from the yards for the NG-9800C-US with an average CAPEX
of $222 million. An indicative construction schedule is in Figure 14.
Figure 14. Indicative Construction Schedule for the NG 9800C
Three bids were received back from the yards for the NG-3750C with an average CAPEX of
$87 million. An indicative construction schedule is in Figure 15.
DurationActivity Months 1 2 3 4 5 6 7 8 9 10 11 12 13 14 15 16 17 18 19 20 21 22 23 24 25 26 27 28 29 30 31 32 33 34 35 36
START NG-9800C XENGINEERING 10 1 1 1 1 1 1 1 1 1 1PROCUREMENT 24 1 1 1 1 1 1 1 1 1 1 1 1 1 1 1 1 1 1 1 1 1 1 1 1CONSTRUCTION 27 1 1 1 1 1 1 1 1 1 1 1 1 1 1 1 1 1 1 1 1 1 1 1 1 1 1 1LAUNCH XCOMMISSIONING 3 1 1 1SEA-TRIALS 1 1END NG-9800C 0 X
MonthINDICATIVE CONSTRUCTION SCHEDULE FOR NG 9800C-US WTIV

46
Figure 15. Indicative Construction Schedule for the NG-3750
Funding assistance is available from the MARAD administered “Federal Ship Financing Program”
commonly known as Title XI. This offers financing at reduced rates with as little as 12.5% equity
investment by the owner.
MARAD Title XI offers guarantees for up to 87.5% of the actual cost. But to be eligible, obligors must:
1. Be an individual, corporation or other business that is U.S. organized, based in the U.S. and recognized as a U.S. citizen. However, there may be remedies to this requirement for foreign owners through a lease financing arrangement. (Kearn, 2014)
2. Demonstrate sufficient skill and experience to operate the vessel. 3. Maintain creditworthiness and limit debt to no more than twice the net worth of the unit.
Furthermore, the design must be approved by MARAD and a recognized classification society
such as American Bureau of Shipping.
DurationActivity Months 1 2 3 4 5 6 7 8 9 10 11 12 13 14 15 16 17 18 19 20 21 22 23 24 25 26 27 28 29 30 31 32 33 34 35 36
START NG-3750 XENGINEERING 9 1 1 1 1 1 1 1 1 1PROCUREMENT 12 1 1 1 1 1 1 1 1 1 1 1 1CONSTRUCTION 18 1 1 1 1 1 1 1 1 1 1 1 1 1 1 1 1 1 1LAUNCH XCOMMISSIONING 3 1 1 1SEA-TRIALS 1 1END NG-3750 0 X
MonthINDICATIVE CONSTRUCTION SCHEDULE FOR NG 3750 FEEDER BARGE
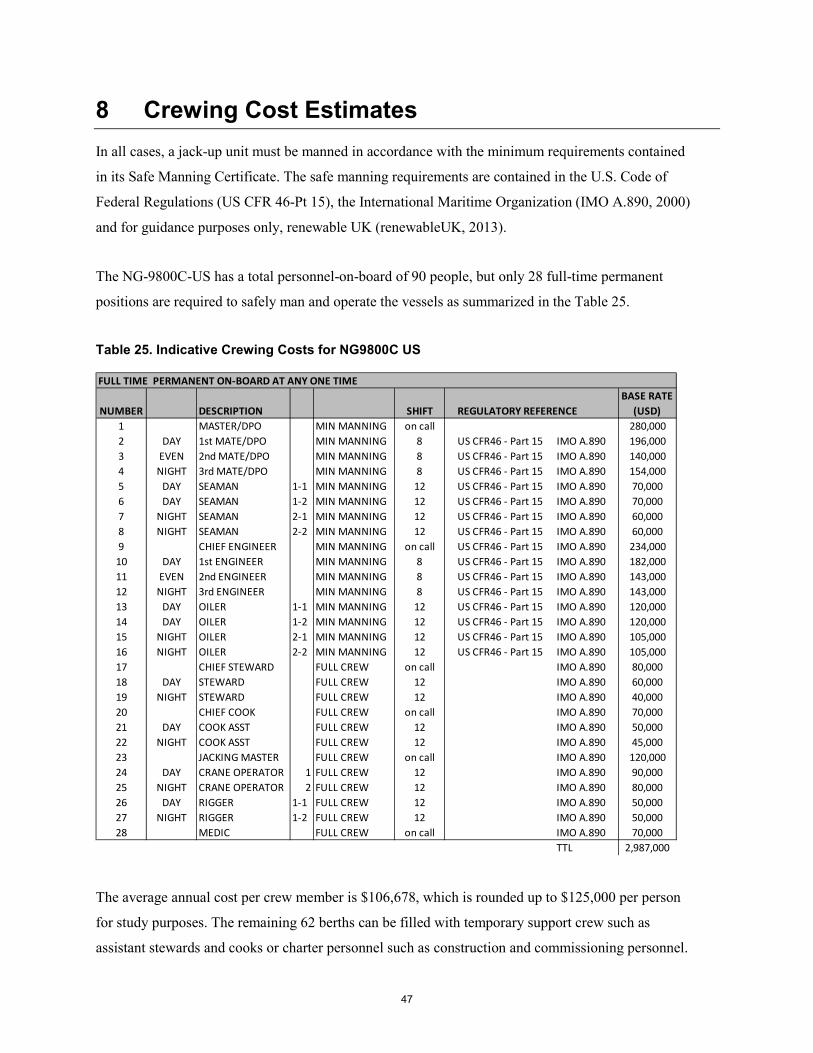
47
8 Crewing Cost Estimates In all cases, a jack-up unit must be manned in accordance with the minimum requirements contained
in its Safe Manning Certificate. The safe manning requirements are contained in the U.S. Code of
Federal Regulations (US CFR 46-Pt 15), the International Maritime Organization (IMO A.890, 2000)
and for guidance purposes only, renewable UK (renewableUK, 2013).
The NG-9800C-US has a total personnel-on-board of 90 people, but only 28 full-time permanent
positions are required to safely man and operate the vessels as summarized in the Table 25.
Table 25. Indicative Crewing Costs for NG9800C US
The average annual cost per crew member is $106,678, which is rounded up to $125,000 per person
for study purposes. The remaining 62 berths can be filled with temporary support crew such as
assistant stewards and cooks or charter personnel such as construction and commissioning personnel.
FULL TIME PERMANENT ON-BOARD AT ANY ONE TIME
NUMBER DESCRIPTION SHIFT REGULATORY REFERENCEBASE RATE
(USD)1 MASTER/DPO MIN MANNING on call 280,0002 DAY 1st MATE/DPO MIN MANNING 8 US CFR46 - Part 15 IMO A.890 196,0003 EVEN 2nd MATE/DPO MIN MANNING 8 US CFR46 - Part 15 IMO A.890 140,0004 NIGHT 3rd MATE/DPO MIN MANNING 8 US CFR46 - Part 15 IMO A.890 154,0005 DAY SEAMAN 1-1 MIN MANNING 12 US CFR46 - Part 15 IMO A.890 70,0006 DAY SEAMAN 1-2 MIN MANNING 12 US CFR46 - Part 15 IMO A.890 70,0007 NIGHT SEAMAN 2-1 MIN MANNING 12 US CFR46 - Part 15 IMO A.890 60,0008 NIGHT SEAMAN 2-2 MIN MANNING 12 US CFR46 - Part 15 IMO A.890 60,0009 CHIEF ENGINEER MIN MANNING on call US CFR46 - Part 15 IMO A.890 234,00010 DAY 1st ENGINEER MIN MANNING 8 US CFR46 - Part 15 IMO A.890 182,00011 EVEN 2nd ENGINEER MIN MANNING 8 US CFR46 - Part 15 IMO A.890 143,00012 NIGHT 3rd ENGINEER MIN MANNING 8 US CFR46 - Part 15 IMO A.890 143,00013 DAY OILER 1-1 MIN MANNING 12 US CFR46 - Part 15 IMO A.890 120,00014 DAY OILER 1-2 MIN MANNING 12 US CFR46 - Part 15 IMO A.890 120,00015 NIGHT OILER 2-1 MIN MANNING 12 US CFR46 - Part 15 IMO A.890 105,00016 NIGHT OILER 2-2 MIN MANNING 12 US CFR46 - Part 15 IMO A.890 105,00017 CHIEF STEWARD FULL CREW on call IMO A.890 80,00018 DAY STEWARD FULL CREW 12 IMO A.890 60,00019 NIGHT STEWARD FULL CREW 12 IMO A.890 40,00020 CHIEF COOK FULL CREW on call IMO A.890 70,00021 DAY COOK ASST FULL CREW 12 IMO A.890 50,00022 NIGHT COOK ASST FULL CREW 12 IMO A.890 45,00023 JACKING MASTER FULL CREW on call IMO A.890 120,00024 DAY CRANE OPERATOR 1 FULL CREW 12 IMO A.890 90,00025 NIGHT CRANE OPERATOR 2 FULL CREW 12 IMO A.890 80,00026 DAY RIGGER 1-1 FULL CREW 12 IMO A.890 50,00027 NIGHT RIGGER 1-2 FULL CREW 12 IMO A.890 50,00028 MEDIC FULL CREW on call IMO A.890 70,000
TTL 2,987,000

48
9 Business Model for the WTIV A simple cash flow financial model was developed to assess the business case of the WTIV itself. This
model tracks cash flow in and out of a vessel owner’s account over the life of the unit. These are models
of individual vessels and do not consider overall project economics such as field development costs or
overall installation scenarios of which the individual vessel is only one component. This report is
intended to provide data for input into a larger overall analysis that a developer might undertake with
project specific data—for example, examining the benefit of jackets vs. monopiles or using feeder
barges vs. using an alternative.
The individual vessel cash flow model is assumed to begin when financing is in place. Construction of
the WTIV is expected to last three years during which a vessel construction project team (on the owner’s
account) will be required to oversee construction and provide due diligence checks and oversight. A total
of 12 people is estimated at an average total rate of $125k/year.
The unit is projected to begin work on wind farm installation immediately after leaving the shipyard
and take 23 years of dedicated work completing turbine installations out to the 55-m contour line. The
utilization rate is anticipated to be 95% normal, but reduced on years where there is a switch from one
area to another or scheduled maintenance such as a special survey or dry-docking.
Insurance costs were fixed at 0.1% of CAPEX per year. All costs and revenue are corrected for inflation
using a 2% rate of inflation. There are many other unknown details of the financial model such as future
interest rates or possible tax credits.
These will be subjected to a sensitivity analysis where possible or conservative assumptions were made.
• Tax rate was left at 35% flat and no allowance made for tax credits or other forms of tax reduction in order to be conservative.
• No allowance was made for financing assistance from organizations such as the MARAD. administered “Federal Ship Financing Programming” commonly known as Title XI.
• Net losses are not carried forward to offset future taxes. • The unit is expected to be fully depreciated over the life of the project and has a residual
value of zero.

49
The loan is amortized over 10 years with interest rates ranging from 4% to 8% and discount rates range
from 8% to 12% in the sensitivity study. Additionally, debt leverage ratios ranged from 50% to 65%.
A target day rate for the unit is $220,000 per day based on comparable target day rates for similar units.
This was subject to a sensitivity analysis of +/- $20k/day with the results shown in Figures 16 through
22 and summarized in Table 26. The values reported are for a discount rate of 9%.
Table 26. Summary of IRR for WTIV
With the target day rate, the WTIV can return an IRR of 10% if sold after 10 years or 11.6% if held for
20 years. Looking at Table 20, 10 years of work requires a pipeline of approximately 439 turbines.
Assuming 8-MW turbines, this equates to 3,512 MW of offshore wind capacity.
Table 27. Summary of NPV for WTIV
Combining the target day rate with a discount rate of 9%, the unit can return an NPV of $60 million if
sold after 10 years or a NPV of $91 million if held for 20 years. For day rates less than $142,000 per day,
NPV is never positive. For day rates greater than $224,000 per day, NPV is never negative for any
discount rate in this model.
MINIMUM IRR (%)day 10yr 20yrrate life life$k
200 8.1 9.8220 10 11.6240 11.8 13.2
MINIMUM NPV ($million)day 10yr 20yrrate life life$k
200 35 56220 60 91240 85 126

50
This study did not cover alternative uses of the WTIV such as decommissioning of oil and gas platforms
in the Gulf of Mexico, construction work on marine infrastructure projects nationwide, or use of the
WTIV in markets overseas.
Figure 16. Sample Cash Flow Time Series for Day Rate of $220,000 per day

51
Figure 17. WTIV Variation in NPV and IRR with day rate of $200k and Unit Sold after 10 years

52
Figure 18. WTIV Variation in NPV and IRR with day rate of $200k and Unit Sold after 20 years
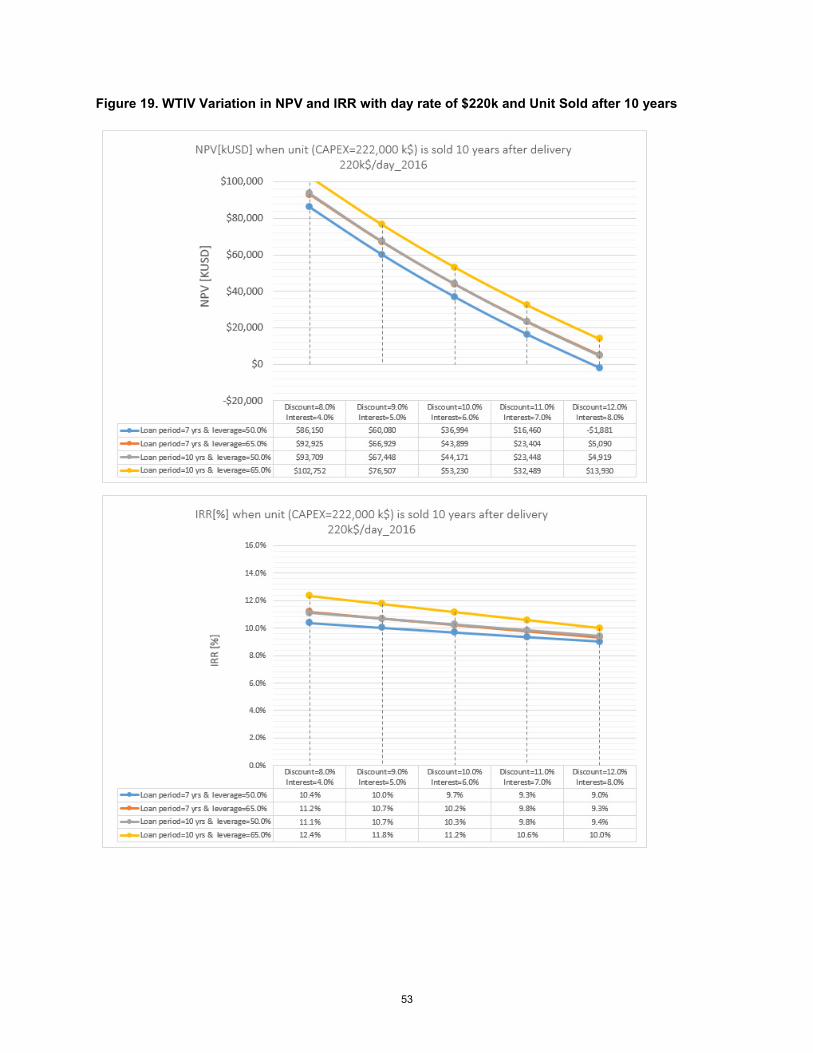
53
Figure 19. WTIV Variation in NPV and IRR with day rate of $220k and Unit Sold after 10 years

54
Figure 20. WTIV Variation in NPV and IRR with day rate of $220k and Unit Sold after 20 years

55
Figure 21. WTIV Variation in NPV and IRR with day rate of $240k and Unit Sold after 10 years

56
Figure 22. WTIV Variation in NPV and IRR with day rate of $240k and Unit Sold after 20 years
57
10 Business Model for the Feeder Barge A simple cash flow financial model was developed to assess the business case of the feeder unit
considering the feeder strategy. This model tracks cash flow in and out of a vessel owner’s account over
the life of the unit. Like the model for the WITV, this is only for the vessel, not the overall project. Based
on a larger analysis, a developer would need to answer questions such as the optimum number of feeder
barges for their project based on specific data and circumstances. This report is only intended to supply
data for a larger analysis of this type.
The cash flow model is assumed to begin when financing is in place. Construction is expected to last
three years during which a vessel construction project team (on the owner’s account) will be required
to oversee construction and provide due diligence checks and oversight. A total of 12 people is estimated
at an average total rate of $125k/year.
The unit is projected to begin work on wind farm installation immediately after leaving the shipyard
and take 18 years of dedicated work completing turbine installations out to the 55 m contour line.
Following the construction phase, it is assumed to be on wind farm maintenance at 40% utilization.
Insurance costs were fixed at 0.1% of CAPEX per year. All costs and revenues are corrected for inflation
using a 2% rate of inflation. There are many other unknown details of the financial model such as future
interest rates or possible tax credits.
These will be subjected to a sensitivity analysis where possible or conservative assumptions were made.
• Tax rate was left at 35% flat and no allowance made for tax credits or other forms of tax reduction in order to be conservative.
• No allowance was made for financing assistance from organizations such as the MARAD administered “Federal Ship Financing Programming” commonly known as Title XI.
• Net losses are not carried forward to offset future taxes. • The unit is assumed to be fully depreciated over the life of the project and has a residual
value of zero.
The loan is amortized over 10 years with interest rates ranging from 4% to 8% and discount rates range
from 8% to 12% in the sensitivity study. Additionally, debt leverage ratios ranged from 50% to 65%.

58
The target day rate for the unit is $85,000 per day. This was subject to a sensitivity analysis of +/-
$5k/day with the results shown in Figures 22 through 27 and results summarized in Tables 28 and 29.
The values reported are for a discount rate of 9%.
Table 28. Summary of IRR for WTIV
With the target day rate, the unit can return an IRR of 8.1% if sold after 10 years, 11.2% if held for
20 years and the target IRR of 10% if sold after approximately 16 years.
Table 29. Summary of NPV for WTIV
Combining the target day rate with a discount rate of 9%, the unit can return an NPV of $13.4 million
if sold after 10 years or an NPV of $19.9 million if held for 20 years.
An item for future sensitivity studies is that the WTIV installation vessel for the feeder option may
not need to be as big or as capable. Also, it is possible that several projects could share one feeder,
which doubles as a wind farm maintenance unit and may improve the overall project economics.
Also, the WTIV may not need as much design functionality if it remains in the field and is supplied
by feeder barges. Consequently, it may be possible to optimize the design and reduce the direct cost
of the WTIV.
MINIMUM IRR (%)day 10yr 20yrrate life life$k80 7 1085 8.1 11.290 9.2 12.1
MINIMUM NPV ($million)day 10yr 20yrrate life life$k80 7.2 11.685 13.4 19.990 19.6 28.2
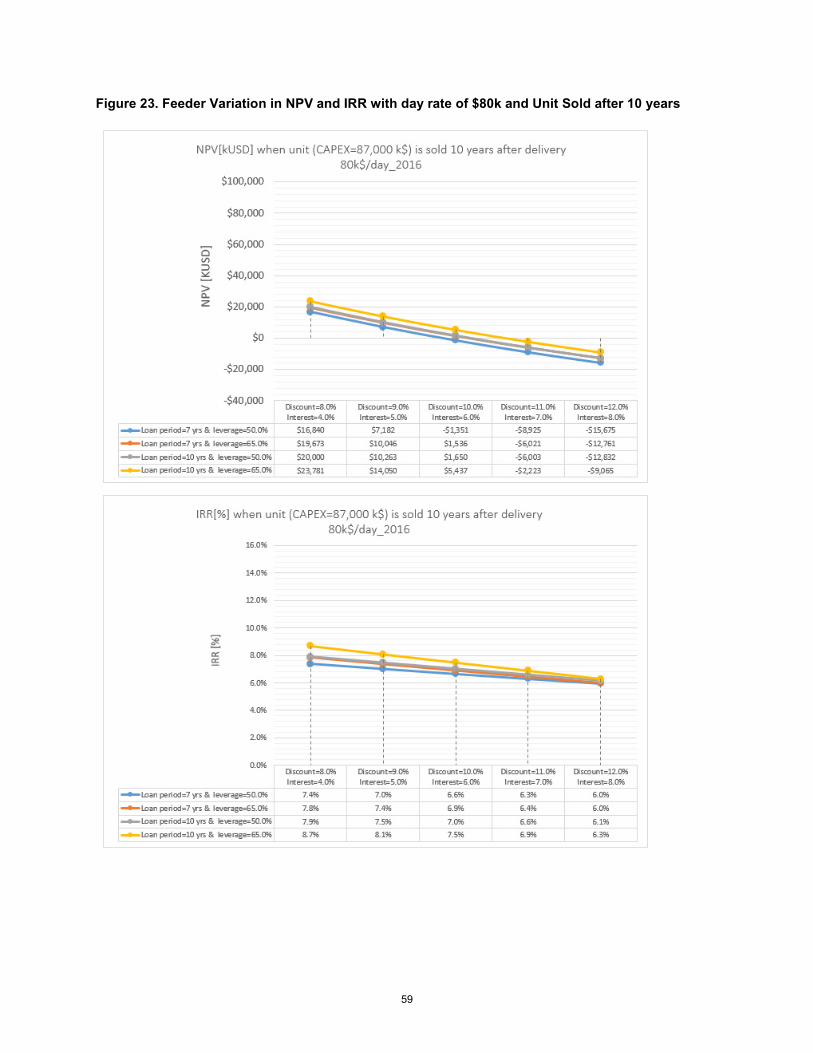
59
Figure 23. Feeder Variation in NPV and IRR with day rate of $80k and Unit Sold after 10 years
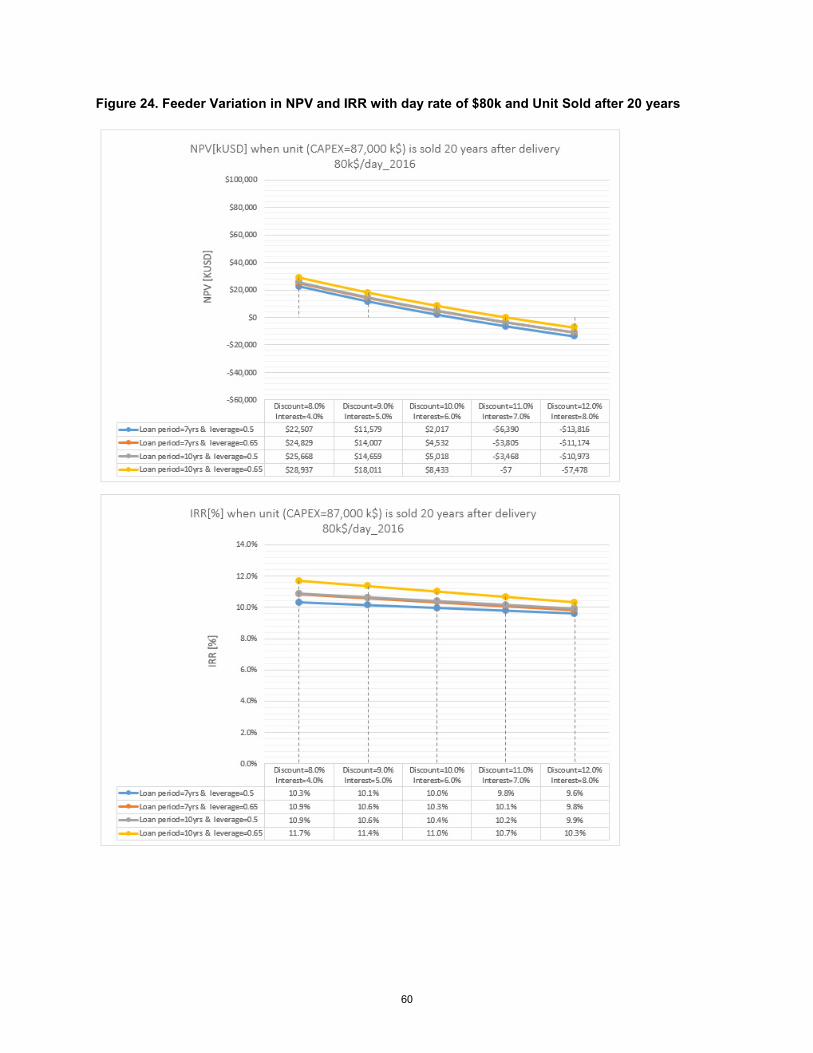
60
Figure 24. Feeder Variation in NPV and IRR with day rate of $80k and Unit Sold after 20 years
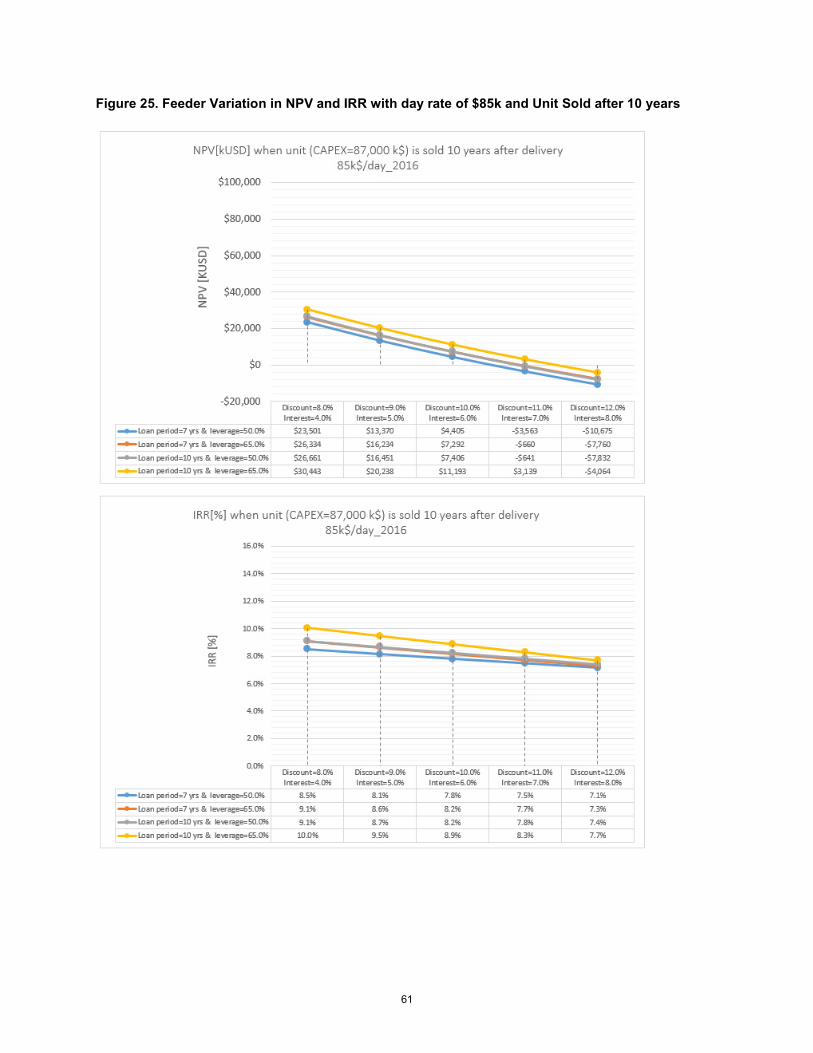
61
Figure 25. Feeder Variation in NPV and IRR with day rate of $85k and Unit Sold after 10 years

62
Figure 26. Feeder Variation in NPV and IRR with day rate of $85k and Unit Sold after 20 years

63
Figure 27. Feeder Variation in NPV and IRR with day rate of $90k and Unit Sold after 10 years

64
Figure 28. Feeder Variation in NPV and IRR with day rate of $90k and Unit Sold after 20 years

65
11 Conclusions This study took a sample of potential offshore wind development areas in the Northeast between New
York and Massachusetts where existing commercially available bottom fixed technology may be used.
Data on bathymetry, wind, wave, current, and soil conditions was identified. Eight-MW turbines were
laid out in a 9 x 9 rotor diameters grid and the number of turbines that could theoretically be installed
were tallied according to water depth range.
Installation methodologies and timelines were synthesized to define the functional requirements of the
WTIV and feeder barge. Based on the requirements, a WTIV with a main crane capacity of 1500te
(1645 ST) and a beam of 42m (138 ft.) was designed. Estimating packages were prepared and submitted
to U.S. shipyards resulting in an average estimated cost of $222 million and a build time of 34 months.
Likewise, a feeder barge with a variable load capacity of 3400te (3740 ST) and a beam of 38m (125 ft.)
was designed to support a field-bound WTIV. Estimating packages were prepared and submitted to
U.S. shipyards resulting in an average estimated cost of $87 million and a build time of 25 months.
A basic financial model was created to track cash flows for a vessel owner over the life of the unit.
To achieve a reasonable combination of day rates ($220,000) and internal rate of return (10%), at least
10 years of firm work is required for the WTIV. For the feeder barge, approximately 16 years of work
at a day rate of $85,000 is required to generate an internal rate of return of 10%.
This will require a group of states and developers coordinate on an identified pipeline of projects.
However, if the full potential of the offshore wind areas on the East Coast is realized, several
vessels may be justified for areas not considered in this study.

66
12 References 4C Offshore. (2016, 12 12). Latest Event on Borssele 3 and 4. Retrieved from 4C Offshore:
http://www.4coffshore.com/windfarms/borssele-site-iii-netherlands-nl0j.html
Aaron Smith, T. S. (2015). 2014-2015 Offshore Wind Technologies Market Report. Boulder, CO: NREL.
AWS Truepower. (2010). Summary of Physical and Environmental Qualities for the Proposed Long Island New York City Offshore Wind PRoject Area. New York, NY: NYSERDA.
AWS Truepower LLC. (2010). Pre-Developmnent Assessment of Meteoroloical and Oceanographic Conditions for the Proposed Long Island - New York City Offshore Wind Project Area. New York, NY: NYSERDA.
AWS Truepower LLC. (2010). Summary of Physical and Environmental Qualities for the Proposed Long Island - New York City Offshore Wind Project . New York, NY: NYSERDA.
BOEM. (2016, 12). Outer Continental Shelf - Renewable Energy Leases - Map Book. Retrieved from Bureau of Ocean Energy Management: https://www.boem.gov/Renewable-Energy-Lease-Map-Book/
Damiani, D. a. (2016). A Comparison Study of Offshore Wind Support Structures with Monopiles and Jackets for U.S. Waters. Boulder CO: NREL.
Elkinton C, B. A. (2014). Assessment of Ports for Offshore Wind Development in the United States. San Diego, CA: GL Garrad Hassan (US DOE Document No. 700694-USPO-R-03).
IMO A.890. (2000). Principles of Safe Manning. International Maritime Organization.
IMO MSC Circ 64. (n.d.). Guidelines for vessels with Dynamic Positioning Systems. International Maritime Organization.
ISO 19901. (2005). "Petroleum and natural gas industries - Specific requirements for offshore structures". Brussels: International Standards Organization (ISO).
ISO 19905-1. (2012). Site Specific Assessment of mobile offshore units Part 1: Jack-ups. International Standards Organization.
Kearn, J. A. (2014, January 7). Finding New Ways to Finance Jones Act Vessel Builds. Retrieved from MarineLink: https://www.marinelink.com/news/finding-finance-vessel362639
Musial, W. e. (2013). Assessment of Offshore Wind Energy Leasing Areas for the BOEM Massachusetts Wind Energy Area. Boulder, CO: NREL- 60942.
NOAA - Office of Coast Survey. (2015). Chart 13232. Retrieved from New Bedford Harbour and Approaches: http://www.charts.noaa.gov/OnLineViewer/13232.shtml
NOAA - NBDC. (2017, 02 28). Measurement Descriptions and Units. Retrieved from NOAA - National Buoy Data Center: http://www.ndbc.noaa.gov/measdes.shtml

67
NOAA. (2017). National Oceanic and Atmospheric Administration. Retrieved from National Data Buoy Center: http://www.ndbc.noaa.gov/obs.shtml
Noble Denton 0035. (2013). Guidelines for Offshore Wind Farm Infrastructure Installation. GL Noble Denton.
renewableUK. (2013). Guidelines for the Selection and Operation of Jack-ups in the Marine Renewable Energy Industry. renewableUK.
SNAME 5-5A. (2008). Sire Specific Assessment of Mobile Jack-Up Units. Jersey City, New Jersey: The Society of Naval Architects and Marine Engineers.
University of Delaware, Special Initiative on Offshore Wind. (2015). New York Offshore Wind Cost Reduction Study. New York: NYSERDA.
US CFR 46-Pt 15. (n.d.). Part 15.101 - Manning Requirements. United States Coast Guard.

A-1
Appendix A – Product Brochure – NG-9800C-US

A-2

B-1
Appendix B – Product Brochure – NG-3750C
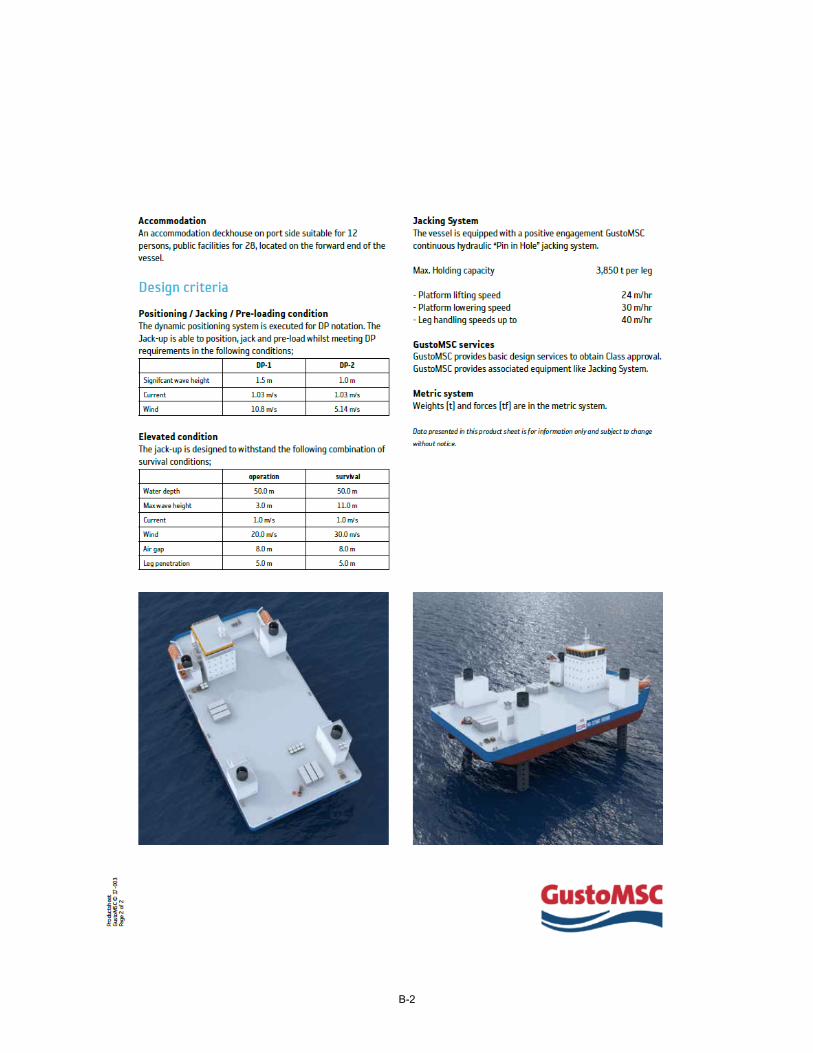
B-2

New York State Energy Research and
Development Authority
17 Columbia CircleAlbany, NY 12203-6399
toll free: 866-NYSERDAlocal: 518-862-1090fax: 518-862-1091
For more information about this report, please contact NYSERDA

U.S. Jones Act Compliant Offshore Wind Turbine Installation Vessel StudyA Report for the Roadmap Project for Multi-State Cooperation on Offshore Wind
New York State Energy Research and Development AuthorityMassachusetts Clean Energy Center
Massachusetts Department of Energy ResourcesRhode Island Office of Energy Resources
Clean Energy States Alliance
Report 17-13 October 2017