u.s. fish & wildlife service plum creek restoration …€¦ · u.s. fish & wildlife...
TRANSCRIPT

U.S. Fish & Wildlife Service
Plum Creek Restoration
Cecil County, Maryland
Project Summary and Design
Report Methodology CBFO-S15-08 June 2015


PLUM CREEK RESTORATION, CECIL COUNTY, MARYLAND: PROJECT SUMMARY AND DESIGN REPORT
By: Mark A. Secrist and Richard R. Starr
Stream Habitat Assessment and Restoration Program U.S. Fish and Wildlife Service Chesapeake Bay Field Office CBFO – S15 - 08
Annapolis, MD June 2015


Plum Creek Stream Restoration: Project Summary and Design Report
U. S. Fish and Wildlife Service June 2015 Chesapeake bay Field Office Page | i
EXECUTIVE SUMMARY Maryland Department of Natural Resources (DNR), Maryland Department of the Environment (MDE), and the U.S. Fish and Wildlife Service (Service) - Chesapeake Bay Field Office are involved in a collaborative effort to restore in-stream habitat in approximately 500 linear feet of Plum Creek, located in Cecil County, Maryland. The stream is located on property owned by DNR and flows southeast 3.0 miles from its source in Elk Neck State Forest into the Elk River, and ultimately enters the Chesapeake Bay. The site of the restoration currently has an earthen dam that was breached by floodwaters over a decade ago. The Service conducted a rapid assessment to determine the restoration potential of the proposed site. The area has been impacted by an in-channel impoundment and subsequent failure of the impoundment during a large storm event. The failure led to unstable stream banks, poor bedform diversity, stream bed siltation, little to no riparian vegetation or buffer, and increased water temperatures. Given the potential restoration lift and the focus on the watershed, the Service and DNR felt that the proposed site would be an excellent candidate for habitat restoration. The project process used for this project follows the approach outlined in A Function-Based Framework for Stream Assessment and Restoration Projects (SFPF) (Harman et. al, 2012). The SFPF is based on the premise of a hierarchal relationship among stream functions where lower-level functions support higher-level functions and that they are all influenced by local geology and climate, which underlies the Pyramid. The SFPF was integrated throughout the entire project process to ensure the most appropriate design approach would be selected. The project process consists of the following steps: Programmatic/Project Goals, Watershed Assessment, Reach-Scale Function-based Assessment, Restoration Potential, Design, Design Alternatives Analysis, Design Development, and Monitoring Plan. The focus of the watershed assessment was to determine the influence of the watershed health on the proposed project area. Specifically, watershed characteristics are evaluated to document hydrology (i.e., flow regime), sediment transport load (i.e., sources and amount), water quality (i.e., types and sources) and biology (i.e., locations and health). By understanding watershed conditions, we are able to determine if programmatic goals are achievable and determine the restoration potential of our project reach. The watershed consists of 99.6% forest and has 0.17% impervious surface. The flow regime is considered non-flashy, meaning the proposed project will have a ground water recharge source and flood flows will not be elevated. Even though the watershed is currently almost totally forested, past landuse has created some lateral instability throughout the watershed. Therefore, the proposed project area will have a sediment supply that must be addressed in the proposed design.

Plum Creek Stream Restoration: Project Summary and Design Report
U. S. Fish and Wildlife Service June 2015 Chesapeake Bay Field Office Page | ii
The following assessment parameters, by pyramid level, were evaluated as part of this project: Level 1 - Hydrology – flow regime Level 2 - Hydraulics – floodplain connectivity and flow dynamics Level 3 - Geomorphology – bedform diversity, lateral stability and riparian vegetation Level 4 -Physicochemical – temperature, pH, dissolved oxygen, conductivity and turbidity Leve 5 - Biology – macroinvertebrate communities and fish communities
Each assessment parameter had at least one measurement method to quantify the existing function-based condition. Then each measurement method value was rated either functioning, function-at-risk, or not functioning based on set performance standards. The project area was divided into two separate reaches based on existing conditions. The Service determined that the overall function-based condition of the Plum Creek project area is Functioning-at-Risk and is trending towards future instability before equilibrium can be reached.
Level and Category Parameter
Pre-Restoration
Rating
Restoration Potential
1 - Hydrology Channel-Forming Discharge Functioning Functioning
2 - Hydraulics
Floodplain Connectivity Functioning Functioning
Flow Dynamics Not Functioning Functioning
3 - Geomorphology
Bed Form Diversity
Not Functioning Functioning
Riparian Vegetation
Not Functioning Functioning
Lateral Stability Not Functioning Functioning
Channel Evolution
Not Functioning Functioning
4 - Physicochemical Water Quality Functioning at
Risk Functioning
at Risk
5 - Biology
Macroinvertebrate Communities
Functioning at Risk
Functioning at Risk
Fish Communities Functioning at Risk
Functioning at Risk
Table 1: Reach 1 Function-Based Restoration Potential

Plum Creek Stream Restoration: Project Summary and Design Report
U. S. Fish and Wildlife Service June 2015 Chesapeake Bay Field Office Page | iii
Level and Category Parameter
Pre-Restoration
Rating
Restoration Potential
1 - Hydrology Channel-Forming Discharge Functioning Functioning
2 - Hydraulics
Floodplain Connectivity Functioning Functioning
Flow Dynamics Functioning Functioning
3 - Geomorphology
Bed Form Diversity
Not Functioning Functioning
Riparian Vegetation
Functioning at Risk Functioning
Lateral Stability Functioning at Risk Functioning
Channel Evolution
Functioning at Risk Functioning
4 - Physicochemical Water Quality Functioning at
Risk Functioning
at Risk
5 - Biology
Macroinvertebrate Communities
Functioning at Risk
Functioning at Risk
Fish Communities Functioning at Risk
Functioning at Risk
Table 2: Reach 2 Function-Based Restoration Potential
The Service then determined the restoration potential of both reaches in the proposed project area. Restoration potential is the highest level of restoration or functional lift that can be achieved given the watershed health, reach-level function-based condition, stressors, and constraints. (Harman et. al, 2012). The Service determined that pyramid levels 2 - Hydraulics and 3 - Geomorphology can be restored to fully functional and levels 4 – Physicochemical and 5 – Biology can have partial functional lift (Table 1). Restoration of levels 2 and 3 functions are typically the most easiest to achieve since it involves direct, physical manipulation of stream channel dimension, pattern and profile. However, typically lift for levels 4 and 5 functions cannot be constructed and rely on the functionality of lower level functions and watershed health. Furthermore, it takes time for levels 4 and 5 functions to respond to changes in lower level functions and watershed health.
The Service generated design objectives based on Service and DNR missions, project goals and the restoration potential of the proposed project area. Design objectives should be quantifiable and describe how the proposed project will be implemented (Harman et. al, 2012). The design objectives of the proposed project focus on level’s 2 and 3of the Pyramid and support levels 4 and 5 functions (Table 3). The design objectives will also be used as monitoring performance standards.

Plum Creek Stream Restoration: Project Summary and Design Report
U. S. Fish and Wildlife Service June 2015 Chesapeake Bay Field Office Page | iv
Level and Category Goals Objectives
Level 2 - Hydraulics
Floodplain Connectivity 1. Achieve a Bank Height Ratio = 1
Level 3 - Geomorphology
Lateral Stability, In-stream Habitat (i.e., diversity and quality), Riparian
Buffer
1. Reduce stream bank erosion rates to match reference erosion rates (bank migration / lateral stability)
2. Bedform Diversity – Create 60:40 pool / riffle ratio
3. Match species diversity and composition of reference condition and make buffer width 35 ft wider beyond required meander width ratio.
Table 3: Plum Creek – Goals and Objectives. The underlined works under the objectives are parameters or measurement methods from the Stream Functions Framework (Harman, et al., 2011).
The Service conducted a design alternatives analysis to select the best restoration design approach that met the project goals, design objectives, and the restoration potential of the site. It focused on how a specific design approach could influence stream functions (i.e., highest functional lift), impacts to existing functions, costs, and risk.
There are a variety of design approaches available to restore stream functions of highly degraded stream systems. Typical design approaches used in Maryland include 1) Natural Channel Design, 2) Valley Restoration Design, 3) Analytical Design, and 4) Regenerative Storm Conveyance Design. Each of these design approaches can result in functional uplift at the proposed project area. However, there is one critical function that only two of the approaches can address and that is sediment transport. The watershed and reach-level assessments identified that there a sediment supply being delivered to the project area. The transport of sediment is a critical factor in developing a design.
Therefore, the Service focused on design approaches that could transport sediment: Natural Channel Design and Analytical Design. Both design approaches use models and equations to test stream channel cross section dimension stability. However, only the Natural Channel Design approach uses reference reach data to design stream channel plan form and profile. Typically, the Analytical Design approach does not use stream channel plan form and profile design criteria. This can lead to undesired stream channel adjustments over time that could adversely affect geomorphic stability, water quality and biology. Therefore the Service selected Natural Channel Design as the design approach for the proposed project area. The design proposed by the Service calls for the combination of channel reconfiguration in conjunction with floodplain complexity. The design calls for two different Rosgen stream types to be built within the project area. The first stream type, B4c, will be built to dissipate energy vertically through the use of structures and closer pool-to-pool spacing. This method is required in the area of the failed dam. When the hydraulic influence from the failed dam is no longer a consideration, the Service has proposed a more sinuous C4 stream type with a low width to depth ratio to dissipate energy laterally across the floodplain.

Plum Creek Stream Restoration: Project Summary and Design Report
U. S. Fish and Wildlife Service June 2015 Chesapeake Bay Field Office Page | v
The Service and DNR has also developed a monitoring plan based on the project goals and design objectives outlined in the report to evaluate the performance of the stream restoration project. The monitoring plan will include as-built surveys and rapid/visual geomorphic monitoring. As-built surveys will be used to confirm that the project was built to design standards and will provide as baseline data for future monitoring. The rapid/visual geomorphic surveys will follow the methodologies outlined in the Rapid Stream Restoration Monitoring Protocols (Davis et. al, 2014) developed by the Service. This report documents the findings of the function-based watershed assessment, function-based reach-scale assessment and design development process used by the Service to develop the restoration plan for the Plum Creek Stream Restoration.

Plum Creek Stream Restoration: Project Summary and Design Report
U. S. Fish and Wildlife Service June 2015 Chesapeake Bay Field Office Page | vi
TABLE OF CONTENTS
I. INTRODUCTION.................................................................................................................1
II. SITE SELECTION ...............................................................................................................1
III. PROJECT PROCESS METHODOLOGY ........................................................................2
IV. PROGRAMMATIC / PROJECT GOALS .........................................................................4
V. WATERSHED AND REACH ASSESSMENT ..................................................................4 A. Watershed Assessment......................................................................................................5
1. Geology and Soils ....................................................................................................5 2. Existing Land use/Land cover .................................................................................6 3. Hydrology & Hydraulics..........................................................................................6 4. Geomorphology .......................................................................................................7 5. Physicochemical and Biology ..................................................................................8 6. Watershed Assessment Summary ............................................................................8
B. Base Mapping ...................................................................................................................9 C. Project Reach Function-Based Assessment ......................................................................9
1. Hydrology ..............................................................................................................10 2. Hydraulics ..............................................................................................................11
a. Bankfull Validation ......................................................................................... 11 b. Floodplain Connectivity.................................................................................. 13 c. Flow Dynamics ............................................................................................... 15
3. Geomorphology .....................................................................................................16 a. Bedform Diversity .......................................................................................... 16 b. Bed Material Characterization ........................................................................ 17 c. Sediment Transport Capacity .......................................................................... 18 d. Sediment Transport Competency .................................................................... 19 e. Riparian Vegetation ........................................................................................ 20 f. Lateral Stability ............................................................................................... 22 g. Channel Evolution .......................................................................................... 24
4. Physicochemical ....................................................................................................25 a. Water Quality .................................................................................................. 25
5. Biology ...................................................................................................................28 a. Benthic Macroinvertebrate Communities ....................................................... 28 b. Fish Communities ........................................................................................... 29
6. Summary ................................................................................................................29
VI. PRELIMINARY DESIGN .................................................................................................33 A. Restoration Potential .......................................................................................................33 B. Design Objectives ...........................................................................................................35 C. Design Alternative Analysis ...........................................................................................36
1. Potential Design Alternatives ................................................................................36 2. Potential Functional Uplift and Loss .....................................................................37
a. Analytical Design Approach ........................................................................... 37

Plum Creek Stream Restoration: Project Summary and Design Report
U. S. Fish and Wildlife Service June 2015 Chesapeake Bay Field Office Page | vii
b. Natural Channel Design Approach ................................................................. 38 3. Existing Wetlands ..................................................................................................40
D. Design Development .......................................................................................................41 1. Design Criteria .......................................................................................................41 2. Proposed Design ....................................................................................................44 3. In-Stream Structures ..............................................................................................45
a. Cross-Vane ...................................................................................................... 45 b. J-Hook ............................................................................................................. 46 c. Log Roller ....................................................................................................... 47 d. Soil Lift ........................................................................................................... 48 e. Toe Wood........................................................................................................ 49 f. Emergent Wetlands ......................................................................................... 50
4. Hydrology and Hydrualics Analysis ......................................................................50 a. Resistance Relationships ................................................................................. 51
5. Sediment Analysis .................................................................................................52 6. Vegetation Design ..................................................................................................52
VII. MAINTENANCE AND MONITORING PLANS............................................................53 A. Maintenance Plan ............................................................................................................53 B. Monitoring Plan ..............................................................................................................53

Plum Creek Stream Restoration: Project Summary and Design Report
U. S. Fish and Wildlife Service June 2015 Chesapeake Bay Field Office Page | viii
LIST OF FIGURES
Figure 1: Stream Functions Pyramid (Harman et al., 2012) Figure 2: Stream Functions Pyramid Framework (Harman et al., 2012) Figure 3: Project drainage area shaded in red Figure 4: Typical Bankfull Indicators (McCandless and Everett, 2002) Figure 5: Plum Creek Riffle Particle Distribution Figure 6: Plum Creek Reference Reach Subpavement Particle Distribution Figure 7: Project area (outlined in red). Courtesy: Google Earth, 2007 Figure 8: Eroding bank of former dam Figure 9: Cross-Vane in Plan View Figure 10: J-Hook Vane in Plan View Figure 11: Log Roller Structure Figure 12: Soil Lift Structure Figure 13: Toe Wood Structure
LIST OF TABLES Table 1: Reach 1 Function Based Restoration Potential Table 2: Reach 2 Function-Based Restoration Potential Table 3: Plum Creek – Goals and Objectives Table 4: Channel Forming Discharge Table 5: Regional Curve Bankfull Characteristics Comparison Table 6: Floodplain Connectivity Table 7: Flow Dynamics Table 8: Bedform Diversity Table 9: Reference Reach Sediment Transport Competency Table 10: Riparian Vegetation Table 11: Lateral Stability Table 12: Channel Evolution Table 13: Water Quality Table 14: Aquatic Communities Table 15: Reach 1 Summary Table Table 16: Reach 2 Summary Table Table 17: Reach 1 Function-Based Restoration Potential Table 18: Reach 2 Function-Based Restoration Potential Table 19: Little Tuscarora – Goals and Objectives Table 20: Reach 1 Design Alternatives Analysis Table 21: Reach 2 Design Alternatives Analysis Table 22: Bankfull Riffle Characteristics Table 23: Plum Creek Design Criteria Table 24: Tractive Force Calculations Table 25: Design and Regional Curve Bankfull Characteristics Table 26: Sediment Transport Competency

Plum Creek Stream Restoration: Project Summary and Design Report
U. S. Fish and Wildlife Service June 2015 Chesapeake Bay Field Office Page | ix
APPENDICES
Appendix A. Location Map Appendix B. Soils Map Appendix C. Existing Conditions Appendix D. Function-Based Data Collection Form Appendix E. Computations of Velocity and Bankfull Discharge Using Various Methods Appendix F. Lentic Standard Checklist Appendix G. Stream Bank Erosion Summary Appendix H. Stream Classification Worksheet Appendix I. Proposed Restoration Design Appendix J. Sediment Transport Competency – Existing Appendix K. Velocity and Discharge Calculations Appendix L. Sediment Transport Competency – Design Appendix M. Planting Plan Appendix N. Assessment Review Checklist and Design Review Checklist

Plum Creek Stream Restoration: Project Summary and Design Report
U. S. Fish and Wildlife Service June 2015 Chesapeake bay Field Office Page | 1
I. INTRODUCTION
Maryland Department of Natural Resources (DNR), Maryland Department of the Environment (MDE), and the U.S. Fish and Wildlife Service (Service) - Chesapeake Bay Field Office are involved in a collaborative effort to restore in-stream habitat in approximately 500 linear feet of Plum Creek, located in Cecil County, Maryland (Appendix A). It flows southeast 3.0 miles from its source in Elk Neck State Forest into the Elk River, and ultimately enters the Chesapeake Bay. The site of the restoration currently has an earthen da1992m that was breached by floodwaters over a decade ago. This project will draw on the experience and expertise of federal, state, and county agencies to design, construct, monitor, and maintain the restored area. The goal of the restoration is to restore approximately 275 linear feet of stream just upstream of the existing earthen dam and approximately 225 linear feet downstream of the existing earthen dam.
This report documents the findings of the function-based watershed assessment, function-based reach-scale assessment and design development process the Service carried out in order to create the restoration plan for the Plum Creek Stream Restoration.
II. SITE SELECTION
Since the earthen dam breached, there have been several attempts made to repair the dam and stabilize the stream channel through the dam. Those attempts have not been successful and the site continues to provide a large amount of sediment from the dam and stream bank erosion to Plum Creek. As a result, MDE is requiring DNR to stabilize the site.
The Service conducted a rapid assessment to determine the restoration potential of the proposed site. The area has been impacted by an in-channel impoundment and subsequent failure of the dam during a large storm event. The failure led to unstable stream banks, poor bedform diversity, stream bed siltation, little to no riparian vegetation or buffer, and increased water temperatures. Given that the entire watershed is forested and potential restoration lift for Levels 1-5, the Service and DNR felt that the proposed site would be an excellent candidate for habitat restoration. A detailed watershed assessment and functional assessment are discussed later in the report. The restoration will return the stream channel to a stable, self-maintaining state and incorporate a dense riparian buffer area. This will significantly increase the amount of available aquatic habitat and significantly reduce the amount of sediment moving downstream and degrading in-stream habitat in Plum Creek.

Plum Creek Stream Restoration: Project Summary and Design Report
U. S. Fish and Wildlife Service June 2015 Chesapeake Bay Field Office Page | 2
III. PROJECT PROCESS METHODOLOGY
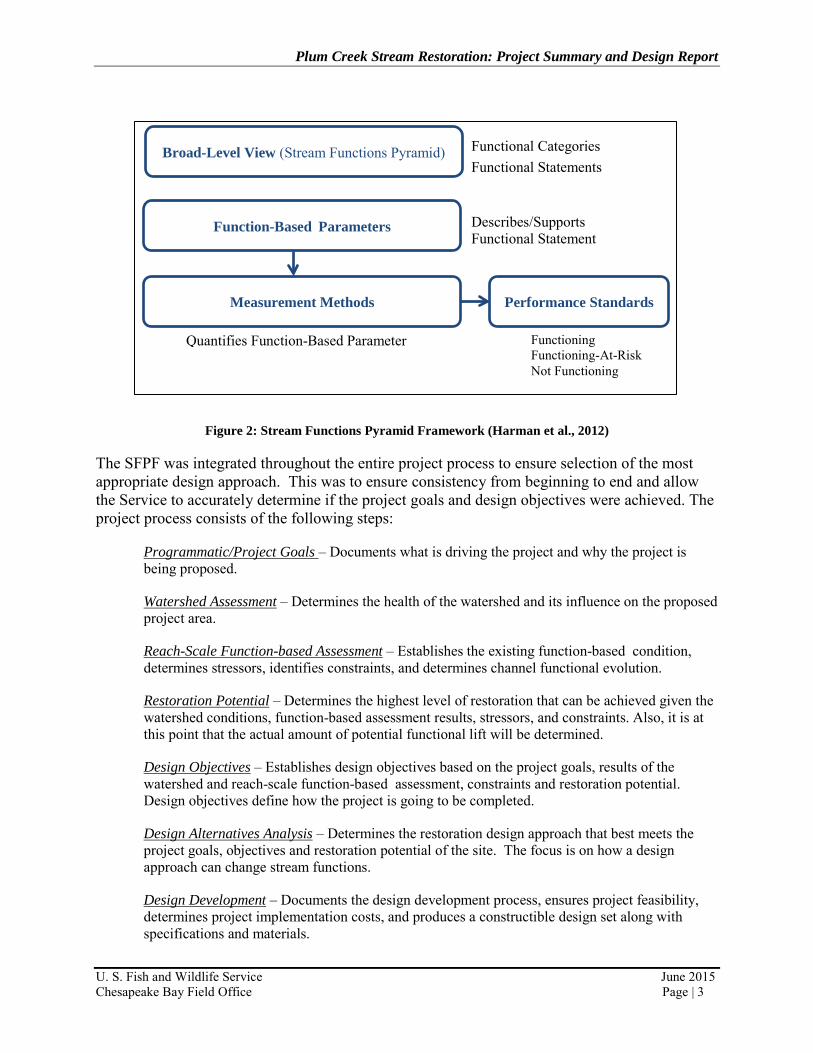
The project process used follows the approach outlined in the document: A Function-Based Framework for Stream Assessment and Restoration Projects (Harman et. al, 2012). This document is based on the premise of a hierarchal relationship of stream functions where lower-level functions support higher-level functions and that they are all influenced by local geology and climate, which underlies the Pyramid (Figure 1). The Pyramid consists of five critical categories that evaluate stream functions. The framework of the Streams Functions Pyramid, (commonly called SFPF) is shown below in Figure 2. The Broad-Level View is the Stream Functions Pyramid graphic that was discussed above and shown in Figure 1. The remainder of the framework is a “drilling down” approach that provides more detailed forms of analysis and quantification of functions. The function-based parameters describe and support the functional statements within each functional category. The “measurement methods” are specific tools, equations, assessment methods, etc. that are used to quantify the function-based parameter. There can be more than one measurement method for a single function-based parameter. How the SFPF is specifically applied to the watershed and reach-level assessments is described below.
Figure 1: Stream Functions Pyramid (Harman et. al, 2012)
Plum Creek Stream Restoration: Project Summary and Design Report
U. S. Fish and Wildlife Service June 2015 Chesapeake Bay Field Office Page | 3
Figure 2: Stream Functions Pyramid Framework (Harman et al., 2012)
The SFPF was integrated throughout the entire project process to ensure selection of the most appropriate design approach. This was to ensure consistency from beginning to end and allow the Service to accurately determine if the project goals and design objectives were achieved. The project process consists of the following steps:
Programmatic/Project Goals – Documents what is driving the project and why the project is being proposed.
Watershed Assessment – Determines the health of the watershed and its influence on the proposed project area.
Reach-Scale Function-based Assessment – Establishes the existing function-based condition, determines stressors, identifies constraints, and determines channel functional evolution.
Restoration Potential – Determines the highest level of restoration that can be achieved given the watershed conditions, function-based assessment results, stressors, and constraints. Also, it is at this point that the actual amount of potential functional lift will be determined.
Design Objectives – Establishes design objectives based on the project goals, results of the watershed and reach-scale function-based assessment, constraints and restoration potential. Design objectives define how the project is going to be completed.
Design Alternatives Analysis – Determines the restoration design approach that best meets the project goals, objectives and restoration potential of the site. The focus is on how a design approach can change stream functions.
Design Development – Documents the design development process, ensures project feasibility, determines project implementation costs, and produces a constructible design set along with specifications and materials.
Broad-Level View (Stream Functions Pyramid)
Function-Based Parameters
Measurement Methods Performance Standards
Functional Categories Functional Statements
Describes/Supports Functional Statement
Quantifies Function-Based Parameter Functioning Functioning-At-Risk Not Functioning

Plum Creek Stream Restoration: Project Summary and Design Report
U. S. Fish and Wildlife Service June 2015 Chesapeake Bay Field Office Page | 4
Monitoring Plan – Determines if the quantifiable project objectives are achieved and that existing functioning parameters remain functioning.
IV. PROGRAMMATIC / PROJECT GOALS
The project goals of the Plum Creek Stream Restoration vary with the three agencies involved in the restoration. DNR’s goals are to reduce lateral and vertical erosion; provide fish passage for resident fish; and create habitat for state rare species, specifically the Banded Sunfish. The goal for MDE is to have the repair agreement fulfilled and the sediment source at the site stabilized. The Service’s goals are to reduce lateral and vertical erosion; create in-stream habitat for American eel; and to create wetland habitat for birds, frogs, salamanders, and reptiles. Although Plum Creek is likely intermittent in the area of the project, the Service used design criteria that includes deep pools to hold water during those times.
The successful completion of the Plum Creek Stream Restoration project will satisfy strategic objectives put in place by the President’s Chesapeake Bay Initiative, as well as the U.S. Fish & Wildlife Service strategic plan for trust species.
V. WATERSHED AND REACH ASSESSMENT
This section presents a brief summary of the methods used by the Service to conduct a limited assessment on the watershed (Figure 3) and a detailed function-based stream assessment. The findings are presented and discussed within this report.

Plum Creek Stream Restoration: Project Summary and Design Report
U. S. Fish and Wildlife Service June 2015 Chesapeake Bay Field Office Page | 5
Figure 3: Project drainage area shaded in red.
A. WATERSHED ASSESSMENT
This section presents a brief summary of the methods used by the Service to conduct a limited watershed assessment (Figure 3) and a detailed function-based stream assessment. The findings are also presented and discussed. The purpose of the watershed assessment is to determine the influence of the watershed health on the proposed project area. Specifically, watershed characteristics are evaluated to document hydrology (i.e., flow regime), sediment transport load (i.e., sources and amount), water quality (i.e., types and sources) and biology (i.e., locations and health). By understanding watershed conditions, we are able to determine if programmatic goals are achievable, as well as determine the restoration potential of the project reach.
1. Geology and Soils The Plum Creek watershed is located in the Coastal Plain physiographic province. The Plum Creek project area primarily consists of three soil types (i.e., RmD-Russett-Christiana-Hambrook complex, 10 to 15 percent slopes; RmC-Russett-Christiana-

Plum Creek Stream Restoration: Project Summary and Design Report
U. S. Fish and Wildlife Service June 2015 Chesapeake Bay Field Office Page | 6
Hambrook complex, 5 to 10 percent slopes; and Keyport loam, 5 to 10 percent slopes) that comprise 64.1% of the total watershed. The Russett-Christiana-Hambrook complex consist of three map units. Russet and similar soils compises approximately 45 percent of the complex, Christiana and similar soils are approximately 35 percent, and Hambrook and similar soils make up the final 20 percent of the complex. The complex is deep, moderately well to well drained and may be located on hillslopes, drainhead complexes, flats, and depressions. Permeability is 0.06 to 1.98 in/hr throughout but is limited by capacity. Slopes range from 5 to 15 percent. Mean annual precipitation is about 37 - 48 inches, and mean annual temperature is about 45 - 55 degrees F. The Keyport loam consists of very deep, moderately well drained soils and typically located in hillslopes and fluviomarine terraces. Permeability is 0.06 to 0.20 in/hr throughout but is limited by capacity. Slopes range from 5 to 10 percent. Mean annual precipitation is about 42 - 48 inches, and mean annual temperature is about 52 - 58 degrees F. The majority of the soils in the watershed are moderately well to well drained, have slopes of 5 to 15 percent, and are limited in the capacity to hold soil moisture after rainfall events. Those three factors likely reduce the amount of ground water recharge and limits the amount of ground water available to recharge the stream during dry months. So, during the dryer months it is possible that Plum Creek may little to no flow. A soils map of the Plum Creek project area can be found in Appendix B. The RmC and RmD are both on the highly erodible soils list for Cecil County. The potential to erode is based on texture, structure, organic matter and permeability. The watershed soils have a Kw factor that ranges from 0.28–0.43 of and is generally considered as a moderately erosive soil. Erosion can be reduced if these soils are well vegetated, but mixed land use and impervious surfaces can accelerated bank erosion throughout the watershed.
2. Existing Land use/Land cover
The Service used aerial photographs and USGS SteamStats for Maryland (U.S. Geological Survey, 2012) to estimate the land use/land cover percentages for the Plum Creek watershed. Based on Maryland Department of Planning data from 2010, the primary land use in the watershed is forest accounting for 99.6% of the coverage. Institutional and other land use make up the remaining 0.40%. Currently, the watershed consists of 0.17% impervious surface. The mostly forested watershed and the low amount of impervious surface results in a non-flashy flow regime. Additional benefits include large riparian buffers, increased riparian filtration times, increased shading of the stream channel resulting in lower water temperatures, and improved water quality.
3. Hydrology & Hydraulics
The Plum Creek watershed is a sub-watershed of the Elk River, which flows directly into the Chesapeake Bay. The Plum Creek watershed covers approximately 0.90 square miles (Figure 3) at the project location and is in the Coastal Plain hydrologic region. The valley type at the project area, as defined by Rosgen (1996) is a valley type VIII; a wide, gentle valley slope with a well-developed floodplain adjacent to river terraces. These alluvial floodplains are maintained by the river and are dynamic in form. However, in

Plum Creek Stream Restoration: Project Summary and Design Report
U. S. Fish and Wildlife Service June 2015 Chesapeake Bay Field Office Page | 7
the headwaters, the valley type can by described as a Rosgen valley type II; moderately steep, gentle sloping side slopes often in colluvial valleys. As valley type changes, there is also a change in the stream types within the Plum Creek watershed. The headwater portions of the watershed contain reaches of Plum Creek that are consistent, as defined by Rosgen (1996) with a stream type B4. The channels upstream and downstream of the project area are best described as a C4; exhibiting a slope of less than 0.02 ft/ft, a sinuosity of 1.2 or greater and a width to depth ratio of greater than 12. While B4 stream types are stable and contribute only small amounts of sediment during run off events, C4 stream types have banks generally composed of unconsolidated, heterogeneous, non-cohesive, alluvial materials that are finer than the gravel-dominated bed material. Consequently, the stream is susceptible to accelerated bank erosion. Rates of lateral adjustment are influenced by the presence and condition of riparian vegetation (Rosgen 1994) as well as other factors. Plum Creek exhibits a flow regime typical of streams found in rural areas. The watershed receives an average 46.2 inches of precipitation annually (U.S. Geological Survey, 2012). Precipitation amounts for the two-year, twenty-four hour rain event are 3.24 inches, which deliver as much as 31 cfs to our site in 7.9 hours of time using the W.O Thomas, Jr. Equation. This data suggests that the watershed is not “flashy” based on comparisons of like sized rural watersheds with similar basin relief. While knowing the hydrology of a watershed is important, it usually cannot be manipulated. However, the watershed hydrology must be understood in order to develop a sound restoration plan. The Plum Creek watershed hydrology is not complex and is typical for the region. It is likely that Plum Creek is intermittent at the project area. The Service included deep pools in the design criteria and riparian wetlands to hold water during dry periods. Even with those design features, the potential lack of base flow may negatively affect fish and macro invertebrate populations.
4. Geomorphology
The Plum Creek watershed contains a distinguishable valley and stream type transition from the headwaters in the Elk Neck State Forest to its terminus at its confluence with the Elk River. The headwaters portion of the watershed consists of moderately stable B4 type (Rosgen) channels in a low relief basin with a large gravel substrate, while the lower portion of the watershed contains meandering C4 Rosgen type channels with lower relief and a gravel substrate. The headwaters portion of the watershed was observed to be stable with localized lateral and vertical instability associated with the impacts of the former impoundment. The lower portion of the watershed shows only local indices of vertical instability. This observation is further defined by the presence or absence of things such as over steepened riffles, and poorly defined pools, glides and riffles. However, moderate lateral instability is evident by the presence of eroding outside meanders. Watershed wide observations support that there is a low to moderate sediment source from stream bank erosion that must be transported through the system, as evidenced by depositional features, such a point bar formations, mid-channel bars and inner berm features. This watershed-scale sediment source defines Plum Creek as a

Plum Creek Stream Restoration: Project Summary and Design Report
U. S. Fish and Wildlife Service June 2015 Chesapeake Bay Field Office Page | 8
conveyance type channel, which plays a critical role in determining and selecting the correct design methodology.
5. Physicochemical and Biology
Physicochemical functions include the interaction of physical and chemical processes to create the basic water quality of the stream (including temperature, dissolved oxygen, conductivity, pH and turbidity), as well as to facilitate nutrient and organic carbon processes. These parameters provide both direct and indirect indications of stream condition and its ability to support biological conditions (Harmen et al., 2012). The Plum Creek watershed has a number of influential factors that must be considered in order to determine if the a reach-scale restoration can have any impact on the existing physicochemical functions or if these variables cannot be influenced. External discharges from upstream, point source and non-point source contributions, effects of land-use change and climate factors all influence physicochemical function. The watershed is totally located within the Elk Neck State Forest, so land use should remain as forested in the future. Therefore, the almost totally forested watershed should have very limited, if any negative impacts on water quality. Very limited physicochemical and limited biological data is available for the Plum Creek Watershed. DNR Stream Wader Volunteers have sampled benthic macroinvertebrates five times in area upstream and downstream of the project area and found the benthic IBI to be poor. No physicochemical or fish data was collected by the stream waders. In 2008, DNR MBSS sampled for fish and benthic macroinvertebrates approximately 1000 feet downstream of the existing dam. Both the fish IBI and benthic IBI were found to be poor. Harmen’s SFPF suggests that the ability of the lotic system to support biological processes is dependent upon the Hydrology, Hydraulic, Geomorpholgy, and Physicochemical functions. Naturally, a disruption in any one of the previously mentioned functions would result in loss of biologic diversity and abundance. Given that the watershed size at restoration site is small, at only 0.9 square miles, Plum Creek frequently dries up during the summer months. Since Plum Creek is intermittent, the lack of water in the channel will have a direct impact on the fish and benthic macroinvertebrate communities. J.R. Maxted et al. stated that coastal plain streams are often naturally acidic because of the high concentrations of humic and fulvic acids. Diptera and Ephemeroptera are sensitive to pH values less than 5.0 (Johnson et al. 1993). The 2008 lab pH value of 4.74 collected by DNR MBSS supports the idea that Plum Creek is naturally acidic and that the fish and benthic macroinvertebrate communities may be impacted.
6. Watershed Assessment Summary The Plum Creek watershed is totally located within the Elk Neck State Forest and almost completely forested. The Service assembled a variety aerial photos from 1938 through current day and USGS topographic quadrangle maps from 1917 through 1992. Based on those photos and maps, it appears that the Plum Creek Watershed was forested from 1917

Plum Creek Stream Restoration: Project Summary and Design Report
U. S. Fish and Wildlife Service June 2015 Chesapeake Bay Field Office Page | 9
to current day. However, it is likely that harvests were conducted during that time period within the watershed. While the flows may have changed slightly since the early 1900’s as a resulting of the logging and harvest practices, the flow regime is still considered non-flashy. However, those adjustments, coupled with erosive soils, have led to localized lateral instability throughout the watershed. Therefore, the proposed project area will have a sediment supply that must be addressed in the proposed design. The impoundment from the dam first appeared on the 1970 aerial photograph and 1970 USGS topographic quadrangle map. Once the dam was installed, the stream channel was impacted upstream and downstream of the impoundment, while flooding a portion of the valley. This change lead to lower velocities and sediment deposition upstream of the impoundment; and higher velocities and bank erosion at the outlet of the impoundment. Once the dam failed, the stream channel was again undergoing base level adjustment. Upstream of the former impoundment, the stream still deposited sediment due to the lack of a defined channel. While downstream of the former dam the stream received a high sediment load from the eroding dam. Collectively, these “stressors” impact the restoration potential of the proposed project area. While these stressors cannot currently be addressed at the watershed level as part of this project, they can be addressed at the reach-level with the appropriate design approach. The design approach is enough to support the project goals for all three agencies, which are to reduce lateral and vertical erosion; provide fish passage for resident fish; create habitat for state rare species, specifically the Banded Sunfish; create in-stream habitat for American eel; and to create wetland habitat for birds, frogs, salamanders, and reptiles.
B. BASE MAPPING
The Service conducted a baseline survey to accurately map (Appendix C) and represent the project area. In addition, the Service incorporated previous NRCS survey data and Cecil County Lidar to the base map. The Service used this information to assess base line conditions and to develop and illustrate a restoration design plan. Plan form, longitudinal profile, and topographic information are represented.
C. PROJECT REACH FUNCTION-BASED ASSESSMENT
The Service conducted a function-based assessment of Plum Creek. This function-based assessment approach is outlined in the Stream Functions Pyramid Framework (SFPF) (Harmen et. al, 2012) and includes measurement methods, performance standards and goal setting criteria for function-based stream restoration. The project area consisted of two reaches, which are show on the design plans in Appendix I. The framework outlines five critical categories that evaluate stream function on a hierarchal scale (Figure 2). Prior to the function-based reach assessment, the Service prepared a function-based assessment table that outlined the parameters, based on project goals and objectives, to be assessed and what methods were required to assess them. This table is located in Appendix D.

Plum Creek Stream Restoration: Project Summary and Design Report
U. S. Fish and Wildlife Service June 2015 Chesapeake Bay Field Office Page | 10
The following assessment parameters, by pyramid level, were evaluated: Level 1 - Hydrology – flow regime Level 2 - Hydraulics – floodplain connectivity and flow dynamics Level 3 - Geomorphology – bedform diversity, lateral stability and riparian vegetation Level 4 - Physicochemical – temperature, pH, dissolved oxygen, conductivity and turbidity Level 5 - Biology – macroinvertebrate communities and fish communities Each assessment parameter had at least one measurement method to quantify the existing function-based condition. Then each measurement method value was rated either functioning, functioning-at-risk, or not functioning based on set performance standards. Specific measurements for each assessment parameter are described below.
1. Hydrology
The Service determined that that hydrology at this particular site was dependent on parameters that include regional precipitation data/climate zones, land use and soils. Because this information represents our Hydrologic baseline, and it cannot be changed, it has no rating and will only be used to model pre-restoration conditions as they compare to proposed design conditions.
The 2-year, 24-hour precipitation for this project area is 3.24 inches and the mean annual precipitation is 44.75 inches. The watershed had an average curve number of 67 with 93.5 feet of basin relief. Time of concentration to the inlet of the project area was 7.9 hours using the W.O. Thomas, Jr. Equation. This information was utilized when determining flow characteristics. The hydrology for the watershed is consider non-flashy.
Since no gage station information was available for this site, a regional curve (McCandless and Everett, 2002) was used to determine the approximate channel forming discharge and was later validated using information from the geomorphic assessment. The 2, 10, and 100-year peak discharge events were determined by using USGS StreamStats (U.S. Geological Survey, 2012).
The table below summarizes the findings from above as they relate to actual discharge at the Plum Creek project site, which includes both Reaches 1 and 2.

Plum Creek Stream Restoration: Project Summary and Design Report
U. S. Fish and Wildlife Service June 2015 Chesapeake Bay Field Office Page | 11
Level and Category Parameter Measurement
Method
Pre-Restoration Condition
Value Rating
1 - Hydrology
Channel Forming Discharge (Bankfull)
USFWS Piedmont Regional Curve 78 cfs N/A
Bankfull Validation 53 cfs N/A
2-Year Peak Flow USGS 61 cfs N/A
10-Year Peak Flow USGS 240 cfs N/A
100-Year Peak Flow USGS 839 cfs N/A
Table 4: Channel Forming Discharge
2. Hydraulics Evaluating the hydraulics of a stream system is an important component to any assessment because it gives a better understanding of how water and sediment are transported through the channel and its associated floodplain. The Service identified and assessed two major hydraulic components during the Plum Creek function-based assessment: Floodplain connectivity and Flow Dynamics. However, before you can determine floodplain connectivity, you must first understand and determine the bankfull discharge at the project area as this value serves as the basis for all geomorphic dimensionless ratios.
a. Bankfull Validation Bankfull discharge characterizes the range of discharges that is effective in shaping and maintaining a stream. Over time, geomorphic processes adjust the stream capacity and shape to accommodate the bankfull discharge within the stream. Bankfull discharge is strongly correlated to many important stream morphological features (e.g., bankfull width, drainage area, etc.) and is the critical parameter used by the Service in assessing Plum Creek. Bankfull discharge is also used in natural channel design procedures as a scale factor to convert morphological parameters from a stable reach of one size to a disturbed reach of another size. The Service used Regional Relationships as well as Resistance Relationships to determine the bankfull discharge and channel dimension at Plum Creek.

Plum Creek Stream Restoration: Project Summary and Design Report
U. S. Fish and Wildlife Service June 2015 Chesapeake Bay Field Office Page | 12
i. Regional Relationships During the Plum Creek assessment, the Service identified bankfull stage using geomorphic indicators formed by the stream as described by McCandless and Everett (2002). These features were identified upstream and downstream of the project area since a large portion of the project area does not have a defined channel. Figure 4 depicts significant geomorphic indicators typically found in the Mid-Atlantic. Based on these indicators, the Service identified a consistent geomorphic feature at Plum Creek. This geomorphic indicator was typically a significant slope break or back of bench found throughout the project area. These indicators were measured to determine width and depth and then compared to the “USFWS Bankfull Discharge and Channel Characteristics in the Piedmont Hydrologic” regional curves.
Figure 4: Typical Bankfull Indicators (McCandless and Everett 2002)
The regional curve estimates channel discharge based on a linear regression equation derived from gaged sites across the same physiographic region with similar characteristics. Using only the drainage area, the Service was able to derive the estimated channel width, depth, cross sectional area and discharge. This information was then crossed with field measurements to determine congruency. The Service does not recommend using only regional curve information to determine bankfull discharges and characteristics, but serves better as a first step for estimation. The Service identified a reference reach immediately downstream of the project area and took additional field based geomorphic measurements (Table 5) including cross sectional area, channel slope and particle distribution to validate bankfull dimension and discharge (Appendices E – H).

Plum Creek Stream Restoration: Project Summary and Design Report
U. S. Fish and Wildlife Service June 2015 Chesapeake Bay Field Office Page | 13
Bankfull Characteristics
Existing Representative Cross Section
Area (ft2) 12.22Width (ft) 12.75Depth (ft) 0.96Velocity (ft/s) 4.33Discharge (cfs) 52.90Maryland Stream Survey: Bankfull Discharge and Channel Characteristics of Streams in the Piedmont Hydrologic Region (McCandless, 2002)
USFWS Piedmont Regional Curve
16.1314.181.144.83
78.05
Table 5: Regional Curve Bankfull Characteristic Comparison
ii. Resistance Relationships There are several methods to estimate bankfull discharge and velocity using resistance relationships. These methods typically make use of the cross sectional area, flow depth, representative particle size of channel substrate, channel slope and a determined roughness coefficient, or “friction factor”. The Service used the Friction Factor/Relative Roughness to determine discharge. This equation, 𝑢 = {2.83 + 5.66 ∗ 𝐿𝐿𝐿(𝑅/𝐷84)}𝑢 ∗, uses the hydraulic radius of the representative cross section, the channel slope, gravitational acceleration, and channel materials to determine velocity and discharge values. This method closely matched our back calculated roughness coefficient , fell between the two values in our Regional Relationship findings, and proved to be an appropriate estimate for bankfull discharge. Detailed information can be found on the Computation of velocity and bankfull discharge worksheet in Appendix E.
b. Floodplain Connectivity Floodplain connectivity is defined by the frequency of stream flows that access a streams floodplain. These frequent, out-of-bank flows encourage dense riparian cover and riparian wetlands that are invaluable to the overall functioning condition of a stream system. Historically, streams in most of the eastern part of the U.S. have been subject to “channelization”, a common practice to lessen the effects of overland flooding and increase flood flow capacity. While effective, channelization often leads to the loss of wetlands, lowering of the groundwater table, reduced species composition and increased sedimentation. Floodplain connectivity is a driving force for many of the geomorphic and ecologic functions (Wohl, 2004; Shields et al., 2010). Therefore, reconnecting floodplains is a major goal when working in watersheds that have channelized streams (Harman et al., 2012).
The channel conditions within the project area vary considerably upstream of the dam in the former impoundment from the area downstream of the dam. Upstream of the dam (Reach 1), the area is a depositional area as a result of the former impoundment and doesn’t have a defined channel. Downstream of the dam (Reach 2), the channel has been impacted by the large amount of sediment washing downstream from the dam. This area is an unstable D4 Rosgen type channel that includes areas of deposition and vertical instability with a number of small headcuts. The Service divided the project into two separate reaches based on existing conditions and from this point on will discuss the function-based assessment based on those two reaches

Plum Creek Stream Restoration: Project Summary and Design Report
U. S. Fish and Wildlife Service June 2015 Chesapeake Bay Field Office Page | 14
i. Bank Height Ratio There are a number of measurements methods used to determine floodplain connectivity. The first, and perhaps easiest way to determine whether or not a stream is connected to its floodplain is by determining the bank height ratio (BHR). The BHR is simply the average height of the top of bank divided by the bankfull height.
This measurement or bank height ratio was derived by first determining the correct bankfull height at our project area, and then comparing that to typical top of bank measurements throughout the project area. Bank height values greater than “1” indicate that the channel exhibits a degree of channel incision and does not interact with its floodplain as often as it should which reduces stream function, increases bank erosion and limits vegetative filtration necessary to reduce TMDL levels. By using the performance standards found in the SFPF, the Service determined that both Reach 1 and Reach 2 are Functioning. ii. Entrenchment Ratio The entrenchment ratio (ER) is a measure of the floodprone area width in relation to the bankfull width (Rosgen 1994). The ER is calculated by dividing the bankfull width by the available floodprone width at a water surface elevation two times greater than that of bankfull in a riffle cross section. A higher ER value means a higher availability of floodplain area for energy dissipation and flood storage. When coupled with the BHR, these measurement techniques provide a quick way to determine floodplain connectivity in the field.
The Service determined that Plum Creek Reach 1 does not have an entrenchment ratio, since there is not a defined channel. Reach 2 had an entrenchment ratio of 7.8, meaning when stage is two times greater than the bankfull maximum depth, the available floodplain measures 7.8 times the bankfull width, in this case, 100 feet. By using the performance standards found in the SFPF, the Service determined that Reach 1 and Reach 2 of Plum Creek are Functioning due to the amount and accessibility of available floodplain.

Plum Creek Stream Restoration: Project Summary and Design Report
U. S. Fish and Wildlife Service June 2015 Chesapeake Bay Field Office Page | 15
Reach Level and Category Parameter Measurement
Method Pre-Restoration Condition
Value Rating
1 2 - Hydraulics Floodplain Connectivity
Bank Height Ratio N/A Functioning
Entrenchment Ratio N/A Functioning
2 2 - Hydraulics Floodplain Connectivity
Bank Height Ratio 1.1 Functioning
Entrenchment Ratio 7.8 Functioning
Table 6: Floodplain Connectivity
c. Flow Dynamics Performance standards for Flow Dynamics, vary considerably based on watershed, site conditions, and species need. They also play an important part in developing restorations designs. The Service used tractive force calculations as to conduct a hydraulic assessment of this particular reach to assure the restoration design would not cause any unsafe rise in hydraulic forces within the channel. The design maximized the use of the available floodplain within the project area. Therefore, the design objective is to have similar or lower velocities, shear stress, and stream power in relation to stage and discharge, compared to the existing unstable conditions. The tractive force calculation compared only the existing riffle cross section data to the design riffle cross section data. The SFPF (Harmen et al., 2012) states that shear stress and stream power are important input parameters for assessing sediment transport; however, there are other Geomorphology parameters and measurements methods that are better for developing performance standards. Stream velocity can be used as a flow dynamics performance standard, especially for evaluating the appropriate bankfull discharge (and flow area) and for fish passage. Reach 1 is currently an impoundment created by the remains of an earthen dam and a beaver dam. Water entering the impoundment from upstream slows to a very low velocity once it encounters the backwater of the dams. Using the SFPF performance standards for a “C” stream type, the Service determined that the stream velocity of Plum Creek is Not Functioning in Reach 1 because of the very low velocities in the impoundment. With a velocity of 4.6 in Reach 2, it is considered Functioning.

Plum Creek Stream Restoration: Project Summary and Design Report
U. S. Fish and Wildlife Service June 2015 Chesapeake Bay Field Office Page | 16
Reach Level and Category Parameter Measurement
Method Pre-Restoration Condition
Value Rating
1 2 - Hydraulics Flow Dynamics Stream Velocity N/A Not Functioning
2 2 - Hydraulics Flow Dynamics Stream Velocity 4.6 Functioning
Table 7: Flow Dynamics
3. Geomorphology
a. Bedform Diversity Bedform diversity is relatively simple to assess. Measurements of bed form diversity are structural measurements that can be used to predict sediment loading, transport capability and is critical in assessing habitat requirements of aquatic species. A longitudinal profile of a stream channel provides detailed information about the bed form and can be used to quantify diversity (Harrelson et al., 1994). The Service assessed both Pool-to-Pool Spacing and Pool Depth Variability to determine the function-based condition of Plum Creek. Both measurements can be extracted from the detailed longitudinal profile.
i. Pool-to-pool Spacing Pool-to-Pool spacing measures the frequency of pools in the stream reach and is the distance measured along the stream centerline of thalweg, between the deepest point of two pools (Harmen et al. 2012). Studies have found that C and E stream types with pool-to-pool spacing with ratios greater than 5 are at greater risk to develop vertical instability problems. Plum Creek Reach 1 is one big pool, therefore, it does not have a Pool-to-pool spacing and thus is considered Not Functioning. Reach 2 has Pool-to-pool spacing range of 2.0 – 4.0, which is considered low and therefore, Not Functioning.
ii. Pool Depth Variability Pool depth variability is desirable for high pool habitat diversity. Streams with similar pool depths or a narrow range of pool depths likely means that there is limited habitat and the pools are filled with sediment. Pool depth variability is determined by dividing the mean riffle depth measured at a representative cross section by maximum pool depths measured from bankfull. This dimensionless ratio is referred to as the Pool Max Depth Ratio (Rosgen, 2009). Reach 1 does not have a defined channel, but instead is one large pool. Even though there is only one pool, it does have a depth ratio of 3.0 and is considered Functioning. Plum Creek Reach 2 had a pool depth variability in the range of 1.2 – 1.5, which is considered low. Based on performance standards of the SFPF, pool depth variability is considered Functioning at Risk in Reach 2.

Plum Creek Stream Restoration: Project Summary and Design Report
U. S. Fish and Wildlife Service June 2015 Chesapeake Bay Field Office Page | 17
iii. Depositional Patterns Depositional patterns describe the nature and extent of bar features in rivers (Rosgen, 1996). While many of these features may be dynamic in nature, they are often stable geomorphic features. For instance, point bars, on stable C4 stream types are stable depositional features. Alternatively, depositional features can also be indicators of excess deposition, which can lead to channel enlargement and/or aggradation. Depositional features like mid-channel bars, islands, chute cut-offs and side bars can be indicators of excess sediment or the inability of a channel to transport its sediment supply. These depositional categories have been identified and categorized by Dave Rosgen (Rosgen, D.L., 2009) to aid in the assessment of lateral and vertical stability. The Service used Rosgen’s existing Depositional Pattern Worksheet to classify observed depositional features at Plum Creek. Based on findings, the Service interpolated Rosgen’s stability rating to Harman’s SFPF rating system. Using this standard, the Service found B5 Depositional Patterns in Reach 1 classing this segment of stream as Not Functioning. Depositional Patterns B1, B2, B5, and B6 were found in Reach 2 giving this reach a Not Functioning rating.
Reach Level and Category Parameter Measurement
Method Pre-Restoration Condition
Value Rating
1 3 - Geomorphology
Bedform Diversity
Pool-to-pool Spacing <1.0 Not
Functioning Pool Depth Variability 3.0 Functioning
Depositional Pattern B5 Not
Functioning
2 3 - Geomorphology
Bedform Diversity
Pool-to-pool Spacing 2.0 - 4.0 Not
Functioning Pool Depth Variability 1.2 - 1.5 Functioning at
Risk Depositional
Pattern B1, B2, B5,B6 Not Functioning
Table 8: Bedform Diversity
b. Bed Material Characterization Analyzing the substrate of a stream is often one of the first steps in basic stream survey. Understanding substrate composition is important when analyzing things like bed forms, sediment transport values, macroinvertebrate habitat and fish habitat because it influences each one. Typically, gravel bed streams are used to show functional lift after restoration. Overall coarsening of the streambed would indicate less fine materials are available or able to embed, meaning the stream has the energy and ability to deposit those materials in the floodplain or out of the project reach, which is often the goal of restoration in gravel bed streams. This is the case of the Plum Creek stream restoration. Baseline bed material classification was gathered in a reference reach immediately downstream of the project area by using the Wolman

Plum Creek Stream Restoration: Project Summary and Design Report
U. S. Fish and Wildlife Service June 2015 Chesapeake Bay Field Office Page | 18
(1954) pebble count procedure. Complete findings are shown in Figure 5 below, but it was found that our d50 was equal to 20.33 mm which confirms that Plum Creek is a gravel bed stream. While there is no performance standard associated with the Wolman (1954) pebble count procedure, the findings serve as a monitoring benchmark. Future samples can be compared to one another to see the streambed coarsen over time.
Figure 5: Plum Creek Riffle Particle Distribution
c. Sediment Transport Capacity Sediment transport capacity is typically defined as the amount of sediment that a stable riffle cross section can pass at bankfull flows. This information is unique to the stream system and is important to understand when developing restoration plans. If a stream system is receiving sediment from upstream, it must have the ability to transport that amount through the project area in order to maintain dynamic equilibrium, or not aggrade or degrade. Transport capacity studies can be intensive and cost prohibitive and yield marginally accurate results. Therefore, the Service used field indicators (i.e., bar formation, bedform diversity, and floodplain deposition) to assess sediment capacity conditions.
The watershed assessment showed that there is a low to moderate sediment supply entering the project reach. The reach-level showed that the sediment supply is consistent with the watershed assessment. In Reach 1 as the channel enters the impoundment, the stream deposits all of the sediment it is transporting due to the very low velocities. Reach 2 contains recent deposition within the channel. The reference reach stream channel existing riffles consist of coarse, gravelly material along with recent deposition on point bars. If there were excessive sediment, these riffles would be covered with fine sediment. Lastly, there are no large amounts of deposition within the adjacent floodplain. If the sediment supply was excessive, there would be numerous depositional areas, typically consisting of coarse-large sand materials, through the floodplain.

Plum Creek Stream Restoration: Project Summary and Design Report
U. S. Fish and Wildlife Service June 2015 Chesapeake Bay Field Office Page | 19
d. Sediment Transport Competency The size of sediment that a stable riffle cross section can pass at bankfull flows is referred to as the stream’s Sediment Transport Competency. This information is valuable as it allows a designer to understand the stream dimension and channel shear stress necessary to entrain different sized particles in order to achieve “competency”. This is important parameter to assess when determining a streams vertical stability. If a stream is unable to pass all of the sediment it is supplied, it would be aggrading which would mean it is vertically unstable. It is also possible that the stream could move all of the sediment it is supplied as well as additional bed material, meaning the stream is degrading and also indicates vertical instability. While there is more than one method to use to assess sediment transport competency, the Service used a method to determine Required Depth and Slope explained in Rosgen (2006). This method involves sampling bed material from either the riffle pavement/subpavement layer or material from a point bar. The Service took a riffle pavement/subpavement in the reference reach downstream of the project area. The sample was sieved to determine the distribution, and the results can be seen in Figure 6. Both the reference reach and the restoration design are within the range of sediment transport competency for required depth and required slope measurement methods (Table 9). This is consistent with depositional patterns observed in the reference reach. However, Reach 1 within the project area is aggrading due to a lack of sediment competency, while Reach 2 is more similar to the reference reach.
Figure 6: Plum Creek Reference Reach Subpavement Particle Distribution

Plum Creek Stream Restoration: Project Summary and Design Report
U. S. Fish and Wildlife Service June 2015 Chesapeake Bay Field Office Page | 20
Level and Category Parameter Measurement
Method Pre-Restoration Condition
Design Required
3 - Geomorphology
Sediment Transport
Competency
Required Depth 1.02 1.27
Required Slope 0.011 0.013
Table 9: Reference Reach Sediment Transport Competency
e. Riparian Vegetation Riparian vegetation plays an important role, not only from a geomorphic stability standpoint, but also from a wildlife habitat and water quality perspective. Some benefits of a healthy riparian corridor include energy dissipation by capturing sediments from upslope overland flow (Magette et al., 1989), bank stabilization by roots that extend throughout the bank (Wynn et al., 2004) and landscape connectivity for animals traveling along the stream corridor (Fisher et al., 1998). Research has also shown that a well-managed restored buffer can trap and/or convert up to 75% of nitrogen and 70% of phosphorus from nonpoint source runoff, if the source is from land uses that are adjacent to the stream corridor (Orzetti et al.,2010; Claussen et al., 2000; Lee et al., 2003; Schoonover and Williard, 2005). Additional research has shown 50% to 80% reductions in sediment loads from adjacent nonpoint source pollution (Orzetti et al., 2010; Cooper et al., 1987; Daniels and Gilliam, 1996; Lowrance and Sheridan, 2005; Schoonover and Williard, 2005; Tomer et al., 2007). It is obvious that a properly functioning riparian corridor is crucial to the overall function of a stream system and that assessing the condition of the riparian vegetation is a first step in determining possible functional lift. The Plum Creek Stream Restoration project area exists within a mostly forested landscape, but a small portion of the project area consist of a gravel assess road and parking area. It appears from historical aerial photographs that the watershed has been forested for the last 100 years. The riparian buffer of the former impoundment prior to the dam breach ranged from 0 – 1000 feet. Currently in Reach 1 the majority of the impoundment bottom lacks vegetation due to the fluctuation of water levels caused by the remaining dam and beaver dams. In Reach 2, the buffer width exceeds 1000 feet consisting of native and non-native shrubs, understory trees, and mature canopy trees. While there are a variety of riparian condition measurement methods available, the Service chose to measure riparian vegetation condition by using the Proper Functioning Condition assessment tool as well as determining buffer width based on belt width.
i. Proper Functioning Condition A Proper Function Condition (PFC) evaluation method developed by the Bureau of Land Management (Prichard et al., 1998) was used to determine the functionality of the riparian corridor surrounding Plum Creek. PFC is less

Plum Creek Stream Restoration: Project Summary and Design Report
U. S. Fish and Wildlife Service June 2015 Chesapeake Bay Field Office Page | 21
quantitative than bank profiles, cross sections or the bank stability to erosion model. However, it is the only method here that assesses the stream channel and the riparian buffer to determine bank stability (Harmen et al. 2012). Using the Lentic Standard Checklist (Appendix F), the Service determined that the riparian corridor in Reach 1 was Nonfunctional, which is equivalent to Not Functioning using on the SFPF. The riparian corridor in Reach 2 was Funtional-At Risk, which is equivalent to Functioning at Risk.
ii. Buffer Width Buffer width measurements can be as simple as measuring the width of the riparian corridor from the top of the stream bank, perpendicular to the fall line of the valley and moving away from the channel (Harmen et al., 2012). An average width can be determined by taking a number of measurements at a variety of locations throughout the stream valley. The Service measured the riparian buffer width as it compared to the meander belt width of the channel. The meander belt width measurement is used to standardize the buffer width measurement and to create a baseline for the buffer width condition. A stable, meandering (sinuosity of 1.2 or greater) stream is said to have at least 15 feet of vegetative buffer measured from their outside meander bends towards the valley toe, in addition to a meander belt width of at least 3.5 times greater than its bankfull width. Measuring meander belt width is simply done by measuring the distance (perpendicular to the fall of the valley) between the apex of two consecutive meander bends. This method is desirable for creating straight riparian corridors that are also easier to manage. The service found that belt width of Plum Creek Reach 1 was less than 3.5 times the bankfull width and had less than 10 feet of riparian vegetation extending out from the outside meander bends to the toe of valley. Reach 2 had a belt width that was greater than 3.5 times the bankfull width and more than 15 feet of riparian vegetation. Meaning, that Reach 1 is considered to be Not Functioning while Reach 2 is considered Functioning by the performance standards in the SFPF.
Reach Level and Category Parameter Measurement
Method Pre-Restoration Condition
Value Rating
1 3 - Geomorphology
Riparian Vegetation
PFC N/A Not Functioning
Buffer Width from Meander
Belt width
Meander belt width ≤ 3.5'
Not Functioning
2 3 - Geomorphology
Riparian Vegetation
PFC N/A Functioning At Risk
Buffer Width from Meander
Belt width
Meander belt width > 3.5' Functioning
Table 10: Riparian Vegetation

Plum Creek Stream Restoration: Project Summary and Design Report
U. S. Fish and Wildlife Service June 2015 Chesapeake Bay Field Office Page | 22
Figure 7: Project area (outlined in red). Courtesy: Google Earth, 2007
f. Lateral Stability There are a variety of methods to determine lateral stability, each of which has specificity in their use as well as a range of precisions. One of the more precise methods involves profiling the bank with a detailed survey, then returning after a specified amount of time or discharge event to re-survey that specific bank. This method gives you an exact value of erosion at that specific location and can be crossed with the associated span of time since last surveyed. This method is often used to monitor both reference and restoration sites and to calibrate erosion rate curves. While precise, bank profiles are time consuming and other methods suffice when estimating erosion rates. The lateral stability of Plum Creek assessed by taking as plan form measurements to determine Meander Width Ratios (MWR) and Bank Erosion Hazard Index (BEHI) classifications of individual bank segments. A photo of typical stream bank conditions at the Plum Creek project site can be seen in Figure 8 and findings are summarized in Table 11.
i. Lateral Erosion Rate The Bank Erosion Hazard Index, or BEHI model, is a method developed by Dave Rosgen to rapidly estimate the amount of erosion of a particular bank segment by quantifying the banks physical condition. This method includes estimations of bank length, height, slope, materials, stratification, vegetative cover and root depth and density. When combined with the Near Bank Stress, or NBS estimate (also developed by Rosgen) it is possible to determine erosion quantity and rate. This method uses a combination of observed BEHI and NBS values which are plotted against the Colorado Erosion Rate Curve (Rosgen 2009). The Colorado

Plum Creek Stream Restoration: Project Summary and Design Report
U. S. Fish and Wildlife Service June 2015 Chesapeake Bay Field Office Page | 23
Erosion Rate Curve has been found to produce very accurate estimates throughout the Mid-Atlantic as well as other regions. The Service employed these methods to quantify the amount and rate of sediment being lost from bank erosion throughout the Plum Creek project area. The Service assessed eleven bank segments and found that the system was contributing approximately two hundred sixty tons of sediment per year at a rate of about 0.90 feet per foot per year. Reach 1 did not have banks to assess, since it lacks a defined channel and is considered to Functioning. The average BEHI condition in Reach 2 was found to be “Moderate to Very High” and based on the SFPF has rated that condition to be Functioning at Risk. Detailed BEHI data is located in Appendix G.
ii. Meander Width Ratio The meander width ratio (MWR) is a combination of two separate measurements, meander belt width divided by bankfull width. Dividing these values gives a ratio that can be compared to other streams and more specifically, reference condition streams. The minimum meandering width ratio for meandering streams (C and E types) is between 3.0 and 3.5; this ratio is required to create a sinuosity of at least 1.2, the most common break point between meandering and non-meandering streams (Rosgen, 1996; Leopold and Wolman, 1957). Alternatively, estimations can be made on the amount of lateral movement a stream will undergo if the current MWR of a meandering stream is below 3.5 by simply multiplying the streams bankfull width by 3.5. This measurement can be rapidly determined by plan form survey as well as aerial imagery. Reach 1 does not have a defined channel, so the MWR cannot be measured and it is considered to be N/A. The Service found that the MWR in Reach 2 was 19.7 which is considered to be Functioning by the Stream-Function Framework (Harmen et al., 2012).

Plum Creek Stream Restoration: Project Summary and Design Report
U. S. Fish and Wildlife Service June 2015 Chesapeake Bay Field Office Page | 24
Reach Level and Category Parameter Measurement
Method Pre-Restoration Condition
Value Rating
1 3 - Geomorphology Lateral Stability
Lateral Erosion Rate - Moderate
BEHI Curve Low Functioning
Meander Width Ratio (C and E Stream Types)
N/A N/A
2 3 - Geomorphology Lateral Stability
Lateral Erosion Rate - Moderate
BEHI Curve
Low to High NBS
Functioning At Risk
Meander Width Ratio (C and E Stream Types)
Meander belt width > 3.5' Functioning
Table 11: Lateral Stability
Figure 8: Eroding bank of former dam
g. Channel Evolution The Service utilized the Rosgen Stream Classification system in order to classify Plum Creek. The Rosgen Stream Classification system uses physical features of a stream such as width, depth, pattern, and bed material, to group streams into a “type” denoted by alphanumeric codes.
After understanding the current stream classification it is easier to then determine what stage of channel evolution the system is in and make predictions on what the

Plum Creek Stream Restoration: Project Summary and Design Report
U. S. Fish and Wildlife Service June 2015 Chesapeake Bay Field Office Page | 25
stream is trending toward. The reason for including channel evolution is to show the current channel condition and how it could change over time (Harmen et al. 2012). Reach 1 does not currently have a defined channel. Prior to the dam, the channel was mostly likely a C4 Rosgen Stream Type based on the valley type and the stream type found downstream. Using the Rosgen Stream Type Evolution Stages model, succession is as follows: C4 Dam G4 F4 C4. The Service determined that and is considered Not Functioning. Reach 2 shows indices of an unstable Rosgen C4 channel with poorly defined characteristics and widespread instability. However, the width-to-depth ratio and entrenchment ratio are within acceptable ranges for a Rosgen C channel and particle distributions are consistent with the Rosgen C4 channel type as well. It can be theorized that the channel started out as a stable E or C stream type but due to the instability caused by the impoundment of Plum Creek and subsequent dam failure practices), Plum Creek began to adjust both laterally and vertically. This adjustment has continued and will until equilibrium is met. Only when the sediment supply is reduced, will Plum Creek finally return to a stable C or E stream type. This scenario calls for years, if not decades of continuing instability. The succession is as follows: E/C D C. Plum Creek is currently at the “C” stage and is still adjusting to the increased sediment supply from the dam breach. Reach 2 is categorized as Functioning at Risk based on the Rosgen Stream Classification system.
Reach Level and Category Parameter Measurement
Method Pre-Restoration Condition
Value Rating
1 3 - Geomorphology Channel Evolution Rosgen
C4 Dam G4 F4
C4
Not Functioning
2 3 - Geomorphology Channel Evolution Rosgen E/C D C Functioning
At Risk
Table 12: Channel Evolution
4. Physicochemical
a. Water Quality While Hydrology, Hydraulics and Geomorphology are all very important functions, Biologic function is not possible if the Physicochemical function is compromised or impaired. Measurement of Physicochemical functions also requires an understanding of what influential variables are present that cannot be affected by restoration at the reach scale. These variables include external discharges from upstream, point source and non-point source contributions, and the effects of land-use changes in the watershed (Harmen et al., 2012). The most common Physicochemical parameter observed is water quality. While there are many measurement methods that can

Plum Creek Stream Restoration: Project Summary and Design Report
U. S. Fish and Wildlife Service June 2015 Chesapeake Bay Field Office Page | 26
define water quality, the most common and most important are temperature, pH, turbidity, conductivity and dissolved oxygen. There are a variety of other factors that can influence water quality such as soil composition and climate factors but typically these factors cannot be influenced by reach scale restoration.
i. Temperature Water temperature is a defining factor in determining suitability for aquatic species. Most species have a defined range of temperatures at which they can exist and reproduce. This parameter is easily measured by basic temperature logging sondes that can be deployed for months at a time. Stream temperatures are influenced by climate, stream flow and depth, sunlight exposure and the riparian canopy (Harmen et al., 2012). Sunlight can be the most influential factor for stream temperatures, particularly in open waters (Hynes, 1970). The Maryland Department of Natural Resources estimates that “stream sections with no forested riparian buffer could increase in temperature by more than 7°C at sites over 6 km downstream from buffered riparian areas (Barton et al., 1985). This baseline information is critical to obtain if there are specific project goals and objectives that will determine success based on suitable conditions for a specific plant or animal species. The lack of riparian vegetation and shallow ponding of the impoundment in Reach 1 can cause thermal impact on the system so, the temperature rating is considered Functioning at Risk. Reach 2 is also considered Functioning at Risk due to the potential thermal impacts of Reach 1 moving downstream.
ii. Dissolved Oxygen Dissolved oxygen (DO) is necessary for all aquatic organisms to survive in a body of water. Oxygen enters the water column primarily through diffusion from the atmosphere. Stream flow creates turbulence, which leads to additional entrainment of oxygen from the atmosphere (USEPA, 1997b). The amounts of DO are also influenced by temperature, altitude and salinity. The water column is considered “saturated” when the DO concentration is in equilibrium with oxygen in the atmosphere (Harmen et al., 2012). The shallow impoundment in Reach 1 likely limits the introduction of DO into Plum Creek due to the lack of riffles and flowing water. However, Reach 2 exhibits characteristics that are synonymous with good DO levels. Aeration is provided by the riffle complexes and course bed material. The Maryland Department of Natural Resources Biological Stream Survey group sampled a site in 2008 that was approximately 1000 feet downstream of the proposed restoration site. A dissolved oxygen reading during that sample was 6.6. ppm, which is not a limiting factor at that location.
Reach 1 is considered Functioning at Risk and Reach 2 is considered Functioning.

Plum Creek Stream Restoration: Project Summary and Design Report
U. S. Fish and Wildlife Service June 2015 Chesapeake Bay Field Office Page | 27
iii. Turbidity Turbidity is a measure of water clarity based on how much light passes through the water column (USEPA, 1997b). An accumulation of suspended and dissolved materials from erosive conditions causes the water to become cloudy which increases turbidity levels. When the water is turbid, temperatures increase due to higher absorption of heat by the suspended particles. Dissolved oxygen can be reduced as a result of increased temperatures and reduced photosynthetic activity when light penetration is impeded. Biological lifecycles and habitat are negatively affected by high turbidity (Harmen et al., 2012). Turbidity is measured in units of “JTU’s” or Jackson Turbidity Units. This measurement represents the attenuation of a light beam through a column of water. The main contributing factor to turbidity levels is discharge, bank erosion and soil composition. The Service was not able to gather baseline data of turbidity in the Plum Creek project area, but it can be assumed that improved bank stability will contribute less sediment to the system and reduce turbidity levels within the project area. There will be no pre or post restoration values given for this project and therefore will not be populated in Table 13 below.
iv. pH Measurements of pH indicate the relative acidity of alkalinity of water (Harmen et al., 2012). When the pH drops below 7.0, the water is considered acidic; when the pH is above 7.0, water is considered alkaline (USEPA, 1997b). Stream pH can have a significant effect on biological communities, which prefer pH values in the 6.5 to 8.0 range (Harmen et al., 2012). Like conductivity, pH is a good screening tool for stream restoration projects. At low pH values, ions from metals and toxic compounds can be released into the water column and negatively impact biological communities (Allan and Castillo, 2007). However, the Banded Sunfish can live in waters that are acidic and the acidic water reduces competition from other fish species. The Maryland Department of Natural Resources Biological Stream Survey group sampled a site in 2008 that was approximately 1000 feet downstream of the proposed restoration site. A pH reading during that sample was 5.3, which is a supporting factor for Banded Sunfish at that location. Therefore, pH is considered Functioning based only on this one time survey.

Plum Creek Stream Restoration: Project Summary and Design Report
U. S. Fish and Wildlife Service June 2015 Chesapeake Bay Field Office Page | 28
Reach Level and Category Parameter Measurement
Method Pre-Restoration Condition
Value Rating
1 4 - Physicochemical Water Quality
Temperature N/A Functioning At Risk
pH 5.3 Functioning
Dissolved Oxygen N/A Functioning
At Risk
2 4 - Physicochemical Water Quality
Temperature N/A Functioning At Risk
pH 5.3 Functioning
Dissolved Oxygen N/A Functioning
Table 13: Water Quality
5. Biology
Achieving biologic function is the result of the culmination of Hydrology, Hydraulic, Geomorphology and Physicochemical function as described previously. Collectively, these functions support the life histories of aquatic and riparian plants and animals. The Biology function-based parameters include microbial communities, macrophyte communities, benthic macroinvertebrate communities, fish communities and landscape connectivity (Harmen et al., 2012). Given that Plum Creek is likely intermittent in the area of the project, the stream channel likely has little or no flow during dry times of the year. It is probable that those conditions negatively affect the populations of benthic macroinvertebrate and fish communities. The Service decided to use the existing Maryland Department of Natural Resources (DNR) biologic data collected in 2008 to determine a biologic baseline for the Plum Creek project. DNR followed guidance from their Maryland Biological Stream Survey (MBSS) methodology to asses for both benthic macroinvertebrate communities as well as fish communities. The results were adapted to the SFPF to provide a function-based rating. The methods and ratings can be found in the following paragraphs.
a. Benthic Macroinvertebrate Communities Benthic macroinvertebrate sampling is conducted in the same 75 meter segment utilized for fish, habitat, and water quality sampling. The intent of benthic sampling is to qualitatively describe the community composition and relative abundance of favorable habitat (habitats supporting the greatest benthic diversity) within the sampling segment (Kayzak, 2001). The sampling collection procedures used allow for calculation of an index of biotic intergrity as described in Stribling et al. (1998). The 2008 DNR MBSS Macroinvertebrate IBI was 2.33 as shown in Table 14. The data was collected in a free flowing stream channel approximately 1000 feet downstream of the project area. Therefore, the data is not applicable to the impoundment in Reach

Plum Creek Stream Restoration: Project Summary and Design Report
U. S. Fish and Wildlife Service June 2015 Chesapeake Bay Field Office Page | 29
1. However, Reach 1 is considered Functioning at Risk because it is a large pool and potentially suitable habitat for macroinvertebrate. Reach 2 is Functioning at Risk.
b. Fish Communities The objective of fish sampling for MBSS is to assess the fishability and ecological health of fish communities in the non-tidal, flowing waters of Maryland. Quantative, double-pass electrofishing of 75 meter stream segments is used to describe abundance and community composition for ecological health assessment. Information on gamefish lengths is also collected (Kayzak, 2001). ). The 2008 DNR MBSS Fish IBI was 2.14 as shown in Table 14. The data was collected in a free flowing stream channel approximately 1000 feet downstream of the project area. Therefore, the data is not applicable to the impoundment in Reach 1, but Reach 1 is considered Functioning at Risk because it is a large pool and potentially suitable habitat for fish. Reach 2 is Functioning at Risk.
Reach Level and Category Parameter Measurement
Method Pre-Restoration Condition
Value Rating
1 5 - Biology
Macroinvertebrate Communities
MBSS IBI Score N/A Functioning
At Risk
Fish Communities MBSS IBI Score N/A Functioning
At Risk
2 5 - Biology
Macroinvertebrate Communities
MBSS IBI Score 2.33 Functioning
At Risk
Fish Communities MBSS IBI Score 2.14 Functioning
At Risk
Table 14: Aquatic Communities
6. Summary
The Service determined that the overall function-based condition of the Plum Creek project area is Functioning-at-Risk and is trending towards a future of instability before any sort of equilibrium can be reached (Table 15). The determination of this rating is based on an accumulation of ratings at two different levels. First, each pyramid level is rated based on the individual rating results of each measurement method used to evaluate the assessment parameters (Table 15, Column Pre-Restoration Condition - Level). Second, the overall reach rating is based on the individual ratings of each pyramid level (Table 15, Column Pre-Restoration Condition – Overall Reach). Below is a summary description, by pyramid level, that supports the overall reach rating. The Hydrology level, Level 1, is currently functioning mostly because current land uses within the watershed have not significantly influenced the amount and rate of flood flows reaching the project area, resulting in a non-flashy flow regime. This will specifically support such functions as floodplain connectivity, lateral erosion, and ground water recharge. While the flow regime has not been significantly altered by current watershed

Plum Creek Stream Restoration: Project Summary and Design Report
U. S. Fish and Wildlife Service June 2015 Chesapeake Bay Field Office Page | 30
land uses, the current land uses may adversely affect and marcoinvertebrate and fish communities. The potential impacts are associated with the dam failure and sediment supply form the banks. The Hydraulics level, Level 2, is currently functioning-at-risk mostly due to the bank height ratio, which shows that the stream, in Reach 2, is not well connected to the floodplain. When a stream becomes disconnected from the floodplain, stream energy increases because flow depths increase while channel widths do not (Leopold et. al, 1992). Increased stream energy increases stream shear stresses and promotes vertical and lateral stream degradation, which adversely affects riparian vegetation, bedform diversity, turbidity and macroinvertebrate and fish communities. The Geomorphology level, Level 3, is currently functioning-at-risk mostly due to limited bed form diversity, absence of riparian vegetation and moderate levels of stream bank erosion. As stated above in Level 2 – Hydraulics, geomorphic processes are functioning at risk because of increased stream energies associated with a disconnected flood plain. Limited geomorphic functions adversely affects macroinvertebrate and fish communities due to the loss of available quality habitat structure. The Physicochemical level, Level 4, is currently functioning-at-risk. This is a result of the increased sediment supply from the failed dam and thermal impacts from the impoundment. The Biology level, Level 5, is currently functioning-at-risk based on poor bed form diversity, lateral erosion, intermittent stream conditions, and lacking riparian vegetation. The rating is also takes into account the 2008 MBSS sampling downstream of the project area. These poorly functioning processes have created habitat conditions not suitable for Banned sunfish. The ability of the proposed project to evolve back to some level of quasi-equilibrium that will support Banded Sunfish is unlikely to occur anytime in the near future without intervention. The current geomorphic functions are still undergoing significant adjustments. However, this evolutionary process could take decades to complete and will adversely impact downstream resources.

Plum Creek Stream Restoration: Project Summary and Design Report
U. S. Fish and Wildlife Service June 2015 Chesapeake Bay Field Office Page | 31
Reach Level and Category Parameter Measurement
Method Pre-Restoration Condition
Value Rating Overall
1 1 - Hydrology
Channel Forming Discharge (Bankfull)
USFWS Piedmont
Regional Curve 78 cfs N/A
Functioning
Bankfull Validation 53 cfs N/A
2-Year Peak Flow USGS 61 cfs N/A
10-Year Peak Flow USGS 240cfs N/A
100-Year Peak Flow USGS 839 cfs N/A
1
2 - Hydraulics
Floodplain Connectivity
Bank Height Ratio N/A Functioning
Functioning at Risk
Entrenchment Ratio N/A Functioning
Flow Dynamics Stream Velocity N/A Not Functioning
1 3 - Geomorphology
Bedform Diversity
Pool-to-pool Spacing N/A Not
Functioning
Not Functioning
Pool Depth Variability 3.0 Functioning
Depositional Pattern B5 Not
Functioning
Riparian Vegetation
PFC N/A Not Functioning
Buffer Width from Meander
Belt Width
Meander belt width ≤
3.5
Not Functioning
Lateral Stability
Lateral Erosion Rate - Moderate
BEHI Curve Low Functioning
Meander Width Ratio (C and E Stream Types)
N/A N/A
Channel Evolution Rosgen C4 Dam G4 F4 C4
Not Functioning
1 4 - Physicochemical Water Quality
Temperature N/A Functioning at Risk Functioning
at Risk pH 5.3 Functioning Dissolved Oxygen N/A Functioning at
Risk
1 5 - Biology
Macroinvertebrate Communities MBSS IBI Score N/A Not
Functioning Not Functioning
Fish Communities MBSS IBI Score N/A Not Functioning
Table 15: Reach 1 Summary Table

Plum Creek Stream Restoration: Project Summary and Design Report
U. S. Fish and Wildlife Service June 2015 Chesapeake Bay Field Office Page | 32
Reach Level and Category Parameter Measurement Method
Pre-Restoration Condition
Value Rating Overall
2 1 - Hydrology
Channel Forming Discharge (Bankfull)
USFWS Piedmont Regional Curve 78 cfs N/A
Functioning Bankfull
Validation 53 cfs N/A
2-Year Peak Flow USGS 61 cfs N/A 10-Year Peak Flow USGS 240cfs N/A
100-Year Peak Flow USGS 839 cfs N/A
2 2 - Hydraulics Floodplain
Connectivity
Bank Height Ratio 1.1 Functioning
Functioning Entrenchment Ratio 7.8 Functioning
Flow Dynamics Stream Velocity 4.6 Functioning
2 3 - Geomorphology
Bedform Diversity
Pool-to-pool Spacing 2.0 – 4.0 Not
Functioning
Functioning at Risk
Pool Depth Variability 1.2 - 1.5 Functioning at
Risk Depositional
Pattern B1, B2, B5,
B6 Not
Functioning
Riparian Vegetation
PFC N/A Functioning at Risk
Buffer Width from Meander
Belt Width
Meander belt width >
3.5 Functioning
Lateral Stability
Lateral Erosion Rate - Moderate
BEHI Curve
Low to High NBS
Functioning at Risk
Meander Width Ratio (C and E Stream Types)
Meander belt width >
3.5' Functioning
Channel Evolution Rosgen E/C D C
Functioning at Risk
2 4 - Physicochemical Water Quality
Temperature N/A Functioning at Risk
Functioning at Risk
pH 5.3 Functioning
Dissolved Oxygen N/A Functioning
2 5 - Biology
Macroinvertebrate Communities MBSS IBI Score 2.33 Functioning at
Risk Functioning at Risk
Fish Communities MBSS IBI Score 2.14 Functioning at Risk
Table 16: Reach 2 Summary Table

Plum Creek Stream Restoration: Project Summary and Design Report
U. S. Fish and Wildlife Service June 2015 Chesapeake Bay Field Office Page | 33
VI. PRELIMINARY DESIGN
This section presents the restoration potential, design goals and objectives, design approach and alternative analysis, design criteria, and monitoring strategies involved in the Plum Creek Stream Restoration.
A. RESTORATION POTENTIAL
Restoration potential is the highest level of restoration or functional lift that can be achieved given the watershed health, reach-level function-based condition, stressors, and constraints. (Harman et al., 2012). Based on these factors, the Service determined that in Reach 1 and 2 pyramid levels 2 - Hydraulics and 3 - Geomorphology can be restored to fully functional and levels 4 – Physicochemical and 5 – Biology can have partial functional lift (Tables 15 and 16). Since Reach 1 is more degraded, the restoration will achieve more functional lift in Reach 1 than in Reach 2. Restoration of levels 2 and 3 functions are typically the most easiest to achieve since it involves direct, physical manipulation of stream channel dimension, pattern and profile. Stream channel parameters such as beltwidth, bank heights, wave lengths, facet feature lengths, slopes and depths can be constructed to specifications considered functioning.
However, typically lift for levels 4 and 5 functions cannot be constructed and rely on the functionality of lower level functions and watershed health. Furthermore, it takes time for levels 4 and 5 functions to respond to changes in lower level functions and watershed health. Research has shown that it can take up to 10 to 15 years to see biological lift (Orzetti, 2010). This holds true for the proposed project area. Uplift in macroinvertebrates and fish communities will occur as a result of improvements to level 3 functions, but may be limited because Plum Creek is intermittent and likely dries up in the summer months.
Lastly, there are a few reach-level constraints, which will more influence design objectives than restoration potential. They include the remenants of the earthen dam and the desire by Elk Neck State Forest to allow future installation of a bridge crossing for vehicular and pedestrian traffic as part of an existing trail system. The planform of the channel is directly affected by the need to properly align the channel approach and departure for the future bridge crossing. The bridge crossing also limits the floodprone width of the B4c section of the channel. Even with these constraints, a stable, self-maintain stream channel can be designed.

Plum Creek Stream Restoration: Project Summary and Design Report
U. S. Fish and Wildlife Service June 2015 Chesapeake Bay Field Office Page | 34
Level and Category Parameter
Pre-Restoration
Rating
Restoration Potential
1 - Hydrology Channel-Forming Discharge Functioning Functioning
2 - Hydraulics
Floodplain Connectivity Functioning Functioning
Flow Dynamics Not Functioning Functioning
3 - Geomorphology
Bed Form Diversity
Not Functioning Functioning
Riparian Vegetation
Not Functioning Functioning
Lateral Stability Not Functioning Functioning
Channel Evolution
Not Functioning Functioning
4 - Physicochemical Water Quality Functioning at
Risk Functioning
at Risk
5 - Biology
Macroinvertebrate Communities
Functioning at Risk
Functioning at Risk
Fish Communities Functioning at Risk
Functioning at Risk
Table 17: Reach 1 Function-Based Restoration Potential

Plum Creek Stream Restoration: Project Summary and Design Report
U. S. Fish and Wildlife Service June 2015 Chesapeake Bay Field Office Page | 35
Level and Category Parameter
Pre-Restoration
Rating
Restoration Potential
1 - Hydrology Channel-Forming Discharge Functioning Functioning
2 - Hydraulics
Floodplain Connectivity Functioning Functioning
Flow Dynamics Functioning Functioning
3 - Geomorphology
Bed Form Diversity
Not Functioning Functioning
Riparian Vegetation
Functioning at Risk Functioning
Lateral Stability Functioning at Risk Functioning
Channel Evolution
Functioning at Risk Functioning
4 - Physicochemical Water Quality Functioning at
Risk Functioning
at Risk
5 - Biology
Macroinvertebrate Communities
Functioning at Risk
Functioning at Risk
Fish Communities Functioning at Risk
Functioning at Risk
Table 18: Reach 2 Function-Based Restoration Potential
B. DESIGN OBJECTIVES
The Service generated design objectives based on Service, DNR, and MDE missions, project goals and the restoration potential of the proposed project area. Design objectives should be quantifiable and describe how the proposed project will be implemented (Harman, et al, 2012). These design objectives of the proposed project are focused on level’s 2 & 3 of the pyramid and support level 4 & 5 functions (Table 19). These design objectives will also be used as monitoring performance standards.

Plum Creek Stream Restoration: Project Summary and Design Report
U. S. Fish and Wildlife Service June 2015 Chesapeake Bay Field Office Page | 36
Level and Category Goals Objectives
Level 2 - Hydraulics
Floodplain Connectivity
1. Achieve a Bank Height Ratio = 1
2. Increase floodplain complexity by eliminating concentrated flows and providing areas to trap and store flood flows.
Level 3 - Geomorphology
Lateral Stability, In-stream Habitat (i.e., diversity and quality), Riparian
Buffer
3. Reduce stream bank erosion rates to match reference erosion rates (bank migration / lateral stability)
4. Bedform Diversity – Create 60:40 pool / riffle ratio
5. Match riparian buffer species diversity and composition of reference condition and make buffer width 35 ft wider beyond required meander width ratio.
Table 19: Plum Creek – Goals and Objectives. The underlined words under the objectives are parameters or measurement methods from the Stream Functions Framework (Harman, et al., 2011)
C. DESIGN ALTERNATIVE ANALYSIS
The purpose of design alternatives analysis is to select the best restoration design approach that meets the project goals, design objectives, and the restoration potential of the site. It focused on how a specific design approach could influence stream functions (i.e., highest functional lift), impacts to existing functions, costs, and risk.
1. Potential Design Alternatives
There is a variety of design approaches available to restore stream functions of highly degraded stream systems. Typical design approaches used in Maryland include 1) Natural Channel Design, 2) Valley Restoration Design, 3) Analytical Design, and 4) Regenerative Storm Conveyance Design. Each of these design approaches can result in functional uplift at the proposed project area. However, there is one critical function that only two of the approaches can address and that is sediment transport. The watershed and reach-level assessments identified that there is a sediment supply being delivered to the project area. The transport of sediment is a critical factor in developing a design. If a particular design approach cannot transport sediment, it could be bad or good. If the sediment deposition occurs at a rate that vegetation cannot establish and hold the sediment in place, it is a bad thing. This means that the stream channel and floodplain in a constant state of flux adversely affecting water quality and biology. If the sediment deposition occurs at a rate that vegetation can establish and hold the sediment in place, it is a good thing. However, over time the sediment deposition will eventually form a stream channel that can transport sediment.
Therefore, the Service focused on the design approaches that could transport sediment and those are Natural Channel Design and Analytical Design.

Plum Creek Stream Restoration: Project Summary and Design Report
U. S. Fish and Wildlife Service June 2015 Chesapeake Bay Field Office Page | 37
2. Potential Functional Uplift and Loss
a. Analytical Design Approach The Analytical Design approach is a subset of the broader Alluvial Channel Design Methodology described in Chapter 9 of the United States Department of Agriculture, Natural Resources Conservation Service, National Engineering Handbook (NEH) 654 (NRCS 2007). The theory supporting the Analytical Approach is that channel dimensions can be calculated from physically based equations including continuity, hydraulic resistance, and sediment transport. These equations require that a design discharge and inflowing sediment concentration be estimated. The design discharge may include the bankfull discharge, effective discharge, or other user-defined discharge. Bank material characteristics and estimates of the bed material composition are also required. The primary result is a channel stability curve that predicts riffle depth and average channel slope for a range of channel widths. It does not explicitly prescribe methods for laying out the channel planform and profile. Typically, empirical approaches are sometimes used based on local reference reaches or relationships in Copeland and McComas (2001). A better approach is to use design criteria from reference reaches with similar valley slopes, bed material, and stream type as the project reach (Hey, 2006).
This approach, if implemented, will result in functional uplift in both reaches to floodplain connectivity, riparian vegetation and water temperature (Table 20 and 21). However, since it does not explicitly prescribe methods for laying out the channel planform and profile, undesired stream channel adjustments could occur over time that would adversely affect geomorphic stability, water quality and biology. Specially, bedform and lateral adjustments can occur. Bedform features such as facet lengths, slopes and depths and planform features such as sinuosity significantly influence dissipation of stream energy. If these stream parameters are not designed correctly, then they will adjust causing functional impacts. As facet features adjust, habitat for aquatic species can be scoured out in some locations and smothered with excessive sediment in other areas. Water quality can become turbid from excessive sediment associated with the scouring and riparian vegetation can be lost because of lateral stream channel migration. Since these potential impacts could occur, it makes this approach a moderate to high risk project. Therefore, the Service eliminated the Analytical Design Approach as a feasible design approach.

Plum Creek Stream Restoration: Project Summary and Design Report
U. S. Fish and Wildlife Service June 2015 Chesapeake Bay Field Office Page | 38
Table 20: Reach 1 Design Alternatives Analysis
b. Natural Channel Design Approach The Natural Channel Design Approach is based on measured morphological relations associated with bankfull flow, geomorphic valley type, and geomorphic stream type (NRCS 2007). This design approach involves a combination of hydraulic geometry, analytical calculation, regionalized validated relationships, and a series of precise reference reach measurements. This design process involves designing channel dimension, pattern and profile based on reference reach data first and then using analytical calculations, same as the analytical design approach, to validate vertical and lateral stability and sediment transport.

Plum Creek Stream Restoration: Project Summary and Design Report
U. S. Fish and Wildlife Service June 2015 Chesapeake Bay Field Office Page | 39
Table 21: Reach 2 Design Alternatives Analysis
This approach, if implemented, will result in function uplift in both reaches through Level 5 – Biology (Table 20 and 21). Assessment parameters in Level 2 - Hydraulics and Level 3 – Geomorphology will be fully functional while assessment parameters in Level 4 – Physicochemical and Level – 5 will remain functioning at risk but have functional uplift. As was stated in the restoration potential section, restoration of levels 2 and 3 functions are typically the easiest to achieve since it involves direct, physical manipulation of stream channel dimension, pattern and profile. Functional uplift for levels 4 and 5 functions cannot be constructed and rely on the functionality of lower level functions and watershed health. The expected level 4 uplift will be associated with water temperature reductions. Currently the proposed project area lacks adequate riparian vegetation to provide shading. One of the design objectives is to restore the riparian vegetation and research has shown that providing shade to stream could reduce water temperatures by 1.9o Celsius (Fink 2008). The expected level 5 uplift will be associated with improvements to macroinvertebrate and fish communities through the increase of available instream habitat. The increase of

Plum Creek Stream Restoration: Project Summary and Design Report
U. S. Fish and Wildlife Service June 2015 Chesapeake Bay Field Office Page | 40
available instream habitat is a result of improved bedform diversity functions associated with level 2 proposed restoration objectives.
Implementation of the Natural Channel Design approach typically involves channel realignment and extensive grading. This type of activity could adversely affect existing riparian vegetation. However, since the existing riparian vegetation in Reach 1 was rated as Not Functioning, any potential realignment or grading in that reach will not adversely affect the existing riparian vegetation. However in Reach 2, some temporary affects may occur during construction. These affects are typical of stream restoration projects regardless of which design approach is implemented and generally include displacement of aquatic species and increases in turbidity.
The Natural Channel Design approach meets project goals and design objectives; addresses sediment transport needs; provides the greatest functional uplift and produces the least impacts to existing functions; and is based on reference conditions, thus considered low risk. Therefore, the Service selected Natural Channel Design as the design approach for the proposed project area.
3. Existing Wetlands
The site contains wetlands in the area of a former dam impoundment. However, the existing wetlands were created when the earthen dam was installed across the valley floor changing the stream hydrology and covering the valley floor with a large impoundment. The area upstream of the impoundment aggraded because of the reduced slope of the stream channel creating emergent and scrub/shrub wetlands from an area that was likely forested prior to installation of the dam. The dam created an open water area with depths greater than 5 feet. Once the dam breached, the impoundment water level dropped and caused another base level adjustment to Plum Creek. Rip-rap from the repair attempts is in the channel and has some effect on the ponding of water in the former impoundment. Since the breach, beavers have built dams at the breach numerous times. So, the water level in the former impoundment has fluctuated considerably depending on rainfall, stream flow, beaver dams. The former impoundment still lacks a stream channel through the majority of the area and Plum Creek continues to adjust both laterally and vertically. If the project area is not stabilized, Plum Creek will continue to adjust. Those adjustments will likely include down cutting, which causes the elevation of Plum Creek’s water surface to decrease. Over time, the hydrology for the existing wetlands will be lost as the former impoundment dries out. The restoration will create a new stream channel through the former impoundment, which will provide both lateral and vertical stability. The bankfull channel is designed so that existing wetlands on both sides of the channel will be untouched and receive flood flows at a recurrence interval of about 1.0-1.5 years. In addition, the

Plum Creek Stream Restoration: Project Summary and Design Report
U. S. Fish and Wildlife Service June 2015 Chesapeake Bay Field Office Page | 41
narrow floodplain (bankfull bench) adjacent to the channel will maintain storage in the existing wetlands from ground water, flood flows, and precipitation. The fill placed for the restoration will be limited in elevation and will function as a riparian wetland system once the vegetation becomes established.
D. DESIGN DEVELOPMENT
The Service developed design criteria based on an existing stable riffle cross section located downstream of the project area. The measurements from this cross section were verified and extrapolated using the regional curve calculations, resistance equations and natural channel design reference ratios for B4c and C4 Rosgen stream type channels. Two different Rosgen stream types were required for the project area based on channel slope and available floodplain widths (i.e., entrenchment ratio). Once the design criteria range was determined, the best possible plan form was laid out to ensure the channel has adequate slope, sinuosity and flood plain width. This new plan form required moderate structure to stabilize outside meander bends until permanent vegetation is established as well as create suitable aquatic habitat. The design plan form, profile and dimension was then analyzed and modeled to make ensure that the channel and its floodplain would neither aggrade or degrade.
In addition to geomorphic design considerations, the Service aims to increase bed form diversity as well as increasing streamside vegetation with hopes of increasing canopy cover in order to decrease water temperatures.
1. Design Criteria Design criteria was compiled by standardizing existing channel plan, profile, and dimension of reference stream reaches. In addition, the Service was also located a reference reach with a stable riffle downstream of the project reach to model the design geometry after. The tables below show reference geometry as well as summarize reference ratios and design criteria:
Bankfull Characteristics
Reference Cross Section
Design Cross Section
Area (sq. ft) 12.22 12.75 Width (ft) 12.75 13.00 Depth (ft) 0.96 0.98
Velocity (ft/s) 4.33 4.15 Discharge (cfs) 52.90 53.00
Table 22: Bankfull Riffle Characteristics

Plum Creek Stream Restoration: Project Summary and Design Report
U. S. Fish and Wildlife Service June 2015 Chesapeake Bay Field Office Page | 42
Stream Name Plum Creek Drainage Area 0.90 mi² Stream Type B4c C4 # Variable Symbol Units
1 Riffle Bankfull width Wbkf feet Mean 13 13
Range
2 Riffle Bankfull mean depth dbkf feet Mean 0.98 0.98
Range
3 Width depth ratio W/d Mean 13.25 13.25
Range 12.0 - 14.0 12.0 - 14.0
4 Riffle Bankfull cross sectional area Abkf ft2
Mean 12.75 12.75
Range
5 Bankfull mean velocity Vbkf ft/sec Mean 4.15 4.15
Range 4.0 - 6.0 3.5 - 5.0
6 Bankfull discharge Qbkf cfs Mean 53 53
Range
7 Riffle Bankfull maximum depth dmax feet
Mean 1.50 1.50
Range 1.40 – 1.75 1.40 – 1.60
8 Max Riffle depth/ Mean riffle depth driff/dbkf
Mean 1.35 1.30
Range 1.2 - 1.4 1.2 - 1.5
9 Low bank height to max dbkf ratio
Mean 1.05 1.05
Range 1.0 - 1.1 1.0 - 1.1
10 Width of flood prone area Wfpa feet Mean 33 50
Range 28 - 50 33 +
11 Entrenchment Ratio Wfpa/Wbkf Mean 1.7 4
Range 2.1 – 3.8 2.5 +
12 Meander Length Lm feet Mean 120
Range 102 - 144
13 Ratio of meander length to bankfull width Lm/Wbkf
Mean 11.5
Range 9.0 - 14.0
14 Radius of curvature Rc feet Mean 32.50
Range 26 - 39
15 Ratio: Radius of curvature to bankfull width Rc/Wbkf
Mean 2.5
Range 2.0 - 3.0 Table 23: Plum Creek Design Criteria

Plum Creek Stream Restoration: Project Summary and Design Report
U. S. Fish and Wildlife Service June 2015 Chesapeake Bay Field Office Page | 43
Table 23. Continued
16 Belt Width Wblt feet Mean 95
Range 85 - 105
17 Meander width ratio Wblt/Wbkf
Mean 5.00 Range 6.0 - 8.0
18 Sinuosity K Mean 1.02 1.3
Range 1.2 - 1.4 19 Valley Slope Sval ft/ft 0.011 0.011
21 Average Water Surface Slope Savg ft/ft
Mean 0.0086 0.0086
Range .0086 - .0108
21 Pool Water Surface Slope Spool ft/ft
Mean .0017 0.0016
Range 0.00 – 0.0034 0.00 - 0.002
22 Pool WS slope / Average WS slope Spool/Savg
Mean 0.2 0.15
Range 0.00 -0.40 0.00 - 0.20
23 Riffle Water Surface slope Sriff ft/ft
Mean 0.012 0.015
Range 0.0095 - 0.0152 0.010 - 0.016
24 Riffle WS slope / Average WS slope SrifF/Savg
Mean 1.45 1.45
Range 1.1 - 1.8 1.2 - 1.5
25 Run WS Slope Srun/Savg ft/ft Mean 0.007
Range 0.0043 - 0.0086
26 Run WS slope / Average WS slope Srun/Savg ft/ft
Mean 0.65
Range 0.5 -0.8
27 Glide WS Slope Sglide Mean 0.0043 0.0043
Range 0.0032 - 0.0054 0.0032 - 0.0054
28 Glide WS slope / Average WS slope Sglide/Savg ft/ft
Mean 0.4 0.4
Range 0.3 - 0.5 0.3 - 0.5
29 Maximum pool depth dpool feet
Mean 2.7 1.9
Range 1.96 -3.43 1.47 – 3.43
30 Ratio of max pool depth to average bankfull depth
dpool/dbkf Mean 2.75 2.0
Range 2.0 - 3.5 1.5 - 3.5
31 Max Run Depth drun feet Mean 1.91
Range 1.67 – 2.16
32 Ratio of max run depth to average bankfull depth
drun/dbkf Mean 1.95
Range 1.7 - 2.2
33 Max Glide Depth dglide feet Mean 1.56
Range 1.37 – 1.76 Table 23: Plum Creek Design Criteria

Plum Creek Stream Restoration: Project Summary and Design Report
U. S. Fish and Wildlife Service June 2015 Chesapeake Bay Field Office Page | 44
Table 23. Continued
34 Ratio of max glide depth to average bankfull depth dglide/dbkf feet
Mean 1.6
Range 1.4 - 1.8
35 Pool width Wpool feet Mean 13.0 14
Range 13 -15 13 - 15
36 Ratio of pool width to bankfull width Wpool/Wbkf
Mean 1.0 1.1
Range 1.0 - 1.15 1.0 - 1.15
37 Ratio of pool area to bankfull area Apool/Abkf
Mean 2.1 1.45
Range
38 Point bar slope Spb Mean 30
Range 20 - 40
39 Pool to pool spacing p-p feet Mean 48.75 65
Range 19.5 - 78 45.5 – 91.0
40 Ratio of pool to pool spacing to bankfull width p-p/Wbkf
Mean 3.75 5.0
Range 1.5 - 6.0 3.5 - 7.0
Table 23: Plum Creek Design Criteria
2. Proposed Design
The proposed design calls for two different Rosgen stream types to be built within the project area. The Service proposes creating a new C4 channel in Reach 1, and a combination of B4c and C4 in Reach 2. In Reach 1, the Service will construct a new C4 channel on top of the former impoundment bottom. Emergent wetlands will be created adjacent to the stream channel on both the right and left sides. Existing emergent wetlands along the edge of the former impoundment will be retained and combined with the created wetlands to create a riparian corridor of functioning floodplain wetlands. Reach 2 includes a B4c stream type in the area of the former dam to maintain proper stream alignment for a future bridge crossing. A B4c stream type dissipates channel energy through its bedform roughness. This section will be constructed to dissipate energy vertically through the use of structures and a lower pool to pool spacing. When the hydraulic influence from the bridge crossing is no longer a consideration, the Service has proposed a more sinuous C4 stream type with a low width to depth ratio to dissipate energy laterally across the floodplain. Based on hydrologic conditions, out of bank events can occur every 1.5 years or more frequently. This floodplain creation in Reach 1, floodplain excavation in the Reach 2 B4c section, and floodplain reconnection in the C4 section of Reach 2, will enable the Service to achieve the Level 2 - Hydraulic goal of returning the bank height ratio to a factor of 1. To achieve the Level 3 lateral stability goals, the Service plans to re-align the stream channel in Reach 1 to create meanders and belt widths that would promote increased lateral stability. To promote bed form diversity in both Reach 1 and 2, in-stream structures will be installed to promote pool scour and glide and riffle formation while protecting adjacent banks. While proper plan form is important, the Service has

Plum Creek Stream Restoration: Project Summary and Design Report
U. S. Fish and Wildlife Service June 2015 Chesapeake Bay Field Office Page | 45
recognized that stability cannot be achieved without the proper riparian conditions. The Service has proposed dense riparian plantings that will extend beyond the limits of the design belt width to increase the stability of the system. These things combined will meet the Level 3 goals and objectives. These restoration activities on Plum Creek will also aid in achieving the Services’ Level 4 goal reducing water temperatures. Lastly, emergent wetland areas adjacent to the channel will enhance the floodplain complexity for additional aquatic species. Combined with enhancements to Levels 2 – 4, the service aims to achieve biologic lift through level 5. Detailed existing conditions and proposed plans can be found in Appendix C and Appendix I.
3. In-Stream Structures
Rock and log structures are in stream structures, made of natural materials, used to divert erosive stream flows away from stream banks and maintain streambed elevations. The most typical rock and log structures used from stream restoration are cross-vanes, j-hooks, log roller, and toe wood. The rock and log structures provide streambed bank stability and allow the streambed to naturally armor and the riparian vegetation to establish. The project area will utilize log rollers, toe wood and wood j-hook structures to promote stability and increased aquatic habitat. The locations of these structures were determined by matching the naturally occurring pool-to-pool spacing and strategically placing them in areas that would exhibit higher shear stress values during high flow events. A stone cross-vane will be used upstream of the former dam to maintain grade and provide bank protection.
a. Cross-Vane The Cross-Vane (Figure 9) will establish grade control, reduce bank erosion, create a stable width/depth ratio, maintain channel capacity, while maintaining sediment transport capacity, and sediment competence. The Cross-Vane also provides for the proper natural conditions of secondary circulation patterns commensurate with channel pattern, but with high velocity gradients and boundary stress shifted from the near-bank region. The Cross-Vane is also a stream habitat improvement structure due to: 1) an increase in bank cover as a result to a differential raise of the ater surface in the bank region; 2) the creation of holding and refuge cover during both high and low flow periods in the deep pool; 3) the development of feeding lanes in the flow separation zones (the interface between fast and slow water) due to the strong down welling and upwelling forces in the center of the channel; and 4) the creation of spawning habitat in the tail-out or glide portion of the pool (Rosgen, D.L.). While the figure below shows a structure consisting of large boulders, the Cross-Vane can be constructed using other materials such as logs and rootwads.

Plum Creek Stream Restoration: Project Summary and Design Report
U. S. Fish and Wildlife Service June 2015 Chesapeake Bay Field Office Page | 46
Figure 9: Cross-Vane in Plan View
b. J-Hook The J-Hook Vane is an upstream directed, gently sloping structure composed of natural materials. The structure can include a combination of boulders, logs and root wads (Figure 10) and is located on the outside of stream bends where strong down welling and upwelling currents, high boundary stress, and high velocity gradients generate high stress in the near-bank region. The structure is designed to reduce bank erosion by reducing near-bank slope, velocity, velocity gradient, stream power and shear stress. Redirection of the secondary cells from the near-bank region does not cause erosion due to back-eddy re-circulation. The vane portion of the structure occupies 1/3 of the bankfull width of the channel, while the “hook” occupies the center 1/3 as show in Figure 10 (Rosgen D.L.). Maximum velocity, shear stress, stream power and velocity gradients are decreased in the near-bank region and increased in the center of the channel. Sediment transport competence and capacity can be maintained as a result of the increased shear stress and stream power in the center of the channel. Backwater is created only in the near-bank region, reducing active bank erosion (Rosgen D. L.). While the figure below shows a structure consisting of large boulders, the J-Hook Vane can be constructed using other materials such as logs and root wads.

Plum Creek Stream Restoration: Project Summary and Design Report
U. S. Fish and Wildlife Service June 2015 Chesapeake Bay Field Office Page | 47
Figure10:. J-Hook Vane in Plan View
c. Log Roller The Log Roller structure is an alternative to hardened riffles. These structures act as a grade control, but instead of holding the grade of a glide feature, they instead hold the grade of the top of riffle feature. The Log Roller consists of alternatively angled and sloped logs that are placed at low grades in an effort to “roll” water back and forth while still concentrating energy towards the center of the channel. The structure is typically used in straight segments of the channel. They are effective in generating aeration and increased dissolved oxygen concentration by creating hydraulic rises and falls while still directing stream energy towards the center of the channel. These structures also add woody debris into the stream system promoting increased habitat for aquatic species. Figure 11, shown below, shows a typical drawing for a Log Roller.

Plum Creek Stream Restoration: Project Summary and Design Report
U. S. Fish and Wildlife Service June 2015 Chesapeake Bay Field Office Page | 48
Figure 11: Log Roller Structure
d. Soil Lift The Soil Lift structure (Figure 12) incorporates soil stabilization matting and soil to form a stream bank in areas of the channel that are constructed with fill material. The fill material is encapselated by the soil stabilization matting and provides short term bank stabilization . Live stakes, shrubs, and trees are installed in the soil lifts to provide long term stability.

Plum Creek Stream Restoration: Project Summary and Design Report
U. S. Fish and Wildlife Service June 2015 Chesapeake Bay Field Office Page | 49
Figure 12: Soil Lift Structure
e. Toe Wood The Toe Wood structure (Figure 13) incorporates native woody material into a submerged undercut bank to replicate natural streambanks. Toe wood is positioned on the lower 1/3 to 1/2 of bank height to ensure it is submerged year round to prevent wood deterioration. Cuttings with sod and live staking or woody transplants cover the toe wood and are installed up to the bankfull stage. Not only does toe wood act as an area of increased roughness which promotes reduction in shear stresses to the outside of the meander, it also serves as a haven for benthic macro invertebrates and fish communities.

Plum Creek Stream Restoration: Project Summary and Design Report
U. S. Fish and Wildlife Service June 2015 Chesapeake Bay Field Office Page | 50
Figure 13: Toe Wood Structure
f. Emergent Wetlands The channel and bench bankfull are designed to improve hydrology of the existing wetlands by maintaining a shallow water environment by retaining groundwater and flood flows. The Service wanted keep the emergent wetlands features in the Plum Creek design for a variety of reasons. Wetlands provide critical habitat for frogs, salamanders, reptiles, and other species. Beavers are also naturally drawn to these areas and serve as a preferred location for dens and dams. This prevents beavers from impacting or influencing channel flow and minimizes the threat of beaver related damming and ponding of the restored stream reach.
4. Hydrology and Hydrualics Analysis
The Service used tractive force calculations to conduct a hydraulic assessment of this particular reach to assure the restoration design would not cause any unsafe rise in hydraulic forces within the channel. The calculations were run using a bankfull flow of 53 cfs which was derived from the Resistance Relationship using existing and design channel geometry. The design maximized the use of the available floodplain within the project area. Therefore, the design objective is to have similar or lower velocities, shear stress, and stream power in relation to stage and discharge, compared to the existing unstable conditions. The tractive force calculation compared only the existing riffle cross section data to the design riffles cross section data.

Plum Creek Stream Restoration: Project Summary and Design Report
U. S. Fish and Wildlife Service June 2015 Chesapeake Bay Field Office Page | 51
Feature Average Depth (ft)
BF Slope (ft/ft)
Tractive Force (lbs/ft2)
Existing Reference Reach Riffle 0.96 0.0105 0.63
Proposed Reach 1 C4 Riffle 0.98 0.0108 0.66
Proposed Reach 2 B4c Riffle 0.98 0.0086 0.53
Proposed Reach 2 C4 Riffle 0.98 0.0086 0.53
Table 24: Tractive Force Calculations
a. Resistance Relationships There are several methods to estimate bankfull discharge and velocity using resistance relationships. These methods typically make use of the cross sectional area, flow depth, representative particle size of channel substrate, channel slope and a determined roughness coefficient, or “friction factor”. The Service used the Friction Factor/Relative Roughness equation to determine discharge. This equation, 𝒖 = �2.83 + 5.66 ∗
𝐿𝐿𝐿 � 𝑅𝐷84
�� 𝑢 ∗, uses the hydraulic radius of the representative cross section, the channel slope, relative roughness of the channel bed, and shear velocity to determine velocity and discharge values. This method closely matched the back calculated roughness coefficient and was in agreement with the regional relationship findings and proved to be an appropriate estimate for bankfull discharge. A summary can be found in Table 25 and detailed information can be found on the “Computation of Velocity and Bankfull Discharge” worksheets in Appendix Q.
Bankfull Characteristics
Existing Reference
Reach Cross Section
Reach 1 C4 Design Cross
Section
Reach 2 B4c Design Cross
Section
Reach 2 C4 Design Cross
Section
USFWS Piedmont
Curve
Area (sq. ft) 12.22 13.25 13.05 13.25 16.13 Width (ft) 12.75 13 13 13 14.18 Depth (ft) 0.96 1.02 1.00 1.02 1.14
Velocity (ft/s) 4.33 4.49 4.01 4.01 4.83 Discharge (cfs) 52.90 59.51 52.28 53.10 78.05 Maryland Stream Survey: Bankfull Discharge and Channel Characteristics of Stream in the Piedmont Hydrological Region (USFWS)
Table 25: Design and Regional Curve Bankfull Characteristics

Plum Creek Stream Restoration: Project Summary and Design Report
U. S. Fish and Wildlife Service June 2015 Chesapeake Bay Field Office Page | 52
5. Sediment Analysis The objective of sediment transportation for the project is to design Plum Creek with the competency to entrain the largest measured particle size of the reference reach pavement/subpavement sample (68 mm) determined by the sieve analysis conducted by the Service. Existing conditions in Reach 1 do not have the required depth to initiate movement of this particle size since there is not a defined channel. Field observations of gravel deposition at the upstream end of the impoundment support these findings. Existing conditions in Reach 2 exhibit deposition patterns that include some mid-channel bar formation as well as lateral bars. While these deposition formations are isolated, they do indicate a reduction in sediment competency related to a shallowing condition that is a result of channel widening. The Service aims to reduce channel width, while maintaining cross sectional area to increase mean depth to increase the channel’s sediment transport competency. The increased depth meets the required depth as shown by Rosgen’s power trend line on Shields critical shear stress relationship. The predicted particle size that can be moved is 70 mm which is just slightly larger than the largest particle size (68 mm) collected in the pavement/subpavement sample, but smaller than the riffle d100. This ensures the channel will not degrade over time. The main stability problems within Plum Creek are mostly related to lateral instability problem (e.g., bank erosion). A sediment capacity analysis was not conducted since Plum Creek does not appear to have a significant aggradation or degradation stability problem. Table 26 summarizes the Service’s findings and detailed information can be found in Appendix R.
Level and Category Parameter Measurement
Method
Restoration Condition Reference
Reach Reach 1
C4 Reach 2
B4c Reach 2
C4
3 - Geomorphology
Sediment Transport
Competency
Depth 1.27 1.02 1.00 1.02
Slope .0125 .0108 .0086 .0086
Table 26: Sediment Transport Competency
6. Vegetation Design
The riparian buffer is an integral part of the stream ecosystem, providing bank stability and nutrient uptake, serving as a food source for aquatic organisms, and providing terrestrial habitat and migration corridors for various types of wildlife, including migratory neotropical songbirds. Shading from the buffer moderates stream temperature and prevents excessive algal growth. Large woody debris derived from the buffer is an important component of aquatic habitat. The Service developed stream restoration planting plan that utilizes native plant and shrub species in both the riparian and upland corridors. The species selected are consistent with native species found in the Coastal Plain physiographic province of Maryland.

Plum Creek Stream Restoration: Project Summary and Design Report
U. S. Fish and Wildlife Service June 2015 Chesapeake Bay Field Office Page | 53
VII. MAINTENANCE AND MONITORING PLANS
A. MAINTENANCE PLAN
The Service will collaborate with DNR to develop a maintenance plan that will ensure the success of the restoration objectives and goals. Plan duration and responsible parties will also be determined at that time.
B. MONITORING PLAN
The Service will produce an As-Built survey directly following completion of the restoration. This survey will be used to confirm that the project was built to design standards and will serve as baseline data for future monitoring. The Service will compare this data to the design criteria and produce a brief report summarizing any implementation adjustments or discrepancies. A well-developed post-restoration monitoring plan will allow the partners to determine the success of the project, and address any problems that may arise. The Service has developed a monitoring plan based on the restoration goals and objectives, to evaluate the performance of the stream restoration project. This will take place after the successful completion of the Plum Creek Restoration. A Rapid Monitoring Protocol (RMP), developed by the Service - CBFO, will be used to monitor the physical characteristics of the restoration projects. RMP is a tiered approach for rapid restoration assessment that visually evaluates the stability and qualitative functional success of the restoration project. If there are indications of potential failure, the methodology requires that the project evaluators conduct a more intensive monitoring survey, which is the second tier survey. However, if a severe problem is identified (e.g. complete structure failure, excessive bank erosion, vertical incision > 1.3) the second tier may be skipped to go directly to the third tier – remediation/repair. During the second tier survey, project evaluators take measurements of the existing stream conditions and compare them to the proposed design criteria and reference data, to determine if remediation is required. If remediation/repair is required, the evaluators will perform a third tier survey that includes restoration design and implementation. The success of the riparian buffer plantings will also be monitored by visually quantifying bare areas, invasive species distribution, native recruitment and survivability of planted species. The Service will monitor the stream for three years and provide a brief monitoring summary report for each year of monitoring.

Plum Creek Stream Restoration: Project Summary and Design Report
U. S. Fish and Wildlife Service June 2015 Chesapeake Bay Field Office Page | 54
PAGE INTENTIONALLY LEFT BLANK

Plum Creek Stream Restoration: Project Summary and Design Report
U. S. Fish and Wildlife Service June 2015 Chesapeake Bay Field Office Page | 55
LITERATURE CITED
1. Allan, J.D. and M.M. Castillo, 2007. Stream Ecology: Structure and Function of Running Waters, Second Edition. Springer, Dordrecht, The Netherlands.
2. Barton D.R., W.D. Trylor and R.M. Bierre, 1985. Dimensions of Riparian Buffer Strips Required to Maintain Trout Habitat in Southern Ontario Streams. North American Journal of Fishery Management 5:364-378.
3. Claussen, J.C., K. Guillard, C.M. Sigmund and K.M. Dors, 2000. Water Quality Changes From Riparian Buffer Restoration in Connecticut. Journal of Environmental Quality 29:1751-1761.
4. Cooper, J.R., J.W. Gilliam, R.B. Daniels and W.P. Robarge, 1987. Riparian Areas as Filters in Agricultural Sediment. Soil Science Society of America Journal 51:416-420.
5. Daniels, R.B. and J.W. Gilliam, 1996. Sediment and Chemical Load Reduction by Grass and Riparian Filters. Soil Science Society of America Journal 60(1):246-251.
6. Davis, S., R.Starr and C.Eng. Rapid Stream Restoration Monitoring Protocols. U.S. Fish and Wildlife Service. Annapolis, MD. CBFO-S14-01
7. Fink, D. B. 2008. Artificial Shading and Stream Temperature Modeling for Watershed Restoration and Brook Trout (Salvenius fontinalis) Management. Masters Thesis. James Madison Unv. Harrisonburg, VA. 10pp.
8. Fisher, S.G., N.B. Grimm, E. Martı´, R.M. Holmes and J.B. Jones, Jr., 1998. Material Spiraling in Stream Corridors: A Telescoping Ecosystem Model. Ecosystems 1:19-34.
9. Harman, W., R. Starr, M. Carter, K. Tweedy, M. Clemmons, K. Suggs, C. Miller. 2011. A SFPF for Developing Stream Assessments, Restoration Goals, Performance Standards and Standard Operating Procedures. U.S. Environmental Protection Agency, Office of Wetlands, Oceans, and Watersheds. Washington, D.C.
10. Harman, W., R. Starr, M. Carter, K. Tweedy, M. Clemmons, K. Suggs, C. Miller. 2012. A Function-Based Framework for Stream Assessment and Restoration Projects. U.S. Environmental Protection Agency, Office of Wetlands, Oceans, and Watersheds, Washington, D.C. EPA 843-K-12-006.
11. Harrelson, C.C., C.L. Rawlins and J.P. Potyondy, 1994. Stream Channel Reference Sites: An Illustrated Guide to Field Technique. General Technical Report RM-245. US Department of Agriculture, Forest Service, Rocky Mountain Forest and Range Experiment Station, Fort Collins, Colorado.
12. Johnson, R.K., T. Wiederholm, and D.M. Rosenberg. 1993. Freshwater biomonitoring using individual ogranisms, populations, and species assemblages of benthic macroinvertebrates. Pages 40-150 in D.M. Rosenberg and V.H. Resh (editors). Freshwater biomonitoring and benthic macroinvertebrates. Chapman and Hall, New York.
13. Hynes, H.B.N., 1970. The Ecology of Running Water. University of Toronto Press, Toronto, Canada.

Plum Creek Stream Restoration: Project Summary and Design Report
U. S. Fish and Wildlife Service June 2015 Chesapeake Bay Field Office Page | 56
14. Kayzak, P. F. Maryland Department of Natural Resources, Monitoring and Non-Tidal Assessment Division. (2001). Maryland stream survey sampling manual. Retrieved from website: http://www.dnr.state.md.us/streams/pdfs/R4Manual.pdf
15. Lee, K.H., T.M. Isenhart, and R.C. Schultz, 2003. Sediment and Nutrient Removal in an Established Multi-Species Riparian Buffer. Soil and Water Conservation Journal 58(1):1-8.
16. Leopold, L.B. and M.G. Wolman, 1957. River Channel Patterns: Braided, Meandering and Straight. U.S. Geological Survey Professional Paper 282B:39-103.
17. Leopold, L.B., M.G. Wolman, J.P. Miller. 1992. Fluvial Processes in Geomorphology. Dover Publications, Inc. New York.
18. Lowrance, R. and J.M. Sheridan, 2005. Surface Runoff Quality in a Managed Three Zone Riparian Buffer. Journal of Environmental Quality 34(5):1851-1859.
19. Magette, W.L., R.B. Brinsfield, R.E. Palmer, and J.D. Wood, 1989. Nutrient and Sediment Removal by Vegetated Filter Strips. Transactions, American Society of Agricultural Engineers 32:663–667.
20. Maxted, J.R. , Barbour, M.T., Gerritsen, J., Poretti, V., Primrose, N., Silvia, A., Penrose, D., and Renfrow, R. Assessment framework for mid-Atlantic coastal plain streams using macroinvertebrates. Journal North American Benthol Society 2000, 19(1):128-144.
21. McCandless, T.L. & R.A. Everett. 2002. Maryland stream survey: Bankfull discharge and channel characteristics in the Piedmont hydrologic region. U.S. Fish and Wildlife Service, Annapolis, MD. CBFO-S02-02.
22. Orzetti, L.L., R.C. Jones, and R.F. Murphy, 2010. Stream Condition in Piedmont Streams with Restored Riparian Buffers in the Chesapeake Bay Watershed. Journal of the American Water Resources Association 46(3):474-485.
23. Prichard, D., J. Anderson, C. Correll, J. Fogg, K. Gebhardt, R. Krapf, S. Leonard, B. Mitchell, and J. Staats, 1998. Riparian Area Management: A User Guide to Assessing Proper Functioning Condition and the Supporting Science for Lotic Areas, Technical Report 1737-15. U.S. Department of the Interior, Bureau of Land Management, U.S. Department of Agriculture Forest Service, and Natural Resources Conservation Service. ftp://ftp.blm.gov/pub/nstc/techrefs/Final%20TR%201737-15.pdf.
24. Rosgen, D.L., 1994. A Classification of Natural Rivers. Catena 22:169-199.
25. Rosgen, D.R. 1996. Applied River Morphology. Wildland Hydrology. Pagosa Springs, CO.
26. Rosgen, D.L., 2009. A Watershed Assessment for River Stability and Sediment Supply (WARSSS). Wildland Hydrology Books, Fort Collins, Colorado. http://www.epa.gov/warsss
27. Schoonover, J.E. and K.W.J. Williard, 2005. Ground Water Nitrate Reduction in Giant Cane and Forest Riparian Buffer Zones. Journal of the American Water Resources Association 39(2):347-354.
28. Shields, Jr., F.D., R.E. Lizotte, Jr., S.S. Knight, C.M. Cooper, and D. Wilcox, 2010. The Stream Channel Incision Syndrome and Water Quality. Ecological Engineering 36:78-90.

Plum Creek Stream Restoration: Project Summary and Design Report
U. S. Fish and Wildlife Service June 2015 Chesapeake Bay Field Office Page | 57
29. Stribling JB, White JS, Jessup BJ, et al. 1998. Development of a benthic index of biotic integrity for Maryland streams. Report. Tetra Tech Incorporated, Owings, MD, USA
30. Tomer, M.D., T.B. Moorman, J.L. Kovar, D.E. James, and M.R. Burkart, 2007. Spatial Patterns of Sediment and Phosphorus in a Riparian Buffer in Western Iowa. Soil and Water Conservation Journal 62(5):329-338.
31. USEPA, 1997b. Volunteer Stream Monitoring: A Methods Manual. EPA 841-B-97-003, U.S. Environmental Protection Agency, Washington, D.C. http://www.epa.gov/volunteer/stream/stream.pdf.
32. U.S. Geological Survey, 2012, The StreamStats program for Maryland, online at http://water.usgs.gov/osw/streamstats/maryland.html.
33. Wohl, E.E, 2004. Disconnected Rivers, Linking Rivers to Landscapes. Yale University, New Haven, Connecticutt. ISBN-0-300-I0332-8.
34. Wolman, M.G., 1954. A Method of Sampling Coarse River-bed Material. Transactions of the American Geophysical Union 35(6):951-956.
35. Wynn, T., S. Mostaghimi, J.A. Burger, A.A. Harpold, M.B. Henderson, and L. Henry, 2004. Variation in Root Density along Stream Banks. Journal of Environmental Quality 33:2030-2039.

Plum Creek Stream Restoration: Project Summary and Design Report
U. S. Fish and Wildlife Service June 2015 Chesapeake Bay Field Office Page | 58
REFERENCES LIST
1. Chaplin, J.J., 2005, Development of regional curves relating bankfull-channel geometry and discharge to drainage area for streams in Pennsylvania and selected areas of Maryland: U.S. Geological Survey Scientific Investigations Report 2005-5147, 34p.
2. Cooper, E.L., and R.C. Scherer. 1967. Annual production of brook trout (Salvelinus fontinalis) in fertile and infertile streams of Pennsylvania. Pa. Acad. Sci. Proc. 41:65-70.
3. Daye, P.G., and E.T. Garside. 1975. Lethal levels of pH for brook trout, Salvelinus fontinialis. Can. J. Zool. 53(5):639-641
4. DK Books. (Designer). Lake Formation [Web Graphic]. Retrieved from http://www.clipart.dk.co.uk/1107/subject/Geography/Lake_formation
5. Dunson, W.A., and R.R. Martin. 1973. Survival of brook trout in a bog-derived acidity gradient. Ecology 54(6):1370-1376
6. Harman, W. & R. Starr. 2011. Natural Channel Design Review Checklist. US Fish and Wildlife Service, Chesapeake Bay Field Office, Annapolis, MD.
7. Hey, R.D. 2006. Fluvial Geomorphological Methodology for Natural Stable Channel Design. Journal of American Water Resources Association. April 2006. Vol. 42, No. 2. pp. 357-374. AWRA Paper No. 02094. http://www.awra.org/jawra/papers/J02094.html
8. Hudy, M., T. M. Thieling, N. Gillespie, and E. P. Smith. 2006. Distribution, satus, and perturbations to brook trout within the eastern United States. Final report to the Eastern Brook Trout Joint Venture. Available: www.easternbrooktrout.org.
9. Johnson, R.K., T. Wiederholm, and D.M. Rosenburg. 1993. Freshwater biomonitoring using individual organisms, populations, and species assemblages of benthic macroinvertebrates. Pages 40-158 in D.M. Rosenberg and V.H. Resh (editors). Freshwater biomonitoring and benthic macroinvertebrates. Chapman and Hall, New York.
10. Kondratieff & Myrick. 2005. How High Can Brook Trout Jump? A Laboratory Evaluation of Brook Trout Jumping Performance. Department of Fishery and Wildlife Biology, Colorado State University. American Fisheries Society 2006. 135:361-370, 2006.
11. Limerinos, J.T. 1970. Determination of Manning’s Coefficient from Measured Bed Roughness in Natural Channels. U.S. Geological Survey Water Supply Paper 1898-B, Prepared in cooperation with the California Department of Water Resources, U.S. Government Printing Office, Washington, DC.
12. Leopold, L.B., M.G. Wolman, and J. Miller, 1964. Fluvial Processes in Geomorphology, W.H. Freeman Company, San Francisco.
13. Leopold, L.B., M.G. Wolman, J.P. Miller. 1992. Fluvial Processes in Geomorphology. Dover Publications, Inc. New York.
14. Leopold, L. B. 1994. A View of the River, Harvard University Press, Cambridge, MA.

Plum Creek Stream Restoration: Project Summary and Design Report
U. S. Fish and Wildlife Service June 2015 Chesapeake Bay Field Office Page | 59
15. Marshall, Tyler, Rausch, LLC. 1999. U.S. National Arboretum: Storm water management conceptual design for Hickey Run sub-watershed.
16. Maryland Geological Survey. (n.d.). Maryland geology. Retrieved from http://www.mgs.md.gov/geology/index.html
17. Meisner, J.D. 1990. Effect of climatic warming on the southern margins of the native range of brook trout, Salvelinus fontinalis. Can. J. Fish. Aquat. Sci. 47: 1065-1070
18. Moore, S. Frederick County Division of Public Works, Watershed Management Section. (2011). Eastern brook trout joint venture maryland brook trout alliance catoctin, antietam, and monocacy brookie initiative (cambi) (DRAFT)
19. NRCS. 2007. Part 654 – Stream Restoration Design. USDA, Natural Resources Conservation Service. H.210.NEH.654. http://policy.nrcs.usda.gov/index.aspx
20. Raleigh, R. F. 1982. Habitat suitability index models: Brook trout. U.S. Department of Interior, Fish & Wildlife Service. FWS/OBS-82/10.24. 42 pp.
21. Rosgen, D.L. 2006. Watershed Assessment of River Stability and Sediment Supply (WARSSS). Wildland Hydrology. Fort Collins, CO. http://www.epa.gov/warsss/
22. Rosgen, D.R. 2010. The Cross-Vane, W-Weir and J-Hook Vane Structures… Their Description, Design and Application for Stream Stabilization and River Restoration. Wildland Hydrology. Pagosa Springs, CO.
23. Shultz, Kay, Jessica Hunicke and Shannon Moore, Upper Monocacy Watershed Restoration Action Strategy, June 2005.
24. Simon, A. and E. Langendoen, 2006. A Deterministic Bank-Stability and Toe Erosion Model for Stream Restoration. Proceedings of the Environmental and Water Resources Council 2006 Meeting, Omaha, Nebraska, R. Graham (Editor). Environmental and Water Resources Institute, American Society of Civil Engineers, Reston, Virginia. http://www.ars.usda.gov/Research/docs.htm?docid=5044.
25. Soil Survey Staff, Natural Resources Conservation Service, United States Department of Agriculture. Web Soil Survey. Available online at http://websoilsurvey.nrcs.usda.gov/. Accessed [11/22/2013].
26. Sykora, J., E. Smith, and M. Synak. 1972. Effect of lime neutralized iron hydroxide suspensions on juvenile brook trout (Salvelinus fontinalis, Mitchill). Water Res. 6:935-950
27. USDA. 2007. Part 654 Stream Restoration Design National Engineering Handbook. pp. 11-1
28. U.S. Environmental Protection Agency, Region 3. (2013). Mid-atlantic wetlands, stream and watershed restoration. Retrieved from website: http://www.epa.gov/reg3esd1/wetlands/restoration.htm
29. Webster, D. (ed.) 1975. Proceedings of brook trout seminar. Wisc. Dept. Nat. Resour., Univ. Wisc. 16pp

Plum Creek Stream Restoration: Project Summary and Design Report
U. S. Fish and Wildlife Service June 2015 Chesapeake Bay Field Office Page | 60
30. Wehrly, K.E., L. Wang and M. Mitro. 2007. Field-Based Estimates of Thermal ToleranceLimits for Trout: Incorporating Exposure Time and Temperature Fluctuation. Transactions of the American Fisheries Society 136:365-374.
31. “A Stream Channel Stability Assessment Methodology”. Proceedings of the Seventh Federal Interagency Sedimentation Conference, Vol. 2, pp. II – 9-15, March 18 - 26, 2001, Reno, NV

Plum Creek Stream Restoration: Project Summary and Design Report
U. S. Fish and Wildlife Service June 2015 Chesapeake Bay Field Office Page | A
APPENDIX A Location Map

Old
Elk
Neck
Rd
W Pulaski Hwy
Old
Fie
ld P
oint
Rd
Turk
ey P
oint
Rd
Irishtown Rd
Nottingham Rd
Elk Forest Rd
E Old Philadelphia Rd
Shady Beach Rd
Blue Ball Rd
Randalia Rd
Whi
teha
ll R
d
Bouchelle Rd
Mar
ley
Rd
Thio
kol R
d
Han
ce P
oint
Rd
N Bridge St
Mec
hani
cs V
alle
y R
d
North St
Lums R
d
Pulaski Hwy
Huminski Rd
McKinneytown RdCam
p Rd
Zeitler RdElkton Rd
Deaver Rd
Blair Shore
Rd
W Main St
Dilks Ln
Beaver Trl
Sandy Cove Rd
E Main St
Cara Cove Rd
Breon Ln
N East R
d
Stevenson Rd
Weed Ln
River Rd
Old Chestnut Rd
S Main St
Starkey Ln Frenchtown Rd
Landing Ln
Fawn D
r
Rd B
Cloud Ln
Newa
rk A
ve
Dogwood Rd
Cox Ln
Jess
ie Ln
Wayside Dr
Elkton
Blvd
Elk Neck Blvd
Plum Point RdArundel Ln
Gina Ln
Elk Point Rd
S Bridge St
Schneiders Ln
Arbutus St
S Shore Rd
Dell Ln
Log Cabin R
d
Capitalist Ln
Buck Run
Prat
t Ln Cas
paru
s W
ay
Jethro St
Shamrock Ln
Patriarch Ln
Knoll St
Bow
St
School House Ln
Point Rd
Deans Ln
Crestv
iew D
r
Rav
en C
t
Yellowfield Blvd
Otter Point Rd
Blair Ln
Jones Chapel Rd
Fern Ln
Kent Rd
Pine Grove Ln
Albe Dr
Tree Ln E
Highlan
d Dr
Lockard Ln
Oprah DrThom
ashi
re T
er
Stoma Ln
Oak H
ill Ln
Rehill Ave
Guilford Ct
Tren
t Rd
Park Ln
Grandview Ave
Douglas St
Wilderness R
d
W Pulaski HwyM
arley
Rd
DoIT, MD iMAP, MDP
0 5,100 10,2002,550Feet
1 inch = 5,000 feet
Ü
Project Location
Plum Creek Location Map

Plum Creek Stream Restoration: Project Summary and Design Report
U. S. Fish and Wildlife Service June 2015 Chesapeake Bay Field Office Page | B
APPENDIX B Soils Map

RmC
RmC
RmD
AnB
RfB
KmC
AuD
KmC
KpB
RmD
RmB
AnB
KpB
RfB
SME
RmD
RmCKpB
KpB
SaD
AnAW
CsB
KmC
RmB
SaEAuD
HbC
MtB
RmD
RmD
AuB
RmBRmD
AuC
SgC MkC
KmC
KmC
SaD
UbB
AuC
RmC
UsB
KmC
RmC
SME
RmCAuC
RmB
SME
AuD
RmC
RmB
Irishtown Rd
Tim
berla
ne D
r
0 1,000 2,000500Feet
1 inch = 1,000 feet
Ü
Soils found in Plum Creek Watershed
LegendSoil Type
AnA
AnB
AuB
AuC
AuD
CsB
HbC
KmC
KpB
MkC
MtB
RfB
RmB
RmC
RmD
SME
SaD
SaE
SgC
UbB
UsB
Water

Map Unit Legend
Cecil County, Maryland (MD015)
Map Unit Symbol Map Unit Name Acres in AOI Percent of AOI
AnA Annemessex loam, 0 to 2percent slopes
5.1 0.9%
AnB Annemessex loam, 2 to 5percent slopes
32.7 5.6%
AuB Aura gravelly sandy loam, 2 to 5percent slopes
3.4 0.6%
AuC Aura gravelly sandy loam, 5 to10 percent slopes
5.1 0.9%
AuD Aura gravelly sandy loam, 10 to15 percent slopes
22.9 3.9%
CsB Crosiadore silt loam, 2 to 5percent slopes
4.5 0.8%
HbC Hambrook sandy loam, 5 to 10percent slopes
5.5 0.9%
KmC Keyport loam, 5 to 10 percentslopes
45.1 7.7%
KpB Keyport silt loam, 2 to 5 percentslopes
39.5 6.7%
MkC Matapeake silt loam, 5 to 10percent slopes
3.0 0.5%
MtB Mattapex silt loam, 2 to 5percent slopes
4.5 0.8%
RfB Russett fine sandy loam, 2 to 5percent slopes
24.5 4.2%
RmB Russett-Christiana-Hambrookcomplex, 0 to 5 percentslopes
22.3 3.8%
RmC Russett-Christiana-Hambrookcomplex, 5 to 10 percentslopes
261.9 44.5%
RmD Russett-Christiana-Hambrookcomplex, 10 to 15 percentslopes
73.1 12.4%
SaD Sassafras sandy loam, 10 to 15percent slopes
8.1 1.4%
SaE Sassafras sandy loam, 15 to 25percent slopes
6.8 1.2%
SgC Sassafras gravelly loam, 5 to 10percent slopes
2.1 0.4%
SME Sassafras and Croom soils, 15to 25 percent slopes
10.9 1.9%
UbB Udorthents, borrow area, 0 to 5percent slopes
2.0 0.3%
Soil Map—Cecil County, Maryland Plum Creek Watershed
Natural ResourcesConservation Service
Web Soil SurveyNational Cooperative Soil Survey
2/9/2015Page 3 of 4

Cecil County, Maryland (MD015)
Map Unit Symbol Map Unit Name Acres in AOI Percent of AOI
UsB Udorthents, refuse substratum,0 to 5 percent slopes
4.1 0.7%
W Water 2.1 0.4%
Totals for Area of Interest 589.0 100.0%
Soil Map—Cecil County, Maryland Plum Creek Watershed
Natural ResourcesConservation Service
Web Soil SurveyNational Cooperative Soil Survey
2/9/2015Page 4 of 4

Plum Creek Stream Restoration: Project Summary and Design Report
U. S. Fish and Wildlife Service June 2015 Chesapeake Bay Field Office Page | C
APPENDIX C Existing Conditions

FLOW
Wetland DelinationBoundary
Wetland DelinationBoundary
25' Wetland BufferBoundary
25' Wetland BufferBoundary
25' Wetland BufferBoundary
25' Wetland BufferBoundary
25' Wetland BufferBoundary
25' Wetland BufferBoundary
25' Wetland BufferBoundary
PROJECT MANAGER:MAS
DESIGN:MAS
DRAFTING: MAS
CHECKED BY:RRS
SCALE: AS SHOWN
REVISISIONS DATE BY
SHEETPLUM CREEK PROJECTCECIL COUNTY, MD
EC-1
EXISTINGCONDITIONS
2 21OFU.S. Fish & Wildlife ServiceChesapeake Bay Field Office
Stream Habitat Assessment andRestoration Program
177 Admiral Cochrane DriveAnnapolis, Maryland 21401
Tel. (410) 573-4581
Professional Certification
I hereby certify that these
document were prepared or
approved by me, and that I am a
duly licensed professional
engineer under the laws of the
State of Maryland,
License No. 20945,
Expiration Date: 2015-08-23.
U.S.FISH & WILDLIFE
SERVICE
DE
PA
R
T M E N T O F T H E I N T ER
I OR
Existing Ponded Area
Remain
ing Berm
of
Breach
ed Dam
Remain
ing Berm
of
Breach
ed Dam
Existing Gravel Road
Existing Gravel Road
FLOW
0 20 40 60 80 100
Scale (feet):
DATE: 4/2/2014
Existing NontidalWetlands
Existing NontidalWetlands
Existing NontidalWetlands
5/27/2015 MAS

Plum Creek Stream Restoration: Project Summary and Design Report
U. S. Fish and Wildlife Service June 2015 Chesapeake Bay Field Office Page | D
APPENDIX D Function-Based Data Collection Form

Function Parameter Measurment Method Collection Method Field Done?Hydrology
Channel-Forming Discharge
Regional CurvesMD Piedmont and Coastal Plain Curves
N Precipitation / Runoff
RelationshipRational Method, HEC-HMS, USGS Regression equations
Win TR-55 N Flood Frequency Bulletin 17b 1.2 - 1.5/year N
Flow DurationFlow Duration Cure, Crest Gage, Monitoring Devices, Indicators
Not Collecting N Hydraulics
Floodplain Connectivity
Bank Height Ratio, Entrenchment Ratio, Dimensionaless rating curve
Long Profile and Cross Section Survey Y Flow Dynamics
Bankfull Velocity for C and E stream types (ft/s)
Long pro / Cross Sections Y Ground/Surface Water Exchange
Peizometers, tracers and seepage meters
Not Collecting N Geomorphology
Sediment Transport Competency
Shear Stress Curve, Required Depth and Slope, Modeling
Particle Data Y Sediment Transport
CapacityFLOWSED and POWERSED Bar Sample, Particle Data Y
LWD Transport and Storage
Large Woody Debris Index Worksheet N Channel Evolution
Rosgen Stream Type Succession Scenarios
Worksheet Y Bank Migration / Lateral Stability
Meander Width ratio, cross-sections, BEHI
Long profile and Cross Section Survey and BEHI
Y Riparian Vegetation Proper Functioning Protocol Proper Functioning Protocol Y Bed Form Diversity
% Riffle/Pool, Facet Slopes, P-P Spacing, Depth Variability
Long Profile Y Bed Material
CharacterizationPebble Count Pebble Count Y
Function Parameter Measurment Method Collection Method Field Done?Physiochemical
Water QualityTemp, DO, Conductivity, pH and
TurbidityNot Collecting N
Nutrients Laboratory Analysis Not Collecting N Organic Carbon Laboratory Analysis Not Collecting N
BiologyMicrobial
CommunitiesTaxonomic Methods, Non-Taxonomic
Methods, Bio IndicesMD DNR MBSS N
Macrophyte Communities
Taxonomic Methods, Non-Taxonomic Methods, Bio Indices
MD DNR MBSS N Benthic
MacroinvertebratesTaxonomic Methods, Non-Taxonomic
Methods, Bio IndicesMD DNR MBSS N
Fish CommunitiesTaxonomic Methods, Non-Taxonomic
Methods, Bio IndicesMD DNR MBSS N
Landscape Connectivity
Taxonomic Methods, Non-Taxonomic Methods, Bio Indices
Not Collecting N
You created this PDF from an application that is not licensed to print to novaPDF printer (http://www.novapdf.com)

Plum Creek Stream Restoration: Project Summary and Design Report
U. S. Fish and Wildlife Service June 2015 Chesapeake Bay Field Office Page | E
APPENDIX E Computations of Velocity and Bankfull Discharge Using Various Methods

Worksheet 2-2. Computations of velocity and bankfull discharge using various methods (Rosgen, 2006b; Rosgen and Silvey, 2007).
7/15/2013 C4 HUC:
12.22 Abkf (ft2)
0.96 dbkf (ft)
12.75 Wbkf (ft)
13.86 Wp (ft)
33.76 Dia. (mm)
0.11 D 84 (ft)
0.0105 Sbkf (ft / ft)
0.88 R (ft)
32.2 g (ft / sec2)
7.93 R / D 84
0.9 DA (mi2)
0.545 u* (ft/sec)
4.33 ft / sec 52.90 cfs
Roughness (Figs. 2-18, 2-19) u = 1.49*R2/3
*S1/2
/ n n = 0.0303
b) Manning's n from Stream Type (Fig. 2-20) n = 0.0325
c) Manning's n from Jarrett (USGS):
n = 0.070
Q = 0.0 year
0.00 ft / sec 0.00 cfs 4. Continuity Equations: b) USGS Gage Data u = Q / A
4. Continuity Equations: a) Regional Curves u = Q / A 0.00 ft / sec 0.00 cfsReturn Period for Bankfull Discharge
cfsDarcy-Weisbach (Leopold, Wolman and Miller) 3. Other Methods (Hey, Darcy-Weisbach, Chezy C, etc.) 0.00 ft / sec 0.00
2. Roughness Coefficient: u = 1.49*R2/3
*S1/2
/ n1.99 ft / sec
cfsChezy C
3. Other Methods (Hey, Darcy-Weisbach, Chezy C, etc.) 4.68 ft / sec 57.19
Bankfull VELOCITY
24.31 cfsn = 0.39*S
0.38*R
-0.16
2. Roughness Coefficient: u = 1.49*R2/3
*S1/2
/ n4.31 ft / sec 52.66 cfs
2. Roughness Coefficient: a) Manning's n from Friction Factor / Relative 4.62 ft / sec 56.48
Drainage Area Shear Velocity u* = (gRS)½
Bankfull DISCHARGE
u = [ 2.83 + 5.66 * Log { R / D 84 } ] u*
cfs
ESTIMATION METHODS
Bankfull Riffle Cross-Sectional AREA Bankfull Riffle Mean DEPTH
D 84 at Riffle D 84 (mm) / 304.8
Gravitational Acceleration Relative Roughness R(ft) / D 84 (ft)
Bankfull SLOPE Hydraulic RADIUS Abkf / Wp
Valley Type:
Observers: MAS
INPUT VARIABLES OUTPUT VARIABLES
VIII
Bankfull Riffle WIDTH Wetted PERMIMETER ~ (2 * dbkf ) + Wbkf
Bankfull VELOCITY & DISCHARGE Estimates Stream: Plum Creek Location: Reference Reach Date: Stream Type:
Feet
1. Friction Factor
Relative Roughness
Note: This equation is applicable to steep, step/pool, high boundary roughness, cobble- and boulder-dominated stream systems; i.e., for
Protrusion Height Options for the D84 Term in the Relative Roughness Relation (R/D84) – Estimation Method 1 For sand-bed channels: Measure 100 "protrusion heights" of sand dunes from the downstream side of feature to the top of feature. Substitute the D84 sand dune protrusion height in ft for the D84 term in method 1. Option 1.
Option 2.
Option 3.
For boulder-dominated channels: Measure 100 "protrusion heights" of boulders on the sides from the bed elevation to the top of the rock on that side. Substitute the D84 boulder protrusion height in ft for the D84 term in method 1.
For bedrock-dominated channels: Measure 100 "protrusion heights" of rock separations, steps, joints or uplifted surfaces above channel bed elevation. Substitute the D84 bedrock protrusion height in ft for the D84 term in method 1.
For log-influenced channels: Measure "protrustion heights" proportionate to channel width of log diameters or the height of the log on upstream side if embedded. Substitute the D84 protrusion height in ft for the D84 term in method 1. Option 4.
Copyright © 2008 Wildland Hydrology River Stability Field Guide page 2-41

Plum Creek Stream Restoration: Project Summary and Design Report
U. S. Fish and Wildlife Service June 2015 Chesapeake Bay Field Office Page | F
APPENDIX F Lentic Standard Checklist

Lentic Standard Checklist
Name: Plum Creek – Elk Neck State Forest
Date: 08/28/2014 Area/Segment ID: Reach 1
ID Team Observers: MAS
Yes No N/A HYDROLOGY X 1) Riparian-wetland area is saturated at or near the surface or
inundated in “relatively frequent” events
X 2) Fluctuation of water levels is not excessive
X 3) Riparian-wetland area is enlarging or has achieved potential extent
X 4) Upland watershed is not contributing to riparian-wetland degradation
X 5) Water quality is sufficient to support riparian-wetland plants
X 6) Natural surface or subsurface flow patterns are not altered by
disturbance (i.e., hoof action, dams, dikes, trails, roads, rills, gullies, drilling activities)
X 7) Structure accommodates safe passage of flows (e.g., no headcut affecting dam or spillway)
Yes No N/A VEGETATION X 8) There is diverse age-class distribution of riparian-wetland vegetation
(recruitment for maintenance/recovery)
X 9) There is diverse composition of riparian-wetland vegetation (for maintenance/recovery)
X 10) Species present indicate maintenance of riparian-wetland soil moisture characteristics
X 11) Vegetation is comprised of those plants or plant communities that have
root masses capable of withstanding wind events, wave flow events, or overland flows (e.g., storm events, snowmelt)
X 12) Riparian-wetland plants exhibit high vigor
X 13) Adequate vegetative cover is present to protect shorelines/soil surface
and dissipate energy during high wind and wave events or overland flows
X 14) Frost or abnormal hydrologic heaving is not present
X 15) Favorable microsite condition (i.e., woody debris, water temperature, etc.) is maintained by adjacent site characteristics
Yes No N/A EROSION/DEPOSITION X 16) Accumulation of chemicals affecting plant productivity/composition is
not apparent
X 17) Saturation of soils (i.e., ponding, flooding frequency and duration) is sufficient to compose and maintain hydric soils
X 18) Underlying geologic structure/soil material/permafrost is capable of restricting water percolation
X 19) Riparian-wetland is in balance with the water and sediment being supplied by the watershed (i.e., no excessive erosion or deposition)
X 20) Islands and shoreline characteristics (i.e., rocks, course and/or large woody debris) are adequate to dissipate wind and wave event energies
(Revised 1998)

Lentic Standard Checklist
Name: Plum Creek – Elk Neck State Forest
Date: 08/28/2014 Area/Segment ID: Reach 2
ID Team Observers: MAS
Yes No N/A HYDROLOGY X 1) Riparian-wetland area is saturated at or near the surface or
inundated in “relatively frequent” events
X 2) Fluctuation of water levels is not excessive
X 3) Riparian-wetland area is enlarging or has achieved potential extent
X 4) Upland watershed is not contributing to riparian-wetland degradation
X 5) Water quality is sufficient to support riparian-wetland plants
X 6) Natural surface or subsurface flow patterns are not altered by
disturbance (i.e., hoof action, dams, dikes, trails, roads, rills, gullies, drilling activities)
X 7) Structure accommodates safe passage of flows (e.g., no headcut affecting dam or spillway)
Yes No N/A VEGETATION X 8) There is diverse age-class distribution of riparian-wetland vegetation
(recruitment for maintenance/recovery)
X 9) There is diverse composition of riparian-wetland vegetation (for maintenance/recovery)
X 10) Species present indicate maintenance of riparian-wetland soil moisture characteristics
X 11) Vegetation is comprised of those plants or plant communities that have
root masses capable of withstanding wind events, wave flow events, or overland flows (e.g., storm events, snowmelt)
X 12) Riparian-wetland plants exhibit high vigor
X 13) Adequate vegetative cover is present to protect shorelines/soil surface
and dissipate energy during high wind and wave events or overland flows
X 14) Frost or abnormal hydrologic heaving is not present
X 15) Favorable microsite condition (i.e., woody debris, water temperature, etc.) is maintained by adjacent site characteristics
Yes No N/A EROSION/DEPOSITION X 16) Accumulation of chemicals affecting plant productivity/composition is
not apparent
X 17) Saturation of soils (i.e., ponding, flooding frequency and duration) is sufficient to compose and maintain hydric soils
X 18) Underlying geologic structure/soil material/permafrost is capable of restricting water percolation
19) Riparian-wetland is in balance with the water and sediment being supplied by the watershed (i.e., no excessive erosion or deposition)
X X 20) Islands and shoreline characteristics (i.e., rocks, course and/or large woody debris) are adequate to dissipate wind and wave event energies
(Revised 1998)

Plum Creek Stream Restoration: Project Summary and Design Report
U. S. Fish and Wildlife Service June 2015 Chesapeake Bay Field Office Page | G
APPENDIX G Stream Bank Erosion Summary

Project Name Location
Date
Observers Valley Type VIII Stream Type
Feature
TOTAL 465.0 N/A N/A N/A N/A 5555.8 267.5 6.6
Cecil County, MD
7/31/2013
C 4 MAS
Plum Creek
Bank 11 30.0 2.5 Moderate Moderate 0.30 22.50 1.08 0.04
Bank 10 40.0 2.5 Moderate Moderate 0.30 30.00 1.44 0.04
Bank 9 60.0 2.5 Moderate High 0.80 120.00 5.78 0.10
Bank 8 45.0 2.5 Moderate Moderate 0.30 33.75 1.63 0.04
Bank 3 40.0 20.0
Bank 7 40.0 10.0 Very High Moderate 0.64
Bank 4 40.0 10.0 Very High Moderate 0.64
Extreme High 2.50
256.00 12.33 0.31
Bank 6 40.0 20.0 Extreme High 2.50 2000.00 96.30 2.41
256.00 12.33 0.31
Bank 5 40.0 10.0 Very High High 1.00 400.00 19.26 0.48
2000.00 96.30 2.41
40.0 10.0 Very High High 1.00 400.00 19.26 0.48Bank 2
NBS Rating
Predicted Rate
of Bank
Erosion (ft/year)
Feature I.D. (Bank., Headcut or Deposition I.D.)
Length, ft (Bank or
deposition)
Height, ft (Bank or
Headcut)
BEHI Rating
Predicted
Erosion
Amount
(ft3/year)
Predicted
Erosion
Amount (tons/year)
Predicted
Erosion Rate (tons/year/ft)
Bank 1 50.0 2.5 Moderate Moderate 0.30 37.50 1.81 0.04

Plum Creek Stream Restoration: Project Summary and Design Report
U. S. Fish and Wildlife Service June 2015 Chesapeake Bay Field Office Page | H
APPENDIX H Stream Classification Worksheet

Worksheet 5-3. Field form for Level II stream classification (Rosgen, 1996; Rosgen and Silvey, 2005).
576 acres 0.9 mi2
Date: 07/31/13VIII
Bankfull WIDTH (Wbkf)WIDTH of the stream channel at bankfull stage elevation, in a riffle section. ft
Bankfull DEPTH (dbkf)
ft
Bankfull X-Section AREA (Abkf)
ft2
Width/Depth Ratio (Wbkf / dbkf)Bankfull WIDTH divided by bankfull mean DEPTH, in a riffle section. ft/ft
Maximum DEPTH (dmbkf)
ft
WIDTH of Flood-Prone Area (Wfpa)
ft
Entrenchment Ratio (ER)
ft/ft
Channel Materials (Particle Size Index ) D50
mm
Water Surface SLOPE (S)
ft/ft
Channel SINUOSITY (k)
22.43
0.0105
Mean DEPTH of the stream channel cross-section, at bankfull stage elevation, in a riffle section (dbkf = A / Wbkf).
AREA of the stream channel cross-section, at bankfull stage elevation, in a riffle section.
Maximum depth of the bankfull channel cross-section, or distance between the bankfull stage and Thalweg elevations, in a riffle section.
Channel slope = "rise over run" for a reach approximately 20–30 bankfull channel widths in length, with the "riffle-to-riffle" water surface slope representing the gradient at bankfull stage.
Sinuosity is an index of channel pattern, determined from a ratio of stream length divided by valley length (SL / VL); or estimated from a ratio of valley slope divided by channel slope (VS / S).
12.75
0.96
C 4
Twice maximum DEPTH, or (2 x dmbkf) = the stage/elevation at which flood-prone area WIDTH is determined in a riffle section.
The ratio of flood-prone area WIDTH divided by bankfull channel WIDTH (W fpa / Wbkf) (riffle section).
The D50 particle size index represents the mean diameter of channel materials, as sampled from the channel surface, between the bankfull stage and Thalweg elevations.
12.22
13.28
1.56
1
100
7.84
Plum Creek
Sec.&Qtr.: ; ; Cross-Section Monuments (Lat./Long.):
Stream:
Drainage Area:
Observers:
Twp.&Rge:
Location:
Basin:
Cecil County, MD Plum Creek
Valley Type:MAS
Stream Type
(See Figure 2-14)
Copyright © 2006 Wildland Hydrology WARSSS page 5-29

Plum Creek Stream Restoration: Project Summary and Design Report
U. S. Fish and Wildlife Service June 2015 Chesapeake Bay Field Office Page | I
APPENDIX I Proposed Restoration Design

StagingArea Site Access
Via Existing GravelRoad System
FLOW
Existing NontidalWetland
ConstructedRiffle 1
Stone OverflowChannel
Stone OverflowChannel
Wetland DelinationBoundary
Wetland DelinationBoundary
U.S. Fish & Wildlife ServiceChesapeake Bay Field Office
Stream Habitat Assessment andRestoration Program
177 Admiral Cochrane DriveAnnapolis, Maryland 21401
Tel. (410) 573-4581
PROJECT MANAGER:MAS
DESIGN:MAS
DRAFTING: MAS
CHECKED BY:RRS
SCALE: AS SHOWN
REVISISIONS DATE BY
SHEET
PC-1
3 21OFProfessional Certification
I hereby certify that these
document were prepared or
approved by me, and that I am a
duly licensed professional
engineer under the laws of the
State of Maryland,
License No. 20945,
Expiration Date: 2015-08-23.
PLUM CREEK PROJECTCECIL COUNTY, MD
PROPOSEDCONDITIONS
0 20 40 60 80 100
Scale (feet):
DATE: 4/2/2014
U.S.FISH & WILDLIFE
SERVICE
DE
PA
R
T M E N T O F T H E I N T ER
I OR
Proposed 1' Contour
Existing 1' Contour
Legend
Log Drop
J-Hook
Cross Vane
Toe Wood
Imbricated Rip-RapBridge Abutment
Note: No provision was made at this time for a futurebridge. Any future bridge crossing will be designed andconstructed by others and have a minimum span of twicebankfull.
5/27/2015 MAS

Plum Creek Stream Restoration: Project Summary and Design Report
U. S. Fish and Wildlife Service June 2015 Chesapeake Bay Field Office Page | J
APPENDIX J Sediment Transport Competency - Existing

Worksheet 3-14. Sediment competence calculation form to assess bed stability.
Stream:
Location:
Observers: Date:
D 50
D 50
D max 68 (mm)304.8 mm/ft
S
d
Range: 3 – 7 Use EQUATION 1: = 0.0834 ( ) –0.872
D max/D 50 Range: 1.3 – 3.0 Use EQUATION 2: = 0.0384 (D max/D 50) –0.887
Bankfull Dimensionless Shear Stress 2
d Required bankfull mean depth (ft) (use D max in ft)
S Required bankfull water surface slope (ft/ft) (use D max in ft)
Check: Stable Aggrading
Shields CO
26.07 70.15Shields CO
0.877 0.335Shields CO
1.76 0.67Shields CO
0.0201 0.0077
Check: Stable Aggrading
11.4
27.5 Median particle size of riffle bed material (mm)
Median particle size of bar or sub-pavement sample (mm)
Existing bankfull water surface slope (ft/ft)
Largest particle from bar sample (ft)
Stream Type: C4
Enter Required Information for Existing Condition
2.40
Sediment Competence Using Dimensional Shear Stress
Calculate Bankfull Water Surface Slope Required for Entrainment of Largest Particle in Bar Sample
EQUATION USED:
Immersed specific gravity of sediment
0.00800
0.223
1.65
0.70
06/05/2015
Existing bankfull mean depth (ft)
Plum CreekReach upstream of pond VIIIValley Type:
Select the Appropriate Equation and Calculate Critical Dimensionless Shear Stress
Degrading
Calculate Bankfull Mean Depth Required for Entrainment of Largest Particle in Bar Sample
0.00904
0.79
0.017
2.47
Predicted slope required to initiate movement of measured D max (mm)
= predicted shear stress, = 62.4, d = existing depth
Predicted mean depth required to initiate movement of measured D max (mm)
= predicted shear stress, = 62.4, S = existing slope
Predicted largest moveable particle size (mm) at bankfull shear stress (Figure 3-11)
Predicted shear stress required to initiate movement of measured D max (mm) (Figure 3-11)
0.349
Degrading
Bankfull shear stress = dS (lbs/ft2) (substitute hydraulic radius, R, with mean depth, d )
= 62.4, d = existing depth, S = existing slope
S
Dd
maxs 1)-(* γ
d
DS
maxs 1)-(* γ
5050/DD
Sd γ
dS γ
1s γ
5050/DD
Copyright © 2008 Wildland Hydrology River Stability Field Guide page 3-101

Plum Creek Stream Restoration: Project Summary and Design Report
U. S. Fish and Wildlife Service June 2015 Chesapeake Bay Field Office Page | K
APPENDIX K Velocity and Discharge Calculations

Worksheet 2-2. Computations of velocity and bankfull discharge using various methods (Rosgen, 2006b; Rosgen and Silvey, 2007).
C4
HUC:
13.25 Abkf (ft2)
1.02 dbkf (ft)
13.00 Wbkf (ft)
13.69 Wp (ft)
40.00 Dia. (mm)
0.13 D 84 (ft)
0.0108 Sbkf (ft / ft)
0.97 R (ft)
32.2 g (ft / sec2)
7.41 R / D 84
0.9 DA (mi2)
0.581 u* (ft/sec)
4.49 ft / sec 59.51 cfs
Roughness (Figs. 2-18, 2-19) u = 1.49*R 2/3 *S 1/2 / n n = 0.0325
b) Manning's n from Stream Type (Fig. 2-20) n = 0.0325
c) Manning's n from Jarrett (USGS):
n = 0.070
Q = 0.0 year
0.00 ft / sec 0.00 cfs
VIII
Bankfull Riffle WIDTH Wetted PERMIMETER ~ (2 * dbkf ) + Wbkf
Bankfull VELOCITY & DISCHARGE Estimates Stream: Plum Creek Location: Design Riffle X/S
Date: Stream Type: Valley Type:
Observers:
INPUT VARIABLES OUTPUT VARIABLESBankfull Riffle Cross-Sectional
AREA Bankfull Riffle Mean DEPTH
D 84 at Riffle D 84 (mm) / 304.8
Gravitational Acceleration Relative Roughness R(ft) / D 84 (ft)
Bankfull SLOPE Hydraulic RADIUS Abkf / Wp
2. Roughness Coefficient: a) Manning's n from Friction Factor / Relative 4.65 ft / sec 61.63
Drainage Area Shear Velocity u* = (gRS)½
Bankfull DISCHARGE
u = [ 2.83 + 5.66 * Log { R / D84 } ] u*
cfs
ESTIMATION METHODS Bankfull VELOCITY
28.53 cfsn = 0.39*S 0.38 *R -0.16
2. Roughness Coefficient: u = 1.49*R 2/3 *S 1/2 / n4.65 ft / sec 61.63 cfs
2. Roughness Coefficient: u = 1.49*R 2/3 *S 1/2 / n 2.15 ft / sec
cfsChezy C
3. Other Methods (Hey, Darcy-Weisbach, Chezy C, etc.) 4.73 ft / sec 62.68 cfsDarcy-Weisbach (Leopold, Wolman and Miller)
3. Other Methods (Hey, Darcy-Weisbach, Chezy C, etc.) 0.00 ft / sec 0.00
4. Continuity Equations: b) USGS Gage Data u = Q / A
4. Continuity Equations: a) Regional Curves u = Q / A 0.00 ft / sec 0.00 cfsReturn Period for Bankfull Discharge
1. Friction Factor
Relative Roughness
Note: This equation is applicable to steep, step/pool, high boundary roughness, cobble- and boulder-dominated stream systems; i.e., for
Protrusion Height Options for the D84 Term in the Relative Roughness Relation (R/D84) – Estimation Method 1For sand-bed channels: Measure 100 "protrusion heights" of sand dunes from the downstream side of feature to the top of feature. Substitute the D84 sand dune protrusion height in ft for the D84 term in method 1.Option 1.
Option 2.
Option 3.
For boulder-dominated channels: Measure 100 "protrusion heights" of boulders on the sides from the bed elevation to the top of the rock on that side. Substitute the D84 boulder protrusion height in ft for the D84 term in method 1.
For bedrock-dominated channels: Measure 100 "protrusion heights" of rock separations, steps, joints or uplifted surfaces above channel bed elevation. Substitute the D84 bedrock protrusion height in ft for the D84 term in method 1.
For log-influenced channels: Measure "protrustion heights" proportionate to channel width of log diameters or the height of the log on upstream side if embedded. Substitute the D84 protrusion height in ft for the D84 term in method 1.Option 4.
Copyright © 2008 Wildland Hydrology River Stability Field Guide page 2-41

Plum Creek Stream Restoration: Project Summary and Design Report
U. S. Fish and Wildlife Service June 2015 Chesapeake Bay Field Office Page | L
APPENDIX L Sediment Transport Competency - Design

Worksheet 3-14. Sediment competence calculation form to assess bed stability.
Stream:
Location:
Observers: Date:
D 50
D 50
D max 68 (mm) 304.8 mm/ft
S
d
Range: 3 – 7 Use EQUATION 1: = 0.0834 ( ) –0.872
D max/D 50 Range: 1.3 – 3.0 Use EQUATION 2: = 0.0384 (D max/D 50) –0.887
Bankfull Dimensionless Shear Stress 2
d Required bankfull mean depth (ft) (use D max in ft)
S Required bankfull water surface slope (ft/ft) (use D max in ft)
Check: Stable Aggrading
Shields CO
26.07 70.15Shields CO
0.877 0.335Shields CO
1.76 0.67Shields CO
0.0201 0.0077Check: Stable Aggrading
11.427.5 Median particle size of riffle bed material (mm)
Median particle size of bar or sub-pavement sample (mm)
Existing bankfull water surface slope (ft/ft)
Largest particle from bar sample (ft)
Stream Type: C4
Enter Required Information for Existing Condition
2.40
Sediment Competence Using Dimensional Shear Stress
Calculate Bankfull Water Surface Slope Required for Entrainment of Largest Particle in Bar Sample
EQUATION USED:
Immersed specific gravity of sediment
0.008000.223
1.650.70
06/05/2015
Existing bankfull mean depth (ft)
Plum CreekReach upstream of pond VIIIValley Type:
Select the Appropriate Equation and Calculate Critical Dimensionless Shear Stress
Degrading
Calculate Bankfull Mean Depth Required for Entrainment of Largest Particle in Bar Sample
0.00904
0.79
0.017
2.47
Predicted slope required to initiate movement of measured D max (mm)
= predicted shear stress, = 62.4, d = existing depth
Predicted mean depth required to initiate movement of measured D max (mm)
= predicted shear stress, = 62.4, S = existing slope
Predicted largest moveable particle size (mm) at bankfull shear stress (Figure 3-11)
Predicted shear stress required to initiate movement of measured D max (mm) (Figure 3-11)
0.349
Degrading
Bankfull shear stress = dS (lbs/ft2) (substitute hydraulic radius, R, with mean depth, d )
= 62.4, d = existing depth, S = existing slope
SD
dmaxs 1)-(* γ
dD
Smaxs 1)-(* γ
5050/DD
Sd γ
dS γ
1s γ
5050/DD
Copyright © 2008 Wildland Hydrology River Stability Field Guide page 3-101
You created this PDF from an application that is not licensed to print to novaPDF printer (http://www.novapdf.com)

Plum Creek Stream Restoration: Project Summary and Design Report
U. S. Fish and Wildlife Service June 2015 Chesapeake Bay Field Office Page | M
APPENDIX M Planting Plan

FLOW
Existing NontidalWetland
U.S. Fish & Wildlife ServiceChesapeake Bay Field Office
Stream Habitat Assessment andRestoration Program
177 Admiral Cochrane DriveAnnapolis, Maryland 21401
Tel. (410) 573-4581
PROJECT MANAGER:MAS
DESIGN:MAS
DRAFTING: MAS
CHECKED BY:RRS
SCALE: AS SHOWN
REVISISIONS DATE BY
SHEET
16PP-1
21OFProfessional Certification
I hereby certify that these
document were prepared or
approved by me, and that I am a
duly licensed professional
engineer under the laws of the
State of Maryland,
License No. 20945,
Expiration Date: 2015-08-23.
U.S.FISH & WILDLIFE
SERVICE
DE
PA
R
T M E N T O F T H E I N T ER
I OR
PLUM CREEK PROJECTCECIL COUNTY, MD
PLANTING PLANSTANDARD DETAILS
0 20 40 60 80 100
Scale (feet):
DATE: 4/2/2014
Riparian Planting Area
Upland Planting Area
Legend

Plum Creek Stream Restoration: Project Summary and Design Report
U. S. Fish and Wildlife Service June 2015 Chesapeake Bay Field Office Page | N
APPENDIX N Assessment Review Checklist and Design Review Checklist

Project Design Checklist Reviewer:Date:
Project: Plum Creek Stream RestorationEngineer: Keith D. Moore (Frederick Seibert and Associates)
Submitted(Y/N)
Acceptable(Y/N) Page #
Plan Set
Report P.6
Report P.6
Report p.9 & Appendix E & K
Report P.10
Report P.10
Report P.10
N/A
Report P.20 & P.51
Report P.21 & P51
No
Report P.17
Report P.17
No
N/A
Report P.34
2.1g Did the sediment analysis show the potential for the stream channel and floodplain to aggrade or degrade after analyzing multiple discharges?
2.1h If the reach has a sediment supply, does the design state how it will be addressed?
2.1c Was SAM, HEC-RAS modelling or other tools used to determine stable channel and floodplain dimensions based on sediment transport and/or resistance to shear stress?
2.1d Was a sediment transport analysis completed upstream (supply) and within project reach using a range of sediment transport rates?
2.1 Sediment Transport2.1a Did the sediment transport analysis include an evaluation of sediment supply (i.e., sediment supply amount and source(s))?
2.1e Was sediment transport measured?
2.1f Were multiple discharges used to evaluate channel and floodplain stability?
NATURAL CHANNEL DESIGN REVIEW CHECKLIST
1.3 Bankfull Verification
1.2 Hydraulic Assessment
1.2b Was a hydraulic assessment completed?
1.2c Was stream velocity, shear stress and stream power shown in relation to stage and discharge?
1.1 Basemapping1.1a Does the project include basemapping?
1.2a Was the project drainage area provided?
1.3c If a regional curve was used, was the curve data representative of the project data?
2.1b Was a model used to calculate sediment transport described, including assumptions and applicability to project reach conditions?
1.3a Were bankfull verification analyses completed?1.3b Were USGS gages or regional curves used to validate bankfull discharge and area?
CommentsItem
1.0 Basemapping and Hydraulic Assessment
2.0 Preliminary Design
1.3d If gages or regional curves were not available, were other methods, such as hydrology and hydraulic models used?
Draft Natural Channel Design Review Checklist Page 1 of 3 September 9, 2014

Project Design Checklist Reviewer:Date:
Project: Plum Creek Stream RestorationEngineer: Keith D. Moore (Frederick Seibert and Associates)
Submitted(Y/N)
Acceptable(Y/N) Page # CommentsItem
Report P.33
Report P.29
Report P.32
Report P.39- 41
Report P.34
Report P.34
N/A
N/A
N/A
N/A
Plan Set
Plan Set
Plan Set
Plan Set
N/A
Report P.41
Plan Set
Report P.42
2.3c Are the design criteria appropriate given the site conditions and restoration potential?
2.2b Was the restoration potential based on the assessment data provided?
2.2a Does the project have clear goals and measurable objectives?
2.2c Was a restoration strategy developed and explained based on the restoration potential?
2.4b Were typical bankfull cross sections provided and developed within the design criteria?
3.1h Were specifications for materials and construction procedures provided and explained for the project (i.e., in-stream structures and erosion control measures)?
3.1c Do the proposed channel dimensions show the adjacent floodplain or flood prone area?
2.4c Were typical drawings of in-stream structures provided and their use and location explained?
2.4d Was a draft planting plan provided?
3.1g Will the project tie-ins have no change to upstream and downstream existing stability conditions?
3.1e If there is limited to no sediment supply, was an analysis done to show that the stream bed would not degrade during multiple flood flows?
3.1b Were proposed channel dimensions provided and developed within the design criteria?
3.1d Was a proposed channel profile provided and developed within the design criteria?
3.1f Did project constraints like right-of-ways or flood control requirements affect the width/depth/slope section? If so, was the risk of instability described?
2.4 Conceptual Design
3.1 Natural Channel Design3.0 Final Design
3.1a Was a proposed channel alignment provided and developed within the design criteria?
2.4e Overall Conceptual Design Comment(s)
2.3b Were multiple methods used to prepare design criteria?
2.4a Was the conceptual channel alignment provided and developed within the design criteria?
2.3a Were design criteria provided and explained?
2.3 Design Criteria
2.2 Goals and Restoration Potential
Draft Natural Channel Design Review Checklist Page 2 of 3 September 9, 2014

Project Design Checklist Reviewer:Date:
Project: Plum Creek Stream RestorationEngineer: Keith D. Moore (Frederick Seibert and Associates)
Submitted(Y/N)
Acceptable(Y/N) Page # CommentsItem
Report P.42
Report P.42
Report P.42
Report P.42
Report P.42
Plan Set
Plan Set
Report P.47
4.0c Does the project have a high potential for success?
3.2a Based on the assessment and design, were in-stream structures necessary for lateral stability?
4.0a Does the design address the project goals and objectives?
3.3a Was a vegetation design provided?3.3 Vegetation Design
3.3b Does the design address the use of permanent vegetation for long term stability?
4.0b Are there any design components that are missing or could adversely affect the success of the project?
3.2b Based on the assessment and design, were in-stream structures needed for vertical stability?
4.0 Overall Design Review
3.2e Were in-stream structures (or changes to geometry) needed to provide stability at tie-in locations with the existing channel?
3.2c If needed, was the reason for their location and use explained?
3.3c Overall Final Design Comment(s)
3.2f Were detail drawings provided for each type of in-stream structure?
3.2d Will the in-stream structures provide the intended stability?
3.2 In-Stream Structures
Draft Natural Channel Design Review Checklist Page 3 of 3 September 9, 2014