us economic briefing: high frequency indicators · us economic briefing: high frequency indicators...
TRANSCRIPT
US Economic Briefing:High Frequency Indicators
Yardeni Research, Inc.
January 14, 2014
Dr. Edward Yardeni516-972-7683
Mali Quintana480-664-1333
Please visit our sites atwww.yardeni.comblog.yardeni.com
thinking outside the box

Table Of Contents Table Of ContentsTable Of Contents
January 14, 2014 / US Economic Briefing: High Frequency Indicators www.yardeni.com
Yardeni Research, Inc.
Key Global Indicators 1Global Boom Bust Barometer 2US Leading Indicators 3ECRI 4Citigroup Economic Surprise Index 5US Unemployment Claims 6-7US Petroleum Usage 8US Electricity Output 9-10US Railcar Loadings 11-14US Federal Tax Receipts & Deposits 15US Business Credit 16MBA Mortgage Applications Survey 17US Commercial Paper 18US Liquid Assets 19-20US Profits Cycle 21-23Confidence, Boom Bust Barometer, S&P 500 24Gasoline Prices & Rig Count 25
95 96 97 98 99 00 01 02 03 04 05 06 07 08 09 10 11 12 13 14 15 1650
60
70
80
90
100
110
120
130
140
150
160
170
180
200
250
300
350
400
450
500
550
600
650
1/13
Oct
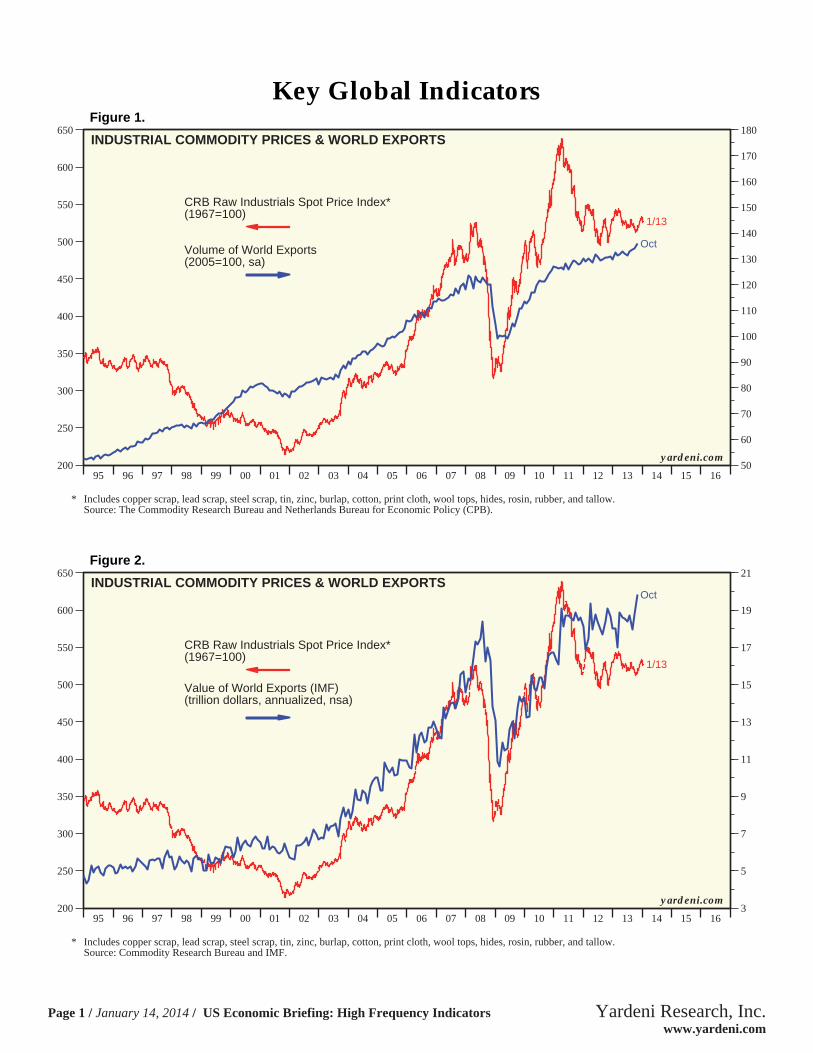
INDUSTRIAL COMMODITY PRICES & WORLD EXPORTS
CRB Raw Industrials Spot Price Index*(1967=100)
Volume of World Exports(2005=100, sa)
* Includes copper scrap, lead scrap, steel scrap, tin, zinc, burlap, cotton, print cloth, wool tops, hides, rosin, rubber, and tallow.Source: The Commodity Research Bureau and Netherlands Bureau for Economic Policy (CPB).
yardeni.com
Figure 1.
95 96 97 98 99 00 01 02 03 04 05 06 07 08 09 10 11 12 13 14 15 163
5
7
9
11
13
15
17
19
21
200
250
300
350
400
450
500
550
600
650
1/13
OctINDUSTRIAL COMMODITY PRICES & WORLD EXPORTS
CRB Raw Industrials Spot Price Index*(1967=100)
Value of World Exports (IMF)(trillion dollars, annualized, nsa)
Source: Commodity Research Bureau and IMF.* Includes copper scrap, lead scrap, steel scrap, tin, zinc, burlap, cotton, print cloth, wool tops, hides, rosin, rubber, and tallow.
yardeni.com
Figure 2.
Key Global Indicators
Page 1 / January 14, 2014 / US Economic Briefing: High Frequency Indicators www.yardeni.com
Yardeni Research, Inc.

2006 2007 2008 2009 2010 2011 2012 2013 201430
40
50
60
70
80
90
100
110
120
130
140
30
40
50
60
70
80
90
100
110
120
130
140
1/13
YRI GLOBAL GROWTH BAROMETER*
* Average of Brent crude oil and CRB raw industrials spot price index times 2 and divided by 10.Source: The Commodity Research Bureau and Haver Analytics.
yardeni.com
Figure 3.
2006 2007 2008 2009 2010 2011 2012 2013 201420
40
60
80
100
120
140
160
20
40
60
80
100
120
140
160
1/13
YRI GLOBAL GROWTH BAROMETER COMPONENTS
CRB Raw IndustrialsSpot Price Index*
Brent Crude Oil(dollars per barrel)
* Times 2 and divided by 10. Includes copper scrap, lead scrap, steel scrap, tin, zinc, burlap, cotton, print cloth, wool tops, hides, rosin, rubber, and tallow.Source: The Commodity Research Bureau and Haver Analytics.
yardeni.com
Figure 4.
Global Boom Bust Barometer
Page 2 / January 14, 2014 / US Economic Briefing: High Frequency Indicators www.yardeni.com
Yardeni Research, Inc.
73 75 77 79 81 83 85 87 89 91 93 95 97 99 01 03 05 07 09 11 13 15 1730
50
70
90
110
130
150
30
50
70
90
110
130
150
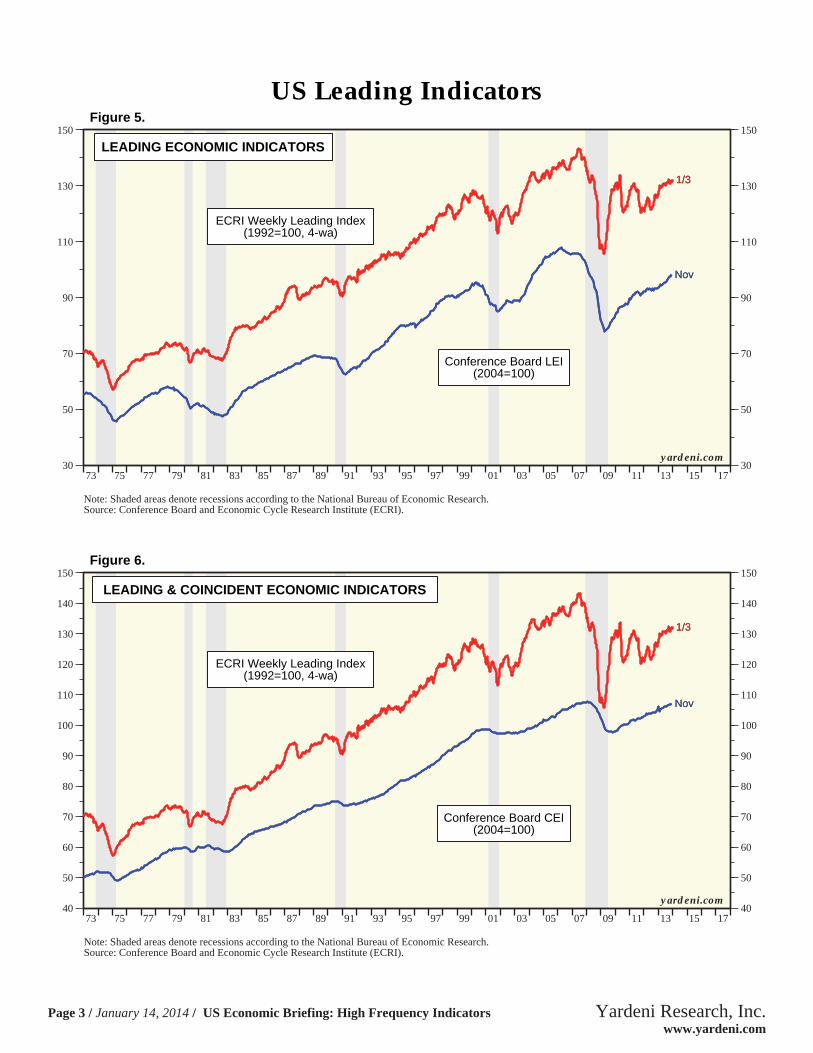
Conference Board LEI(2004=100)
Nov
LEADING ECONOMIC INDICATORS
ECRI Weekly Leading Index(1992=100, 4-wa)
1/31/3
Nov
Source: Conference Board and Economic Cycle Research Institute (ECRI).Note: Shaded areas denote recessions according to the National Bureau of Economic Research.
yardeni.com
Figure 5.
73 75 77 79 81 83 85 87 89 91 93 95 97 99 01 03 05 07 09 11 13 15 1740
50
60
70
80
90
100
110
120
130
140
150
40
50
60
70
80
90
100
110
120
130
140
150
Conference Board CEI(2004=100)
Nov
LEADING & COINCIDENT ECONOMIC INDICATORS
ECRI Weekly Leading Index(1992=100, 4-wa)
1/31/3
Nov
Source: Conference Board and Economic Cycle Research Institute (ECRI).Note: Shaded areas denote recessions according to the National Bureau of Economic Research.
yardeni.com
Figure 6.
US Leading Indicators
Page 3 / January 14, 2014 / US Economic Briefing: High Frequency Indicators www.yardeni.com
Yardeni Research, Inc.
1998 1999 2000 2001 2002 2003 2004 2005 2006 2007 2008 2009 2010 2011 2012 2013 2014 2015105
110
115
120
125
130
135
140
145
150
155
2200
2000
1800
1600
1400
1200
1000
800
600
400
200
0
-200
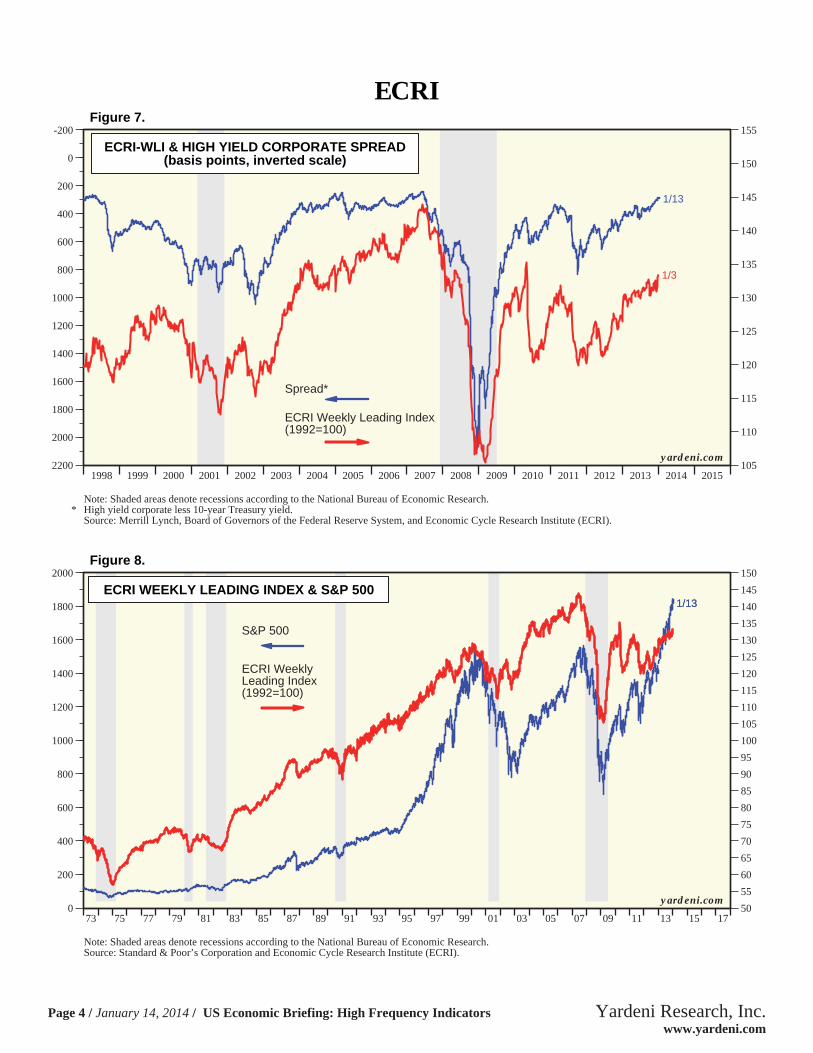
ECRI-WLI & HIGH YIELD CORPORATE SPREAD(basis points, inverted scale)
1/13
1/3
Spread*
ECRI Weekly Leading Index(1992=100)
Note: Shaded areas denote recessions according to the National Bureau of Economic Research.* High yield corporate less 10-year Treasury yield.
Source: Merrill Lynch, Board of Governors of the Federal Reserve System, and Economic Cycle Research Institute (ECRI).
yardeni.com
Figure 7.
73 75 77 79 81 83 85 87 89 91 93 95 97 99 01 03 05 07 09 11 13 15 1750
55
60
65
70
75
80
85
90
95
100
105
110
115
120
125
130
135
140
145
150
0
200
400
600
800
1000
1200
1400
1600
1800
2000
1/131/13ECRI WEEKLY LEADING INDEX & S&P 500
S&P 500
ECRI WeeklyLeading Index(1992=100)
Source: Standard & Poor’s Corporation and Economic Cycle Research Institute (ECRI).Note: Shaded areas denote recessions according to the National Bureau of Economic Research.
yardeni.com
Figure 8.
ECRI
Page 4 / January 14, 2014 / US Economic Briefing: High Frequency Indicators www.yardeni.com
Yardeni Research, Inc.
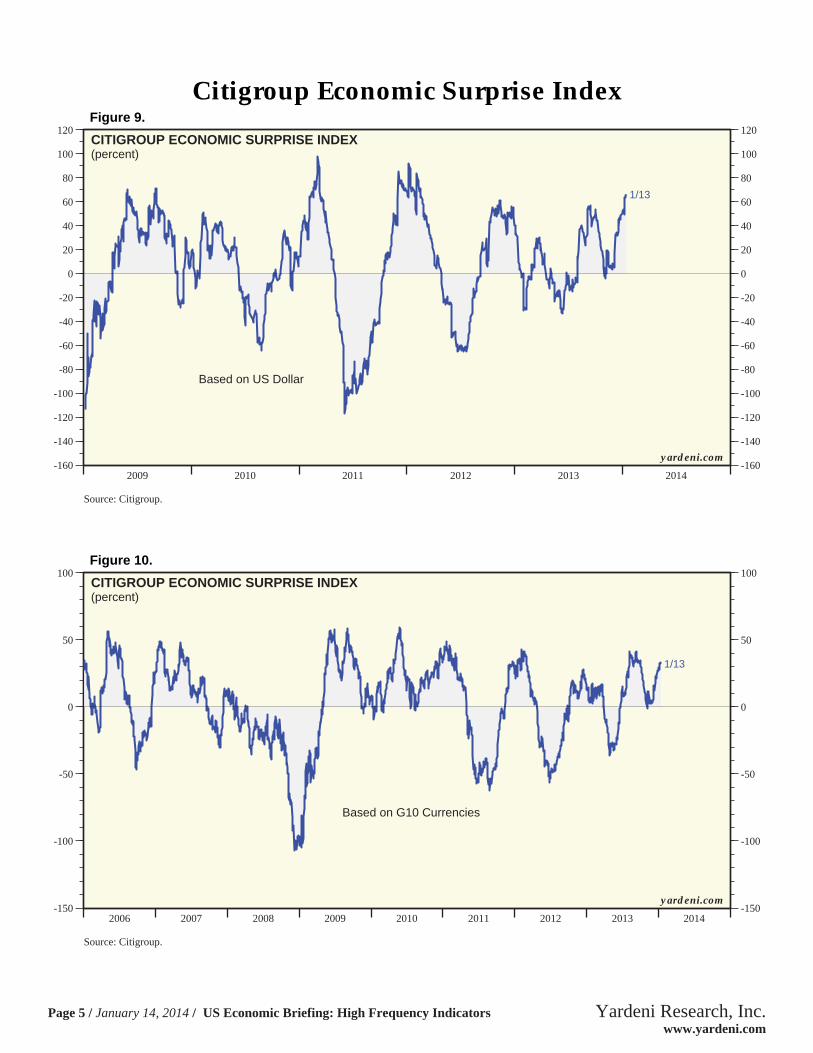
2009 2010 2011 2012 2013 2014-160
-140
-120
-100
-80
-60
-40
-20
0
20
40
60
80
100
120
-160
-140
-120
-100
-80
-60
-40
-20
0
20
40
60
80
100
120
1/13
CITIGROUP ECONOMIC SURPRISE INDEX(percent)
Based on US Dollar
yardeni.com
Source: Citigroup.
Figure 9.
2006 2007 2008 2009 2010 2011 2012 2013 2014-150
-100
-50
0
50
100
-150
-100
-50
0
50
100
1/13
CITIGROUP ECONOMIC SURPRISE INDEX(percent)
Based on G10 Currencies
yardeni.com
Source: Citigroup.
Figure 10.
Citigroup Economic Surprise Index
Page 5 / January 14, 2014 / US Economic Briefing: High Frequency Indicators www.yardeni.com
Yardeni Research, Inc.

73 75 77 79 81 83 85 87 89 91 93 95 97 99 01 03 05 07 09 11 13 15 17150
200
250
300
350
400
450
500
550
600
650
700
750
800
150
200
250
300
350
400
450
500
550
600
650
700
750
800
INITIAL UNEMPLOYMENT CLAIMS(thousands, sa)
1/4
Note: Shaded areas denote recessions according to the National Bureau of Economic Research.Source: US Department of Labor.
yardeni.com
Figure 11.
73 75 77 79 81 83 85 87 89 91 93 95 97 99 01 03 05 07 09 11 13 15 17150
200
250
300
350
400
450
500
550
600
650
700
750
800
150
200
250
300
350
400
450
500
550
600
650
700
750
800
INITIAL UNEMPLOYMENT CLAIMS(thousands, sa, four-week moving average)
1/4
Note: Shaded areas denote recessions according to the National Bureau of Economic Research.Source: US Department of Labor.
yardeni.com
Figure 12.
US Unemployment Claims
Page 6 / January 14, 2014 / US Economic Briefing: High Frequency Indicators www.yardeni.com
Yardeni Research, Inc.
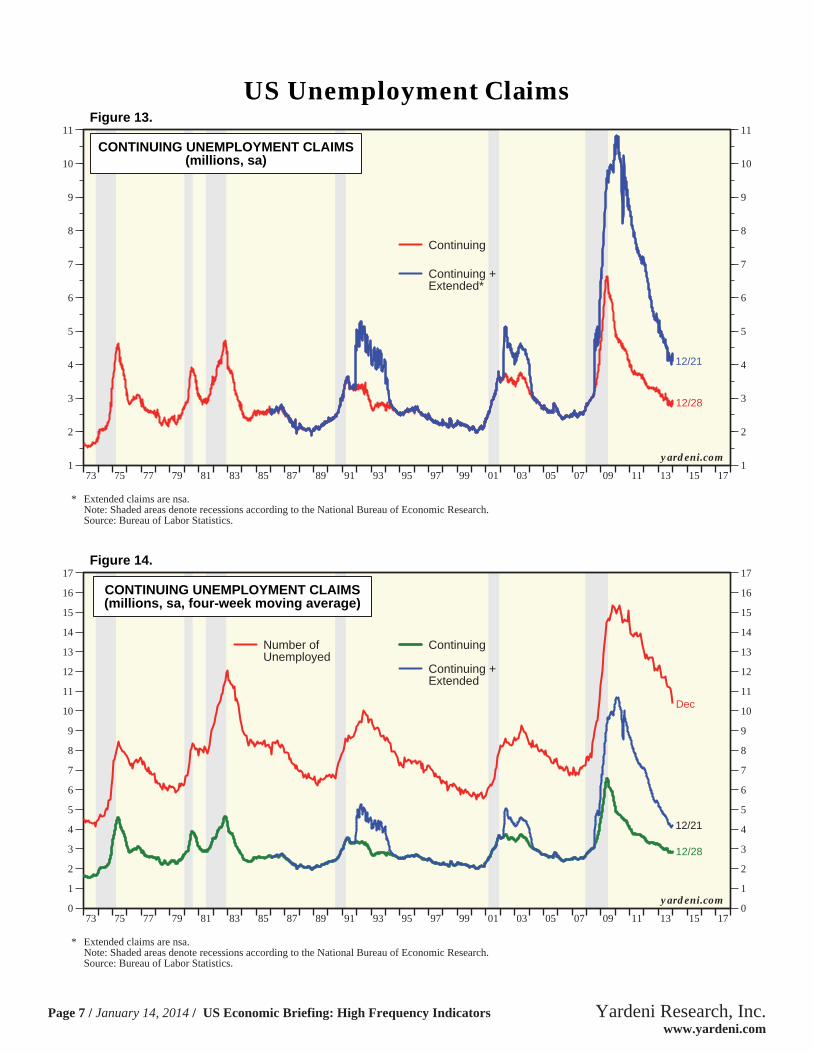
73 75 77 79 81 83 85 87 89 91 93 95 97 99 01 03 05 07 09 11 13 15 171
2
3
4
5
6
7
8
9
10
11
1
2
3
4
5
6
7
8
9
10
11
12/28
CONTINUING UNEMPLOYMENT CLAIMS(millions, sa)
12/21
Continuing +Extended*
Continuing
yardeni.com
Source: Bureau of Labor Statistics.Note: Shaded areas denote recessions according to the National Bureau of Economic Research.
* Extended claims are nsa.
Figure 13.
73 75 77 79 81 83 85 87 89 91 93 95 97 99 01 03 05 07 09 11 13 15 170
1
2
3
4
5
6
7
8
9
10
11
12
13
14
15
16
17
0
1
2
3
4
5
6
7
8
9
10
11
12
13
14
15
16
17
12/28
CONTINUING UNEMPLOYMENT CLAIMS(millions, sa, four-week moving average)
12/21
Dec
Number ofUnemployed
Continuing
Continuing +Extended
yardeni.com
Source: Bureau of Labor Statistics.Note: Shaded areas denote recessions according to the National Bureau of Economic Research.
* Extended claims are nsa.
Figure 14.
US Unemployment Claims
Page 7 / January 14, 2014 / US Economic Briefing: High Frequency Indicators www.yardeni.com
Yardeni Research, Inc.

91 92 93 94 95 96 97 98 99 00 01 02 03 04 05 06 07 08 09 10 11 12 13 14 15 1616
17
18
19
20
21
22
16
17
18
19
20
21
22
1/3
US PETROLEUM PRODUCTS SUPPLIED (USAGE)(million barrels per day, 52-week ma, sa)
Total (19.0)
* Includes motor gasoline, distillate fuel oils, and all other products.Source: US Department of Energy.
yardeni.com
Figure 15.
91 92 93 94 95 96 97 98 99 00 01 02 03 04 05 06 07 08 09 10 11 12 13 14 157.0
7.5
8.0
8.5
9.0
9.5
2.0
2.2
2.4
2.6
2.8
3.0
3.2
Oct
1/3
US MOTOR GASOLINE SUPPLIED vs. MILES TRAVELED
Gasoline Supplied(million barrels per day, 52-wa)
Vehicle Miles Traveled(trillion miles, 12-month sum)
Source: US Department of Energy.
yardeni.com
Figure 16.
US Petroleum Usage
Page 8 / January 14, 2014 / US Economic Briefing: High Frequency Indicators www.yardeni.com
Yardeni Research, Inc.

95 96 97 98 99 00 01 02 03 04 05 06 07 08 09 10 11 12 13 14 1560000
62000
64000
66000
68000
70000
72000
74000
76000
78000
80000
60000
62000
64000
66000
68000
70000
72000
74000
76000
78000
80000
1/4
US ELECTRIC UTILITY OUTPUT*(GW hours, 52-week moving average)
* Excluding Hawaii and Alaska.Source: Edison Electric Institute.
yardeni.com
Figure 17.
95 96 97 98 99 00 01 02 03 04 05 06 07 08 09 10 11 12 13 14 15-6
-4
-2
0
2
4
6
8
-6
-4
-2
0
2
4
6
8
1/4
Q3
US ELECTRIC UTILITY OUTPUT* vs. REAL GDP(yearly percent change)
Electric Utility Output(52-week moving average)
Real GDP
* Excluding Hawaii and Alaska.Source: Edison Electric Institute.
yardeni.com
Figure 18.
US Electricity Output
Page 9 / January 14, 2014 / US Economic Briefing: High Frequency Indicators www.yardeni.com
Yardeni Research, Inc.
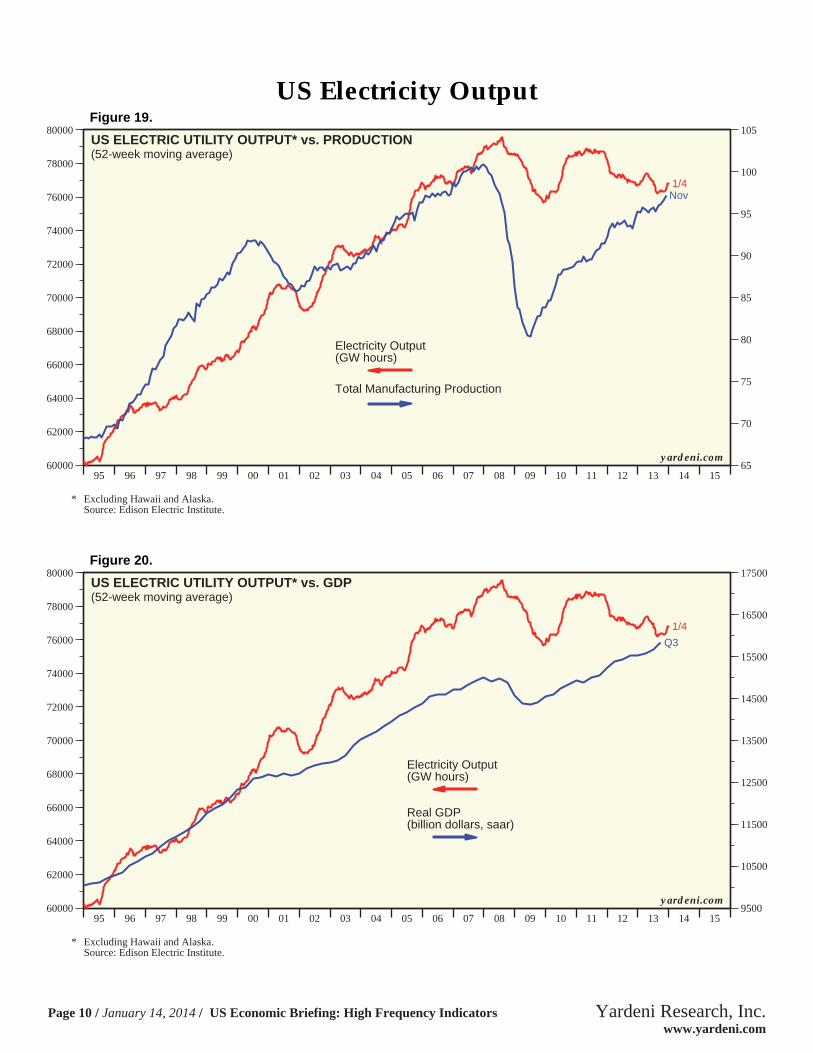
95 96 97 98 99 00 01 02 03 04 05 06 07 08 09 10 11 12 13 14 1565
70
75
80
85
90
95
100
105
60000
62000
64000
66000
68000
70000
72000
74000
76000
78000
80000
1/4Nov
US ELECTRIC UTILITY OUTPUT* vs. PRODUCTION(52-week moving average)
Electricity Output(GW hours)
Total Manufacturing Production
* Excluding Hawaii and Alaska.Source: Edison Electric Institute.
yardeni.com
Figure 19.
95 96 97 98 99 00 01 02 03 04 05 06 07 08 09 10 11 12 13 14 159500
10500
11500
12500
13500
14500
15500
16500
17500
60000
62000
64000
66000
68000
70000
72000
74000
76000
78000
80000
1/4
Q3
US ELECTRIC UTILITY OUTPUT* vs. GDP(52-week moving average)
Real GDP(billion dollars, saar)
Electricity Output(GW hours)
* Excluding Hawaii and Alaska.Source: Edison Electric Institute.
yardeni.com
Figure 20.
US Electricity Output
Page 10 / January 14, 2014 / US Economic Briefing: High Frequency Indicators www.yardeni.com
Yardeni Research, Inc.
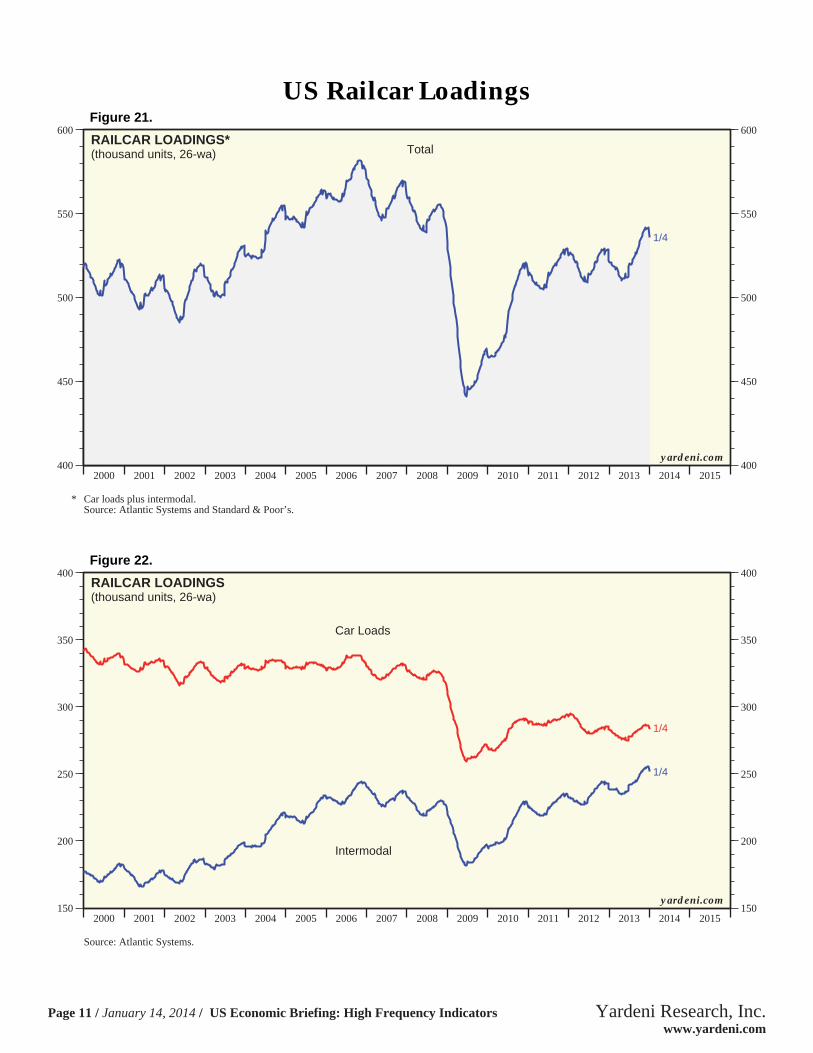
2000 2001 2002 2003 2004 2005 2006 2007 2008 2009 2010 2011 2012 2013 2014 2015400
450
500
550
600
400
450
500
550
600
1/4
RAILCAR LOADINGS*(thousand units, 26-wa) Total
Source: Atlantic Systems and Standard & Poor’s.* Car loads plus intermodal.
yardeni.com
Figure 21.
2000 2001 2002 2003 2004 2005 2006 2007 2008 2009 2010 2011 2012 2013 2014 2015150
200
250
300
350
400
150
200
250
300
350
400
1/4
1/4
RAILCAR LOADINGS(thousand units, 26-wa)
Car Loads
Intermodal
Source: Atlantic Systems.
yardeni.com
Figure 22.
US Railcar Loadings
Page 11 / January 14, 2014 / US Economic Briefing: High Frequency Indicators www.yardeni.com
Yardeni Research, Inc.

90 91 92 93 94 95 96 97 98 99 00 01 02 03 04 05 06 07 08 09 10 11 12 13 14 155
10
15
20
25
30
5
10
15
20
25
30
1/4
RAILCAR LOADINGS: MOTOR VEHICLES
Motor VehiclesLoadings(thousand units, 26-wa)
Sales(million units, saar)
Source: Atlantic Systems and Federal Reserve.
yardeni.com
Figure 23.
90 91 92 93 94 95 96 97 98 99 00 01 02 03 04 05 06 07 08 09 10 11 12 13 14 15200
500
800
1100
1400
1700
2000
2300
2600
2
3
4
5
6
7
1/4
RAILCAR LOADINGS: LUMBER & WOOD PRODUCTS
Lumber & Wood ProductsLoadings(thousand units, 26-wa, sa)
Housing Starts(thousand units, saar)
Source: Atlantic Systems.
yardeni.com
Figure 24.
US Railcar Loadings
Page 12 / January 14, 2014 / US Economic Briefing: High Frequency Indicators www.yardeni.com
Yardeni Research, Inc.

Figure 25.
90 92 94 96 98 00 02 04 06 08 10 12 14 16 18100
110
120
130
140
150
160
1/4
RAILCAR LOADINGS(thousand units, 26-wa)
Coal
90 92 94 96 98 00 02 04 06 08 10 12 14 16 183
4
5
6
7
8
9
10
11
12
1/4
Nonmetallic Minerals
90 92 94 96 98 00 02 04 06 08 10 12 14 16 1830
32
34
36
38
40
42
44
46
1/4Chemicals & PetroleumProducts
90 92 94 96 98 00 02 04 06 08 10 12 14 16 185
6
7
8
9
10
11
12
1/4
Pulp & PaperProducts
90 92 94 96 98 00 02 04 06 08 10 12 14 16 184
6
8
10
12
14
16
18
20
1/4
Metals & Products
Source: Atlantic Systems and American Trucking Association.
90 92 94 96 98 00 02 04 06 08 10 12 14 16 186
7
8
9
10
11
1/4
Waste & ScrapMaterials
yardeni.com
US Railcar Loadings
Page 13 / January 14, 2014 / US Economic Briefing: High Frequency Indicators www.yardeni.com
Yardeni Research, Inc.
2000 2001 2002 2003 2004 2005 2006 2007 2008 2009 2010 2011 2012 2013 2014 201595
100
105
110
115
120
125
130
135
110
130
150
170
190
210
230
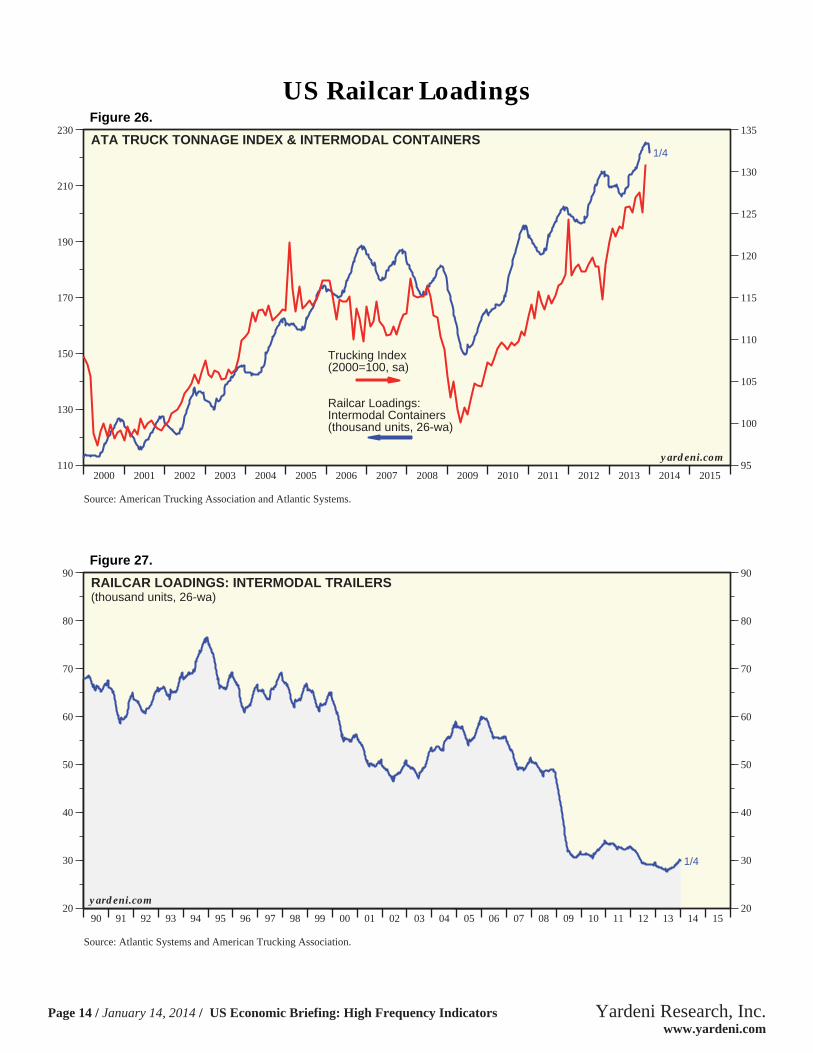
1/4ATA TRUCK TONNAGE INDEX & INTERMODAL CONTAINERS
Railcar Loadings:Intermodal Containers(thousand units, 26-wa)
Trucking Index(2000=100, sa)
Source: American Trucking Association and Atlantic Systems.
yardeni.com
Figure 26.
90 91 92 93 94 95 96 97 98 99 00 01 02 03 04 05 06 07 08 09 10 11 12 13 14 1520
30
40
50
60
70
80
90
20
30
40
50
60
70
80
90
1/4
RAILCAR LOADINGS: INTERMODAL TRAILERS(thousand units, 26-wa)
Source: Atlantic Systems and American Trucking Association.
yardeni.com
Figure 27.
US Railcar Loadings
Page 14 / January 14, 2014 / US Economic Briefing: High Frequency Indicators www.yardeni.com
Yardeni Research, Inc.
2004 2005 2006 2007 2008 2009 2010 2011 2012 2013 20141300
1400
1500
1600
1700
1800
1900
2000
2100
2200
2300
2400
1300
1400
1500
1600
1700
1800
1900
2000
2100
2200
2300
2400
Dec
1/10
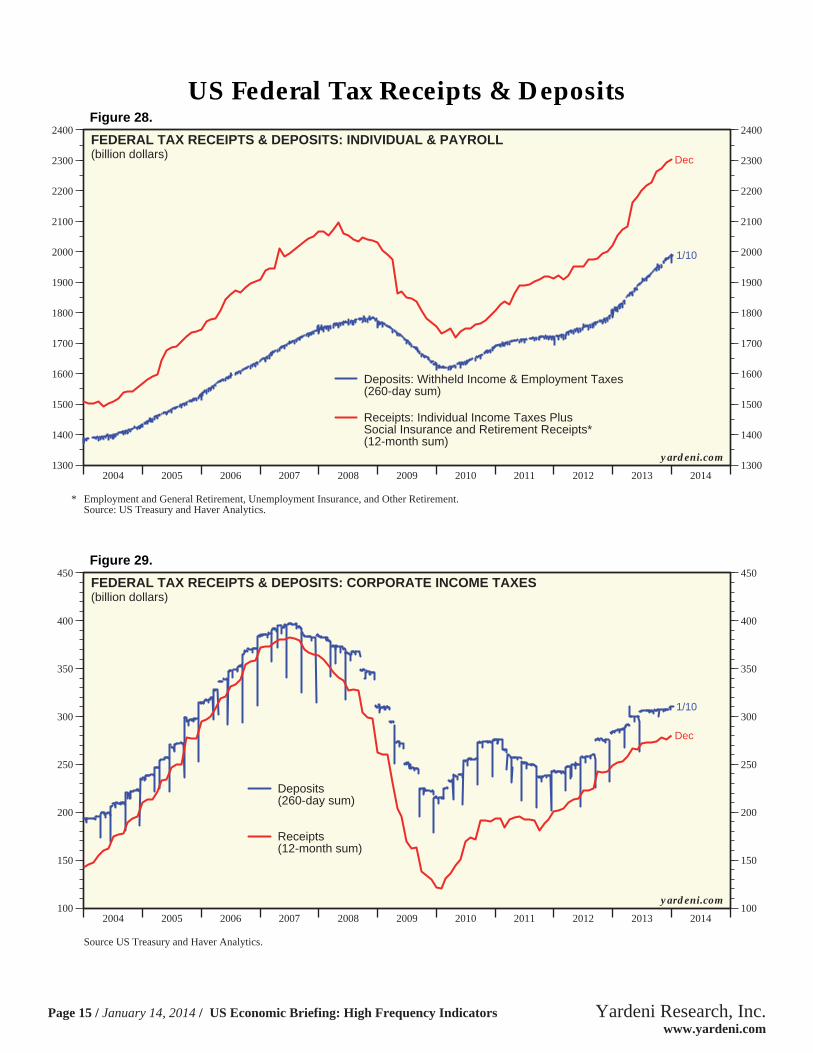
FEDERAL TAX RECEIPTS & DEPOSITS: INDIVIDUAL & PAYROLL(billion dollars)
Deposits: Withheld Income & Employment Taxes(260-day sum)
Receipts: Individual Income Taxes PlusSocial Insurance and Retirement Receipts*(12-month sum)
* Employment and General Retirement, Unemployment Insurance, and Other Retirement.Source: US Treasury and Haver Analytics.
yardeni.com
Figure 28.
2004 2005 2006 2007 2008 2009 2010 2011 2012 2013 2014100
150
200
250
300
350
400
450
100
150
200
250
300
350
400
450
1/10
Dec
FEDERAL TAX RECEIPTS & DEPOSITS: CORPORATE INCOME TAXES(billion dollars)
Deposits(260-day sum)
Receipts(12-month sum)
Source US Treasury and Haver Analytics.
yardeni.com
Figure 29.
US Federal Tax Receipts & Deposits
Page 15 / January 14, 2014 / US Economic Briefing: High Frequency Indicators www.yardeni.com
Yardeni Research, Inc.

82 83 84 85 86 87 88 89 90 91 92 93 94 95 96 97 98 99 00 01 02 03 04 05 06 07 08 09 10 11 12 13 14 15 16400
500
600
700
800
900
1000
1100
1200
1300
1400
1500
1600
1700
1800
1900
2000
400
500
600
700
800
900
1000
1100
1200
1300
1400
1500
1600
1700
1800
1900
2000
Oct
SHORT-TERM BUSINESS CREDIT & INVENTORIES(billion dollars)
1/1
C&I Loans PlusNonfinancialCommercial Paper(nsa)
Manufacturing & TradeInventories(sa)
Note: Shaded areas denote recessions according to the National Bureau of Economic Research.Source: Board of Governors of the Federal Reserve System and US Department of Commerce, Bureau of the Census.
yardeni.com
Figure 30.
575
775
975
1175
1375
1575
1775
575
775
975
1175
1375
1575
1775
1/1
90 91 92 93 94 95 96 97 98 99 00 01 02 03 04 05 06 07 08 09 10 11 12 13 14 15 1660
100
140
180
220
260
300
340
380
420
60
100
140
180
220
260
300
340
380
420
1/8
COMMERCIAL & INDUSTRIAL LOANS(billion dollars, nsa)
NONFINANCIAL COMMERCIAL PAPER(billion dollars, nsa)
Source: Board of Governors of the Federal Reserve System.
yardeni.com
Figure 31.
US Business Credit
Page 16 / January 14, 2014 / US Economic Briefing: High Frequency Indicators www.yardeni.com
Yardeni Research, Inc.
90 91 92 93 94 95 96 97 98 99 00 01 02 03 04 05 06 07 08 09 10 11 12 13 14 153
4
5
6
7
8
25
50
75
100
125
150
175
200
225
250
275
300
325
350
375
400
425
450
475
500
525
550
1/3
Nov
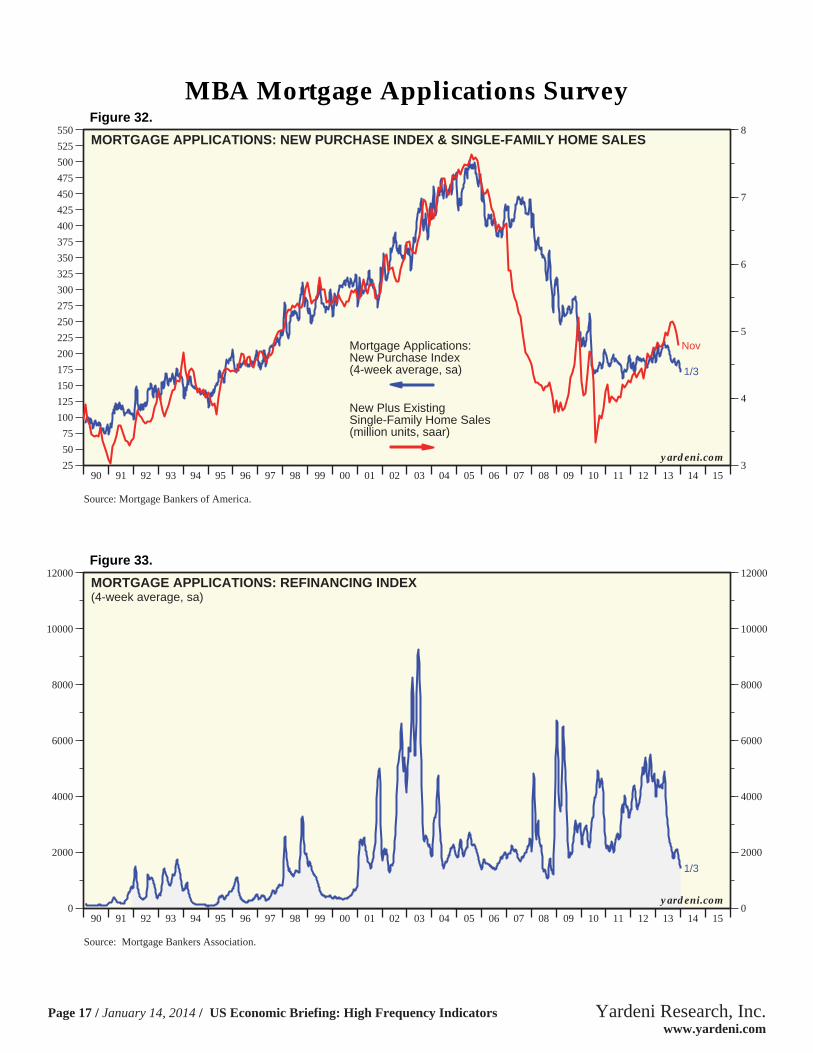
MORTGAGE APPLICATIONS: NEW PURCHASE INDEX & SINGLE-FAMILY HOME SALES
Mortgage Applications:New Purchase Index(4-week average, sa)
New Plus ExistingSingle-Family Home Sales(million units, saar)
Source: Mortgage Bankers of America.
yardeni.com
Figure 32.
90 91 92 93 94 95 96 97 98 99 00 01 02 03 04 05 06 07 08 09 10 11 12 13 14 150
2000
4000
6000
8000
10000
12000
0
2000
4000
6000
8000
10000
12000
1/3
MORTGAGE APPLICATIONS: REFINANCING INDEX(4-week average, sa)
Source: Mortgage Bankers Association.
yardeni.com
Figure 33.
MBA Mortgage Applications Survey
Page 17 / January 14, 2014 / US Economic Briefing: High Frequency Indicators www.yardeni.com
Yardeni Research, Inc.

Figure 34.
02 03 04 05 06 07 08 09 10 11 12 13 14 15800
1000
1200
1400
1600
1800
2000
2200
2400
1/8
COMMERCIAL PAPER OUTSTANDING(billion dollars, sa)
Total
02 03 04 05 06 07 08 09 10 11 12 13 14 150
100
200
300
400
500
600
700
1/8
Domestic Financial
Foreign Financial
Foreign Bank (nsa)
02 03 04 05 06 07 08 09 10 11 12 13 14 15150
250
350
450
550
650
750
850
950
1050
1150
1250
1/8
1/8
Asset Backed
Total Financial
Source: Board of Governors of the Federal Reserve System.
02 03 04 05 06 07 08 09 10 11 12 13 14 1575
100
125
150
175
200
225
250
275
1/8
Nonfinancial
yardeni.com
US Commercial Paper
Page 18 / January 14, 2014 / US Economic Briefing: High Frequency Indicators www.yardeni.com
Yardeni Research, Inc.
90 91 92 93 94 95 96 97 98 99 00 01 02 03 04 05 06 07 08 09 10 11 12 13 14 15 162500
3000
3500
4000
4500
5000
5500
6000
6500
7000
75008000850090009500100001050011000
2500
3000
3500
4000
4500
5000
5500
6000
6500
7000
75008000850090009500
100001050011000
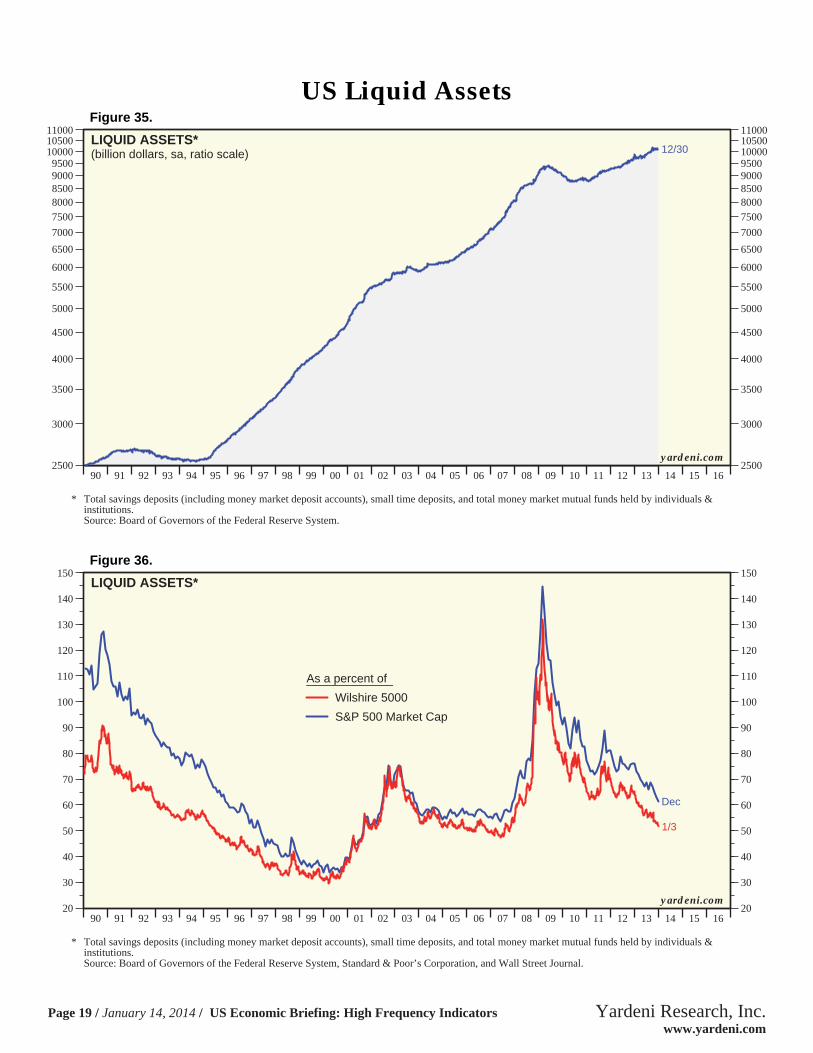
12/30LIQUID ASSETS*(billion dollars, sa, ratio scale)
* Total savings deposits (including money market deposit accounts), small time deposits, and total money market mutual funds held by individuals &institutions.Source: Board of Governors of the Federal Reserve System.
yardeni.com
Figure 35.
90 91 92 93 94 95 96 97 98 99 00 01 02 03 04 05 06 07 08 09 10 11 12 13 14 15 1620
30
40
50
60
70
80
90
100
110
120
130
140
150
20
30
40
50
60
70
80
90
100
110
120
130
140
150
Dec
1/3
LIQUID ASSETS*
As a percent of_____________
Wilshire 5000
S&P 500 Market Cap
* Total savings deposits (including money market deposit accounts), small time deposits, and total money market mutual funds held by individuals &institutions.Source: Board of Governors of the Federal Reserve System, Standard & Poor’s Corporation, and Wall Street Journal.
yardeni.com
Figure 36.
US Liquid Assets
Page 19 / January 14, 2014 / US Economic Briefing: High Frequency Indicators www.yardeni.com
Yardeni Research, Inc.
84 85 86 87 88 89 90 91 92 93 94 95 96 97 98 99 00 01 02 03 04 05 06 07 08 09 10 11 12 13 14 15 16100
500
900
1300
1700
2100
2500
2900
3300
3700
4100
4500
4900
5300
5700
6100
6500
6900
7300
7700
100
500
900
1300
1700
2100
2500
2900
3300
3700
4100
4500
4900
5300
5700
6100
6500
6900
7300
7700
12/30
12/30
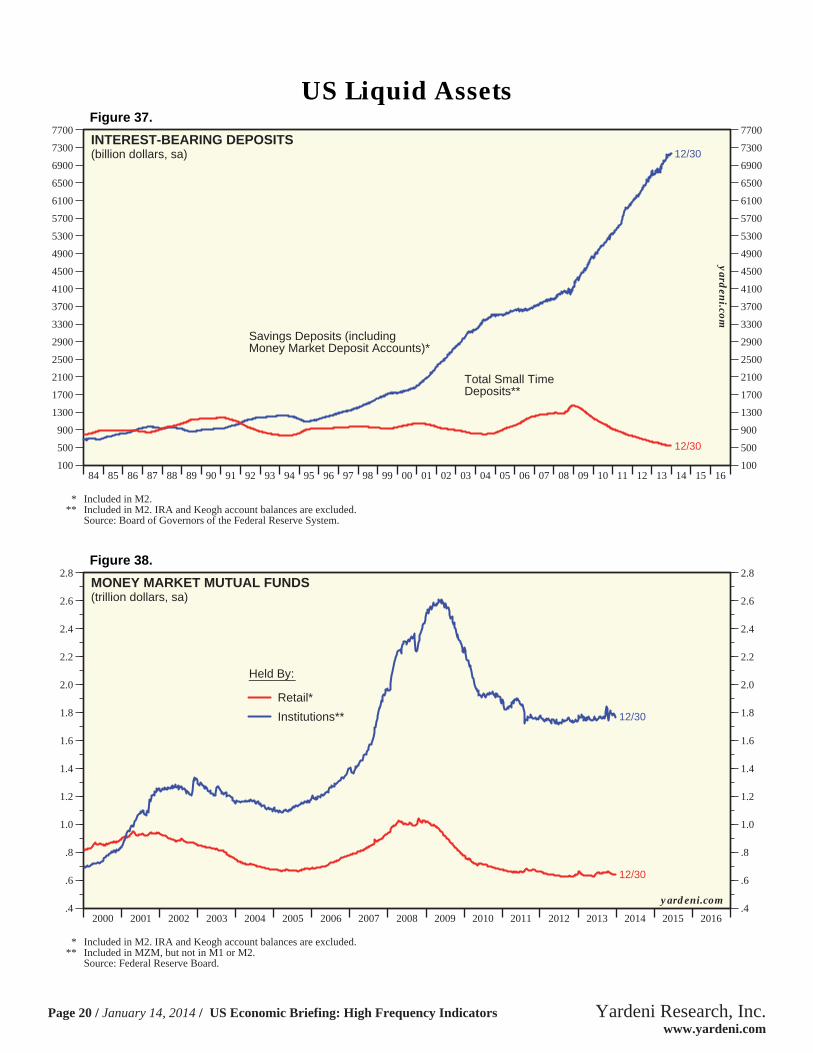
INTEREST-BEARING DEPOSITS(billion dollars, sa)
Savings Deposits (includingMoney Market Deposit Accounts)*
Total Small TimeDeposits**
Source: Board of Governors of the Federal Reserve System.
* Included in M2.** Included in M2. IRA and Keogh account balances are excluded.
yarden
i.com
Figure 37.
2000 2001 2002 2003 2004 2005 2006 2007 2008 2009 2010 2011 2012 2013 2014 2015 2016.4
.6
.8
1.0
1.2
1.4
1.6
1.8
2.0
2.2
2.4
2.6
2.8
.4
.6
.8
1.0
1.2
1.4
1.6
1.8
2.0
2.2
2.4
2.6
2.8
12/30
12/30
MONEY MARKET MUTUAL FUNDS(trillion dollars, sa)
Held By:_______
Retail*
Institutions**
* Included in M2. IRA and Keogh account balances are excluded.** Included in MZM, but not in M1 or M2.
Source: Federal Reserve Board.
yardeni.com
Figure 38.
US Liquid Assets
Page 20 / January 14, 2014 / US Economic Briefing: High Frequency Indicators www.yardeni.com
Yardeni Research, Inc.

80 81 82 83 84 85 86 87 88 89 90 91 92 93 94 95 96 97 98 99 00 01 02 03 04 05 06 07 08 09 10 11 12 13 14 15 16 17 180
10
20
30
40
50
60
70
80
90
100
110
120
130
50
60
70
80
90
100
110
120
130
Nov
1/9S&P 500 FORWARD EARNINGS & COINCIDENT ECONOMIC INDICATORS
US CoincidentEconomic Indicators(2004=100)
Forward Earnings*
* Time-weighted average of consensus operating earnings estimates for current and next year. Monthly through March 1994, weekly thereafter.Source: Thomson Reuters I/B/E/S and Conference Board.
yardeni.com
Figure 39.
80 82 84 86 88 90 92 94 96 98 00 02 04 06 08 10 12 14 16 18-60
-40
-20
0
20
40
60
-12
-8
-4
0
4
8
12
1/9
S&P 500 FORWARD EARNINGS & COINCIDENT ECONOMIC INDICATORS(yearly percent change)
US Coincident Economic Indicators
Forward Earnings*
* Time-weighted average of consensus operating earnings estimates for current and next year. Monthly through March 1994, weekly thereafter.Source: Thomson Reuters I/B/E/S and Conference Board.
yardeni.com
Figure 40.
US Profits Cycle
Page 21 / January 14, 2014 / US Economic Briefing: High Frequency Indicators www.yardeni.com
Yardeni Research, Inc.
95 96 97 98 99 00 01 02 03 04 05 06 07 08 09 10 11 12 13 14 15 16 17 1835
45
55
65
75
85
95
105
115
125
3.25
3.50
3.75
4.00
4.25
4.50
4.75
5.00
5.25
5.50
5.75
6.00
6.25
Nov
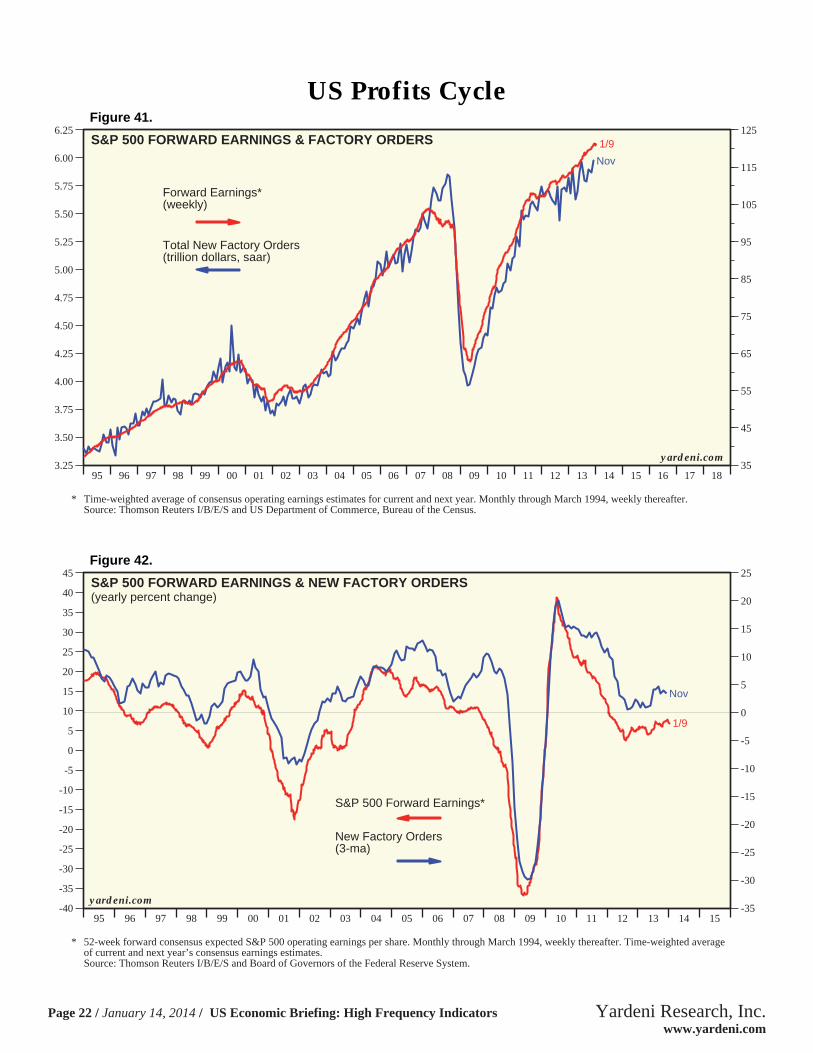
1/9S&P 500 FORWARD EARNINGS & FACTORY ORDERS
Total New Factory Orders(trillion dollars, saar)
Forward Earnings*(weekly)
* Time-weighted average of consensus operating earnings estimates for current and next year. Monthly through March 1994, weekly thereafter.Source: Thomson Reuters I/B/E/S and US Department of Commerce, Bureau of the Census.
yardeni.com
Figure 41.
95 96 97 98 99 00 01 02 03 04 05 06 07 08 09 10 11 12 13 14 15-35
-30
-25
-20
-15
-10
-5
0
5
10
15
20
25
-40
-35
-30
-25
-20
-15
-10
-5
0
5
10
15
20
25
30
35
40
45
1/9
Nov
S&P 500 FORWARD EARNINGS & NEW FACTORY ORDERS(yearly percent change)
S&P 500 Forward Earnings*
New Factory Orders(3-ma)
* 52-week forward consensus expected S&P 500 operating earnings per share. Monthly through March 1994, weekly thereafter. Time-weighted averageof current and next year’s consensus earnings estimates.Source: Thomson Reuters I/B/E/S and Board of Governors of the Federal Reserve System.
yardeni.com
Figure 42.
US Profits Cycle
Page 22 / January 14, 2014 / US Economic Briefing: High Frequency Indicators www.yardeni.com
Yardeni Research, Inc.
80 82 84 86 88 90 92 94 96 98 00 02 04 06 08 10 12 14 16 18-40
-30
-20
-10
0
10
20
30
40
50
-20
-15
-10
-5
0
5
10
15
20
Nov
1/9
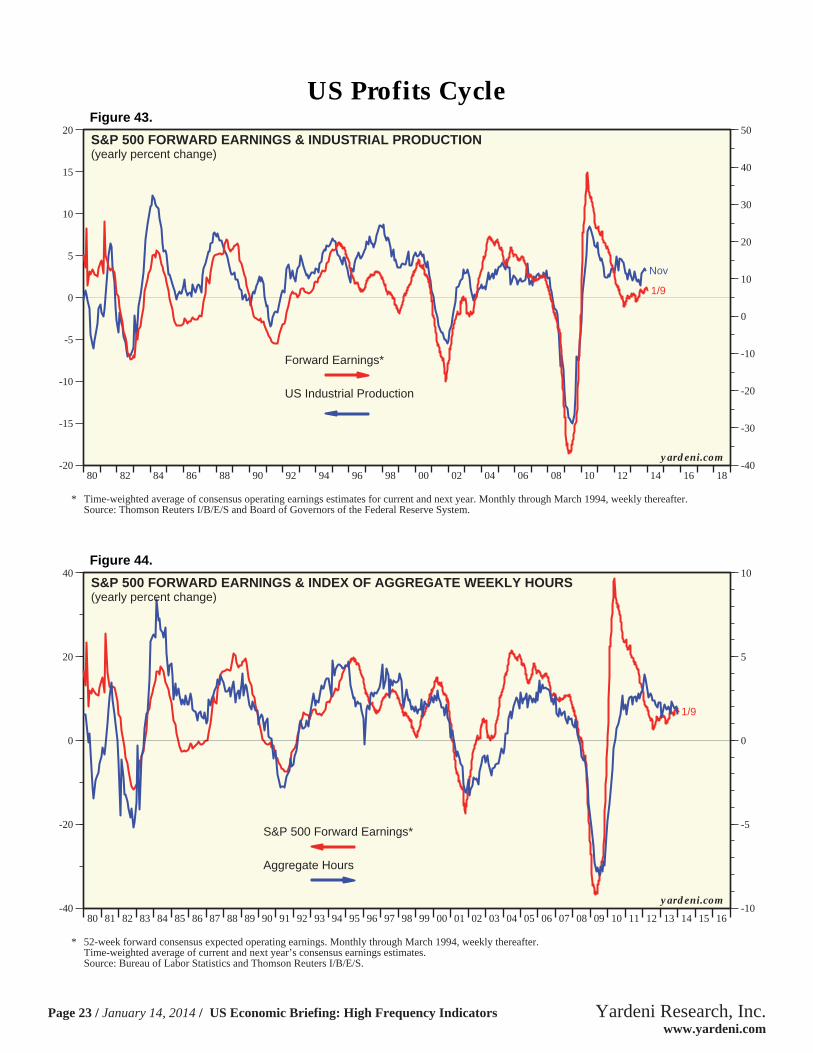
S&P 500 FORWARD EARNINGS & INDUSTRIAL PRODUCTION(yearly percent change)
Forward Earnings*
US Industrial Production
* Time-weighted average of consensus operating earnings estimates for current and next year. Monthly through March 1994, weekly thereafter.Source: Thomson Reuters I/B/E/S and Board of Governors of the Federal Reserve System.
yardeni.com
Figure 43.
80 81 82 83 84 85 86 87 88 89 90 91 92 93 94 95 96 97 98 99 00 01 02 03 04 05 06 07 08 09 10 11 12 13 14 15 16-10
-5
0
5
10
-40
-20
0
20
40
1/9
S&P 500 FORWARD EARNINGS & INDEX OF AGGREGATE WEEKLY HOURS(yearly percent change)
Aggregate Hours
S&P 500 Forward Earnings*
* 52-week forward consensus expected operating earnings. Monthly through March 1994, weekly thereafter. Time-weighted average of current and next year’s consensus earnings estimates.Source: Bureau of Labor Statistics and Thomson Reuters I/B/E/S.
yardeni.com
Figure 44.
US Profits Cycle
Page 23 / January 14, 2014 / US Economic Briefing: High Frequency Indicators www.yardeni.com
Yardeni Research, Inc.
2000 2001 2002 2003 2004 2005 2006 2007 2008 2009 2010 2011 2012 2013 2014 201540
60
80
100
120
140
160
180
40
60
80
100
120
140
160
180
1/4
1/4
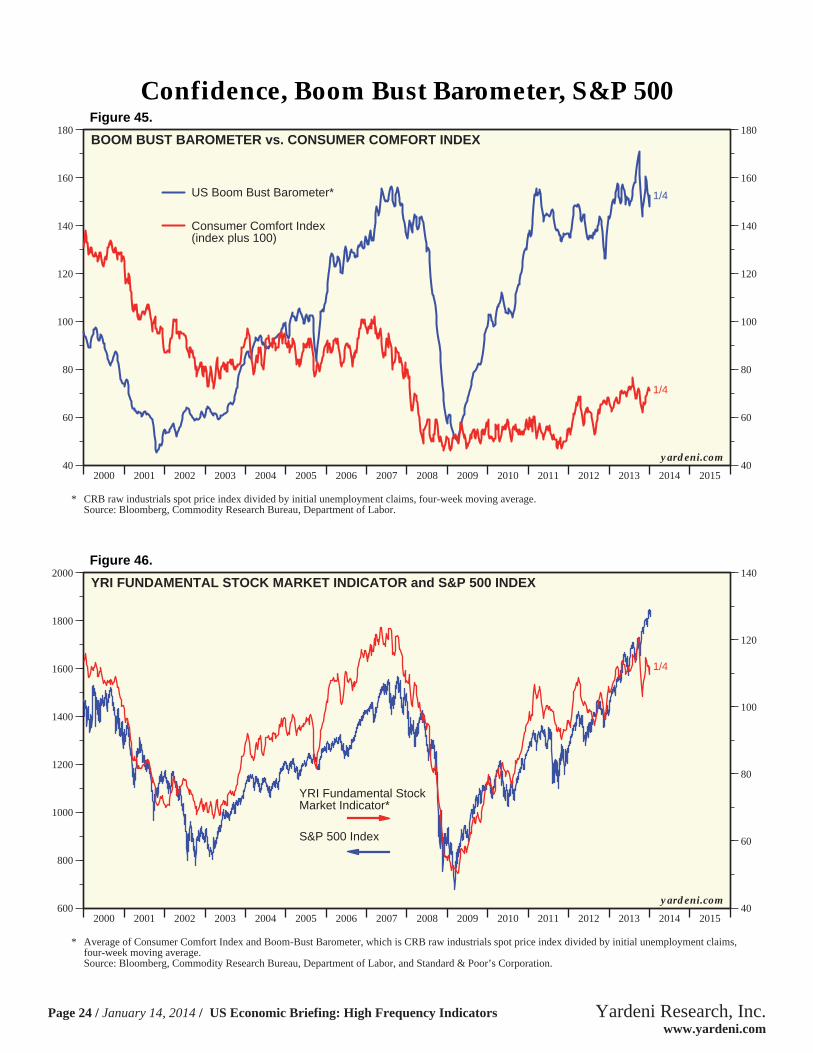
BOOM BUST BAROMETER vs. CONSUMER COMFORT INDEX
US Boom Bust Barometer*
Consumer Comfort Index(index plus 100)
* CRB raw industrials spot price index divided by initial unemployment claims, four-week moving average.Source: Bloomberg, Commodity Research Bureau, Department of Labor.
yardeni.com
Figure 45.
2000 2001 2002 2003 2004 2005 2006 2007 2008 2009 2010 2011 2012 2013 2014 201540
60
80
100
120
140
600
800
1000
1200
1400
1600
1800
2000
1/4
YRI FUNDAMENTAL STOCK MARKET INDICATOR and S&P 500 INDEX
S&P 500 Index
YRI Fundamental StockMarket Indicator*
* Average of Consumer Comfort Index and Boom-Bust Barometer, which is CRB raw industrials spot price index divided by initial unemployment claims,four-week moving average.Source: Bloomberg, Commodity Research Bureau, Department of Labor, and Standard & Poor’s Corporation.
yardeni.com
Figure 46.
Confidence, Boom Bust Barometer, S&P 500
Page 24 / January 14, 2014 / US Economic Briefing: High Frequency Indicators www.yardeni.com
Yardeni Research, Inc.
2006 2007 2008 2009 2010 2011 2012 2013 2014.6
.8
1.0
1.2
1.4
1.6
1.8
2.0
2.2
2.4
2.6
2.8
3.0
3.2
3.4
3.6
3.8
4.0
4.2
.6
.8
1.0
1.2
1.4
1.6
1.8
2.0
2.2
2.4
2.6
2.8
3.0
3.2
3.4
3.6
3.8
4.0
4.2
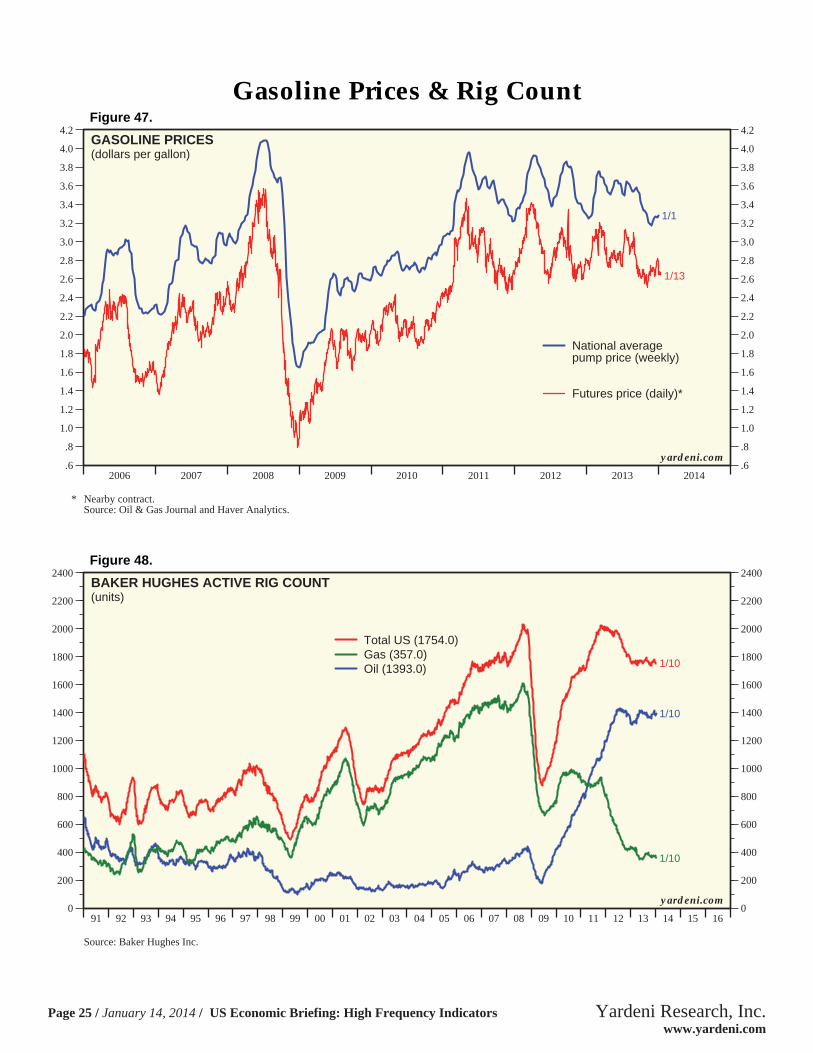
1/1
1/13
GASOLINE PRICES(dollars per gallon)
National averagepump price (weekly)
Futures price (daily)*
* Nearby contract.Source: Oil & Gas Journal and Haver Analytics.
yardeni.com
Figure 47.
91 92 93 94 95 96 97 98 99 00 01 02 03 04 05 06 07 08 09 10 11 12 13 14 15 160
200
400
600
800
1000
1200
1400
1600
1800
2000
2200
2400
0
200
400
600
800
1000
1200
1400
1600
1800
2000
2200
2400
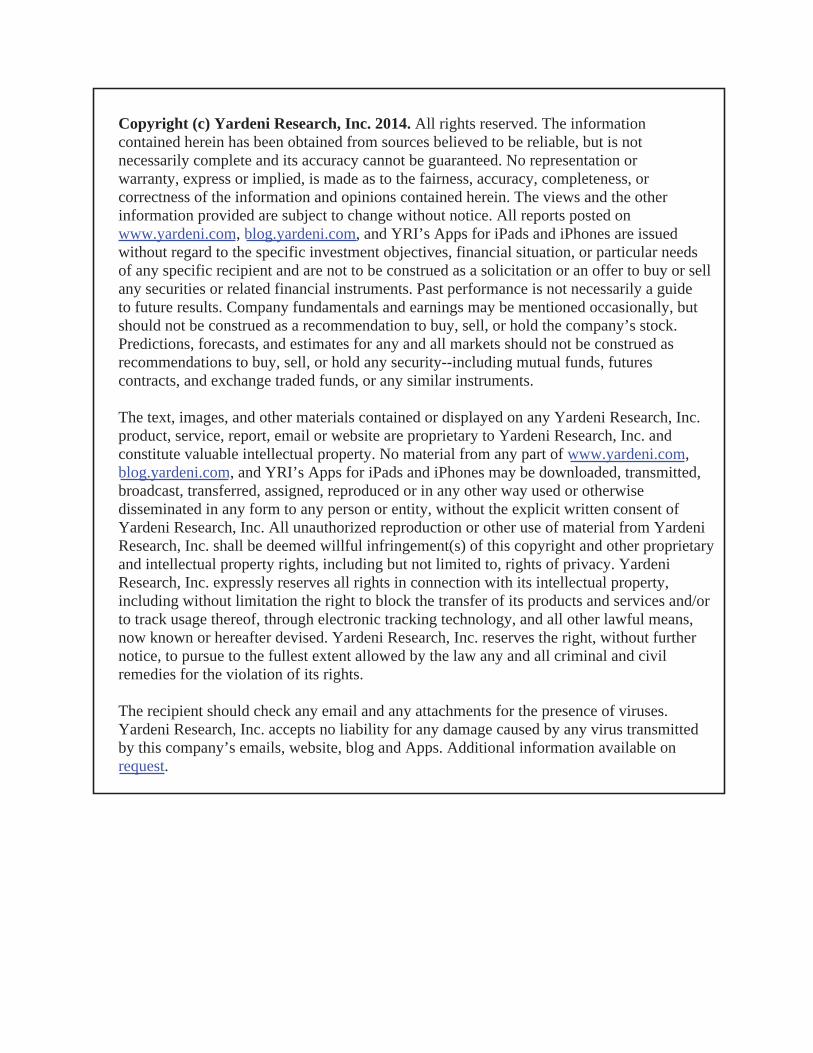
1/10
1/10
1/10
BAKER HUGHES ACTIVE RIG COUNT(units)
Total US (1754.0)Gas (357.0)Oil (1393.0)
Source: Baker Hughes Inc.
yardeni.com
Figure 48.
Gasoline Prices & Rig Count
Page 25 / January 14, 2014 / US Economic Briefing: High Frequency Indicators www.yardeni.com
Yardeni Research, Inc.
http://blog.yardeni.com
http://blog.yardeni.com
Copyright (c) Yardeni Research, Inc. 2014. All rights reserved. The informationcontained herein has been obtained from sources believed to be reliable, but is notnecessarily complete and its accuracy cannot be guaranteed. No representation orwarranty, express or implied, is made as to the fairness, accuracy, completeness, orcorrectness of the information and opinions contained herein. The views and the otherinformation provided are subject to change without notice. All reports posted onwww.yardeni.com, blog.yardeni.com, and YRI’s Apps for iPads and iPhones are issuedwithout regard to the specific investment objectives, financial situation, or particular needsof any specific recipient and are not to be construed as a solicitation or an offer to buy or sellany securities or related financial instruments. Past performance is not necessarily a guideto future results. Company fundamentals and earnings may be mentioned occasionally, butshould not be construed as a recommendation to buy, sell, or hold the company’s stock.Predictions, forecasts, and estimates for any and all markets should not be construed asrecommendations to buy, sell, or hold any security--including mutual funds, futurescontracts, and exchange traded funds, or any similar instruments.
The text, images, and other materials contained or displayed on any Yardeni Research, Inc.product, service, report, email or website are proprietary to Yardeni Research, Inc. andconstitute valuable intellectual property. No material from any part of www.yardeni.com, blog.yardeni.com, and YRI’s Apps for iPads and iPhones may be downloaded, transmitted,broadcast, transferred, assigned, reproduced or in any other way used or otherwisedisseminated in any form to any person or entity, without the explicit written consent ofYardeni Research, Inc. All unauthorized reproduction or other use of material from YardeniResearch, Inc. shall be deemed willful infringement(s) of this copyright and other proprietaryand intellectual property rights, including but not limited to, rights of privacy. YardeniResearch, Inc. expressly reserves all rights in connection with its intellectual property,including without limitation the right to block the transfer of its products and services and/orto track usage thereof, through electronic tracking technology, and all other lawful means,now known or hereafter devised. Yardeni Research, Inc. reserves the right, without furthernotice, to pursue to the fullest extent allowed by the law any and all criminal and civilremedies for the violation of its rights.
The recipient should check any email and any attachments for the presence of viruses.Yardeni Research, Inc. accepts no liability for any damage caused by any virus transmittedby this company’s emails, website, blog and Apps. Additional information available onrequest.