u.s. consumers’ willingness to pay for food labeled...
TRANSCRIPT
U.S. Consumers’ Willingness to Pay for Food Labeled ‘Genetically Modified’ Benjamin Onyango, Rodolfo M. Nayga, Jr., and Ramu Govindasamy This study analyzes U.S. consumers’ choice of cornflakes under five different labeling
statements. Using a nationwide survey and choice modeling framework, results indicate that consumers value labeling statements differently, depending on the information contained on the label. The random parameter logit model results indicated that, compared to cornflakes that have no label information, cornflakes labeled “contains no genetically modified corn” have a value of 10 percent more, the label “USDA approved genetically modified corn” has a value of 5 percent more, and the label “corn genetically modified to reduce pesticide residues in your food” has a value of 5 percent more. The results also suggest that consumers nega-tively valued the label “contains genetically modified corn,” paying 6.5 percent less, and the label “may contain genetically modified corn,” paying 1 percent less than the product that has no label information.
Key Words: genetically modified foods, labeling genetically modified foods, random parame-
ter logit model Labeling of genetically modified (GM) foods remains a contentious issue. To date, there is no conclusive research on how GM food products should be labeled or if consumers in the United States would value such labeling information. Globally, countries are grappling to form a con-sensus on a harmonized, internationally accept-able system. However, given the influence of economic and political structures in various countries, it is more likely that we will see differ-ent labeling requirements in different regions or countries. For example, in the European Union (EU), regulations related to mandatory labeling of GM foods are already in place. In contrast, the United States has no mandatory labeling require-ments pertaining to GM foods. Evidence from public polls in the United States and elsewhere shows overwhelming support for labeling of GM foods. A recent national survey showed that 94 percent of U.S. consumers agree that food containing GM ingredients should be
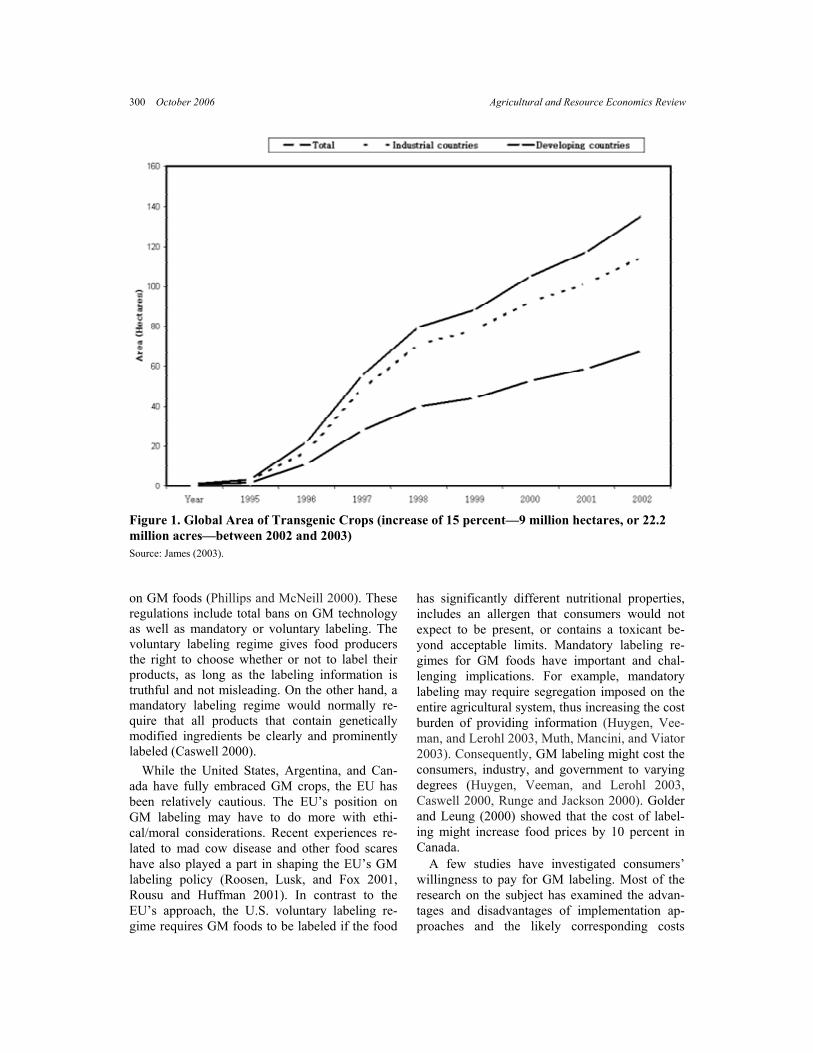
labeled. Similar consumer surveys in France, Germany, and the United Kingdom suggest that about 90 percent of consumers would opt for mandatory labeling of beef produced from cattle fed on genetically modified crops (Hallman et al. 2003, 2004; Roosen, Lusk, and Fox 2001). It is possible that the clamor for labeling regulations arises from the public mistrust of GM food prod-ucts. A study conducted by Hallman et al. (2004) showed that about 70 percent of the American public do not know that GM foods are tested for human safety, and that about three-quarters (76 percent) do not know that GM foods are tested for environmental safety. While disagreements on a harmonized GM la-beling policy persist, adoption of genetically modi-fied crops worldwide is increasing (Figure 1). To date, 20 percent of global soybean, corn, cotton, and canola acreage is genetically modified. The leaders in the production of these GM crops are the United States, Argentina, Canada, and China (James 2003, Pew Initiative on Food and Biotech-nology 2004). Due to increasing acreage allocated to GM crops in the United States, estimates sug-gest that between 60 and 70 percent of processed foods in U.S. supermarkets now include at least a fragment of a GM ingredient.
_________________________________________
Benjamin Onyango is Research Associate in the Food Policy Institute at Rutgers University, New Brunswick, New Jersey. Rodolfo M. Nayga, Jr., is Professor in the Department of Agricultural Economics at Texas A&M University, College Station, Texas. Ramu Govindasamy is Associate Professor in the Department of Agricultural, Food, and Re-source Economics at Rutgers University, New Brunswick, New Jersey. The authors thank anonymous journal reviewers and the editors for helpful comments and suggestions.
As of August 2001, 28 countries worldwide had passed some form of regulatory framework
Agricultural and Resource Economics Review 35/2 (October 2006) 299–310 Copyright 2006 Northeastern Agricultural and Resource Economics Association
300 October 2006 Agricultural and Resource Economics Review
Figure 1. Global Area of Transgenic Crops (increase of 15 percent—9 million hectares, or 22.2 million acres—between 2002 and 2003) Source: James (2003). on GM foods (Phillips and McNeill 2000). These regulations include total bans on GM technology as well as mandatory or voluntary labeling. The voluntary labeling regime gives food producers the right to choose whether or not to label their products, as long as the labeling information is truthful and not misleading. On the other hand, a mandatory labeling regime would normally re-quire that all products that contain genetically modified ingredients be clearly and prominently labeled (Caswell 2000). While the United States, Argentina, and Can-ada have fully embraced GM crops, the EU has been relatively cautious. The EU’s position on GM labeling may have to do more with ethi-cal/moral considerations. Recent experiences re-lated to mad cow disease and other food scares have also played a part in shaping the EU’s GM labeling policy (Roosen, Lusk, and Fox 2001, Rousu and Huffman 2001). In contrast to the EU’s approach, the U.S. voluntary labeling re-gime requires GM foods to be labeled if the food
has significantly different nutritional properties, includes an allergen that consumers would not expect to be present, or contains a toxicant be-yond acceptable limits. Mandatory labeling re-gimes for GM foods have important and chal-lenging implications. For example, mandatory labeling may require segregation imposed on the entire agricultural system, thus increasing the cost burden of providing information (Huygen, Vee-man, and Lerohl 2003, Muth, Mancini, and Viator 2003). Consequently, GM labeling might cost the consumers, industry, and government to varying degrees (Huygen, Veeman, and Lerohl 2003, Caswell 2000, Runge and Jackson 2000). Golder and Leung (2000) showed that the cost of label-ing might increase food prices by 10 percent in Canada. A few studies have investigated consumers’ willingness to pay for GM labeling. Most of the research on the subject has examined the advan-tages and disadvantages of implementation ap-proaches and the likely corresponding costs
Onyango et al. U.S. Consumers’ Willingness to Pay for Food Labeled ‘Genetically Modified’ 301
(Huygen, Veeman, and Lerohl 2003). In particu-lar, support and opposition to mandatory or vol-untary labeling regimes have been popular sub-jects of study (Rousu et al. 2004; Caswell 1998, 2000; Carter and Gruère 2003). Also investigated were topics relating to asymmetric information impacts on producers, government, and industry, as well as topics on label information prioritiza-tion (Huffman 2003, Fulton and Giannakas 2004, McCluskey and Loureiro 2003, Senhui, Fletcher, and Rimal 2003, Golan, Kuchler, and Mitchell 2000). Other studies have focused on language and label positioning (Hallman, Aquino, and Phillips 2003). A recent study by Carlsson, Fryk-blom, and Lagerkvist (2004) measured willing-ness to pay for mandatory labeling, voluntary labeling, or total bans of GM beef, pork, and eggs in Sweden. The findings of this study showed that GM foods can be a credence good that may cause market failure. Additionally, the study found that consumers are willing to pay a significantly higher product price to ensure a total ban on the use of GM food in animal fodder. None of these studies, however, has investi-gated the effect of GM label statements on con-sumer behavior. Findings from recent focus group studies in the United States and research on GM labels in Canada have suggested that the wording on labels could have a significant effect on con-sumer understanding and acceptance of biotech-nology (Hallman, Aquino, and Phillips 2003, Hu, Veeman, and Adamowicz 2005). There also are concerns as to whether consumers would use such labels (Li, McCluskey, and Wahl 2004, Teisl et al. 2003). To fill this void, this study assesses consumers’ choice of cornflakes under different GM label wording. In particular, this study contributes to the ongoing debate by assessing consumers’ willingness to pay (WTP) for information pro-vided by a GM label. In the following sections, we will discuss the survey methods, the empirical model, results, and conclusions. Survey Methods A survey instrument developed by the Food Pol-icy Institute at Rutgers University was used to collect data for this study. The survey collected information on core questions related to Ameri-
can awareness and knowledge of GM foods, willingness to purchase GM products, attitudes toward risks and benefits, opinions on mandatory product labeling, and overall approval of the transgenic technique as it relates to animal and plant biotechnology. The Food Policy Institute contracted the opinion polling firm Shulman, Ronca, and Bucuvalas, Inc., to conduct 1,201 tele-phone interviews using computer-assisted tele-phone interview (CATI) technology. Interviewers were consistently monitored throughout the field period. The interviews were conducted between May 4, 2004, and June 14, 2004.1 To reduce interview time, the survey was split into two versions. The two versions shared core questions, but included different supple-mental questions. Version A had 601 respondents and an average interview time of 19.5 minutes, and Version B had 600 respondents and an aver-age interview time of 21.9 minutes. All inter-views were conducted in English. Potential re-spondents were selected using national random digit dialing across the entire United States. U.S. Census Bureau population estimates determined the distribution necessary for proportionate geo-graphic coverage. Appropriate weighting on age, gender, and race was done to correct for dispro-portionate representation. The CATI program guided a random but bal-anced selection process to ensure that a represen-tative number of males and females were inter-viewed. The CATI program is designed to work with the random sample already selected. To en-sure representation in the interviewing process, the program makes reference to the number of males and females interviewed thus far and re-vises the next line of interviewees to accommo-date the underrepresented gender to achieve the required balance. Many of the telephone numbers originally se-lected as part of the sampling frame were ex-cluded as non-residential or non-working num-bers. Only 25 percent of the numbers selected at random yielded completed interviews. However, calls to 66 percent of the working residential numbers resulted in completed interviews. To
1 No major events associated with biotechnology that could have influenced responses and therefore biased the results took place during the interviewing process. Additionally, the interviews were closely monitored for quality, and we believe that the period was adequate for successful completion of the process.
302 October 2006 Agricultural and Resource Economics Review
achieve the maximum response rate, many work-ing numbers were attempted 16 or more times. Numbers were dialed on different days of the week and at varying times of day in an effort to reach elusive respondents. For households that used call-blocking systems, the research company allowed identifying information to be displayed. If an answering machine picked up three times in a row on any given number, interviewers left messages identifying the research company and the purpose of the call. When weighted, the 1,201 completed interviews had a sampling error of ±3 percent.2 For those questions asked of only half the sample, the sampling error increases to ±4 percent. After completing the telephone survey, the 1,201 respondents were asked if they would be willing to participate in a follow-up mail ques-tionnaire. The purpose of this follow-up mail questionnaire was to collect data relating to con-sumers’ stated preferences about cornflakes and the consumers’ trust in institutions associated with biotechnology. About 47 percent of the re-spondents (559) agreed to participate in the mail survey. These respondents were then mailed the questionnaire and $5 as an incentive to return the completed questionnaire within 3 to 4 days. All the questionnaires were sent through first-class mail with a cover letter thanking the respondents for their participation. A follow-up letter with the questionnaire was sent to those who did not re-spond within 14 days after the first mailing. A total of 363 (65 percent) of the surveys were re-turned, of which 7 were incomplete (1 percent). The previous focus-group research on labeling done by Hallman, Aquino, and Phillips (2003) and the study by Onyango, Govindasamy, and Nayga (2004) were the basis for deciding the product analyzed in this study. The product had to be readily available in stores, had to be familiar to a majority of consumers, and had to partly con-tain GM ingredients. Cornflakes were selected as the product based on these three factors.
2 The sampling error associated with a nationwide sample of 1,200 people is approximately ±3 percent with a 95 percent confidence interval. This means that if 50 percent of the respondents gave a particular response, the likely percentage of the entire adult population should be between 47 percent and 53 percent, 95 out of 100 times. The cooperation rate is the percentage of completed interviews (1,201) over completed interviews (1,201) plus refusals (636). A more rigid calcula-tion of response rate, defined as the percentage of completed inter-views (1,201) over total numbers of in-frame telephone numbers (3,120), yields a response rate of 38.5 percent.
One section of the mail survey was devoted to providing background information on genetic modification and labeling. In terms of back-ground, the following information was provided: ▪ Definition of GM.3 Genetic modification as
used in food production involves methods that make it possible for scientists to create new va-rieties of plants and animals by taking parts of the genes of one plant or animal and inserting them into the cells of another plant or animal. The process of genetic modification, often called transgenic transformation or DNA recombina-tion, occurs when biochemists take desirable genes from one plant or animal and insert them into the genetic material of another plant or animal with the purpose of exploiting a trait from the original organism. This is sometimes called genetic engineering or biotechnology.
▪ GM corn in the United States. Currently, 40
percent of the corn grown in the United States is a genetically modified variety. This corn is approved by the U.S. Department of Agricul-ture (USDA) to be as safe for human con-sumption as the corn grown using traditional farming methods. Because genetically modified corn is sometimes mixed with traditional corn during storage and transport, food products that have corn ingredients (like cornflakes) may or may not contain genetically modified corn. The only way to know for sure if cornflakes are made from genetically modified corn or not is if the manufacturers put this information on their product’s label.
▪ Label information. There are 6 types of special
labeling information concerning the possible presence or absence of genetically modified corn in the cereal. The information should be viewed as entirely truthful. This information will vary for products A and B, but choice C will always have no special label. “No special label” means that there is no indication as to whether or not the cornflakes contain geneti-cally modified corn. Please note that the initials “USDA” used on some of the labels means the U.S. Department of Agriculture.
3 This may include such transfers as bacterium inserts into the plant or animal.
Onyango et al. U.S. Consumers’ Willingness to Pay for Food Labeled ‘Genetically Modified’ 303
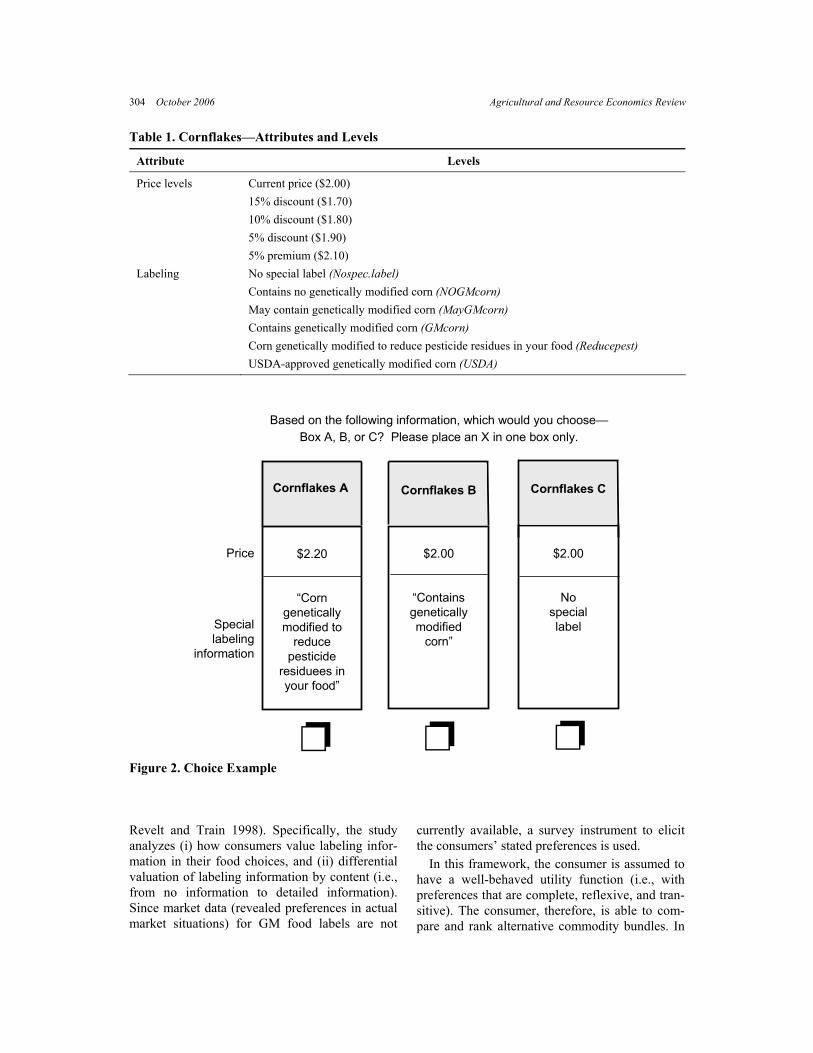
A section of the choice modeling questionnaire provided instructions on choice selection. The instructions were as follows: “Carefully read and think about each question since you will be asked to select the box of cornflakes you most prefer out of three possible boxes of cornflakes. There are no right or wrong answers; we are interested only in your opinion.” The choice modeling questions were pre-tested at Rutgers with sugges-tions to put “price” and “labeling statements” as row headings, and to put “survey instructions” at the top of the page. The GM labeling statements used in this study were chosen based on extensive discussions and the GM labeling literature. The statements ranged from no information at all, to some information, to very detailed information about the label. The labeling information statements were framed in terms of label usefulness to the consumer deci-sion making process (Caswell 2000). A fractional factorial experiment design was used to create a balanced and efficient design matrix for a number of choice sets. The product to be analyzed was characterized by two factors/attributes (i.e., label and price), each with six and five different levels, respectively (see Table 1 for details). The experi-ment yielded 32 choice sets. After removal of the dominated choices, 28 choice sets remained. Two of the alternatives in each choice set were all variants of a labeling and price variation scheme. The status quo alternative (no special label) was constant and common to all choice sets. The 28 choice sets were split (by blocking) into 4 sub-sets, with each respondent randomly allocated one set of 7 questions to complete. The actual choice questions were presented in the following manner: “Imagine you are at the grocery store and want to buy a box of corn-flakes. You have to choose among three boxes of cornflakes: A, B, or C. Which will you choose? You’ll be asked to do this 7 times. While the combination of products may seem the same, they are all slightly different. Choose carefully and read all of the information given. By combining your choices with those of others, we will be able to better understand what is important to consum-ers” (see Figure 2 for an example). The corn-flakes contain the exact same ingredients except that some contain genetically modified corn and some do not. The cornflakes differ from each other on the basis of price, the presence of geneti-
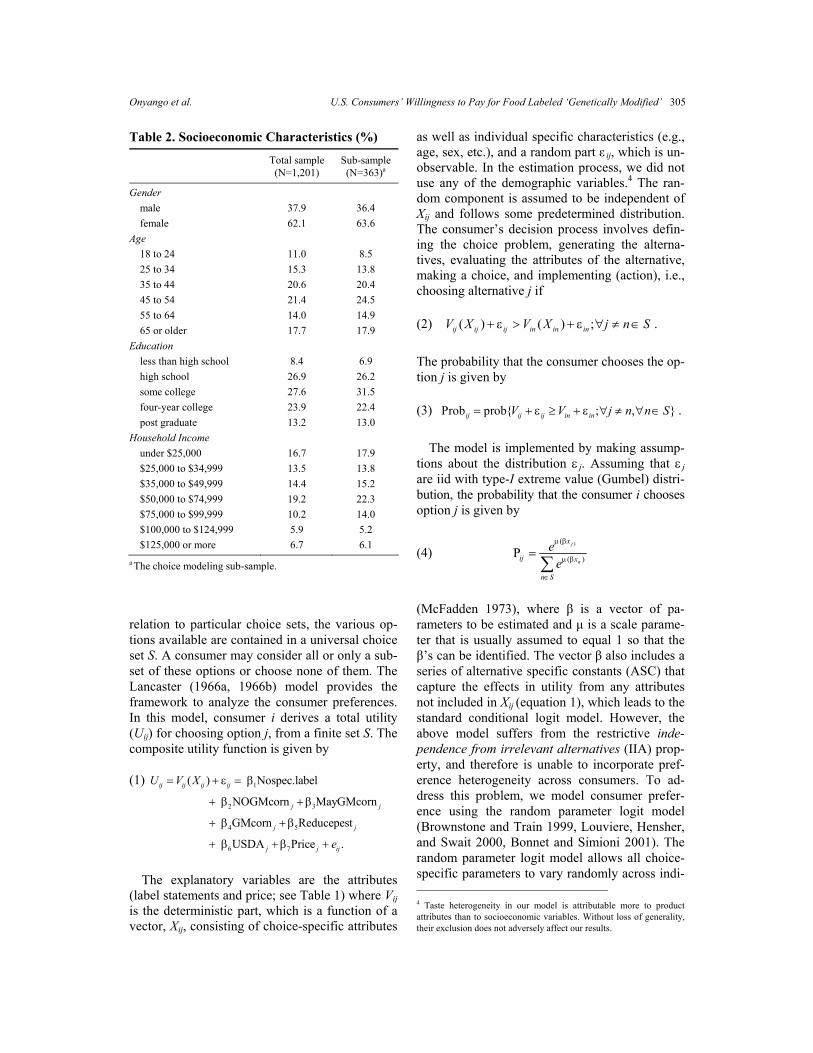
cally modified corn, and special labeling infor-mation about the product. “The boxes are all the same weight and the cornflakes all look and taste exactly the same.” Sample Socioeconomic Characteristics and Response Rates to the Choice Modeling Questions Table 2 shows that the composition of respon-dents in the sub-sample closely mirrors the main sample (n = 1,201) in terms of socioeconomic characteristics. Both samples show more female representation than male. Appropriate weighting was done as previously stated to ensure repre-sentation of the sample. Respondents’ age ranged from 18 to 94, with those in the ages between 45 and 54 being relatively overrepresented in the sub-sample. Most respondents (90 percent) had completed high school. High school was the highest level of formal education for more than a quarter of the sample (26 percent). About a quar-ter (27 percent) had completed some college or an associate’s degree, while 24 percent of the sample had completed a four-year college degree and 13 percent had earned a post-graduate degree. The remainder (8 percent) had not obtained a high school diploma. A little fewer than half (47 per-cent) had household income less than $50,000, while the other half (45 percent) had household income greater than $50,000. Table 3 shows the distribution of respondents’ answers to seven questions. The distribution of the choices shows substantial variation by block. For example, twice as many respondents in block 1 chose option A (56 percent) as compared to respondents in block 4. An equal number of re-spondents in each block chose option B. Respon-dents in block 4, compared to the other blocks, chose relatively more of option C (33 percent). Across the blocks, about 3 percent of the respon-dents chose not to respond. Empirical Model Consumers’ choice of cornflakes under different labels is analyzed within the choice-modeling framework (Louviere, Hensher, and Swait 2000). This is done within the random utility discrete choice model framework (McFadden 1978,
304 October 2006 Agricultural and Resource Economics Review
Table 1. Cornflakes—Attributes and Levels
Attribute Levels
Price levels Current price ($2.00) 15% discount ($1.70) 10% discount ($1.80) 5% discount ($1.90) 5% premium ($2.10)
Labeling No special label (Nospec.label) Contains no genetically modified corn (NOGMcorn) May contain genetically modified corn (MayGMcorn) Contains genetically modified corn (GMcorn) Corn genetically modified to reduce pesticide residues in your food (Reducepest) USDA-approved genetically modified corn (USDA)
Cornflakes A
$2.20
“Corn genetically modified to
reduce pesticide
residuees in your food”
$2.00
“Contains genetically modified
corn”
$2.00
Nospeciallabel
Based on the following information, which would you choose—Box A, B, or C? Please place an X in one box only.
’ ’ ’
Price
Special labeling
information
Cornflakes B Cornflakes C
Figure 2. Choice Example Revelt and Train 1998). Specifically, the study analyzes (i) how consumers value labeling infor-mation in their food choices, and (ii) differential valuation of labeling information by content (i.e., from no information to detailed information). Since market data (revealed preferences in actual market situations) for GM food labels are not
currently available, a survey instrument to elicit the consumers’ stated preferences is used. In this framework, the consumer is assumed to have a well-behaved utility function (i.e., with preferences that are complete, reflexive, and tran-sitive). The consumer, therefore, is able to com-pare and rank alternative commodity bundles. In
Onyango et al. U.S. Consumers’ Willingness to Pay for Food Labeled ‘Genetically Modified’ 305
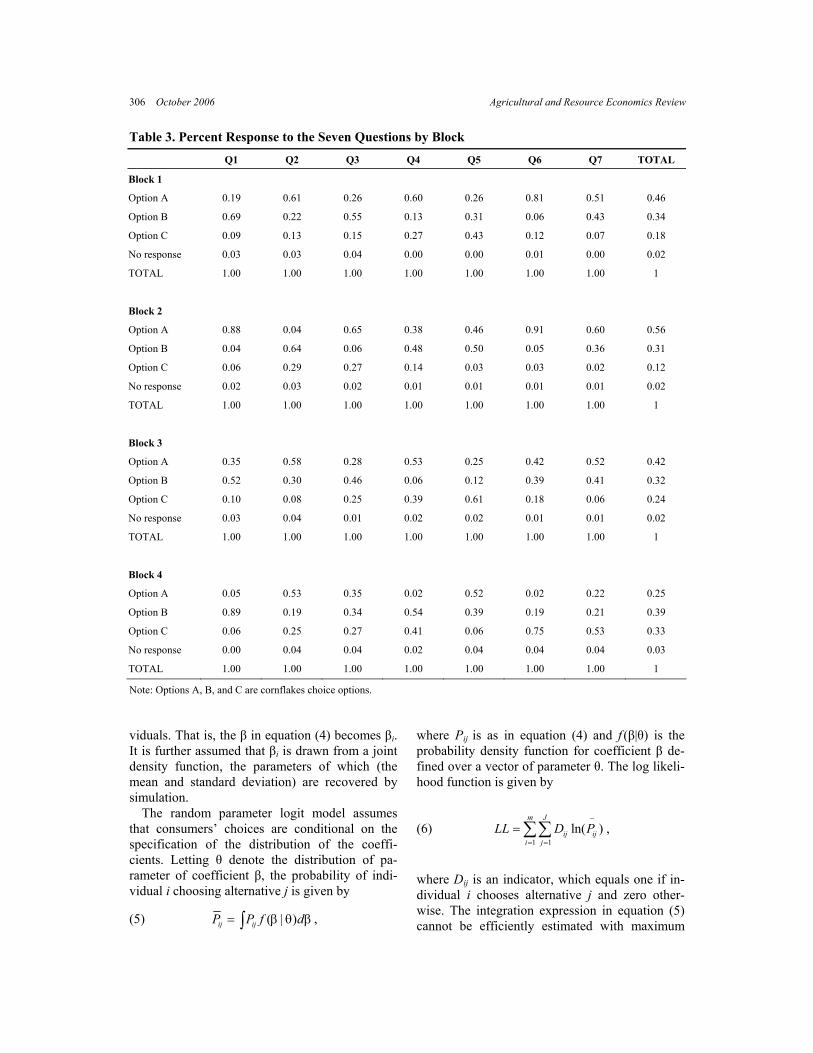
Table 2. Socioeconomic Characteristics (%) Total sample
(N=1,201) Sub-sample (N=363)a
Gender male 37.9 36.4 female 62.1 63.6 Age 18 to 24 11.0 8.5 25 to 34 15.3 13.8 35 to 44 20.6 20.4 45 to 54 21.4 24.5 55 to 64 14.0 14.9 65 or older 17.7 17.9 Education less than high school 8.4 6.9 high school 26.9 26.2 some college 27.6 31.5 four-year college 23.9 22.4 post graduate 13.2 13.0 Household Income under $25,000 16.7 17.9 $25,000 to $34,999 13.5 13.8 $35,000 to $49,999 14.4 15.2 $50,000 to $74,999 19.2 22.3 $75,000 to $99,999 10.2 14.0 $100,000 to $124,999 5.9 5.2 $125,000 or more 6.7 6.1 a The choice modeling sub-sample.
relation to particular choice sets, the various op-tions available are contained in a universal choice set S. A consumer may consider all or only a sub-set of these options or choose none of them. The Lancaster (1966a, 1966b) model provides the framework to analyze the consumer preferences. In this model, consumer i derives a total utility (Uij) for choosing option j, from a finite set S. The composite utility function is given by (1) 1
2 3
4 5
6 7
( ) Nospec.label
NOGMcorn MayGMcorn
GMcorn Reducepest
USDA Price .
ij ij ij ij
j j
j j
j j ij
U V X
e
= + ε = β
+ β + β
+ β + β
+ β + β +
The explanatory variables are the attributes (label statements and price; see Table 1) where Vij is the deterministic part, which is a function of a vector, Xij, consisting of choice-specific attributes
as well as individual specific characteristics (e.g., age, sex, etc.), and a random part ε ij, which is un-observable. In the estimation process, we did not use any of the demographic variables.4 The ran-dom component is assumed to be independent of Xij and follows some predetermined distribution. The consumer’s decision process involves defin-ing the choice problem, generating the alterna-tives, evaluating the attributes of the alternative, making a choice, and implementing (action), i.e., choosing alternative j if (2) ( ) ( ) ;ij ij ij in in inV X V X j n S+ ε > + ε ∀ ≠ ∈ . The probability that the consumer chooses the op-tion j is given by (3) . Prob prob{ ; , }ij ij ij in inV V j n n= + ε ≥ + ε ∀ ≠ ∀ ∈ S
The model is implemented by making assump-tions about the distribution ε j. Assuming that ε j are iid with type-I extreme value (Gumbel) distri-bution, the probability that the consumer i chooses option j is given by
(4) )(
( )Pj
n
x
ij x
n S
ee
µ β
µ β
∈
=∑
(McFadden 1973), where β is a vector of pa-rameters to be estimated and µ is a scale parame-ter that is usually assumed to equal 1 so that the β’s can be identified. The vector β also includes a series of alternative specific constants (ASC) that capture the effects in utility from any attributes not included in Xij (equation 1), which leads to the standard conditional logit model. However, the above model suffers from the restrictive inde-pendence from irrelevant alternatives (IIA) prop-erty, and therefore is unable to incorporate pref-erence heterogeneity across consumers. To ad-dress this problem, we model consumer prefer-ence using the random parameter logit model (Brownstone and Train 1999, Louviere, Hensher, and Swait 2000, Bonnet and Simioni 2001). The random parameter logit model allows all choice- specific parameters to vary randomly across indi- 4 Taste heterogeneity in our model is attributable more to product attributes than to socioeconomic variables. Without loss of generality, their exclusion does not adversely affect our results.
306 October 2006 Agricultural and Resource Economics Review
Table 3. Percent Response to the Seven Questions by Block
Q1 Q2 Q3 Q4 Q5 Q6 Q7 TOTAL
Block 1
Option A 0.19 0.61 0.26 0.60 0.26 0.81 0.51 0.46
Option B 0.69 0.22 0.55 0.13 0.31 0.06 0.43 0.34
Option C 0.09 0.13 0.15 0.27 0.43 0.12 0.07 0.18
No response 0.03 0.03 0.04 0.00 0.00 0.01 0.00 0.02
TOTAL 1.00 1.00 1.00 1.00 1.00 1.00 1.00 1
Block 2
Option A 0.88 0.04 0.65 0.38 0.46 0.91 0.60 0.56
Option B 0.04 0.64 0.06 0.48 0.50 0.05 0.36 0.31
Option C 0.06 0.29 0.27 0.14 0.03 0.03 0.02 0.12
No response 0.02 0.03 0.02 0.01 0.01 0.01 0.01 0.02
TOTAL 1.00 1.00 1.00 1.00 1.00 1.00 1.00 1
Block 3
Option A 0.35 0.58 0.28 0.53 0.25 0.42 0.52 0.42
Option B 0.52 0.30 0.46 0.06 0.12 0.39 0.41 0.32
Option C 0.10 0.08 0.25 0.39 0.61 0.18 0.06 0.24
No response 0.03 0.04 0.01 0.02 0.02 0.01 0.01 0.02
TOTAL 1.00 1.00 1.00 1.00 1.00 1.00 1.00 1
Block 4
Option A 0.05 0.53 0.35 0.02 0.52 0.02 0.22 0.25
Option B 0.89 0.19 0.34 0.54 0.39 0.19 0.21 0.39
Option C 0.06 0.25 0.27 0.41 0.06 0.75 0.53 0.33
No response 0.00 0.04 0.04 0.02 0.04 0.04 0.04 0.03
TOTAL 1.00 1.00 1.00 1.00 1.00 1.00 1.00 1
Note: Options A, B, and C are cornflakes choice options. viduals. That is, the β in equation (4) becomes βi. It is further assumed that βi is drawn from a joint density function, the parameters of which (the mean and standard deviation) are recovered by simulation. The random parameter logit model assumes that consumers’ choices are conditional on the specification of the distribution of the coeffi-cients. Letting θ denote the distribution of pa-rameter of coefficient β, the probability of indi-vidual i choosing alternative j is given by
(5) ( | )ij ijP P f d= β θ∫ β ,
where Pij is as in equation (4) and f (β|θ) is the probability density function for coefficient β de-fined over a vector of parameter θ. The log likeli-hood function is given by
(6) , 1 1
ln( )m J
ij iji j
LL D P−
= =
= ∑∑
where Dij is an indicator, which equals one if in-dividual i chooses alternative j and zero other-wise. The integration expression in equation (5) cannot be efficiently estimated with maximum
Onyango et al. U.S. Consumers’ Willingness to Pay for Food Labeled ‘Genetically Modified’ 307
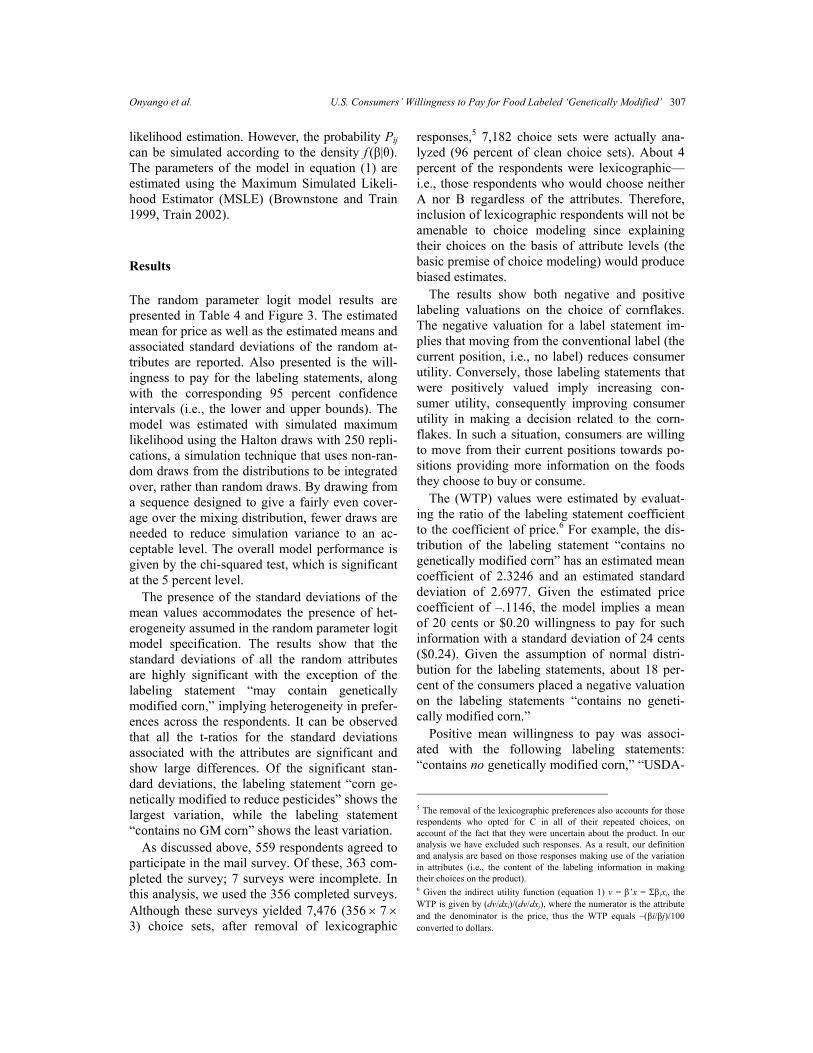
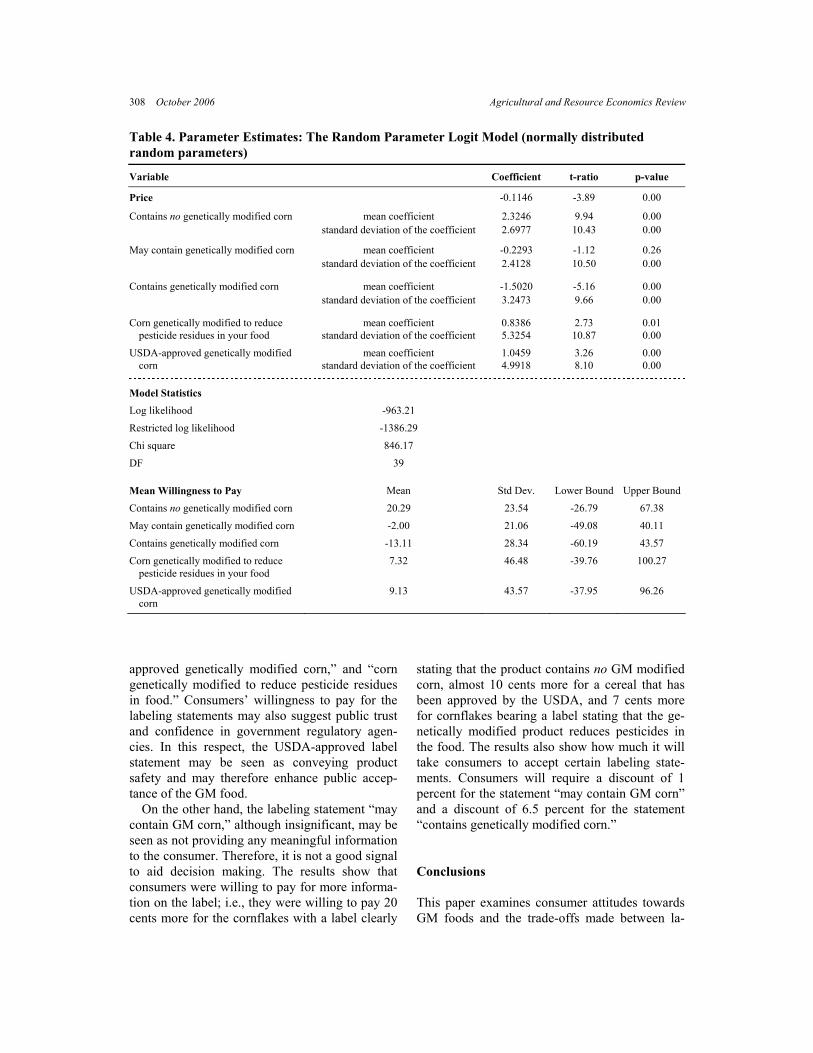
likelihood estimation. However, the probability Pij can be simulated according to the density f (β|θ). The parameters of the model in equation (1) are estimated using the Maximum Simulated Likeli-hood Estimator (MSLE) (Brownstone and Train 1999, Train 2002). Results The random parameter logit model results are presented in Table 4 and Figure 3. The estimated mean for price as well as the estimated means and associated standard deviations of the random at-tributes are reported. Also presented is the will-ingness to pay for the labeling statements, along with the corresponding 95 percent confidence intervals (i.e., the lower and upper bounds). The model was estimated with simulated maximum likelihood using the Halton draws with 250 repli-cations, a simulation technique that uses non-ran-dom draws from the distributions to be integrated over, rather than random draws. By drawing from a sequence designed to give a fairly even cover-age over the mixing distribution, fewer draws are needed to reduce simulation variance to an ac-ceptable level. The overall model performance is given by the chi-squared test, which is significant at the 5 percent level. The presence of the standard deviations of the mean values accommodates the presence of het-erogeneity assumed in the random parameter logit model specification. The results show that the standard deviations of all the random attributes are highly significant with the exception of the labeling statement “may contain genetically modified corn,” implying heterogeneity in prefer-ences across the respondents. It can be observed that all the t-ratios for the standard deviations associated with the attributes are significant and show large differences. Of the significant stan-dard deviations, the labeling statement “corn ge-netically modified to reduce pesticides” shows the largest variation, while the labeling statement “contains no GM corn” shows the least variation. As discussed above, 559 respondents agreed to participate in the mail survey. Of these, 363 com-pleted the survey; 7 surveys were incomplete. In this analysis, we used the 356 completed surveys. Although these surveys yielded 7,476 (356 × 7 × 3) choice sets, after removal of lexicographic
responses,5 7,182 choice sets were actually ana-lyzed (96 percent of clean choice sets). About 4 percent of the respondents were lexicographic—i.e., those respondents who would choose neither A nor B regardless of the attributes. Therefore, inclusion of lexicographic respondents will not be amenable to choice modeling since explaining their choices on the basis of attribute levels (the basic premise of choice modeling) would produce biased estimates. The results show both negative and positive labeling valuations on the choice of cornflakes. The negative valuation for a label statement im-plies that moving from the conventional label (the current position, i.e., no label) reduces consumer utility. Conversely, those labeling statements that were positively valued imply increasing con-sumer utility, consequently improving consumer utility in making a decision related to the corn-flakes. In such a situation, consumers are willing to move from their current positions towards po-sitions providing more information on the foods they choose to buy or consume. The (WTP) values were estimated by evaluat-ing the ratio of the labeling statement coefficient to the coefficient of price.6 For example, the dis-tribution of the labeling statement “contains no genetically modified corn” has an estimated mean coefficient of 2.3246 and an estimated standard deviation of 2.6977. Given the estimated price coefficient of –.1146, the model implies a mean of 20 cents or $0.20 willingness to pay for such information with a standard deviation of 24 cents ($0.24). Given the assumption of normal distri-bution for the labeling statements, about 18 per-cent of the consumers placed a negative valuation on the labeling statements “contains no geneti-cally modified corn.” Positive mean willingness to pay was associ-ated with the following labeling statements: “contains no genetically modified corn,” “USDA-
5 The removal of the lexicographic preferences also accounts for those respondents who opted for C in all of their repeated choices, on account of the fact that they were uncertain about the product. In our analysis we have excluded such responses. As a result, our definition and analysis are based on those responses making use of the variation in attributes (i.e., the content of the labeling information in making their choices on the product). 6 Given the indirect utility function (equation 1) v = β’x = Σβixi, the WTP is given by (dv/dxi)/(dv/dxj), where the numerator is the attribute and the denominator is the price, thus the WTP equals –(βi/βj)/100 converted to dollars.
308 October 2006 Agricultural and Resource Economics Review
Table 4. Parameter Estimates: The Random Parameter Logit Model (normally distributed random parameters)
Variable Coefficient t-ratio p-value
Price -0.1146 -3.89 0.00
Contains no genetically modified corn mean coefficient 2.3246 9.94 0.00 standard deviation of the coefficient 2.6977 10.43 0.00
May contain genetically modified corn mean coefficient -0.2293 -1.12 0.26 standard deviation of the coefficient 2.4128 10.50 0.00
Contains genetically modified corn mean coefficient -1.5020 -5.16 0.00 standard deviation of the coefficient 3.2473 9.66 0.00
Corn genetically modified to reduce pesticide residues in your food
mean coefficient standard deviation of the coefficient
0.8386 5.3254
2.73 10.87
0.01 0.00
USDA-approved genetically modified corn
mean coefficient standard deviation of the coefficient
1.0459 4.9918
3.26 8.10
0.00 0.00
Model Statistics
Log likelihood -963.21
Restricted log likelihood -1386.29
Chi square 846.17
DF 39
Mean Willingness to Pay Mean Std Dev. Lower Bound Upper Bound
Contains no genetically modified corn 20.29 23.54 -26.79 67.38
May contain genetically modified corn -2.00 21.06 -49.08 40.11
Contains genetically modified corn -13.11 28.34 -60.19 43.57
Corn genetically modified to reduce pesticide residues in your food
7.32 46.48 -39.76 100.27
USDA-approved genetically modified corn
9.13 43.57 -37.95 96.26
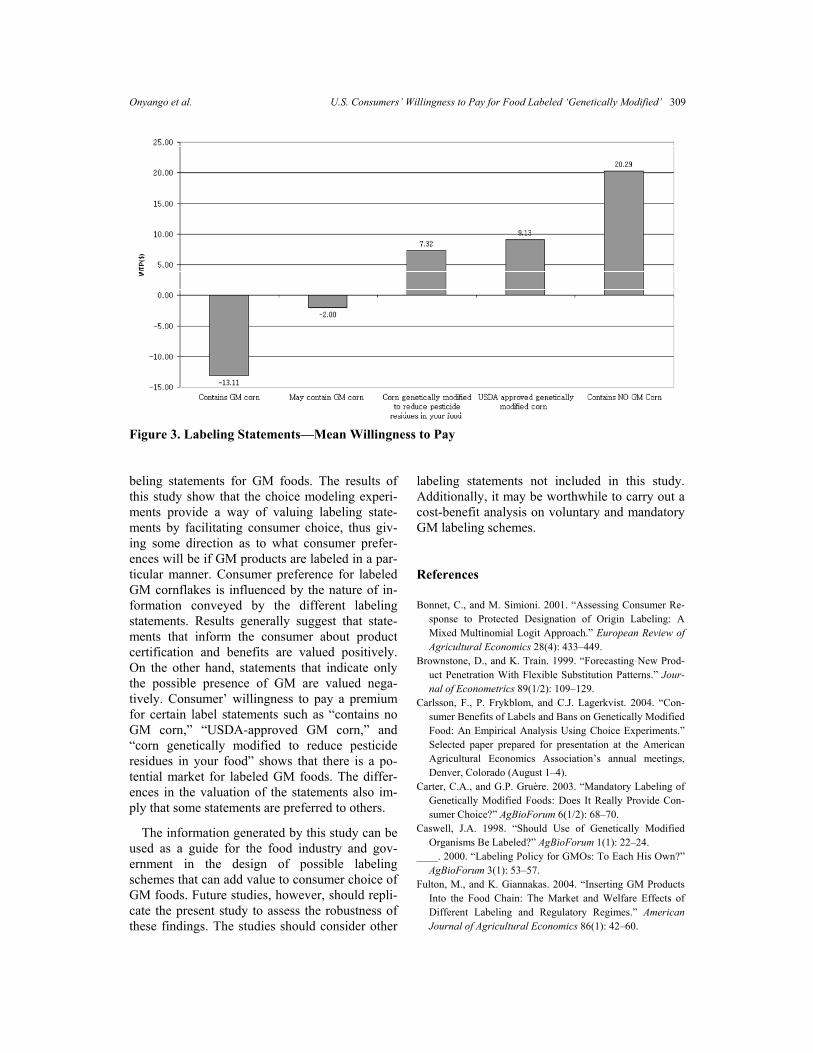
approved genetically modified corn,” and “corn genetically modified to reduce pesticide residues in food.” Consumers’ willingness to pay for the labeling statements may also suggest public trust and confidence in government regulatory agen-cies. In this respect, the USDA-approved label statement may be seen as conveying product safety and may therefore enhance public accep-tance of the GM food. On the other hand, the labeling statement “may contain GM corn,” although insignificant, may be seen as not providing any meaningful information to the consumer. Therefore, it is not a good signal to aid decision making. The results show that consumers were willing to pay for more informa-tion on the label; i.e., they were willing to pay 20 cents more for the cornflakes with a label clearly
stating that the product contains no GM modified corn, almost 10 cents more for a cereal that has been approved by the USDA, and 7 cents more for cornflakes bearing a label stating that the ge-netically modified product reduces pesticides in the food. The results also show how much it will take consumers to accept certain labeling state-ments. Consumers will require a discount of 1 percent for the statement “may contain GM corn” and a discount of 6.5 percent for the statement “contains genetically modified corn.” Conclusions This paper examines consumer attitudes towards GM foods and the trade-offs made between la-
Onyango et al. U.S. Consumers’ Willingness to Pay for Food Labeled ‘Genetically Modified’ 309
Figure 3. Labeling Statements—Mean Willingness to Pay beling statements for GM foods. The results of this study show that the choice modeling experi-ments provide a way of valuing labeling state-ments by facilitating consumer choice, thus giv-ing some direction as to what consumer prefer-ences will be if GM products are labeled in a par-ticular manner. Consumer preference for labeled GM cornflakes is influenced by the nature of in-formation conveyed by the different labeling statements. Results generally suggest that state-ments that inform the consumer about product certification and benefits are valued positively. On the other hand, statements that indicate only the possible presence of GM are valued nega-tively. Consumer’ willingness to pay a premium for certain label statements such as “contains no GM corn,” “USDA-approved GM corn,” and “corn genetically modified to reduce pesticide residues in your food” shows that there is a po-tential market for labeled GM foods. The differ-ences in the valuation of the statements also im-ply that some statements are preferred to others.
The information generated by this study can be used as a guide for the food industry and gov-ernment in the design of possible labeling schemes that can add value to consumer choice of GM foods. Future studies, however, should repli-cate the present study to assess the robustness of these findings. The studies should consider other
labeling statements not included in this study. Additionally, it may be worthwhile to carry out a cost-benefit analysis on voluntary and mandatory GM labeling schemes. References Bonnet, C., and M. Simioni. 2001. “Assessing Consumer Re-
sponse to Protected Designation of Origin Labeling: A Mixed Multinomial Logit Approach.” European Review of Agricultural Economics 28(4): 433–449.
Brownstone, D., and K. Train. 1999. “Forecasting New Prod-uct Penetration With Flexible Substitution Patterns.” Jour-nal of Econometrics 89(1/2): 109–129.
Carlsson, F., P. Frykblom, and C.J. Lagerkvist. 2004. “Con-sumer Benefits of Labels and Bans on Genetically Modified Food: An Empirical Analysis Using Choice Experiments.” Selected paper prepared for presentation at the American Agricultural Economics Association’s annual meetings, Denver, Colorado (August 1–4).
Carter, C.A., and G.P. Gruère. 2003. “Mandatory Labeling of Genetically Modified Foods: Does It Really Provide Con-sumer Choice?” AgBioForum 6(1/2): 68–70.
Caswell, J.A. 1998. “Should Use of Genetically Modified Organisms Be Labeled?” AgBioForum 1(1): 22–24.
____. 2000. “Labeling Policy for GMOs: To Each His Own?” AgBioForum 3(1): 53–57.
Fulton, M., and K. Giannakas. 2004. “Inserting GM Products Into the Food Chain: The Market and Welfare Effects of Different Labeling and Regulatory Regimes.” American Journal of Agricultural Economics 86(1): 42–60.
310 October 2006 Agricultural and Resource Economics Review
Golan, E., F. Kuchler, and L. Mitchell. 2000. “Economics of Food Labeling.” Agricultural Economic Report No. 793, Economic Research Service, U.S. Department of Agricul-ture, Washington, D.C.
Golder, G., and F. Leung. 2000. “Economic Impact Study: Potential Costs of Mandatory Labelling of Food Products Derived From Biotechnology in Canada.” KPMG Consult-ing, Ottawa. Available at weeds.montana.edu/news/KPM[-] GlabelCanada.pdf (accessed November 18, 2004).
Hallman, W.K., H.L. Aquino, and D.M. Phillips. 2003. “The GM Labeling Debate: Caveat Emptor: Caveat Venditor; Cui Bono?” Invited paper presented at the conference “Crossing Over: Genomics in the Public Arena,” sponsored by the Genome Prairie Project, Kananaskis, Alberta, Can-ada (April 25).
Hallman, W.K., W.C. Hebden, H.L. Aquino, C.L. Cuite, and J. Lang. 2003. “Public Perceptions of Genetically Modified Foods: A National Study of Americans’ Knowledge and Opinion.” Publication No. RR-1003-004, Food Policy In-stitute, Rutgers University, New Brunswick, NJ.
____. 2004. “Americans and GM Food: Knowledge, Opinion and Interest in 2004.” Publication No. RR-1104-007, Food Policy Institute, Rutgers University, New Brunswick, NJ.
Hu, W., M.M. Veeman, and W.L. Adamowicz. 2005. “Label-ing Genetically Modified Food: Heterogeneous Consumer Preferences and Value of Information.” Canadian Journal of Agricultural Economics 53(205): 82–102.
Huffman, W.E. 2003. “Consumers’ Acceptance of (and Re-sistance to) Genetically Modified Foods in High-Income Countries: Effects of Labels and Information in an Uncer-tain Environment.” American Journal of Agricultural Eco-nomics 85(5): 112–118.
Huygen, I., M. Veeman, and M. Lerohl. 2003. “Cost Implica-tions of Alternative GM Tolerance Levels: Non-Genetically Modified Wheat in Western Canada.” AgBioForum 6(4): 169–177.
James, C. 2003. “Preview: Global Status of Commercialized Transgenic Crops: 2003, Executive Summary.” Brief No. 30, International Service for the Acquisition of Agri-Bio-tech Applications (ISAAA). Available at www.isaaa.org/ bin/Briefs/30/index.htm (accessed November 18, 2004).
Lancaster, K.J. 1966a. “A New Approach to Consumer The-ory.” Journal of Political Economy 74(2): 132–157.
____. 1966b. “Change and Innovation in the Technology of Consumption.” American Economic Review 56(1/2): 14–23.
Li, Q., J.J. McCluskey, and T.L. Wahl. 2004. “Effects of In-formation on Consumers’ Willingness to Pay for GM-Corn-Fed Beef.” Journal of Agricultural and Food Industrial Organization 2(2): 1–16. Available online at www.bepress. com/jafio/vol2/iss2/art9 (Article 9).
Louviere, J., D. Hensher, and J. Swait. 2000. Stated Choice Methods: Analysis and Application. Cambridge, U.K.: Cam-bridge University Press.
McCluskey, J.J., and M.L. Loureiro. 2003. “Consumer Prefer-ences and Willingness to Pay for Food Labeling: A Discus-
sion of Empirical Studies.” Journal of Food Distribution Research 34(1): 95–102.
McFadden, D. 1973. “Conditional Logit Analysis of Qualita-tive Choice Behavior.” In P. Zarembka, ed., Frontiers in Econometrics. New York: Academic Press.
____. 1978. “Modeling the Choice of Residential Location.” In A. Karlqvist, L. Lundqvist, F. Snickars, and J. Weibull, eds., Spatial Interaction Theory and Planning Models. Am-sterdam: North Holland.
Muth, M.K., D. Mancini, and C. Viator. 2003. “U.S. Food Manufacturer Assessment of and Responses to Bioengi-neered Foods.” AgBioForum 5(3): 90–100.
Onyango, B., R. Govindasamy, and R.M. Nayga, Jr. 2004. “An Application Choice Modeling to Measure U.S. Con-sumer Preferences for Genetically Modified Foods.” Se-lected paper prepared for presentation at the American Ag-ricultural Economics Association’s annual meetings, Den-ver, Colorado (August 1–4).
Pew Initiative on Food and Biotechnology. 2004. “Genetically Modified Crops in the United States.” Available at http:// pewagbiotech.org/resources/factsheets (accessed July 1, 2004).
Phillips, P.W.B., and H. McNeill. 2000. “Labeling For GM Foods: Theory and Practice.” AgBioForum 3(4): 219–224.
Revelt, D., and K. Train. 1998. “Mixed Logit with Repeated Choices.” Review of Economics and Statistics 80(4): 647–657.
Roosen, J., J.L. Lusk, and J.A. Fox. 2001. “Consumer Demand for and Attitudes Toward Beef Labeling Strategies in France, Germany and U.K.” Selected paper, American Ag-ricultural Economics Association’s annual meetings, Chi-cago, IL (August 5–8).
Rousu, M., and W.E. Huffman. 2001. “GM Food Labeling Policies of the U.S. and Its Trading Partners.” Department of Economics Staff Paper No. 344, Iowa State University, Ames, IA.
Rousu, M.C., W.E. Huffman, J.F. Shogren, and A. Tegene. “Estimating the Public Value of Conflicting Information: The Case of Genetically Modified Foods.” Land Economics 80: 125–135.
Runge, C.F., and L.A. Jackson. 2000. “Negative Labeling of Genetically Modified Organisms (GMOs): The Experience of rBST.” AgBioForum 3(1): 58–62.
Senhui, H.E., S. Fletcher, and A. Rimal. 2003. “ Consumer Evaluation of the Desirability of Four Types of Information on Labels.” Journal of Food Distribution Research 34(1): 69–71.
Teisl, M.F., L. Garner, B. Roe, and M.E. Vayda. 2003. “La-beling Genetically Modified Foods: How Do U.S. Consum-ers Want to See It Done?” AgBioForum 6(1/2): 48–54.
Train, K. 2002. Discrete Choice Methods with Simulation. Cambridge, U.K.: Cambridge University Press.