u.s. clean coal and carbon management rd&d program us-china... · u.s. clean coal and carbon...
TRANSCRIPT
Office of Fossil Energy
U.S. Clean Coal and Carbon Management RD&D Program
David Mohler Deputy Assistant Secretary for Clean Coal and Carbon Management
U.S.-China Clean Coal Industry Forum 25-26 August 2015

Office of Fossil Energy Fossil Energy Makes Our Modern World Possible

Office of Fossil Energy
Fossil Fuels Have Been the Primary Energy Source for Most of Our History…

Office of Fossil Energy …They Still Provides the Lion’s Share of our Energy
0
20
40
60
80
100
120
1980 1985 1990 1995 2000 2005 2010 2015 2020 2025 2030 2035 2040
History 2013
18%
33%
Projections 2025
2040
36%
18%
27%
1%
Source: EIA, Annual Energy Outlook 2015 Reference case
35%
19%
27%
8%
9%
1%
10% 18%
29%
8%
1%
Fossil fuels provide about 80% of U.S. primary energy consumption (in quadrillion Btu)
29%
8%
Natural Gas
Renewables (exc. liquid biofuels)
Coal
Nuclear Liquid biofuels
Petroleum and other liquids
8%

Office of Fossil Energy …And the World’s
Source: EIA, International Energy Outlook 2013
0.0
15.0
30.0
45.0
1990 2000 2010 2015 2020 2025 2030 2035 2040
Coal
Natural gas
Hydropower
Nuclear
Other renewables Liquids
History Projections
World electricity generation by fuel billion kilowatt hours

Office of Fossil Energy
Unlike China, Majority of U.S. Coal Consumption is Used for Electricity Generation
U.S. Coal Consumption by End Use Sector (2013) Total 2013 Consumption: 925 million short tons
92.8%
[PERCENTAGE] 2.3%
0.2%
Electric Power Generation
Other Industrial Uses
Coke Production
Commercial & Institutional Use858 mmst
Source: EIA Annual Coal Report

Office of Fossil Energy Coal: A Reliable and Economic Energy Resource…
U.S. Electricity Production Costs 1995-2012

Office of Fossil Energy
Managing Our Fossil Energy Abundance is in the Public Interest
0.0
10.0
20.0
30.0
40.0
50.0
1990 1995 2000 2005 2010 2015 2020 2025 2030 2035 2040
World energy-related carbon dioxide emissions by fuel billion metric tons
Source: EIA, International Energy Outlook 2013
Coal
Natural gas
Liquid fuels
2010 History Projections
CO2 emissions from fossil fuels, especially coal, are contributing to climate change
So managing our abundance is critical – to address climate change, ensure environmental sustainability, and secure our energy future

Office of Fossil Energy
CCS Will Be Required To Meet Our Carbon Emission Reduction Goals
05
1015202530354045505560
2010 2015 2020 2025 2030 2035 2040 2045 2050
Gt C
O2
CCS 19%
Renewables 17%
Nuclear 6%
Power generation efficiency and fuel switching 5%End-use fuel switching 15%
End-use fuel and electricity efficiency 38%
BLUE Map emissions 14 Gt
Baseline emissions 57 Gt
WEO 2009 450 ppmcase ETP2010 analysis
Source: International Energy Agency
New 111(b) and 111(d) regulations address CO2 under Final Clean Power Plan

Office of Fossil Energy We’ve Done This Before…
U.S. Air Pollution Has Decreased Significantly Despite Coal Use for Electricity Generation Tripling Since 1970
Clean Air Act of 1963 (extended in 1970, amended in 1977 and 1990) • Required EPA to develop and enforce regulations to protect the public from airborne
contaminants known to be hazardous to human health • Early regulations focused on pollutants, such as SO2, NOx, Mercury, and PM, from coal
plants

Office of Fossil Energy
The Office of Fossil Energy: Ensuring We Can Use All Our Energy Resources Cleanly, Safely, and Securely
Coal and Power Systems Oil and Natural Gas Strategic Petroleum Reserve
Through three major programs…
National Energy Technology Laboratory (NETL)
…And a world-class National Laboratory

Office of Fossil Energy FE is Advancing Coal Towards a Low-Carbon Future
Cost-effective carbon capture for new and existing power plants
Safe, permanent storage of CO2 from power generation and industry
Gasification, Advanced Turbines, Advanced Combustion, CBTL, and Fuel Cells
Crosscutting technology development program
Making Coal Plants More Efficient Capturing More CO2
Turning CO2 into Valuable Products Storing CO2 Underground
New pathways to utilize captured CO2
Bringing it All Together

Office of Fossil Energy
Clean Coal RD&D Progress Performance Improvement is Driving Cost Reductions
0%
5%
10%
15%
20%
25%
30%
35%
40%
Pow
er G
ener
atio
n Pe
nalty
[% o
f Pla
nt O
utpu
t]
Costs of capturing CO from greenfield plants excluding CO transport and storage expressed in 2011 dollars
“2005” “2012” “2020”
$150+/tonne (NOAK)
~ $60/tonne (NOAK)
< $40/tonne (NOAK)
Energy Penalty Reductions Enable Cost Reductions
Relative to Supercritical PC Plant w/o Capture (39.3% HHV efficiency)

Office of Fossil Energy
Partnership Project Status
1 Big Sky Carbon Sequestration Partnership
Saline storage of naturally occurring CO2 (1 million tonnes over 4 years)
Site operations; Injection 2014
2 Midwest Geological Sequestration Consortium
Saline storage of CO2 from ADM biofuel production (1 million tonnes over 3 years)
Injection began Nov. 2011
3 Midwest Regional Carbon Sequestration Partnership
EOR using CO2 from gas processing plant (1 million tonnes over 4 years)
Injection began Feb. 2013
4 Plains CO2 Reduction Partnership
1) Project 1: EOR using CO2 from ConocoPhillips Gas Plant (1 million tonnes over 2 years)
2) Project 2: Saline storage of CO2 from Spectra Energy gas processing plant (1.3 million tonnes over 2 years)
1) Injection June 2013 2) Site operations; injection 2015
5 West Coast Regional Carbon Sequestration Partnership
Regional Characterization No large-scale injection
6 Southeast Regional Carbon Sequestration Partnership
1) Project 1: Saline leg of EOR; storage natural CO2
2) (Over 3.6 million tonnes by Sept. 2014) 3) Project 2: Saline storage of amine
captured CO2 from coal-fired generation (250,000 tonnes over 2 years)
1) Injection began 2009 2) Injection began Aug. 2012
7 Southwest Regional Partnership on Carbon Sequestration
EOR storage of CO2 from fertilizer and ethanol plants (1 million tonnes over 5 years)
Site operations; injection late 2013
CO2 Storage Demonstrations 7 Regional Partnerships to Conduct CO2 Injection Projects
Injection Ongoing
2013/2014 Injection Scheduled
• Geology: Projects represent 6 of 11 identified
depositional environments in the United States
• Storage methodology: Projects include EOR and saline aquifer storage
• Preceded by 20 small-scale projects that cumulatively injected over 1 million tonnes
1
2
3
4
5
6 7
Regional Carbon Sequestration Partnerships

Office of Fossil Energy
Major CCS Demonstrations 8 Projects Advancing Carbon Capture and Storage
Partnership Project Status
1 Air Products Steam Methane Reformer Hydrogen Production EOR utilization ~925,000 MT/year
Operations
2 Southern Company Services (Kemper)
Integrated Gasification Combined Cycle (IGCC) EOR utilization ~3,000,000 MT/year
Under Construction
3 Archer Daniels Midland
Ethanol Fermentation CO2 Saline storage ~900,000 MT/year
Under Construction
4 NRG Energy (Petra Nova ) WA Parish
Retrofit Pulverized Coal Plant. EOR utilization ~1,400,000 MT/year
Under Construction
5 Summit Texas Clean Energy Project
Integrated Gasification Combined Cycle Polygeneration EOR utilization ~2,200,000 MT/year
Financing
6 Leucadia Energy, LLC
Methanol from Petcoke Gasification. EOR utilization ~4,500,000 MT/year
Front End Engineering & Design
7 FutureGen 2.0 Oxycombustion Pulverized Coal Boiler Retrofit Saline storage ~1,000,000 MT/year
Front End Engineering & Design
8 Hydrogen Energy California (HECA)
Integrated Gasification Combined Cycle Polygeneration EOR utilization ~2,570,000 MT/year
Front End Engineering & Design
• Portfolio represents both EOR and storage in saline aquifers
• Portfolio includes industrial and power capture
• Portfolio includes pre-, post-, and oxy-combustion capture
4
5 6
7
8
3
2
1
Operating / Under Construction
FEED/Financing
Major CCUS Demonstrations
Office of Fossil Energy
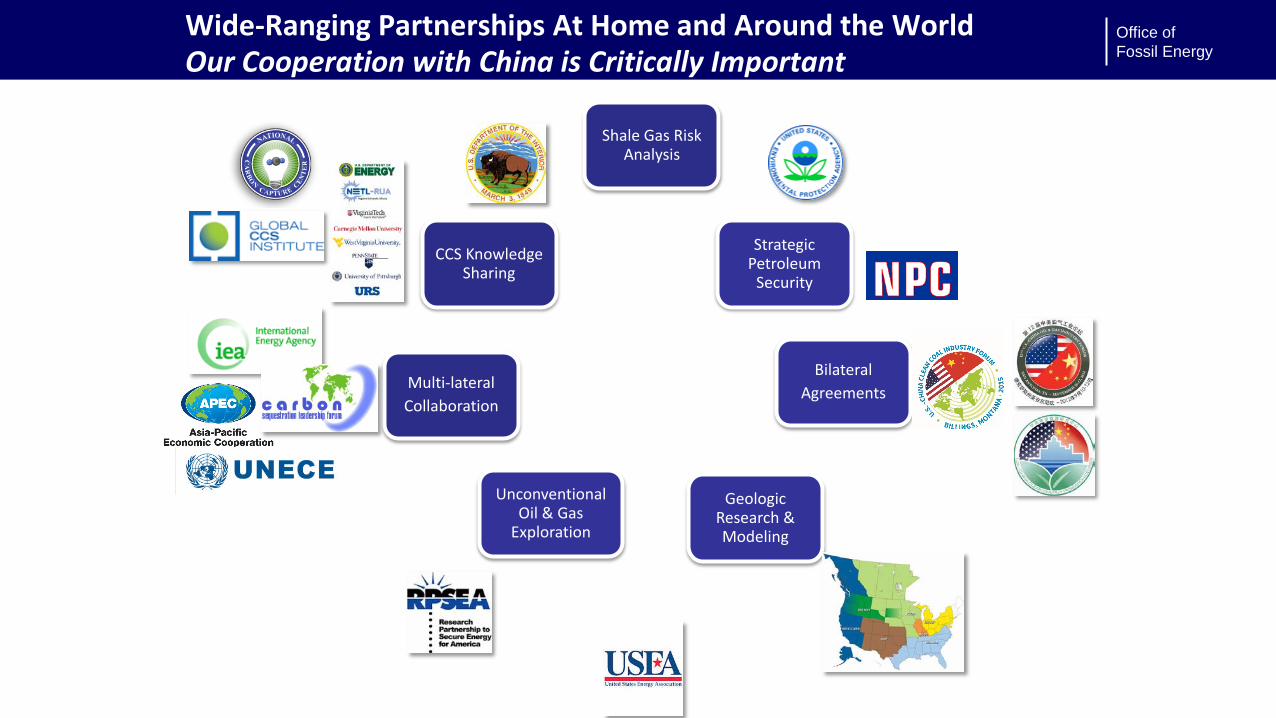
Wide-Ranging Partnerships At Home and Around the World Our Cooperation with China is Critically Important
Shale Gas Risk Analysis
Strategic Petroleum
Security
Bilateral Agreements
Geologic Research & Modeling
Unconventional Oil & Gas
Exploration
Multi-lateral Collaboration
CCS Knowledge Sharing

Office of Fossil Energy For More Information
www.fossil.energy.gov
twitter.com/fossilenergygov
facebook.com/FossilEnergy