u.s. atmospheric nuclear weapons … bruce w. church october 22, 2009 u.s. atmospheric nuclear...
TRANSCRIPT

By Bruce W. ChurchOctober 22, 2009
U.S. ATMOSPHERIC NUCLEAR WEAPONS TESTING:The Connection Between John Wayne and Radioactive Fallout, and
Other Tales.
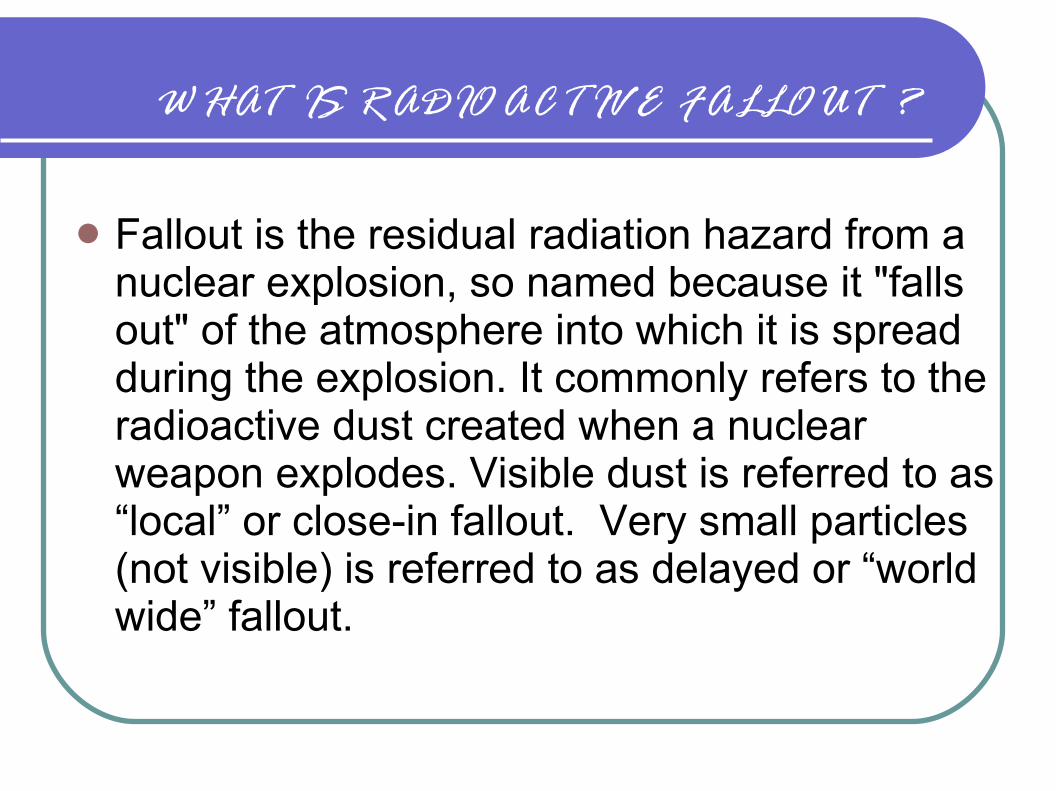
W HAT IS RADIO AC T IV E FALLO U T ?
Fallout is the residual radiation hazard from a nuclear explosion, so named because it "falls out" of the atmosphere into which it is spread during the explosion. It commonly refers to the radioactive dust created when a nuclear weapon explodes. Visible dust is referred to as “local” or close-in fallout. Very small particles (not visible) is referred to as delayed or “world wide” fallout.
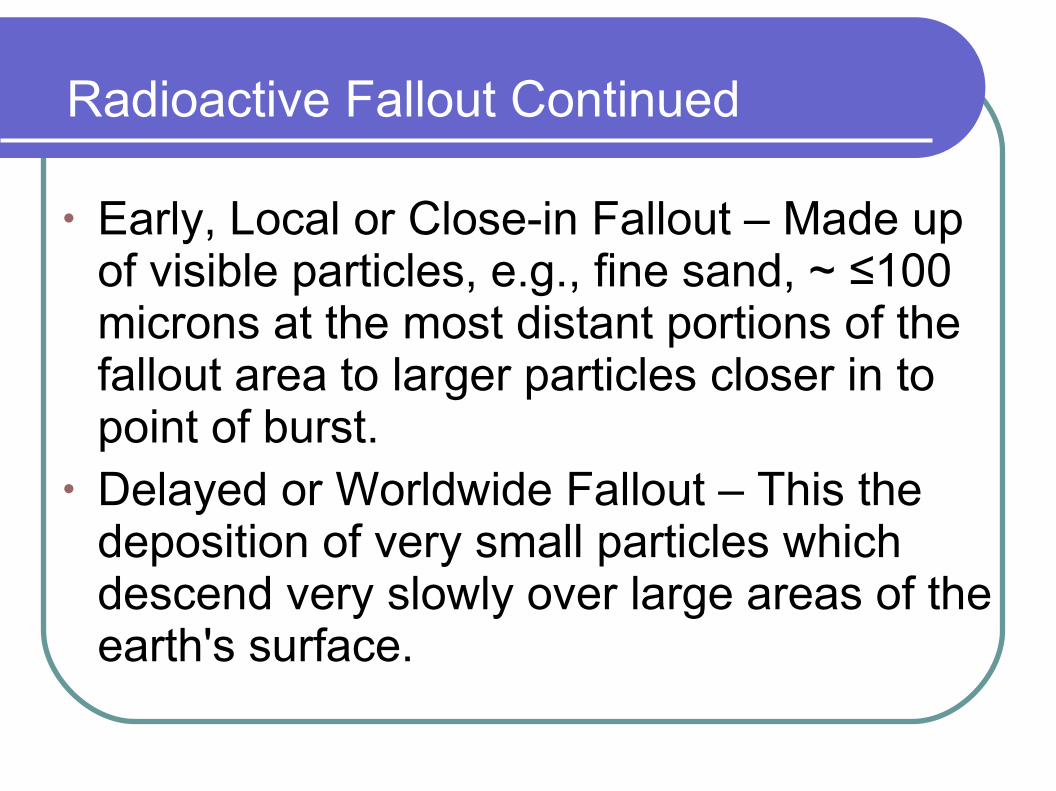
Radioactive Fallout Continued
• Early, Local or Close-in Fallout – Made up of visible particles, e.g., fine sand, ~ ≤100 microns at the most distant portions of the fallout area to larger particles closer in to point of burst.
• Delayed or Worldwide Fallout – This the deposition of very small particles which descend very slowly over large areas of the earth's surface.
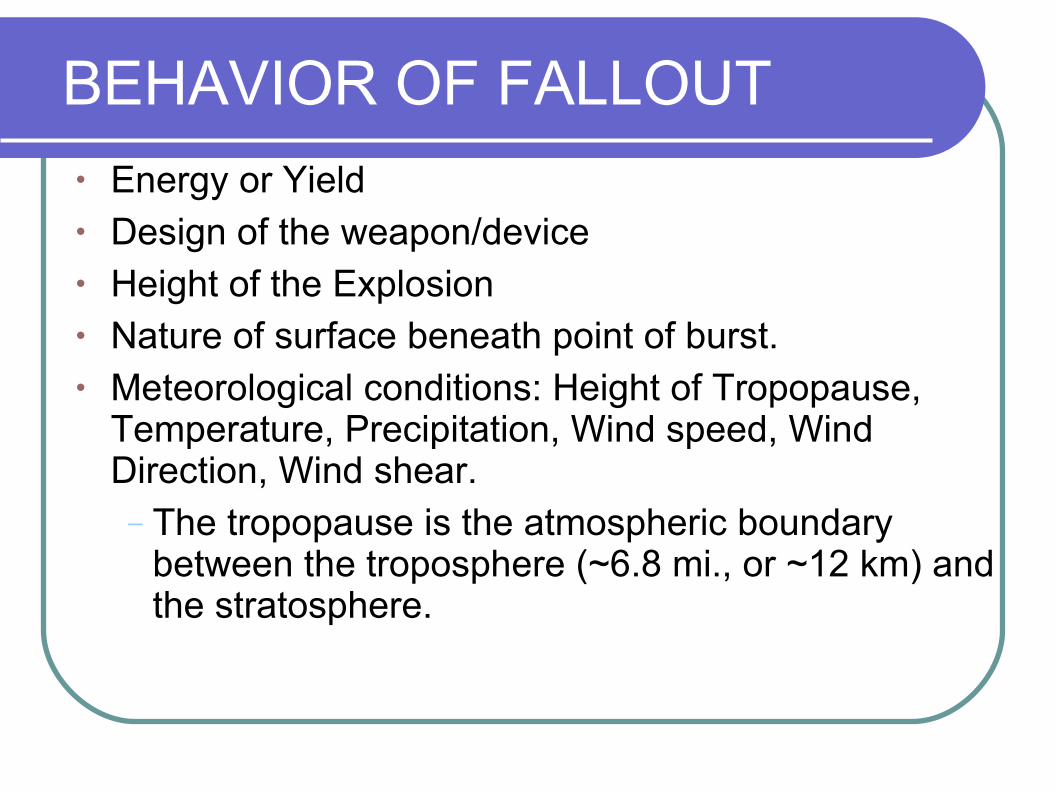
BEHAVIOR OF FALLOUT• Energy or Yield• Design of the weapon/device• Height of the Explosion• Nature of surface beneath point of burst.• Meteorological conditions: Height of Tropopause,
Temperature, Precipitation, Wind speed, Wind Direction, Wind shear.
– The tropopause is the atmospheric boundary between the troposphere (~6.8 mi., or ~12 km) and the stratosphere.
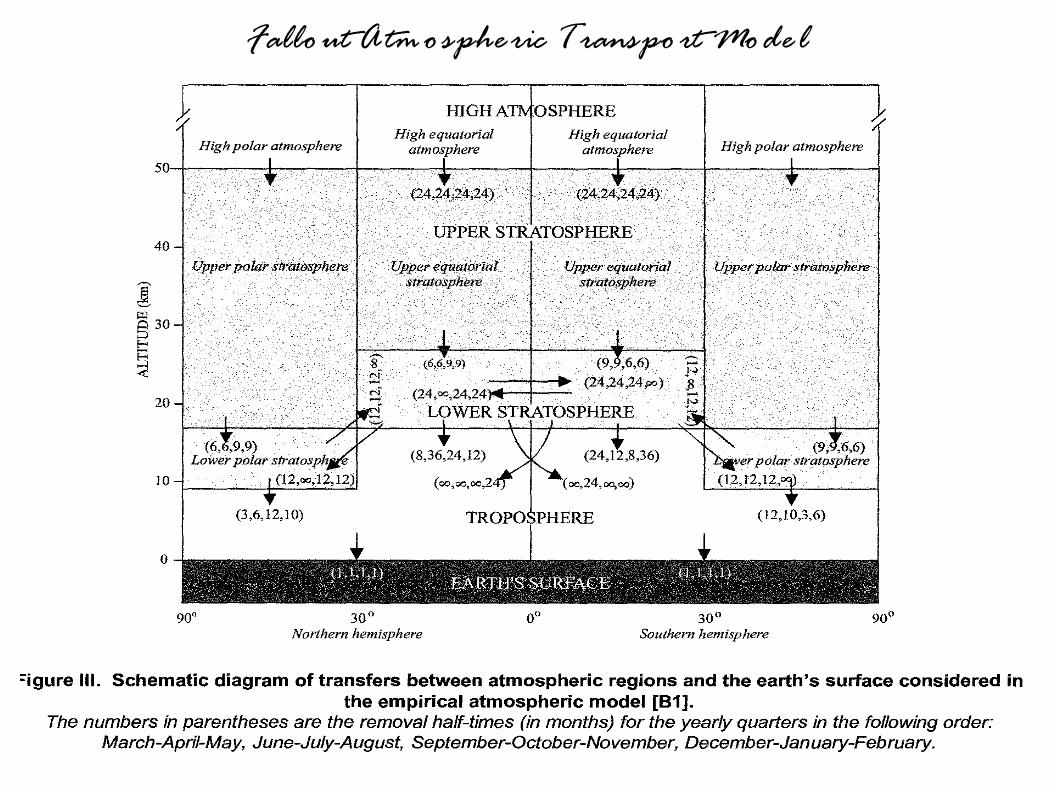
Fallo ut A tm o s phe ric T rans po rt Mo de l
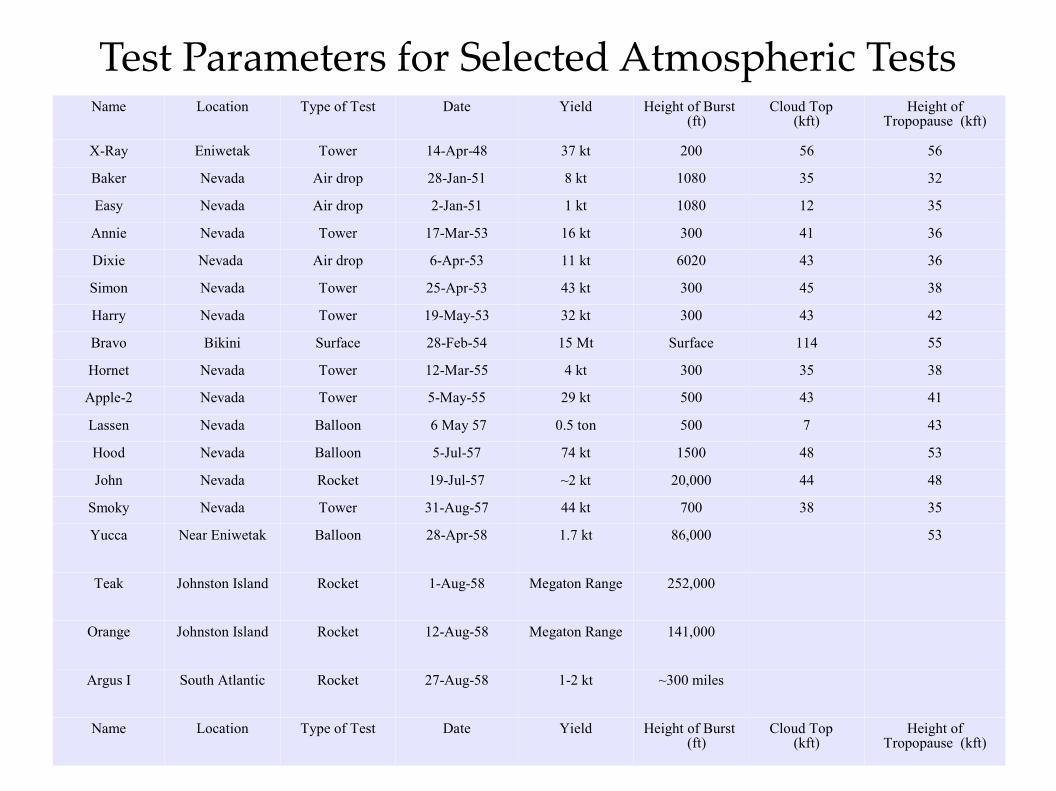
Test Parameters for Selected Atmospheric TestsName Location Type of Test Date Yield Height of Burst
(ft)Cloud Top
(kft)Height of
Tropopause (kft)
X-Ray Eniwetak Tower 14-Apr-48 37 kt 200 56 56
Baker Nevada Air drop 28-Jan-51 8 kt 1080 35 32
Easy Nevada Air drop 2-Jan-51 1 kt 1080 12 35
Annie Nevada Tower 17-Mar-53 16 kt 300 41 36
Dixie Nevada Air drop 6-Apr-53 11 kt 6020 43 36
Simon Nevada Tower 25-Apr-53 43 kt 300 45 38
Harry Nevada Tower 19-May-53 32 kt 300 43 42
Bravo Bikini Surface 28-Feb-54 15 Mt Surface 114 55
Hornet Nevada Tower 12-Mar-55 4 kt 300 35 38
Apple-2 Nevada Tower 5-May-55 29 kt 500 43 41
Lassen Nevada Balloon 6 May 57 0.5 ton 500 7 43
Hood Nevada Balloon 5-Jul-57 74 kt 1500 48 53
John Nevada Rocket 19-Jul-57 ~2 kt 20,000 44 48
Smoky Nevada Tower 31-Aug-57 44 kt 700 38 35
Yucca Near Eniwetak Balloon 28-Apr-58 1.7 kt 86,000 53
Teak Johnston Island Rocket 1-Aug-58 Megaton Range 252,000
Orange Johnston Island Rocket 12-Aug-58 Megaton Range 141,000
Argus I South Atlantic Rocket 27-Aug-58 1-2 kt ~300 miles
Name Location Type of Test Date Yield Height of Burst (ft)
Cloud Top (kft)
Height of Tropopause (kft)
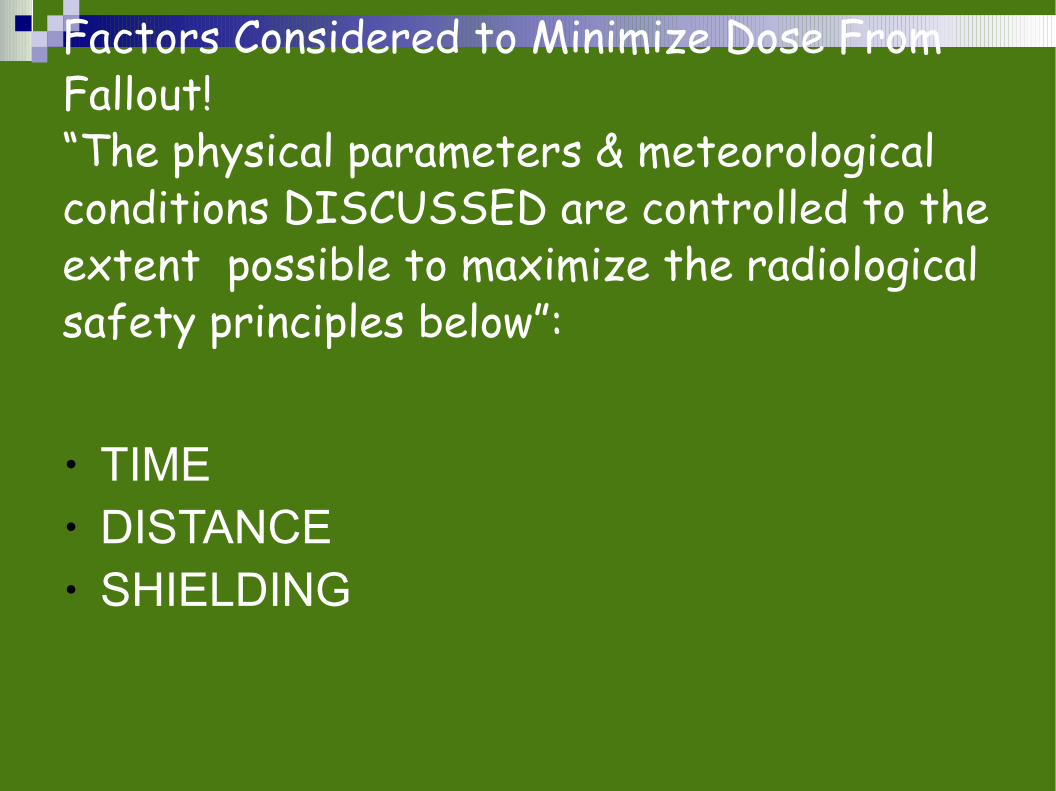
Factors Considered to Minimize Dose From Fallout!“The physical parameters & meteorological conditions DISCUSSED are controlled to the extent possible to maximize the radiological safety principles below”:
• TIME • DISTANCE • SHIELDING
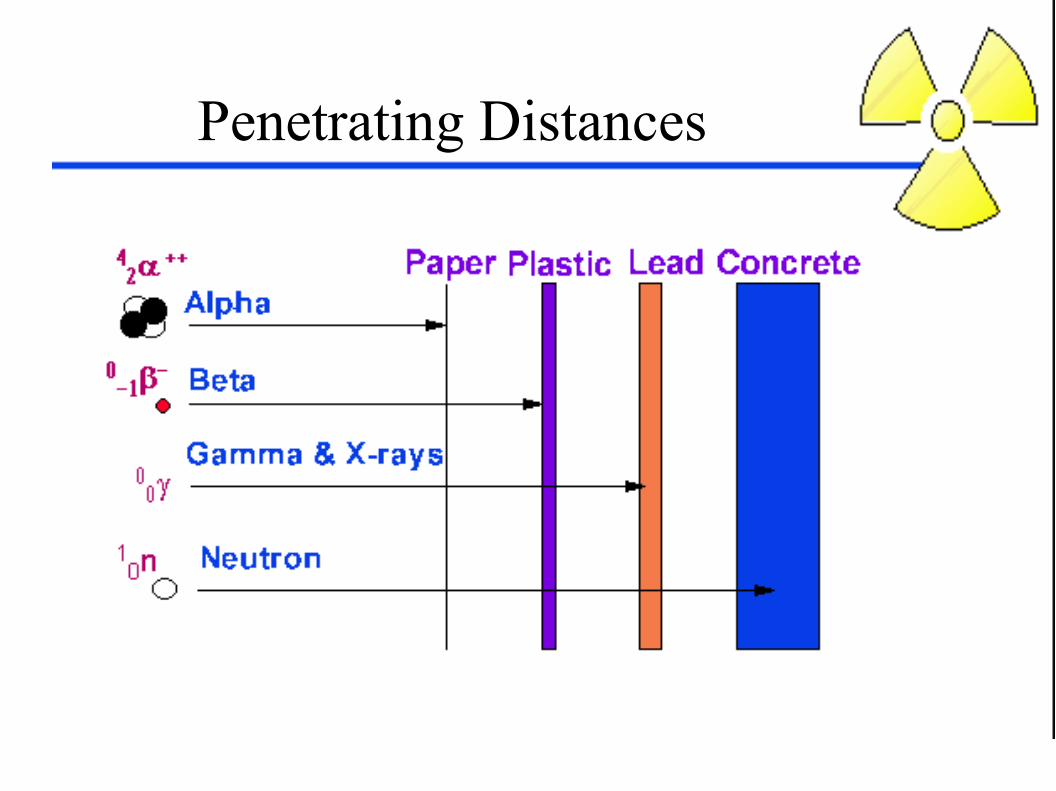
Penetrating Distances
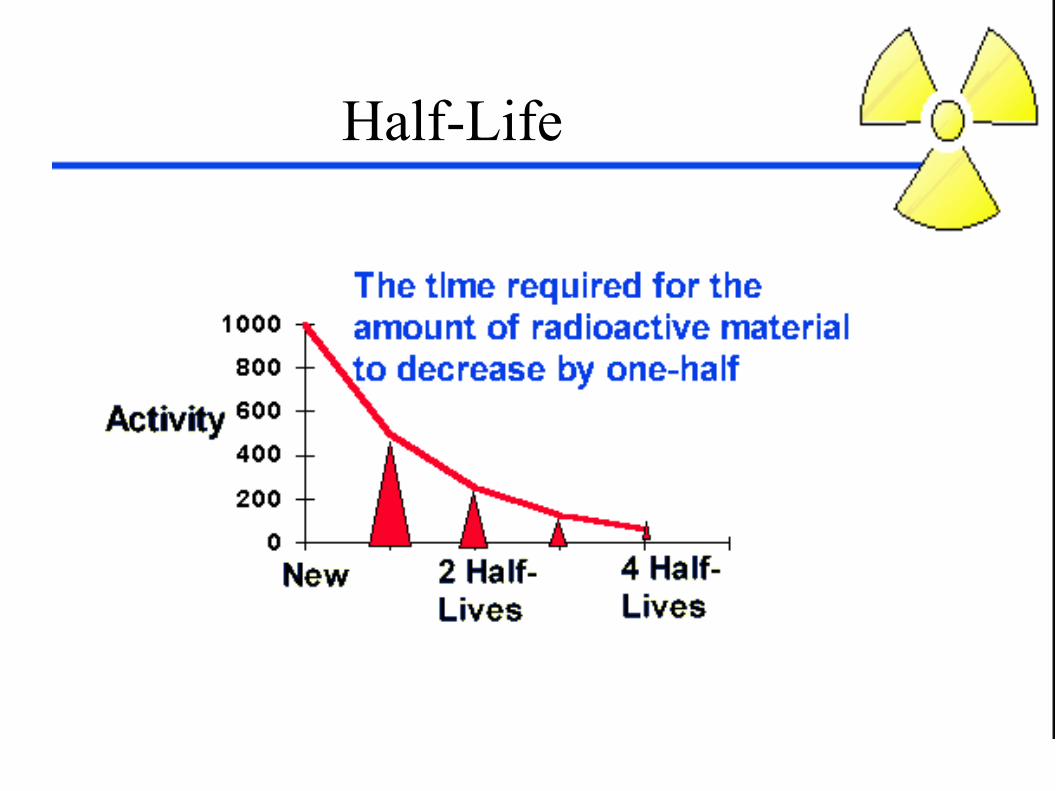
Half-Life
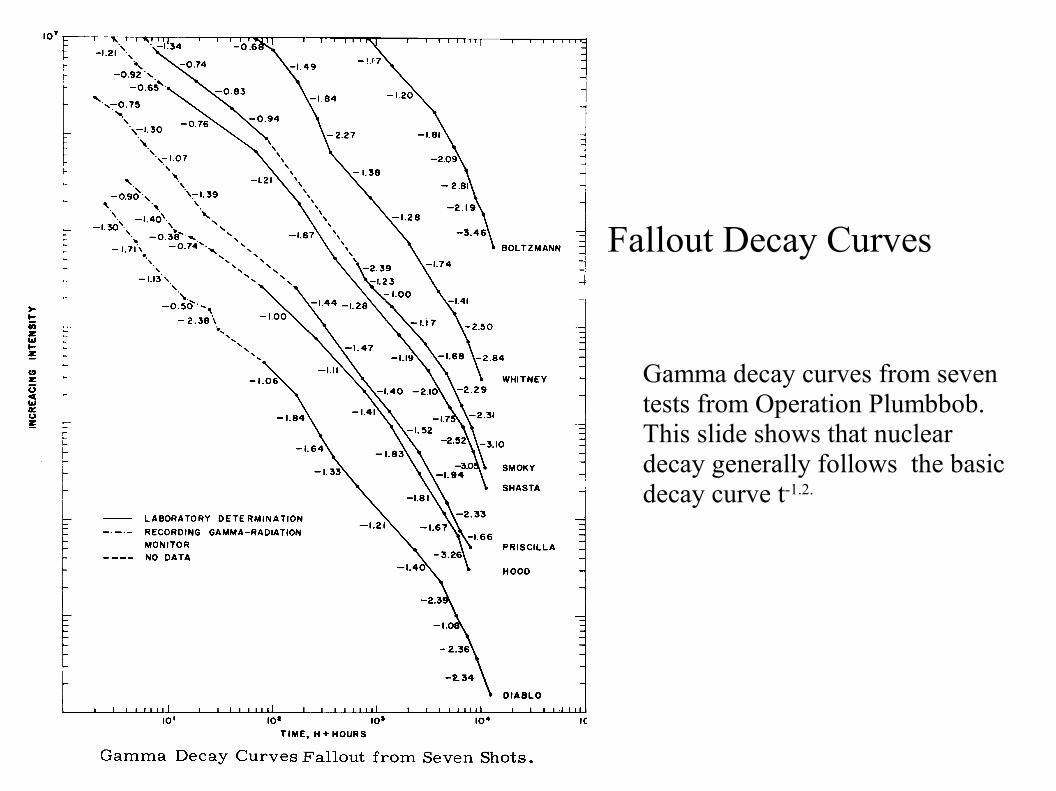
Gamma decay curves from seven tests from Operation Plumbbob. This slide shows that nuclear decay generally follows the basic decay curve t-1.2.
Fallout Decay Curves
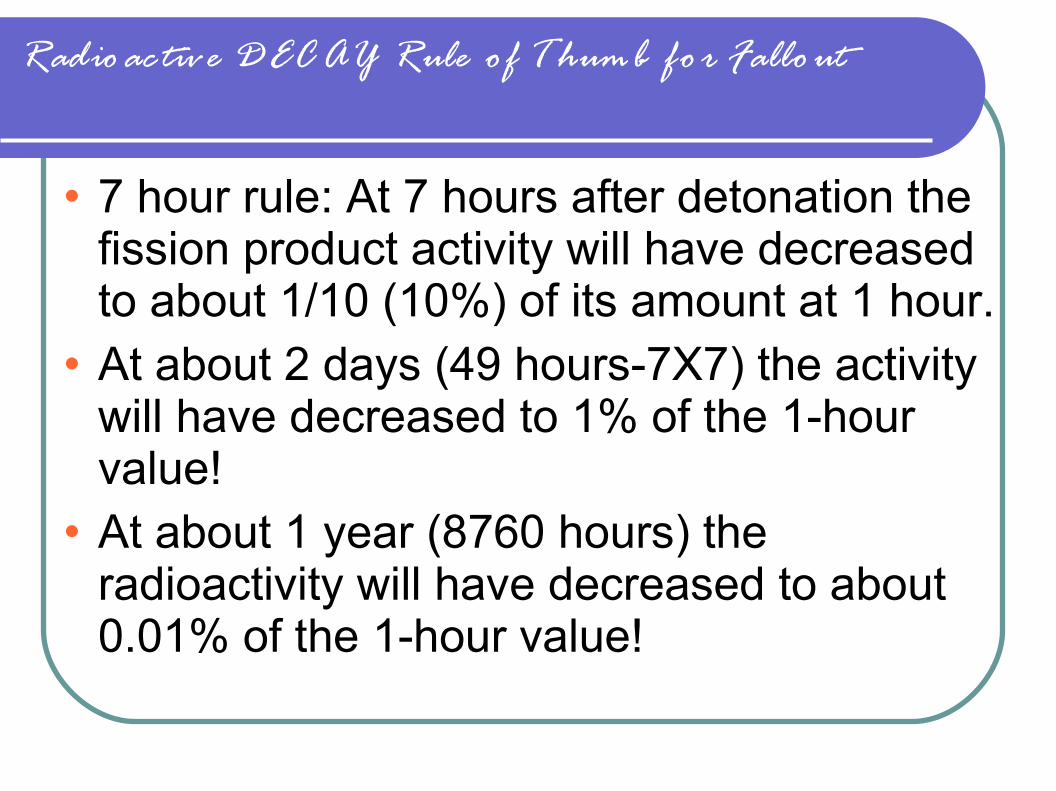
Radio ac tiv e DEC AY Rule o f T hum b f o r Fallo ut
7 hour rule: At 7 hours after detonation the fission product activity will have decreased to about 1/10 (10%) of its amount at 1 hour.
At about 2 days (49 hours-7X7) the activity will have decreased to 1% of the 1-hour value!
At about 1 year (8760 hours) the radioactivity will have decreased to about 0.01% of the 1-hour value!
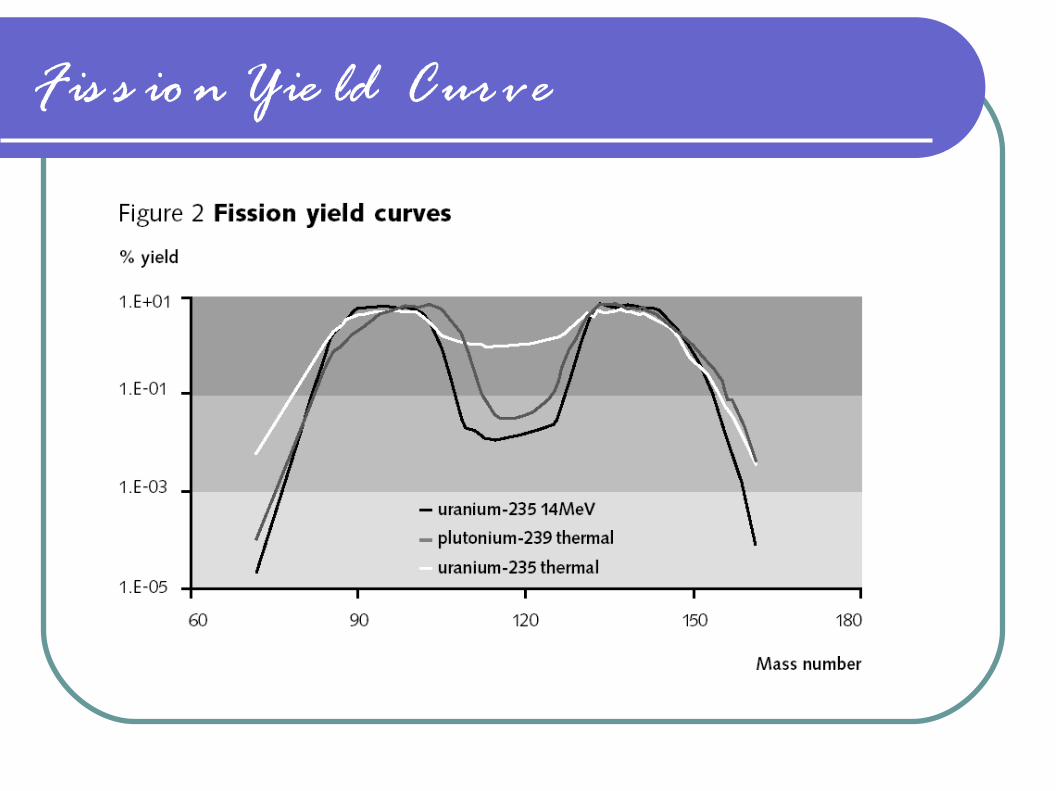
Fis s io n Y ie ld Cur v e
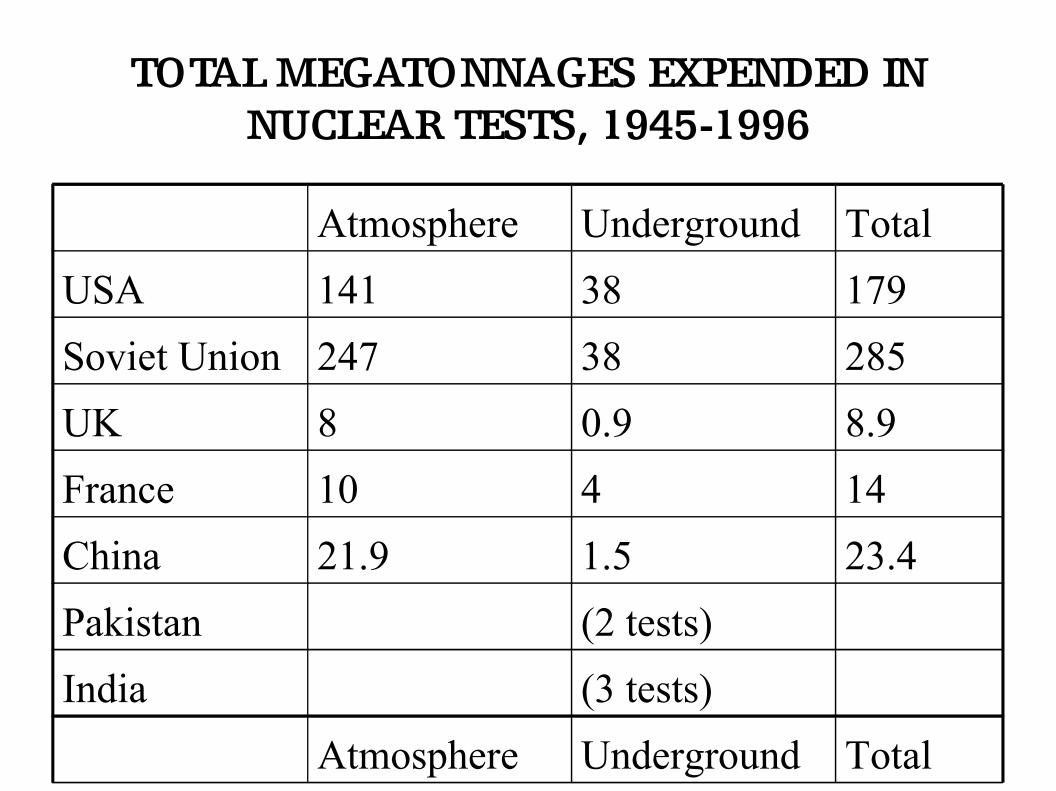
TOTAL MEGATONNAGES EXPENDED IN NUCLEAR TESTS, 1945-1996
Atmosphere Underground TotalUSA 141 38 179Soviet Union 247 38 285UK 8 0.9 8.9France 10 4 14China 21.9 1.5 23.4Pakistan (2 tests)India (3 tests)
Atmosphere Underground Total
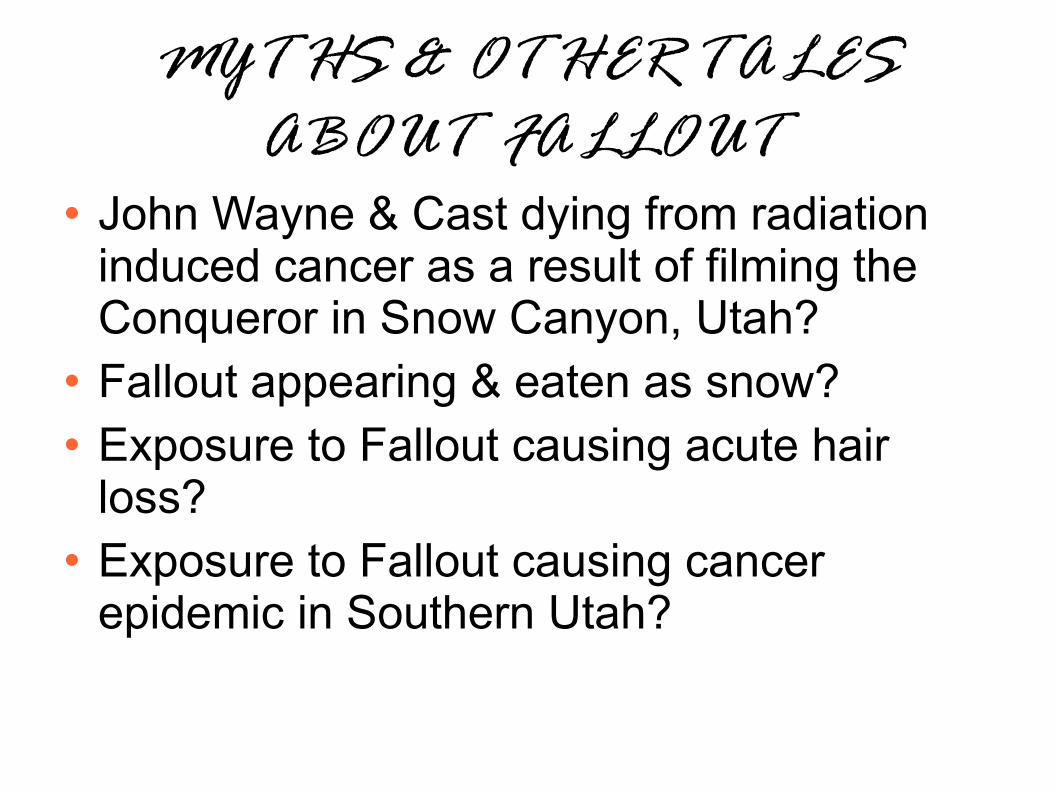
MY T HS & O T HER T ALES ABO U T FALLO U T
John Wayne & Cast dying from radiation induced cancer as a result of filming the Conqueror in Snow Canyon, Utah?
Fallout appearing & eaten as snow? Exposure to Fallout causing acute hair
loss? Exposure to Fallout causing cancer
epidemic in Southern Utah?

The John Wayne myth – a few facts!The John Wayne myth – a few facts! Conqueror filmed in Snow Canyon May-Aug. 1954!Conqueror filmed in Snow Canyon May-Aug. 1954! There was There was NONO nuclear weapons testing in Nevada in nuclear weapons testing in Nevada in
1954!1954! Dick Powell, Pedro Armendariz, Agnes Moorehead, Dick Powell, Pedro Armendariz, Agnes Moorehead,
Susan Hayward all dead by 1975. JOHN WAYNE Susan Hayward all dead by 1975. JOHN WAYNE diagnosed w/ lung cancer Sept., 1964, died from diagnosed w/ lung cancer Sept., 1964, died from stomach cancer 1979!stomach cancer 1979!
All heavy smokers, John Wayne smoked 5 packs a day!All heavy smokers, John Wayne smoked 5 packs a day! People Magazine People Magazine stated in an article on Nov. 10, 1980 stated in an article on Nov. 10, 1980
that “Of The Conqueror's 220 cast & crew members that “Of The Conqueror's 220 cast & crew members from Hollywood, an astonishing 91 have contracted from Hollywood, an astonishing 91 have contracted cancer.” There was NO mention of smoking!cancer.” There was NO mention of smoking!
The National Cancer Institute states that “the overall The National Cancer Institute states that “the overall incidence of being diagnosed with cancer in a person's incidence of being diagnosed with cancer in a person's lifetime is about 40%.” Thus in a cohort of 220 people, lifetime is about 40%.” Thus in a cohort of 220 people, 88 would be diagnosed with cancer at some point! At 88 would be diagnosed with cancer at some point! At 91 this would be within the expected range.91 this would be within the expected range.
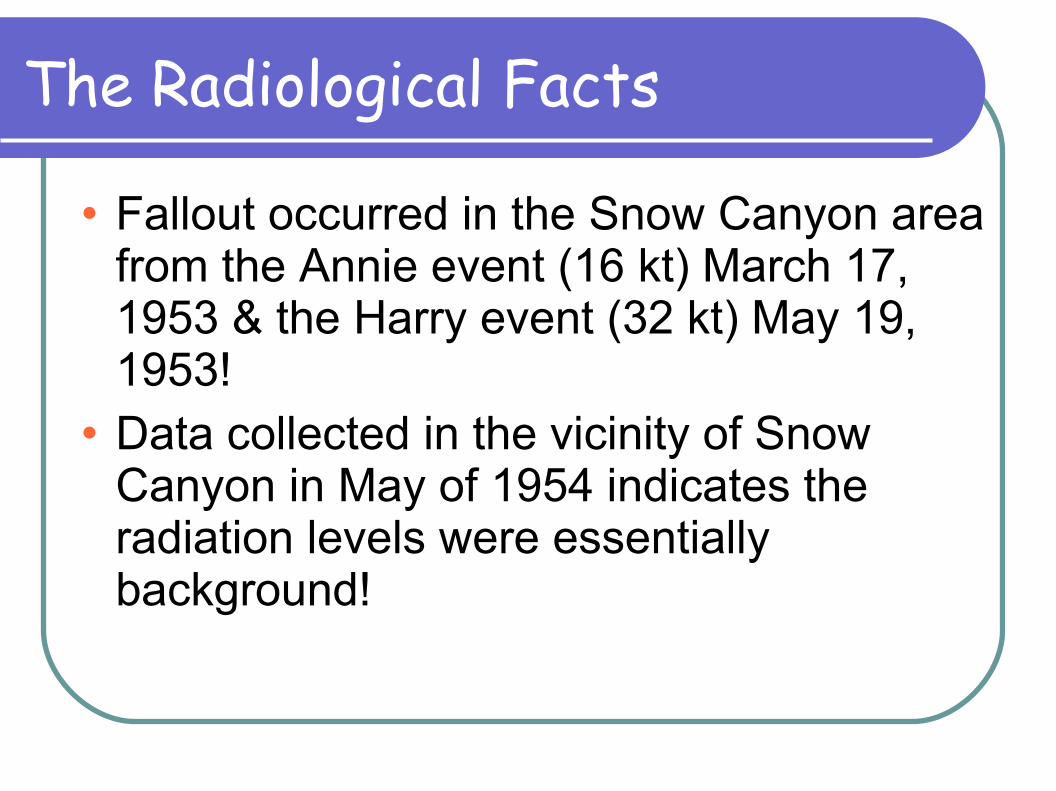
The Radiological Facts
Fallout occurred in the Snow Canyon area from the Annie event (16 kt) March 17, 1953 & the Harry event (32 kt) May 19, 1953!
Data collected in the vicinity of Snow Canyon in May of 1954 indicates the radiation levels were essentially background!
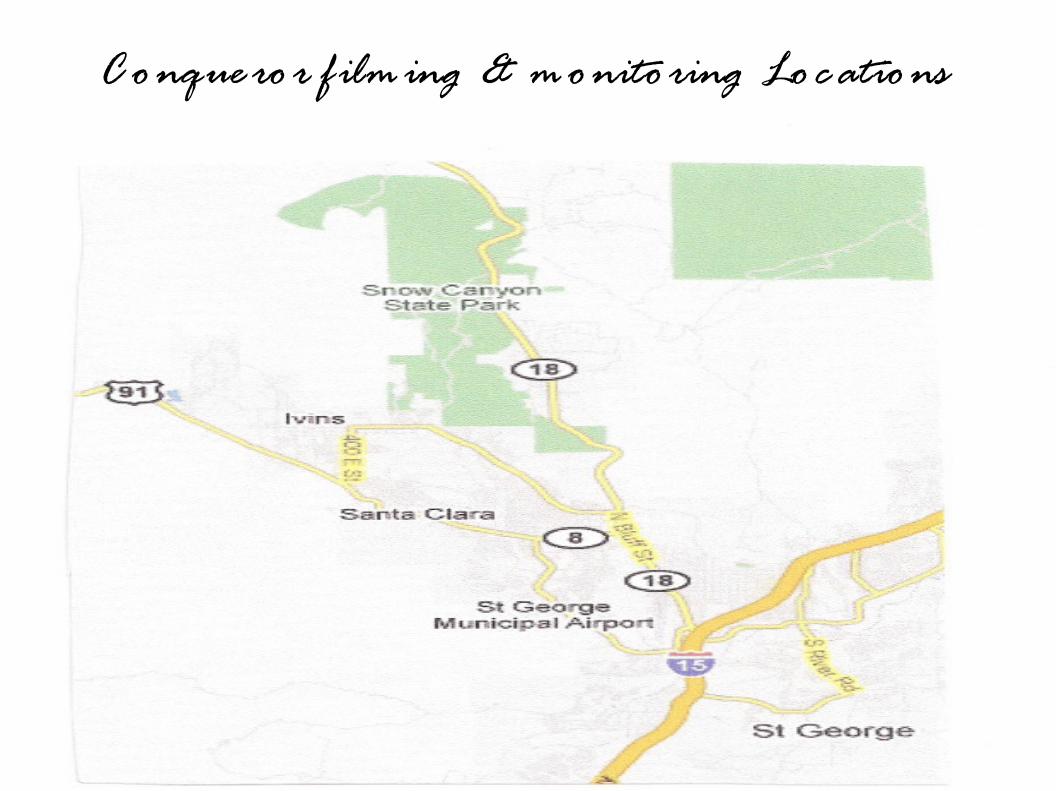
C o nque ro r f ilm ing & m o nito ring Lo c atio ns
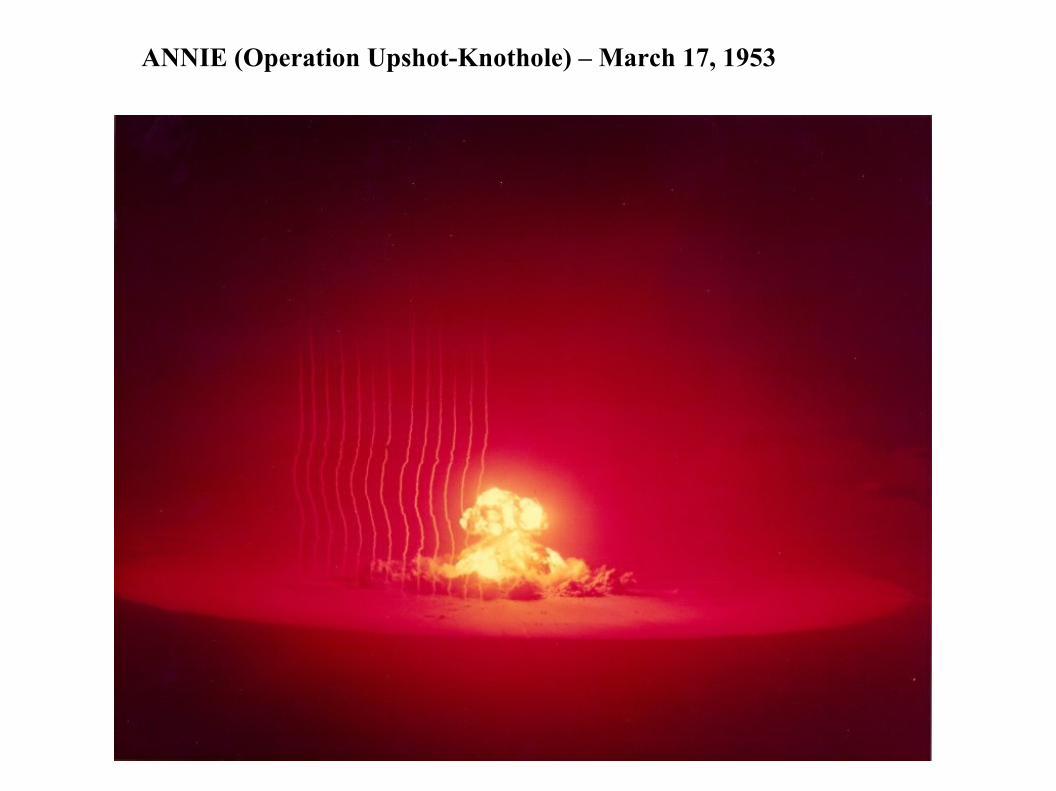
ANNIE (Operation Upshot-Knothole) – March 17, 1953
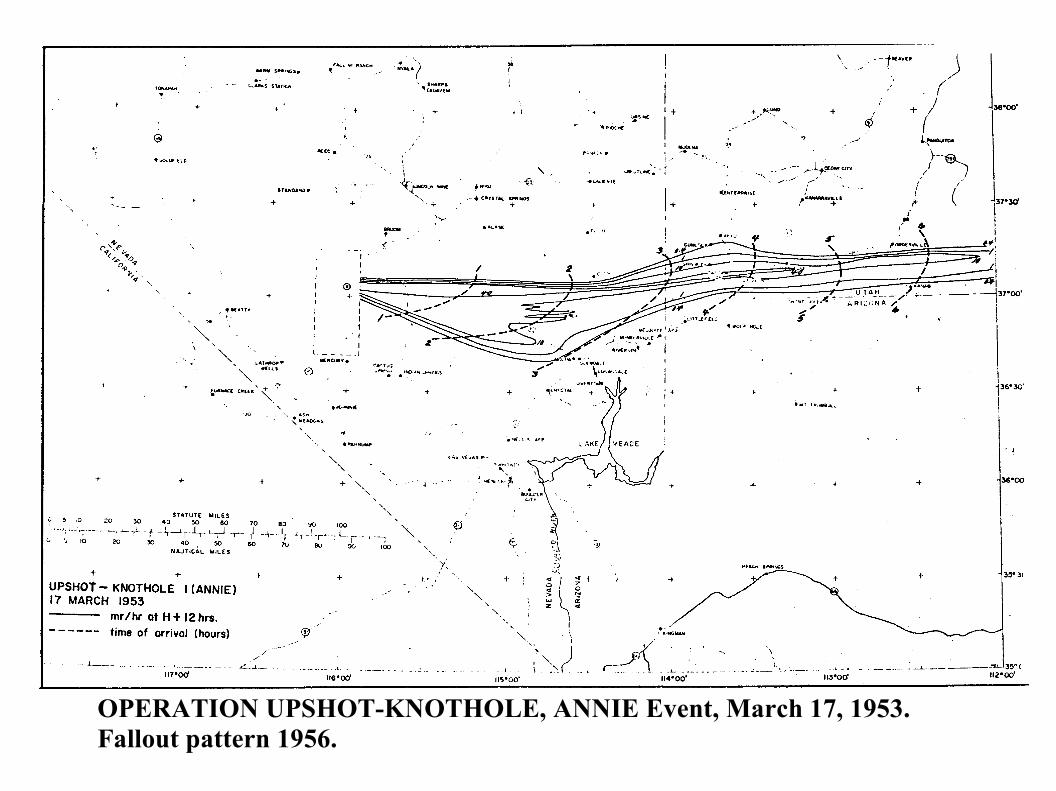
OPERATION UPSHOT-KNOTHOLE, ANNIE Event, March 17, 1953. Fallout pattern 1956.
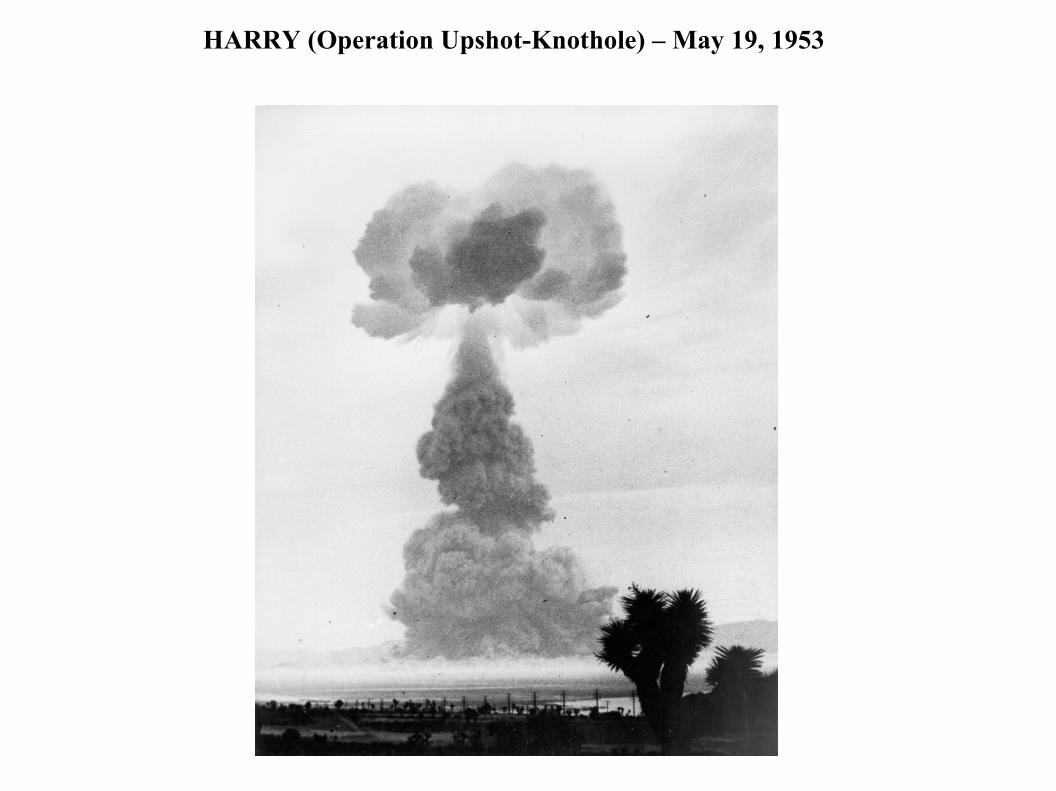
HARRY (Operation Upshot-Knothole) – May 19, 1953
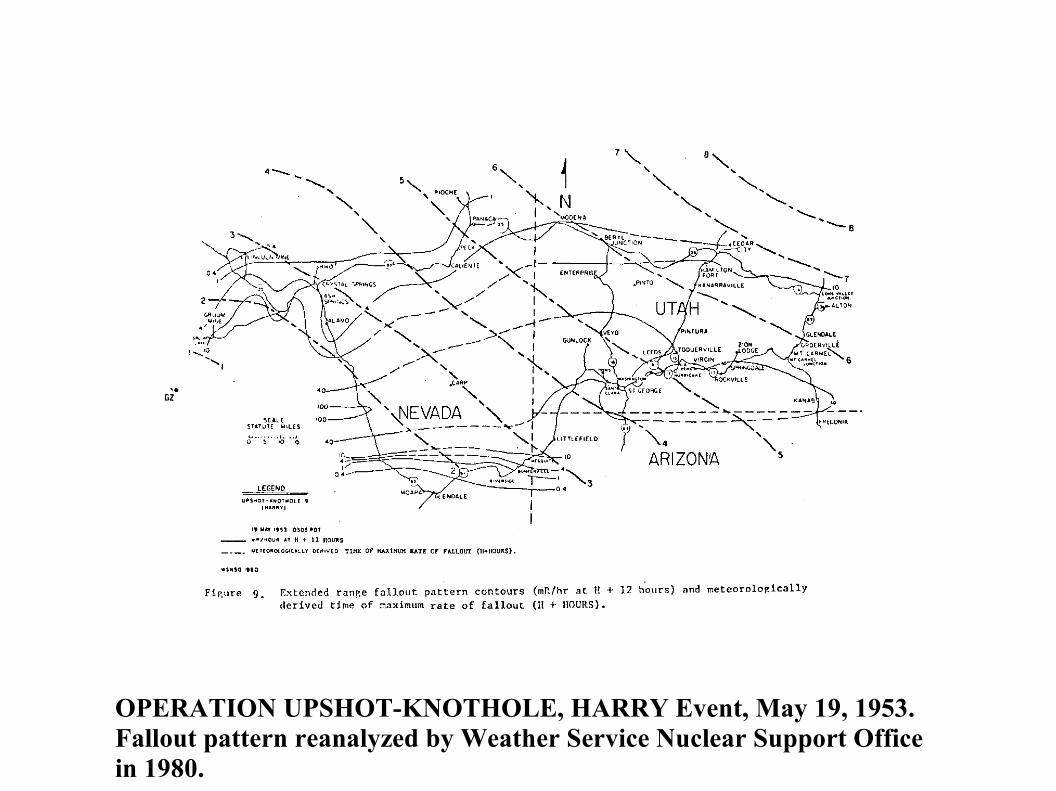
OPERATION UPSHOT-KNOTHOLE, HARRY Event, May 19, 1953. Fallout pattern reanalyzed by Weather Service Nuclear Support Office in 1980.
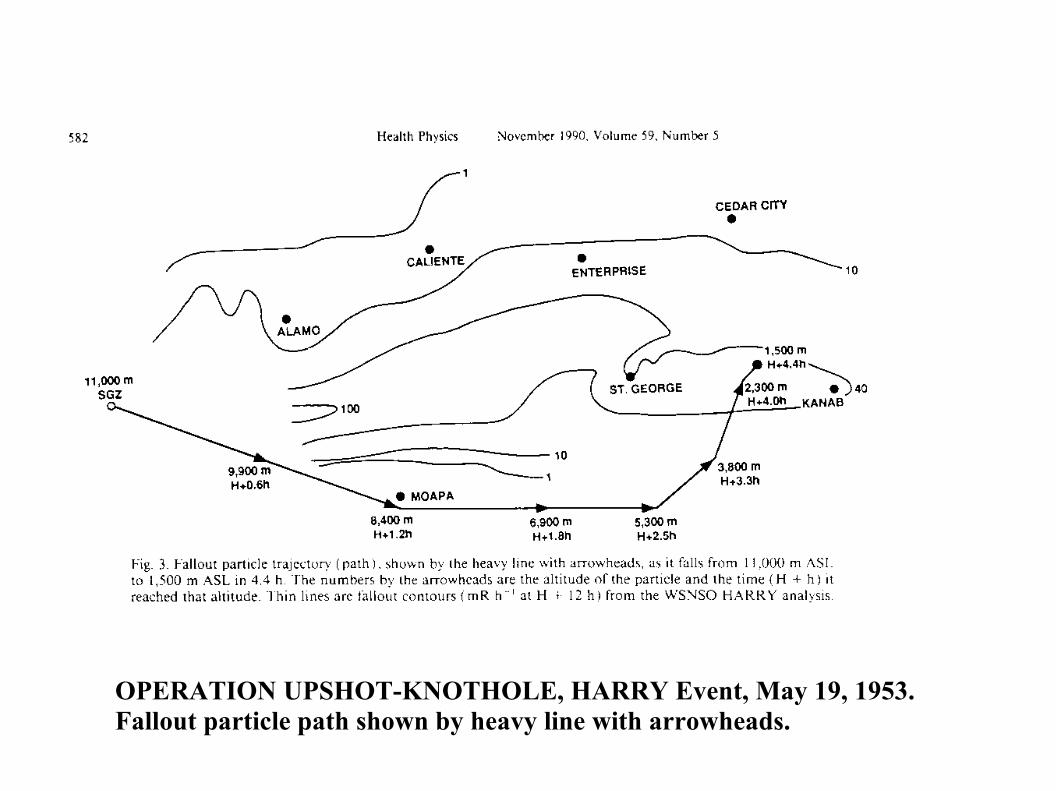
OPERATION UPSHOT-KNOTHOLE, HARRY Event, May 19, 1953. Fallout particle path shown by heavy line with arrowheads.
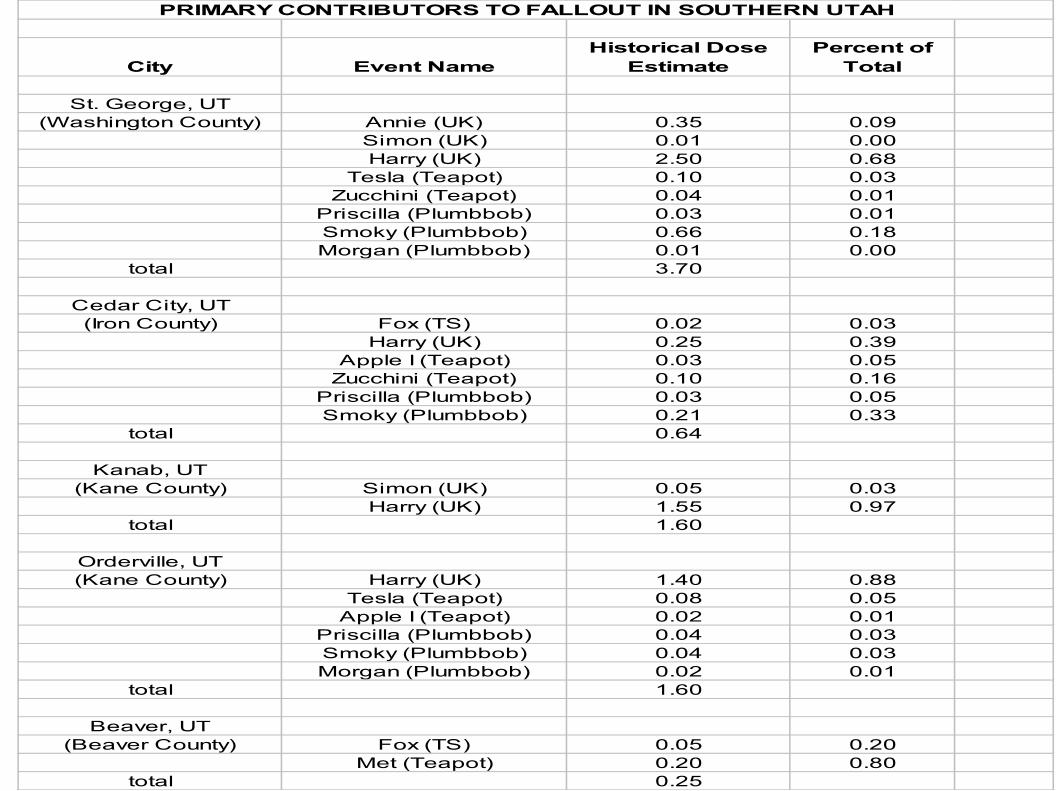
City Event NameHistorical Dose
EstimatePercent of
Total
St. George, UT(Washington County) Annie (UK) 0.35 0.09
Simon (UK) 0.01 0.00Harry (UK) 2.50 0.68
Tesla (Teapot) 0.10 0.03Zucchini (Teapot) 0.04 0.01
Priscilla (Plumbbob) 0.03 0.01Smoky (Plumbbob) 0.66 0.18Morgan (Plumbbob) 0.01 0.00
total 3.70
Cedar City, UT(Iron County) Fox (TS) 0.02 0.03
Harry (UK) 0.25 0.39Apple I (Teapot) 0.03 0.05
Zucchini (Teapot) 0.10 0.16Priscilla (Plumbbob) 0.03 0.05Smoky (Plumbbob) 0.21 0.33
total 0.64
Kanab, UT(Kane County) Simon (UK) 0.05 0.03
Harry (UK) 1.55 0.97total 1.60
Orderville, UT(Kane County) Harry (UK) 1.40 0.88
Tesla (Teapot) 0.08 0.05Apple I (Teapot) 0.02 0.01
Priscilla (Plumbbob) 0.04 0.03Smoky (Plumbbob) 0.04 0.03Morgan (Plumbbob) 0.02 0.01
total 1.60
Beaver, UT(Beaver County) Fox (TS) 0.05 0.20
Met (Teapot) 0.20 0.80total 0.25
PRIMARY CONTRIBUTORS TO FALLOUT IN SOUTHERN UTAH
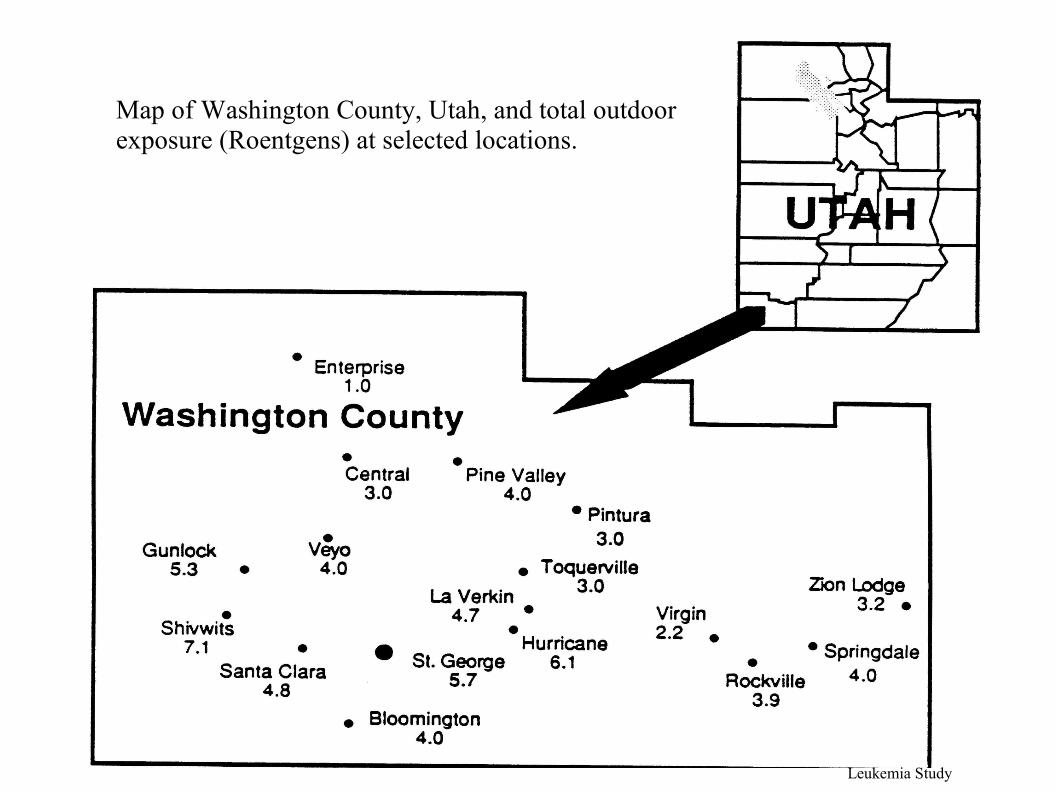
Map of Washington County, Utah, and total outdoor exposure (Roentgens) at selected locations.
Leukemia Study
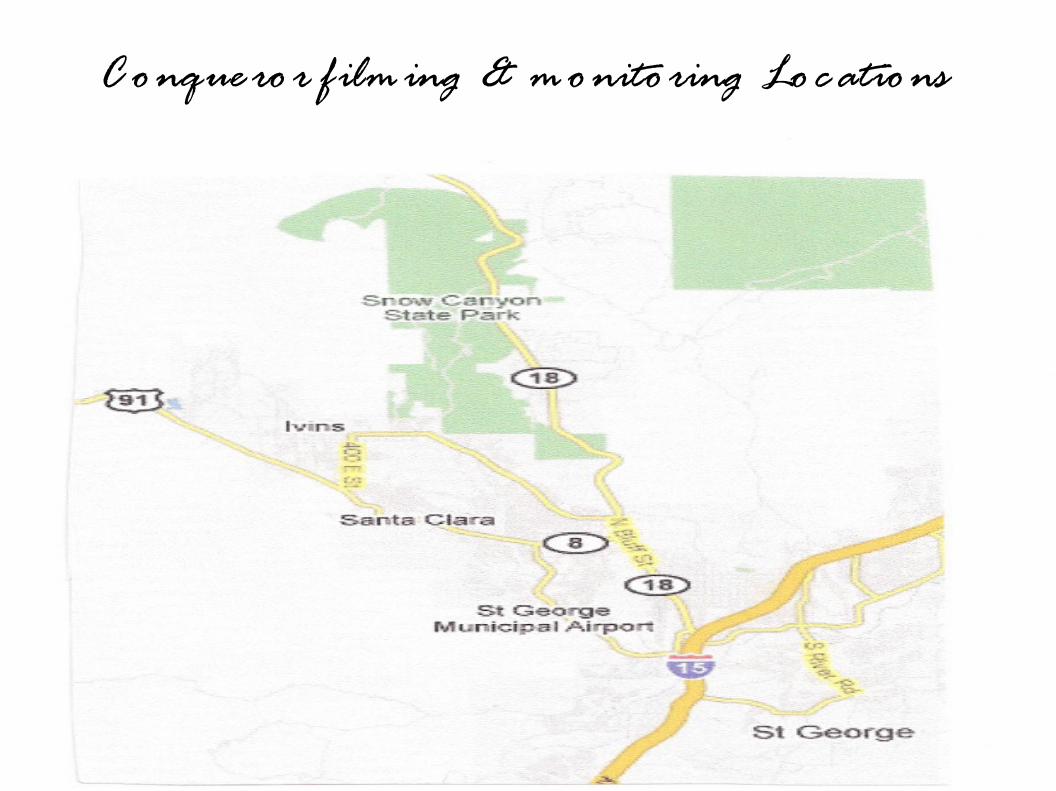
C o nque ro r f ilm ing & m o nito ring Lo c atio ns
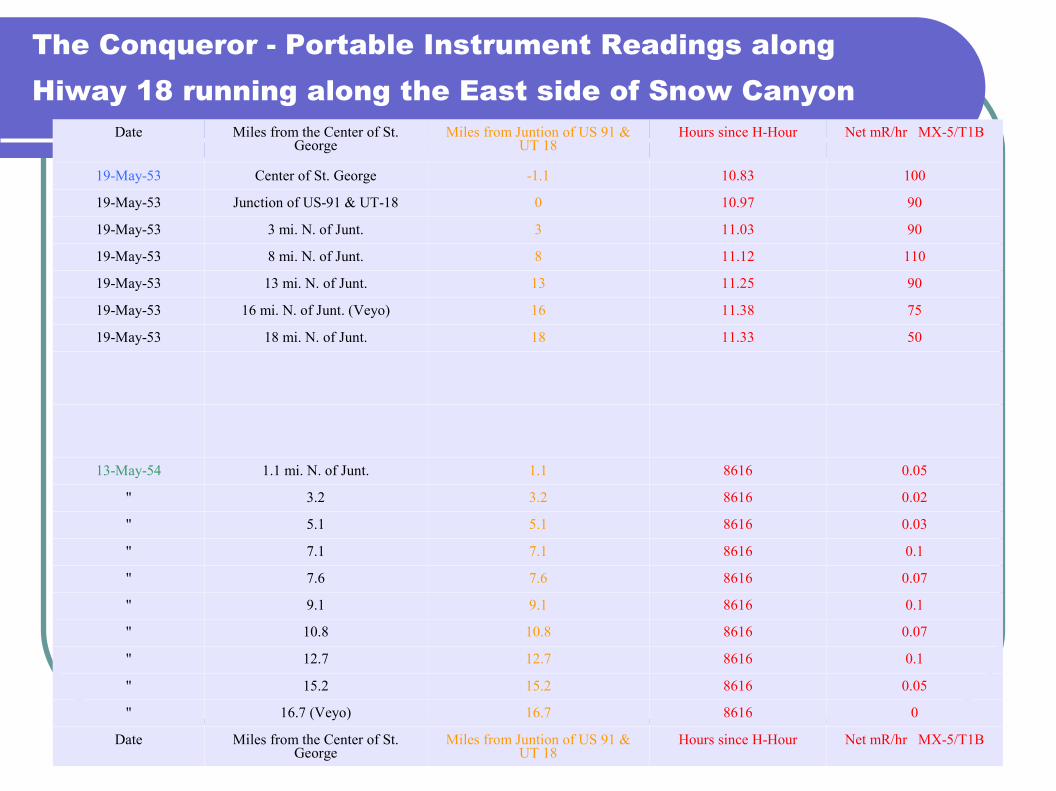
The Conqueror - Portable Instrument Readings along Hiway 18 running along the East side of Snow Canyon
Date Miles from the Center of St. George
Miles from Juntion of US 91 & UT 18
Hours since H-Hour Net mR/hr MX-5/T1B
19-May-53 Center of St. George -1.1 10.83 100
19-May-53 Junction of US-91 & UT-18 0 10.97 90
19-May-53 3 mi. N. of Junt. 3 11.03 90
19-May-53 8 mi. N. of Junt. 8 11.12 110
19-May-53 13 mi. N. of Junt. 13 11.25 90
19-May-53 16 mi. N. of Junt. (Veyo) 16 11.38 75
19-May-53 18 mi. N. of Junt. 18 11.33 50
13-May-54 1.1 mi. N. of Junt. 1.1 8616 0.05
" 3.2 3.2 8616 0.02
" 5.1 5.1 8616 0.03
" 7.1 7.1 8616 0.1
" 7.6 7.6 8616 0.07
" 9.1 9.1 8616 0.1
" 10.8 10.8 8616 0.07
" 12.7 12.7 8616 0.1
" 15.2 15.2 8616 0.05
" 16.7 (Veyo) 16.7 8616 0
Date Miles from the Center of St. George
Miles from Juntion of US 91 & UT 18
Hours since H-Hour Net mR/hr MX-5/T1B
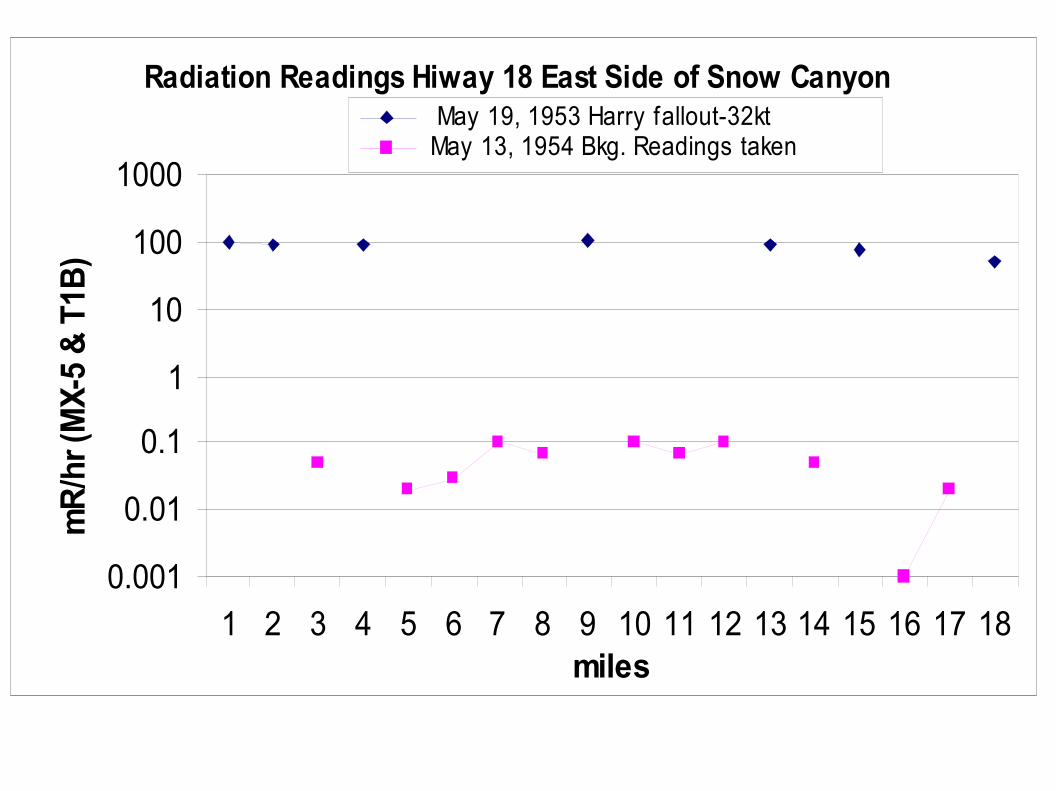
Radiation Readings Hiway 18 East Side of Snow Canyon
0.001
0.01
0.1
1
10
100
1000
1 2 3 4 5 6 7 8 9 10 11 12 13 14 15 16 17 18miles
mR/
hr (M
X-5
& T1
B) May 19, 1953 Harry fallout-32kt May 13, 1954 Bkg. Readings taken
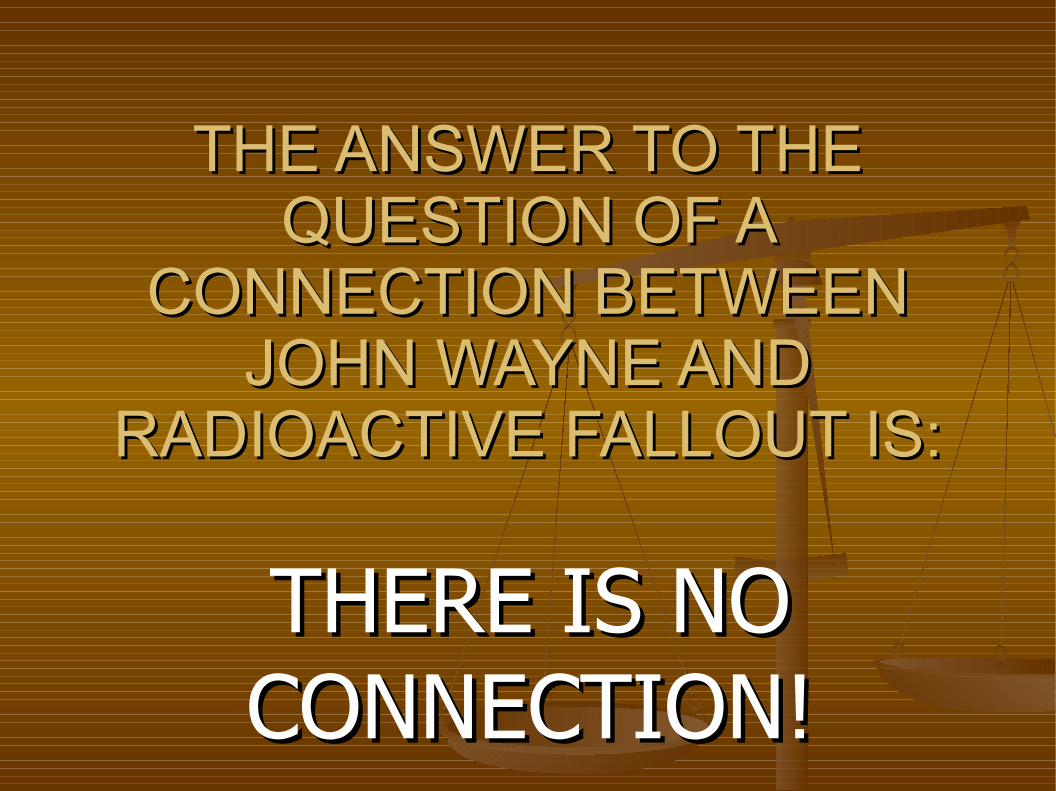
THE ANSWER TO THE THE ANSWER TO THE QUESTION OF A QUESTION OF A
CONNECTION BETWEEN CONNECTION BETWEEN JOHN WAYNE AND JOHN WAYNE AND
RADIOACTIVE FALLOUT IS:RADIOACTIVE FALLOUT IS:
THERE IS NO THERE IS NO CONNECTION!CONNECTION!
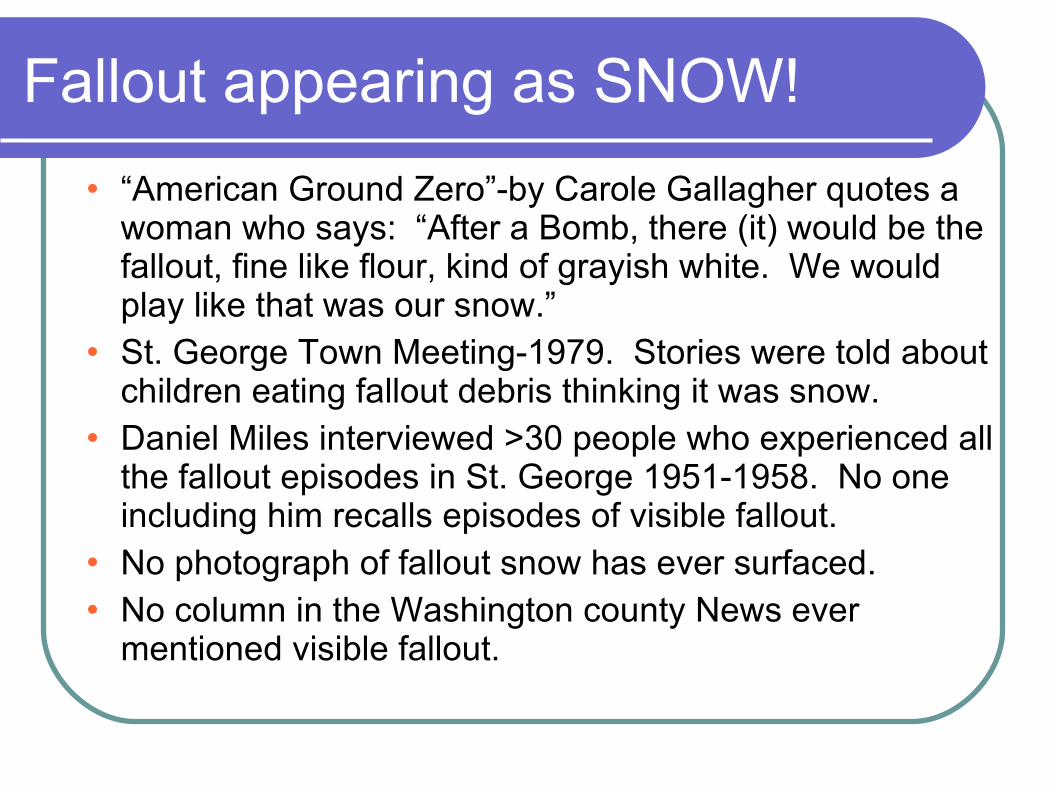
Fallout appearing as SNOW! “American Ground Zero”-by Carole Gallagher quotes a
woman who says: “After a Bomb, there (it) would be the fallout, fine like flour, kind of grayish white. We would play like that was our snow.”
St. George Town Meeting-1979. Stories were told about children eating fallout debris thinking it was snow.
Daniel Miles interviewed >30 people who experienced all the fallout episodes in St. George 1951-1958. No one including him recalls episodes of visible fallout.
No photograph of fallout snow has ever surfaced. No column in the Washington county News ever
mentioned visible fallout.
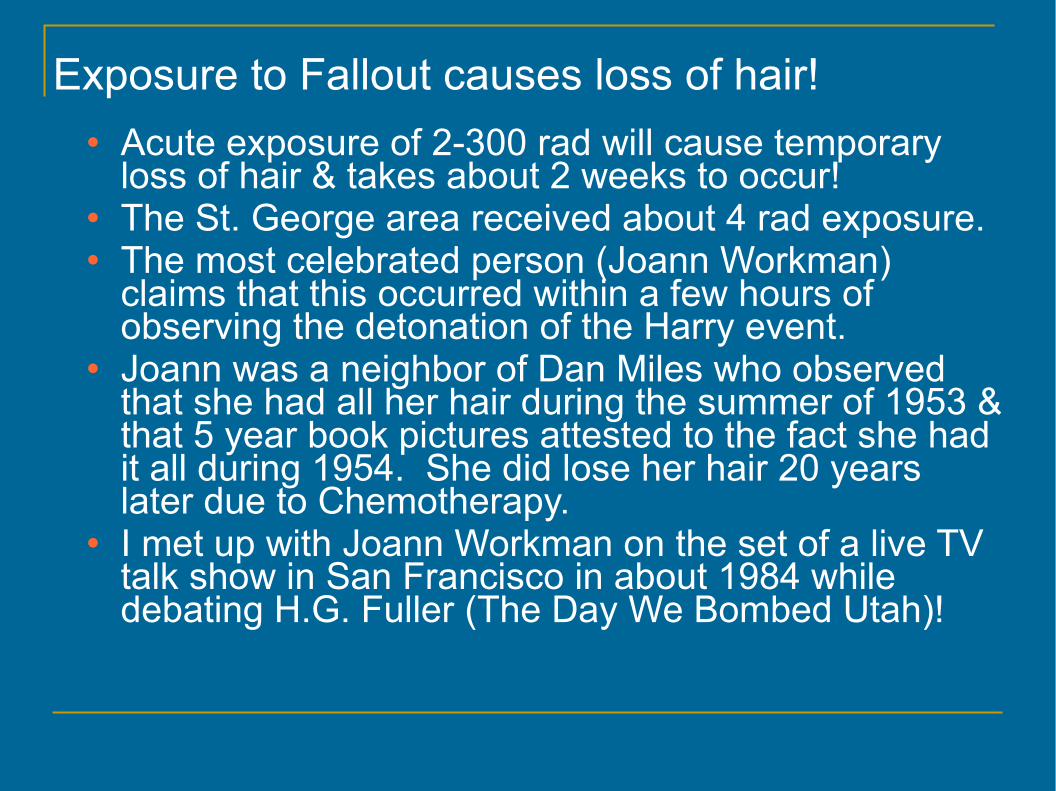
Exposure to Fallout causes loss of hair! Acute exposure of 2-300 rad will cause temporary
loss of hair & takes about 2 weeks to occur! The St. George area received about 4 rad exposure. The most celebrated person (Joann Workman)
claims that this occurred within a few hours of observing the detonation of the Harry event.
Joann was a neighbor of Dan Miles who observed that she had all her hair during the summer of 1953 & that 5 year book pictures attested to the fact she had it all during 1954. She did lose her hair 20 years later due to Chemotherapy.
I met up with Joann Workman on the set of a live TV talk show in San Francisco in about 1984 while debating H.G. Fuller (The Day We Bombed Utah)!
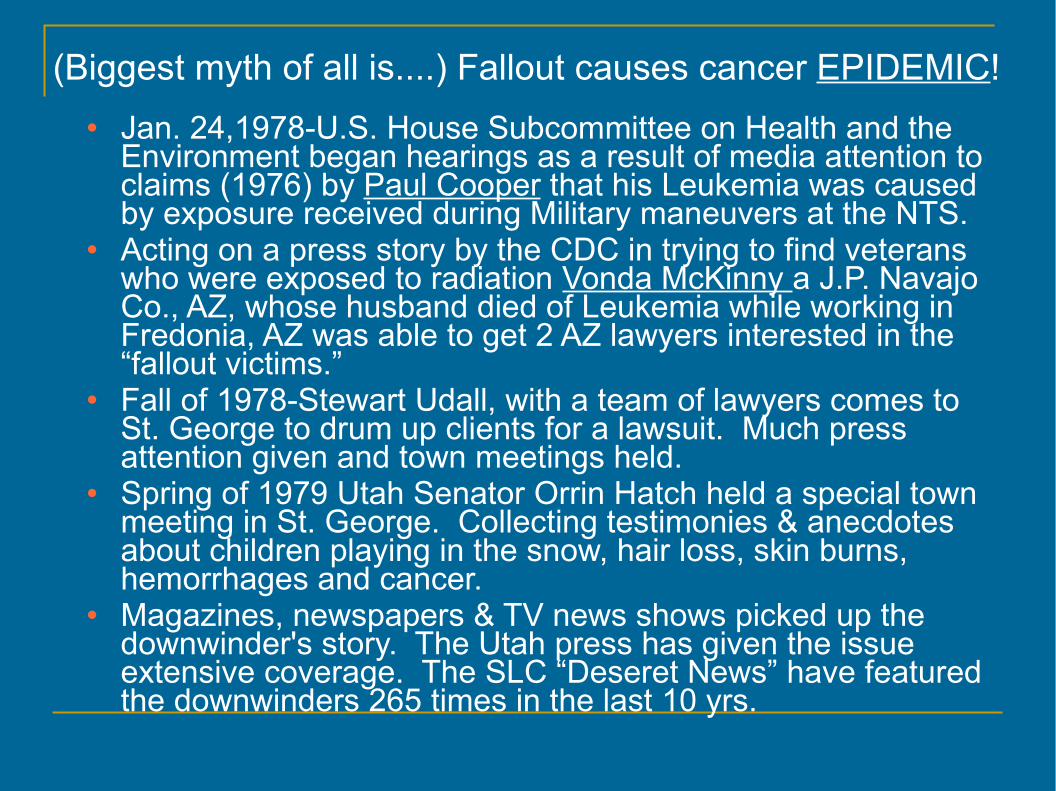
(Biggest myth of all is....) Fallout causes cancer EPIDEMIC! Jan. 24,1978-U.S. House Subcommittee on Health and the
Environment began hearings as a result of media attention to claims (1976) by Paul Cooper that his Leukemia was caused by exposure received during Military maneuvers at the NTS.
Acting on a press story by the CDC in trying to find veterans who were exposed to radiation Vonda McKinny a J.P. Navajo Co., AZ, whose husband died of Leukemia while working in Fredonia, AZ was able to get 2 AZ lawyers interested in the “fallout victims.”
Fall of 1978-Stewart Udall, with a team of lawyers comes to St. George to drum up clients for a lawsuit. Much press attention given and town meetings held.
Spring of 1979 Utah Senator Orrin Hatch held a special town meeting in St. George. Collecting testimonies & anecdotes about children playing in the snow, hair loss, skin burns, hemorrhages and cancer.
Magazines, newspapers & TV news shows picked up the downwinder's story. The Utah press has given the issue extensive coverage. The SLC “Deseret News” have featured the downwinders 265 times in the last 10 yrs.
(Biggest myth of all is....) Fallout causes cancer EPIDEMIC! Continued
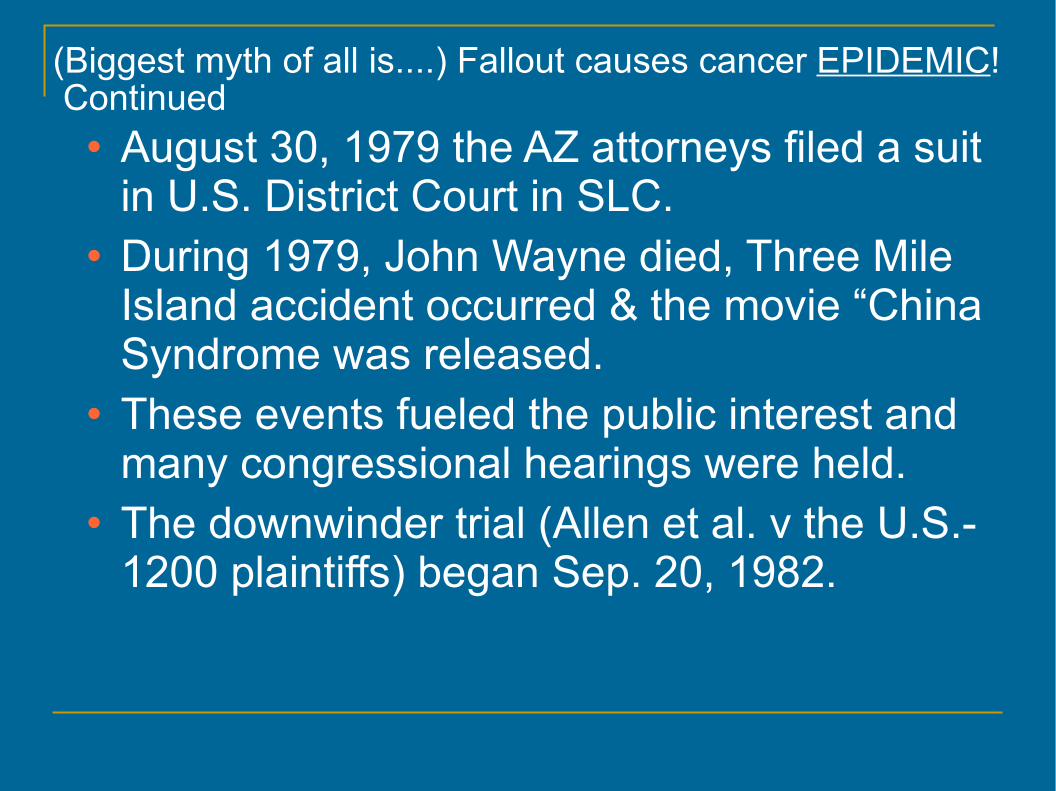
August 30, 1979 the AZ attorneys filed a suit in U.S. District Court in SLC.
During 1979, John Wayne died, Three Mile Island accident occurred & the movie “China Syndrome was released.
These events fueled the public interest and many congressional hearings were held.
The downwinder trial (Allen et al. v the U.S.-1200 plaintiffs) began Sep. 20, 1982.
(Biggest myth of all is....) Fallout causes cancer EPIDEMIC! Continued
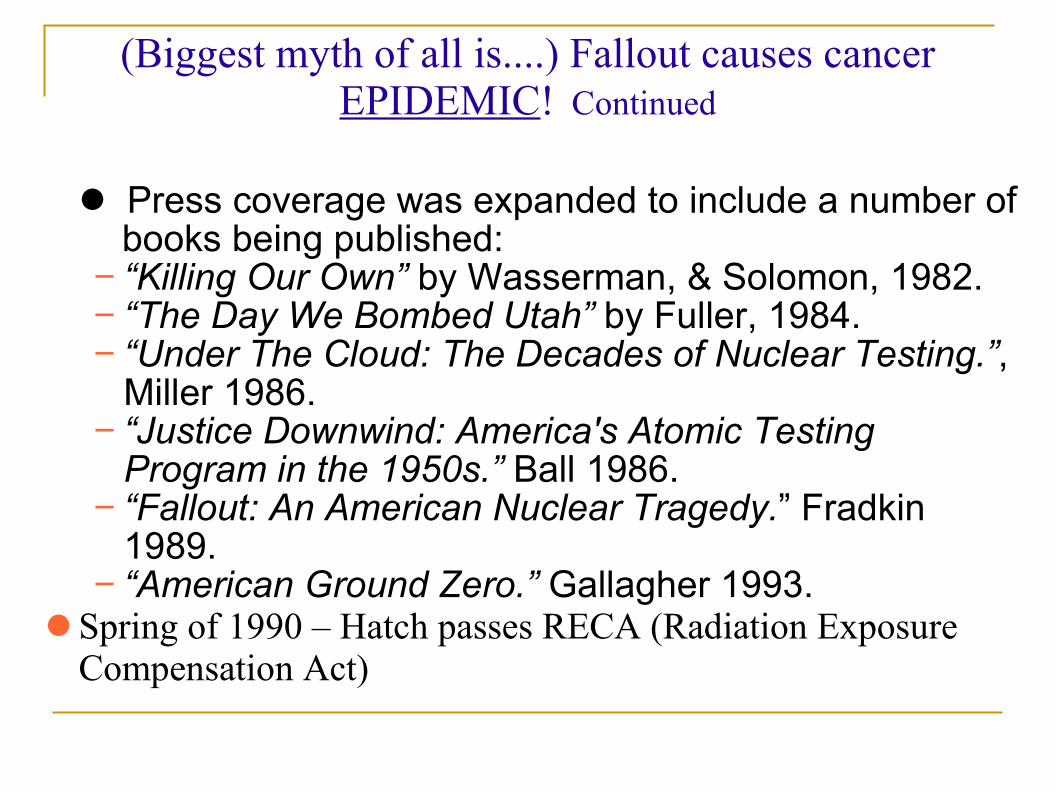
Press coverage was expanded to include a number of books being published:− “Killing Our Own” by Wasserman, & Solomon, 1982.− “The Day We Bombed Utah” by Fuller, 1984.− “Under The Cloud: The Decades of Nuclear Testing.”,
Miller 1986.− “Justice Downwind: America's Atomic Testing
Program in the 1950s.” Ball 1986.− “Fallout: An American Nuclear Tragedy.” Fradkin
1989.− “American Ground Zero.” Gallagher 1993.
Spring of 1990 – Hatch passes RECA (Radiation Exposure Compensation Act)
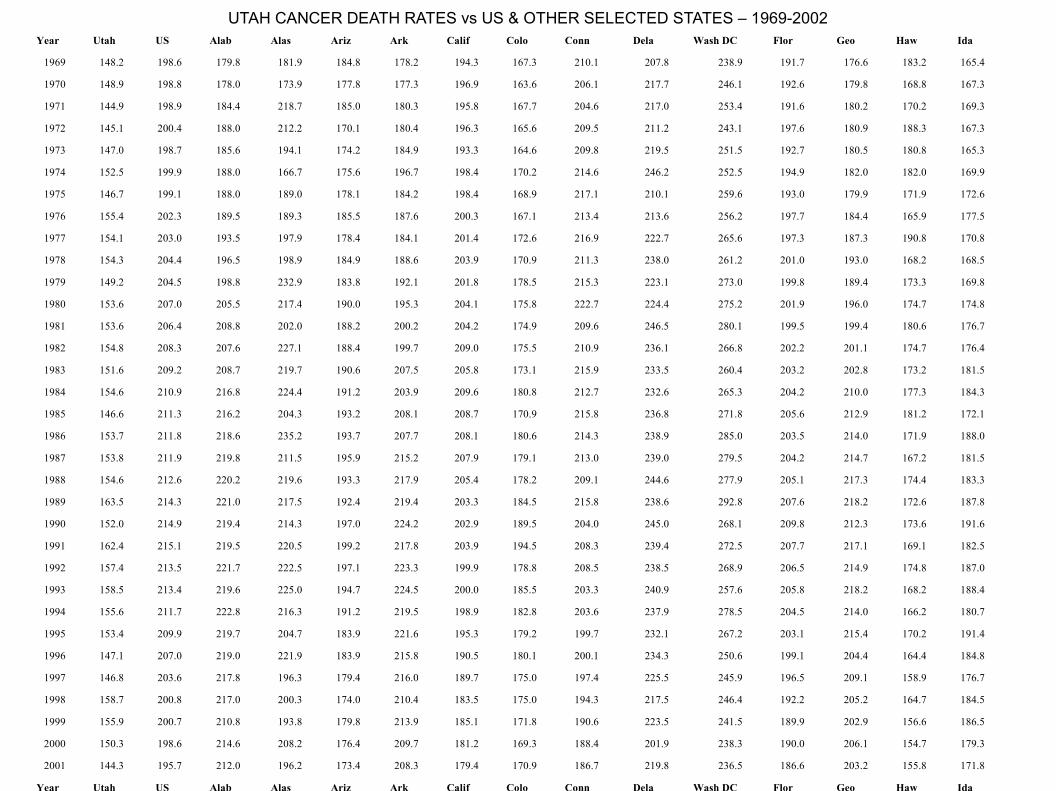
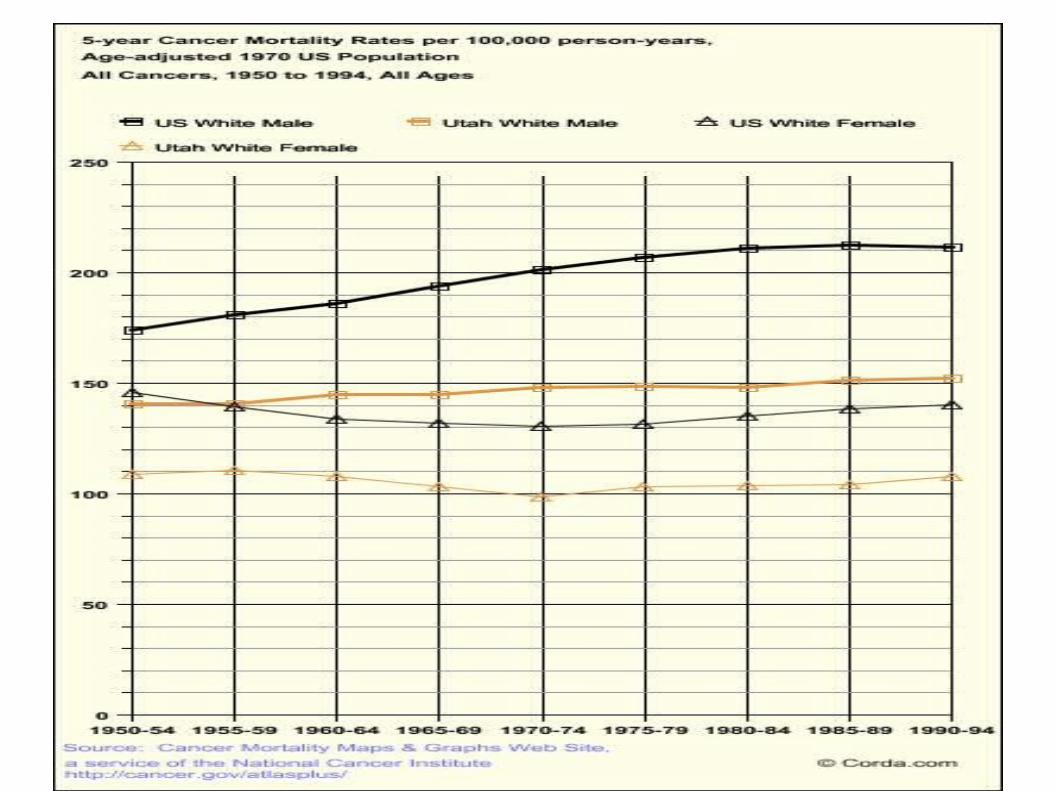
Year Utah US Alab Alas Ariz Ark Calif Colo Conn Dela Wash DC Flor Geo Haw Ida
1969 148.2 198.6 179.8 181.9 184.8 178.2 194.3 167.3 210.1 207.8 238.9 191.7 176.6 183.2 165.4
1970 148.9 198.8 178.0 173.9 177.8 177.3 196.9 163.6 206.1 217.7 246.1 192.6 179.8 168.8 167.3
1971 144.9 198.9 184.4 218.7 185.0 180.3 195.8 167.7 204.6 217.0 253.4 191.6 180.2 170.2 169.3
1972 145.1 200.4 188.0 212.2 170.1 180.4 196.3 165.6 209.5 211.2 243.1 197.6 180.9 188.3 167.3
1973 147.0 198.7 185.6 194.1 174.2 184.9 193.3 164.6 209.8 219.5 251.5 192.7 180.5 180.8 165.3
1974 152.5 199.9 188.0 166.7 175.6 196.7 198.4 170.2 214.6 246.2 252.5 194.9 182.0 182.0 169.9
1975 146.7 199.1 188.0 189.0 178.1 184.2 198.4 168.9 217.1 210.1 259.6 193.0 179.9 171.9 172.6
1976 155.4 202.3 189.5 189.3 185.5 187.6 200.3 167.1 213.4 213.6 256.2 197.7 184.4 165.9 177.5
1977 154.1 203.0 193.5 197.9 178.4 184.1 201.4 172.6 216.9 222.7 265.6 197.3 187.3 190.8 170.8
1978 154.3 204.4 196.5 198.9 184.9 188.6 203.9 170.9 211.3 238.0 261.2 201.0 193.0 168.2 168.5
1979 149.2 204.5 198.8 232.9 183.8 192.1 201.8 178.5 215.3 223.1 273.0 199.8 189.4 173.3 169.8
1980 153.6 207.0 205.5 217.4 190.0 195.3 204.1 175.8 222.7 224.4 275.2 201.9 196.0 174.7 174.8
1981 153.6 206.4 208.8 202.0 188.2 200.2 204.2 174.9 209.6 246.5 280.1 199.5 199.4 180.6 176.7
1982 154.8 208.3 207.6 227.1 188.4 199.7 209.0 175.5 210.9 236.1 266.8 202.2 201.1 174.7 176.4
1983 151.6 209.2 208.7 219.7 190.6 207.5 205.8 173.1 215.9 233.5 260.4 203.2 202.8 173.2 181.5
1984 154.6 210.9 216.8 224.4 191.2 203.9 209.6 180.8 212.7 232.6 265.3 204.2 210.0 177.3 184.3
1985 146.6 211.3 216.2 204.3 193.2 208.1 208.7 170.9 215.8 236.8 271.8 205.6 212.9 181.2 172.1
1986 153.7 211.8 218.6 235.2 193.7 207.7 208.1 180.6 214.3 238.9 285.0 203.5 214.0 171.9 188.0
1987 153.8 211.9 219.8 211.5 195.9 215.2 207.9 179.1 213.0 239.0 279.5 204.2 214.7 167.2 181.5
1988 154.6 212.6 220.2 219.6 193.3 217.9 205.4 178.2 209.1 244.6 277.9 205.1 217.3 174.4 183.3
1989 163.5 214.3 221.0 217.5 192.4 219.4 203.3 184.5 215.8 238.6 292.8 207.6 218.2 172.6 187.8
1990 152.0 214.9 219.4 214.3 197.0 224.2 202.9 189.5 204.0 245.0 268.1 209.8 212.3 173.6 191.6
1991 162.4 215.1 219.5 220.5 199.2 217.8 203.9 194.5 208.3 239.4 272.5 207.7 217.1 169.1 182.5
1992 157.4 213.5 221.7 222.5 197.1 223.3 199.9 178.8 208.5 238.5 268.9 206.5 214.9 174.8 187.0
1993 158.5 213.4 219.6 225.0 194.7 224.5 200.0 185.5 203.3 240.9 257.6 205.8 218.2 168.2 188.4
1994 155.6 211.7 222.8 216.3 191.2 219.5 198.9 182.8 203.6 237.9 278.5 204.5 214.0 166.2 180.7
1995 153.4 209.9 219.7 204.7 183.9 221.6 195.3 179.2 199.7 232.1 267.2 203.1 215.4 170.2 191.4
1996 147.1 207.0 219.0 221.9 183.9 215.8 190.5 180.1 200.1 234.3 250.6 199.1 204.4 164.4 184.8
1997 146.8 203.6 217.8 196.3 179.4 216.0 189.7 175.0 197.4 225.5 245.9 196.5 209.1 158.9 176.7
1998 158.7 200.8 217.0 200.3 174.0 210.4 183.5 175.0 194.3 217.5 246.4 192.2 205.2 164.7 184.5
1999 155.9 200.7 210.8 193.8 179.8 213.9 185.1 171.8 190.6 223.5 241.5 189.9 202.9 156.6 186.5
2000 150.3 198.6 214.6 208.2 176.4 209.7 181.2 169.3 188.4 201.9 238.3 190.0 206.1 154.7 179.3
2001 144.3 195.7 212.0 196.2 173.4 208.3 179.4 170.9 186.7 219.8 236.5 186.6 203.2 155.8 171.8
Year Utah US Alab Alas Ariz Ark Calif Colo Conn Dela Wash DC Flor Geo Haw Ida
UTAH CANCER DEATH RATES vs US & OTHER SELECTED STATES – 1969-2002
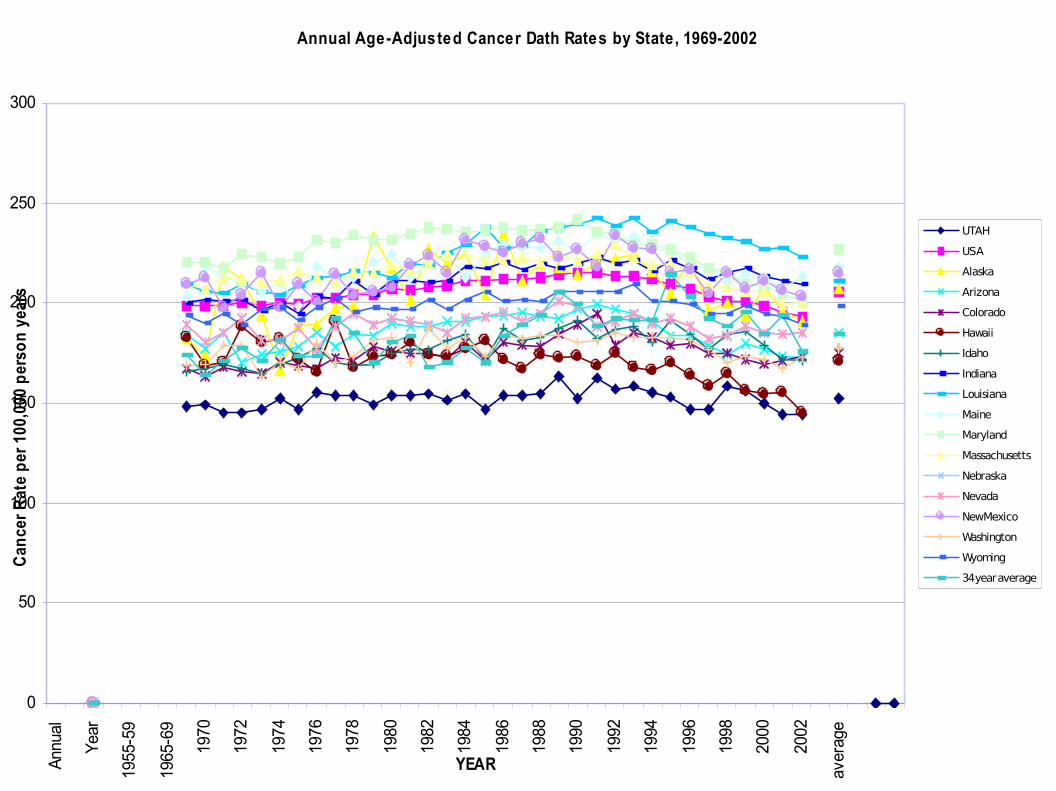
Annual Age-Adjusted Cancer Dath Rates by State, 1969-2002
0
50
100
150
200
250
300
Annu
al
Year
1955
-59
1965
-69
1970
1972
1974
1976
1978
1980
1982
1984
1986
1988
1990
1992
1994
1996
1998
2000
2002
aver
age
YEAR
Canc
er R
ate
per 1
00,0
00 p
erso
n ye
ars
UTAHUSAAlaskaArizonaColoradoHawaiiIdahoIndianaLouisianaMaineMarylandMassachusettsNebraskaNevadaNew MexicoWashingtonWyoming34 year average
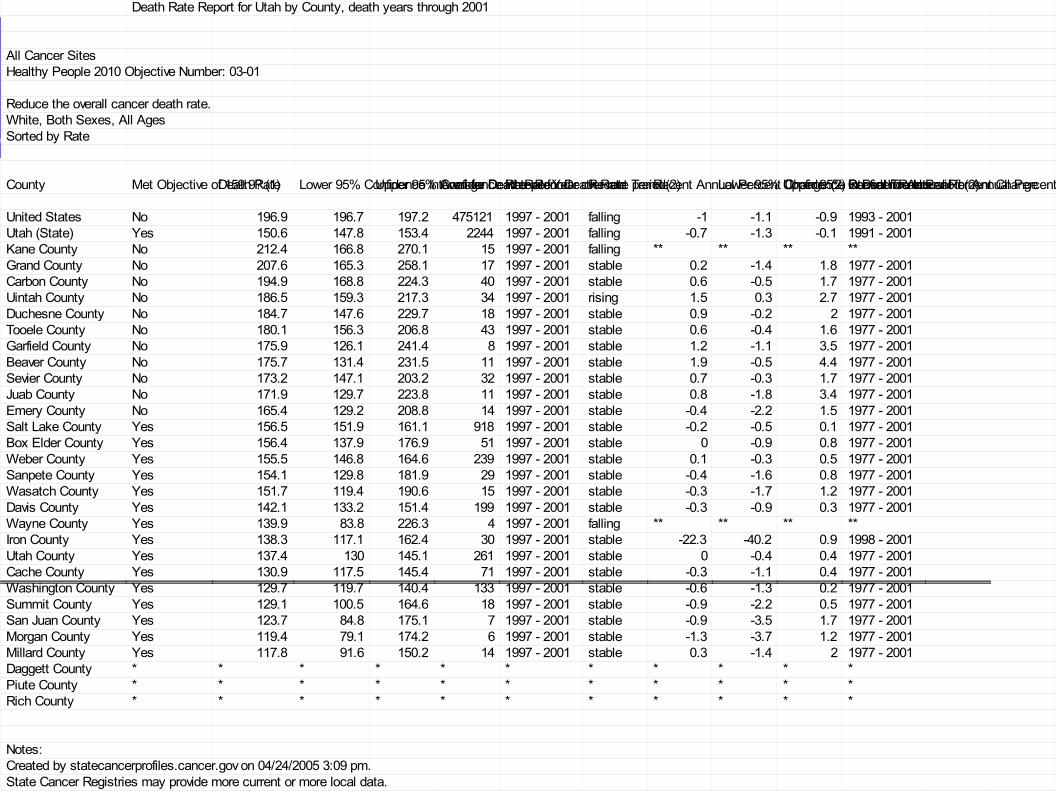
Death Rate Report for Utah by County, death years through 2001
All Cancer SitesHealthy People 2010 Objective Number: 03-01
Reduce the overall cancer death rate.White, Both Sexes, All AgesSorted by Rate
Recent Trend Period (2)Upper 95% Confidence Interval for Annual Percent ChangeLower 95% Confidence Interval for Annual Percent ChangeRecent Annual Percent Change (2) in Death RatesRecent Trend (2)Rate PeriodAverage Deaths per Year over rate periodUpper 95% Confidence Interval for Death RateLower 95% Confidence Interval for Death RateDeath RateMet Objective of 159.9? (1)County
1993 - 2001-0.9-1.1-1falling1997 - 2001475121197.2196.7196.9NoUnited States1991 - 2001-0.1-1.3-0.7falling1997 - 20012244153.4147.8150.6YesUtah (State)********falling1997 - 200115270.1166.8212.4NoKane County1977 - 20011.8-1.40.2stable1997 - 200117258.1165.3207.6NoGrand County1977 - 20011.7-0.50.6stable1997 - 200140224.3168.8194.9NoCarbon County1977 - 20012.70.31.5rising1997 - 200134217.3159.3186.5NoUintah County1977 - 20012-0.20.9stable1997 - 200118229.7147.6184.7NoDuchesne County1977 - 20011.6-0.40.6stable1997 - 200143206.8156.3180.1NoTooele County1977 - 20013.5-1.11.2stable1997 - 20018241.4126.1175.9NoGarfield County1977 - 20014.4-0.51.9stable1997 - 200111231.5131.4175.7NoBeaver County1977 - 20011.7-0.30.7stable1997 - 200132203.2147.1173.2NoSevier County1977 - 20013.4-1.80.8stable1997 - 200111223.8129.7171.9NoJuab County1977 - 20011.5-2.2-0.4stable1997 - 200114208.8129.2165.4NoEmery County1977 - 20010.1-0.5-0.2stable1997 - 2001918161.1151.9156.5YesSalt Lake County1977 - 20010.8-0.90stable1997 - 200151176.9137.9156.4YesBox Elder County1977 - 20010.5-0.30.1stable1997 - 2001239164.6146.8155.5YesWeber County1977 - 20010.8-1.6-0.4stable1997 - 200129181.9129.8154.1YesSanpete County1977 - 20011.2-1.7-0.3stable1997 - 200115190.6119.4151.7YesWasatch County1977 - 20010.3-0.9-0.3stable1997 - 2001199151.4133.2142.1YesDavis County********falling1997 - 20014226.383.8139.9YesWayne County1998 - 20010.9-40.2-22.3stable1997 - 200130162.4117.1138.3YesIron County1977 - 20010.4-0.40stable1997 - 2001261145.1130137.4YesUtah County1977 - 20010.4-1.1-0.3stable1997 - 200171145.4117.5130.9YesCache County1977 - 20010.2-1.3-0.6stable1997 - 2001133140.4119.7129.7YesWashington County1977 - 20010.5-2.2-0.9stable1997 - 200118164.6100.5129.1YesSummit County1977 - 20011.7-3.5-0.9stable1997 - 20017175.184.8123.7YesSan Juan County1977 - 20011.2-3.7-1.3stable1997 - 20016174.279.1119.4YesMorgan County1977 - 20012-1.40.3stable1997 - 200114150.291.6117.8YesMillard County***********Daggett County***********Piute County***********Rich County
Notes:Created by statecancerprofiles.cancer.gov on 04/24/2005 3:09 pm.State Cancer Registries may provide more current or more local data.
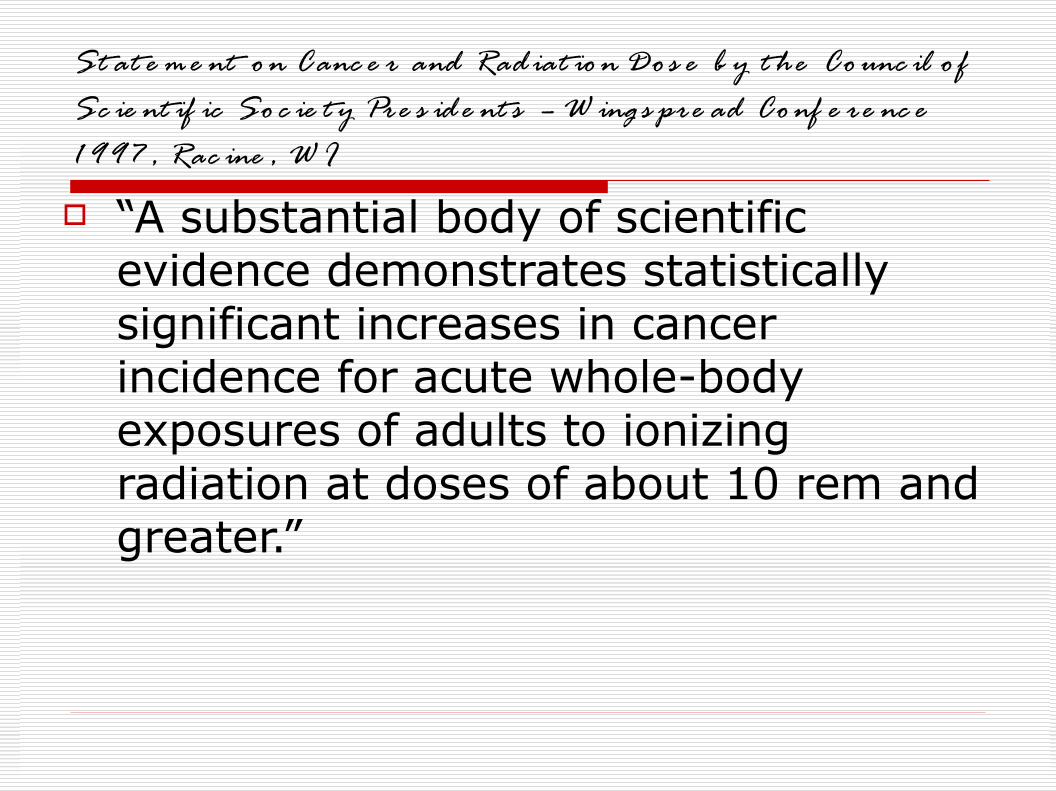
S t at e m e nt o n Canc e r and Rad ia t io n Do s e b y t h e Co unc il o f S c ie nt if ic S o c ie t y Pr e s id e nt s – W ing s pr e ad Co nf e r e nc e 1 9 9 7 , Rac ine , W I
“A substantial body of scientific evidence demonstrates statistically significant increases in cancer incidence for acute whole-body exposures of adults to ionizing radiation at doses of about 10 rem and greater.”
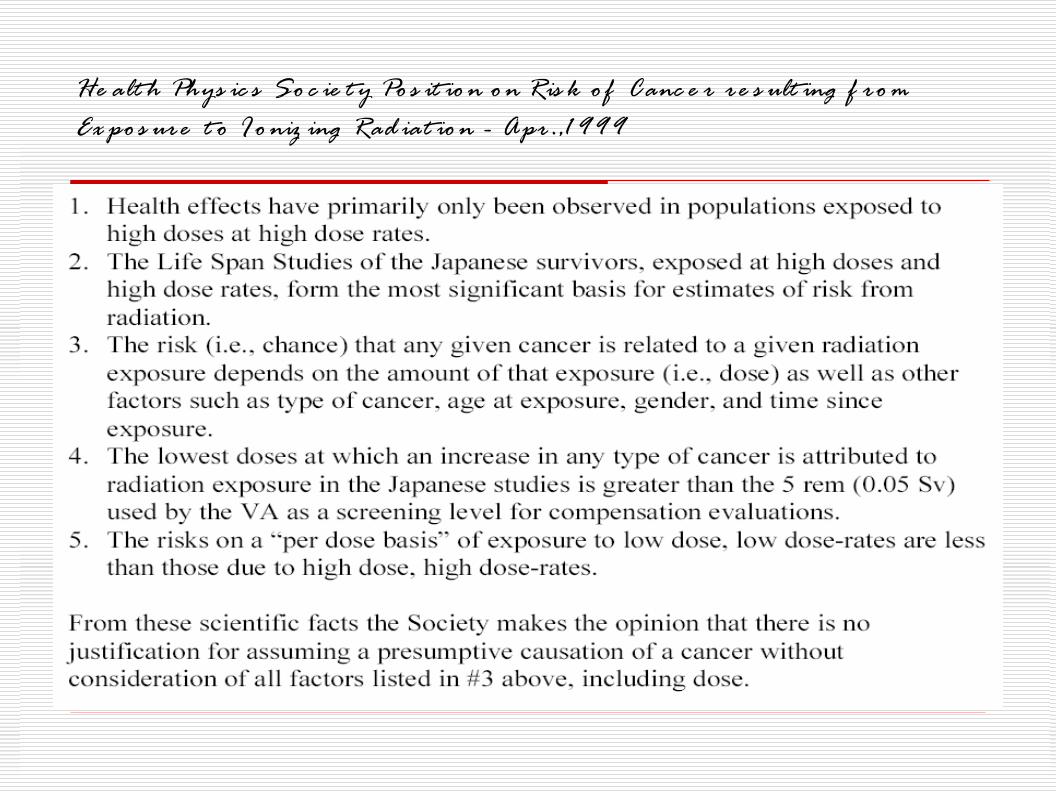
He alt h Ph y s ic s S o c ie t y Po s it io n o n Ris k o f Canc e r r e s ult ing f r o m Ex po s ur e t o I o niz ing Rad ia t io n - A pr .,1 9 9 9
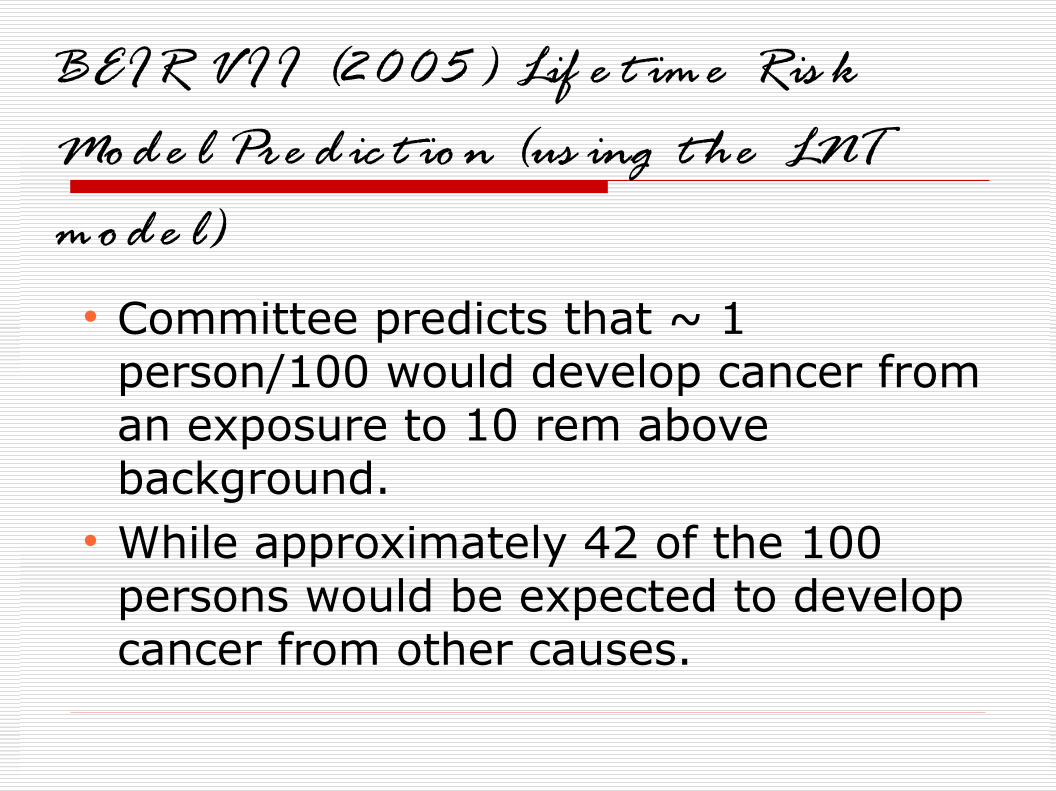
BEI R VI I (2 0 0 5 ) Lif e t im e Ris k Mo d e l Pr e d ic t io n (us ing t h e LNT m o d e l)
Committee predicts that ~ 1 person/100 would develop cancer from an exposure to 10 rem above background.
While approximately 42 of the 100 persons would be expected to develop cancer from other causes.
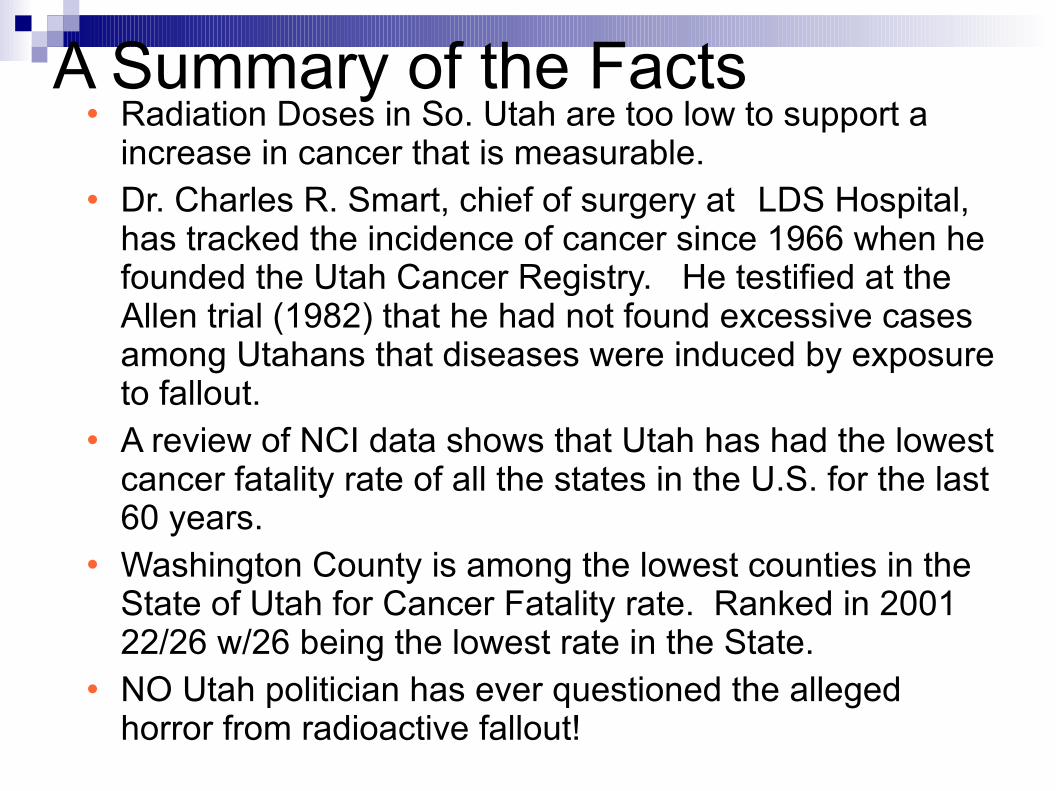
A Summary of the Facts Radiation Doses in So. Utah are too low to support a
increase in cancer that is measurable. Dr. Charles R. Smart, chief of surgery at LDS Hospital,
has tracked the incidence of cancer since 1966 when he founded the Utah Cancer Registry. He testified at the Allen trial (1982) that he had not found excessive cases among Utahans that diseases were induced by exposure to fallout.
A review of NCI data shows that Utah has had the lowest cancer fatality rate of all the states in the U.S. for the last 60 years.
Washington County is among the lowest counties in the State of Utah for Cancer Fatality rate. Ranked in 2001 22/26 w/26 being the lowest rate in the State.
NO Utah politician has ever questioned the alleged horror from radioactive fallout!
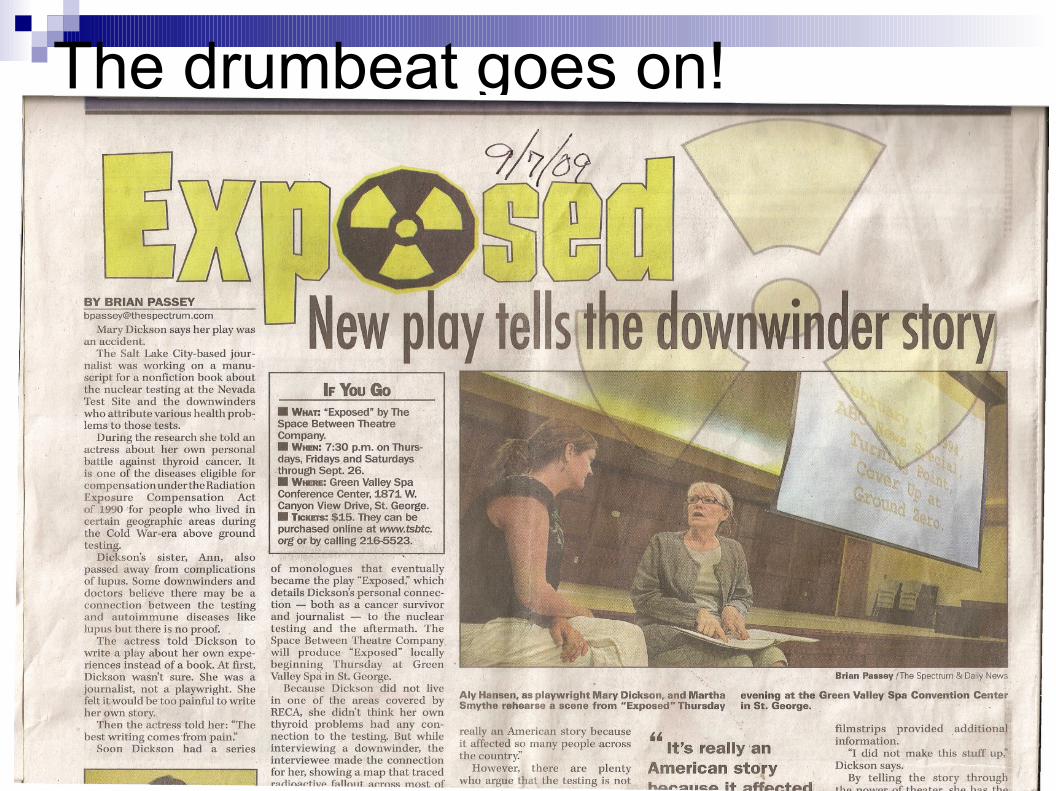
The drumbeat goes on!
THE END
Time to stop the presentation and take questions!
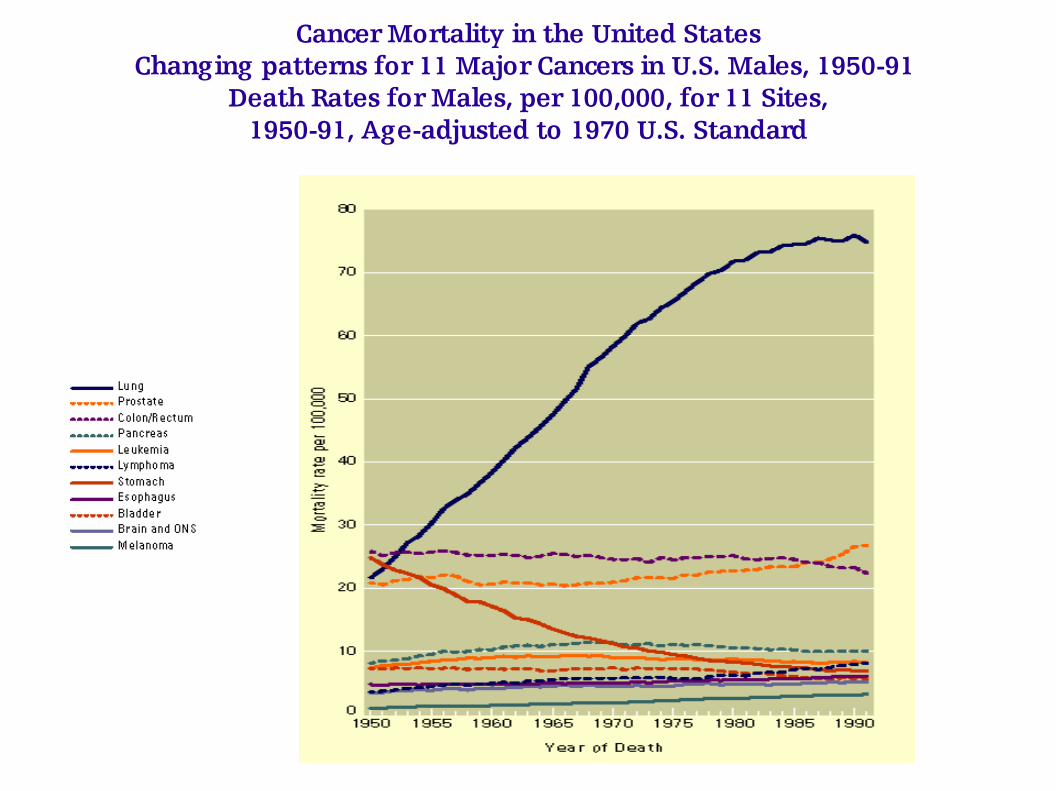
Cancer Mortality in the United StatesChanging patterns for 11 Major Cancers in U.S. Males, 1950-91
Death Rates for Males, per 100,000, for 11 Sites,1950-91, Age-adjusted to 1970 U.S. Standard
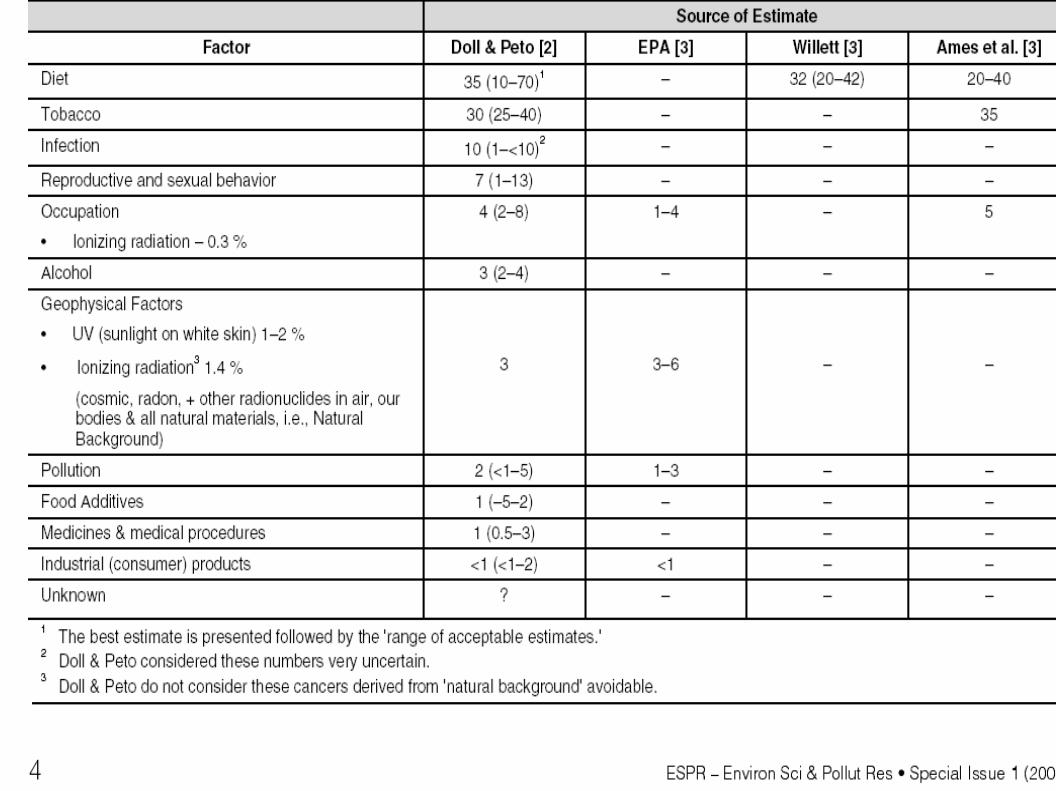
Percentages of cancer deaths attributed to various factors
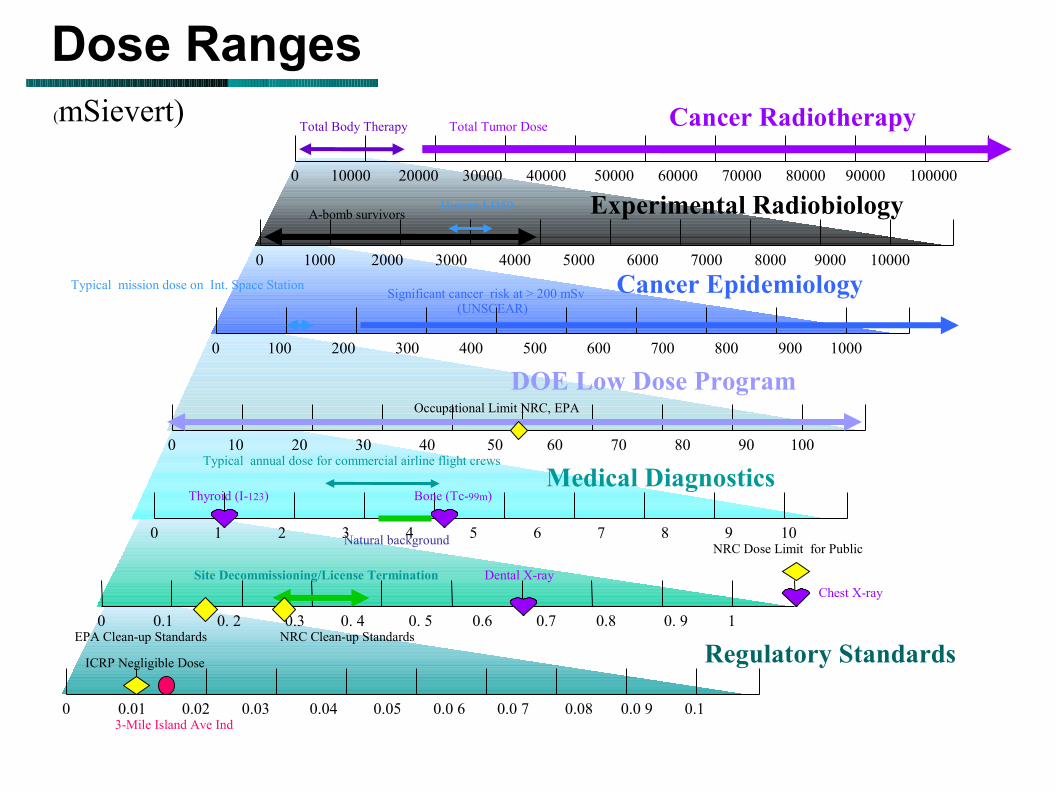
Dose Ranges
0 1000 2000 3000 4000 5000 6000 7000 8000 9000 10000
0 100 200 300 400 500 600 700 800 900 1000
0 10 20 30 40 50 60 70 80 90 100
0 1 2 3 4 5 6 7 8 9 10
0 0.1 0. 2 0.3 0. 4 0. 5 0.6 0.7 0.8 0. 9 1
0 0.01 0.02 0.03 0.04 0.05 0.0 6 0.0 7 0.08 0.0 9 0.1
(mSievert)
0 10000 20000 30000 40000 50000 60000 70000 80000 90000 100000
Cancer Radiotherapy
Experimental Radiobiology
Cancer Epidemiology
DOE Low Dose Program
Medical Diagnostics
Regulatory Standards
Total Body Therapy Total Tumor Dose
A-bomb survivors
Significant cancer risk at > 200 mSv (UNSCEAR)
Human LD50
Typical mission dose on Int. Space Station
Typical annual dose for commercial airline flight crews
Bone (Tc-99m)Thyroid (I-123)
Chest X-rayDental X-ray
ICRP Negligible Dose
NRC Dose Limit for PublicNatural background
Site Decommissioning/License Termination
3-Mile Island Ave Ind
Occupational Limit NRC, EPA
EPA Clean-up Standards NRC Clean-up Standards