uruguyan exports and sectoral real exchange rate Álvaro brunini gabriela mordecki lucía ramírez...
TRANSCRIPT

URUGUYAN EXPORTS AND SECTORAL REAL EXCHANGE RATE
Álvaro Brunini
Gabriela Mordecki
Lucía Ramírez
XI Arnoldshain, Antwerp June 2013

Presentation outline
• Theoretical basis and definitions
• Research objective
• Background
• Methodology
• Selected sectors
• Modeling
• Final remarks

Theoretical basis and definitions The RER represents the relative price of two or more baskets of goods and therefore, so an increase of RER implies that goods become cheaper in the domestic economy in relation to its trading partners
Traditional economic theory suggests that RER increases implies exports increase.
The implication then is that a high RER implies increasing exports.
Is this also true at a sectoral level in a small open economy like Uruguay?

Research objective
Providing knowledge about the link between Uruguayan exports of selected sectors and sectoral real exchange rate (SRER) of Uruguay, between January 1993 and December 2011.

Background• Rodrick (2008) provides evidence that a high real exchange rate promotes an increase in exports, mainly in developed countries.
• In Uruguay there are attempts to verify this relationship in previous works (Mordecki (2006), the Fourth Uruguay XXI Export Report (2007), Mordecki Brunini (2011), Rostán et al (2001), but conclusions differ from Rodrick’s ones.
• Studies at a sectoral level for regional countries do not verify this relationship either.
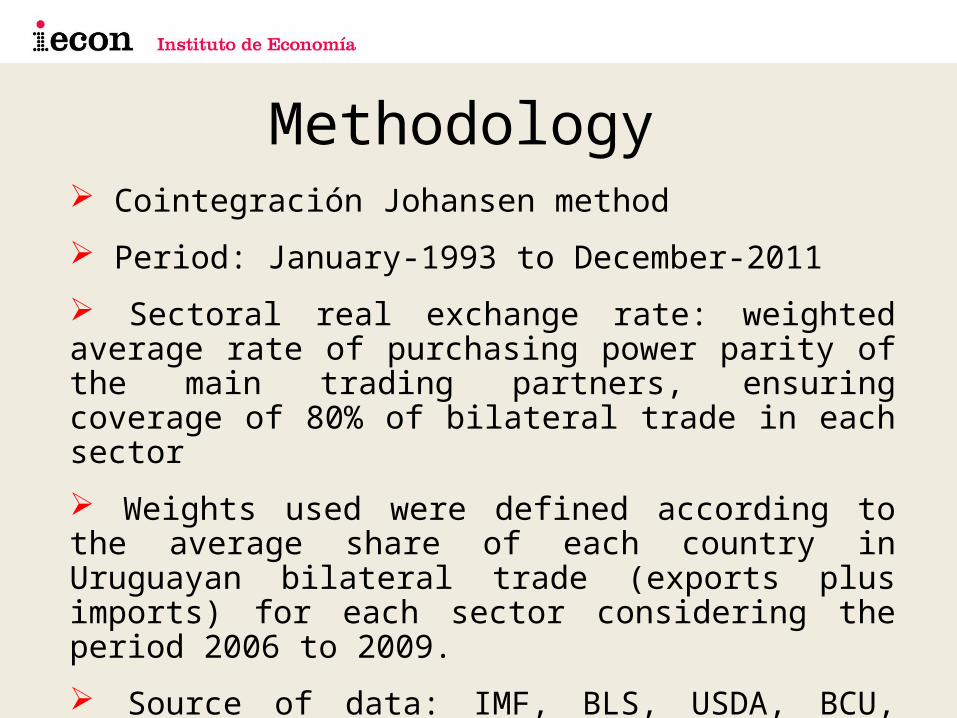
Methodology Cointegración Johansen method
Period: January-1993 to December-2011
Sectoral real exchange rate: weighted average rate of purchasing power parity of the main trading partners, ensuring coverage of 80% of bilateral trade in each sector
Weights used were defined according to the average share of each country in Uruguayan bilateral trade (exports plus imports) for each sector considering the period 2006 to 2009.
Source of data: IMF, BLS, USDA, BCU, INDEC

Selected sectors: beef, dairy, leather, chemical, plastics, metallurgical

Selected sectorsFIGURE 2 - SELECTED SECTORS
Participation in total exports. 1993-2011
0%
10%
20%
30%
40%
50%
60%
70%
80%
90%
100%
1993 1998 2006 2011
others
metallurgical
beef
leather
dairy
chemical
plastics
Source: IECON,BCU

Beef
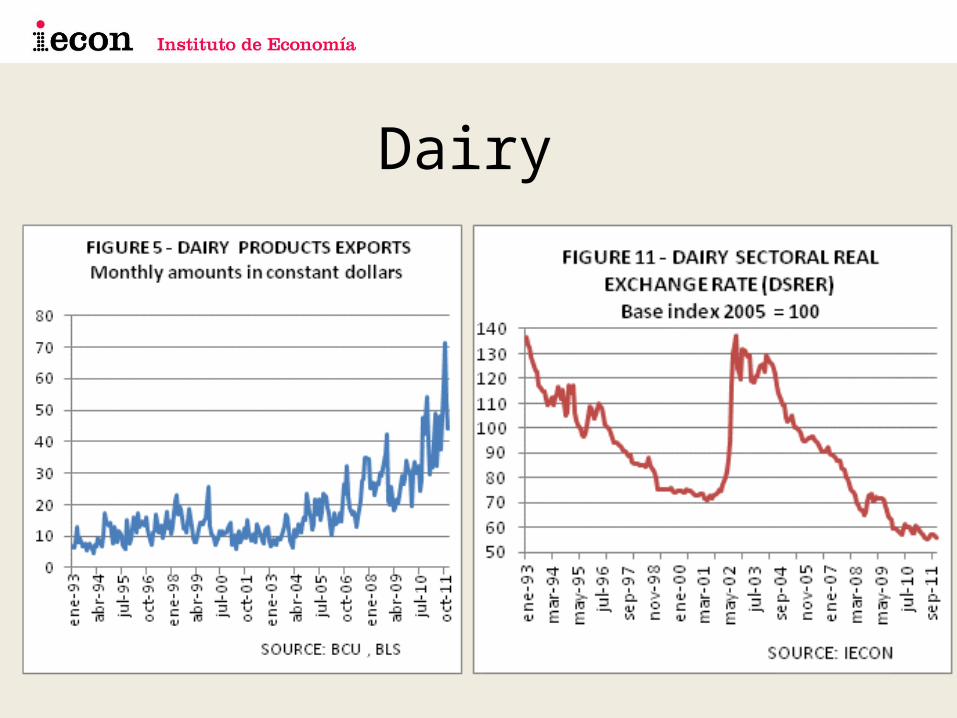
Dairy

Leather
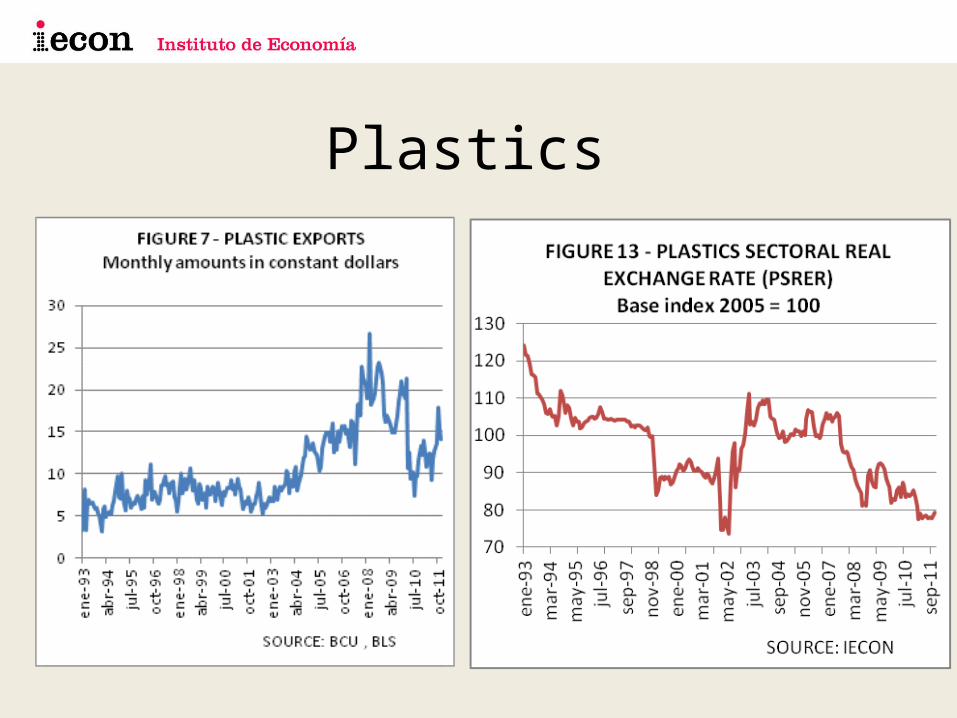
Plastics

Chemicals

Metallurgical Industry

ModelingNo evidence of relationship with the SRER in any of the studied cases.
Introducing other variables:
Beef: we found a cointegration vector with cattle slaughter (LF), a supply indicator

.00
.01
.02
.03
.04
.05
.06
.07
.08
.09
2 4 6 8 10 12 14 16 18 20 22 24
Response of LC to CholeskyOne S.D. LF Innovation

Dairy: we found a cointegration vector with the skim
milk international price (LPD)
.00
.02
.04
.06
.08
.10
.12
2 4 6 8 10 12 14 16 18 20 22 24
Response of LL to CholeskyOne S.D. LPD Innovation
FIGURE 17 - IMPULSE RESPONSE FUNCTION OF LL TO A LPD SHOCK
SOURCE: IECON

Leather:
Market structure in this case could be a relevant
determinant of this product.
The market is fragmented into two: one linked to the
automobile industry and the other one related to the
footwear industry

Chemicals and plastics: we found one relationship for each sector including sectoral imports: chemicals (LIQ) and plastics (LIP)

.00
.01
.02
.03
.04
.05
.06
.07
2 4 6 8 10 12 14 16 18 20 22 24
Response of LQ to CholeskyOne S.D. LIQ Innovation
• FIGURE 18 IMPULSE RESPONSE FUNCTION OF LQ TO A LIQ SHOCK
• SOURCE: IECON

SOURCE: IECON
-.01
.00
.01
.02
.03
2 4 6 8 10 12 14 16 18 20 22 24
Response of LP to LIP
-.01
.00
.01
.02
.03
2 4 6 8 10 12 14 16 18 20 22 24
Response of LP to TCRSP
Response to Cholesky One S.D. Innovations
FIGURE 19 IMPULSE RESPONSE FUNCTION OF LP TO A LIP AND PSRER SHOCKS

Metallurgical: we found a cointegration relationship with Argentina’s GDP (LPA), which is the main destination market over the period of analysis

.00
.01
.02
.03
.04
.05
.06
.07
1 2 3 4 5 6 7 8 9 10
Response of LXM to CholeskyOne S.D. LPA Innovation
• FIGURE 20 IMPULSE RESPONSE FUNCTION OF LXM TO A LPA SHOCK
• SOURCE: IECON

Final remarks For the period of analysis, we conclude that relative prices, measured by the SRER, do not affect the run path of the sectoral exports analyzed. Introducing other variables, we found some long-run relationships for each product:
beef depending on cattle slaughter (sector supply), diary cointegrated with international prices of milk (a commodity for a small country), chemicals and plastics depending on imports (as they manufacture imported raw materials) and only in the case of plastics the SRER entered the long run relationship. for metallurgical exports, which are basically destined to the region, the Argentinean GDP resulted significant in the long term vector.

We conclude that, in the long run, sectoral RER is not relevant to explain exports of the sectors analyzed here, with the exception of those from the plastic industry.
Uruguay, as a small open economy, is a price taker which faces international demand.
Some exports depend only on the supply side and, in others cases, demand is not so elastic so it is the main determinant for exports.
Nevertheless, the RER level is important for exporters’ profitability and, at a macroeconomic level, is a variable which importance to exporters’ decision making process should not be underappreciated.
