urbanisation and megacities investigation project by: katie marquis 8e brisbane, queensland kolkata,...
TRANSCRIPT
Urbanisation and Megacities Investigation Project
By: Katie Marquis 8E
Brisbane, Queensland
Kolkata, India
At The Level
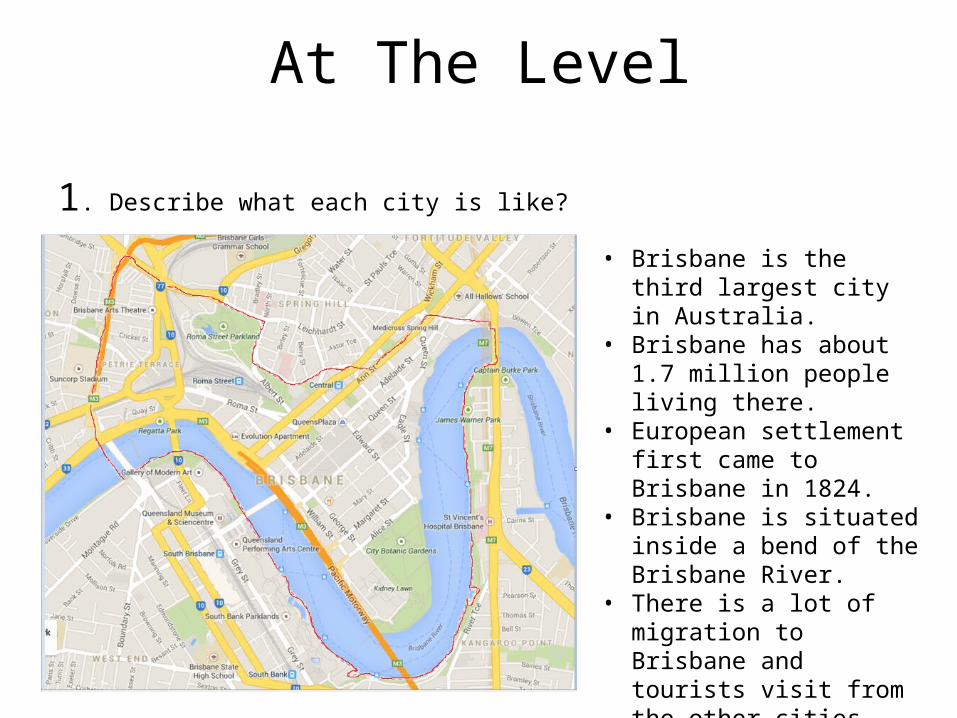
1. Describe what each city is like?
• Brisbane is the third largest city in Australia.
• Brisbane has about 1.7 million people living there.
• European settlement first came to Brisbane in 1824.
• Brisbane is situated inside a bend of the Brisbane River.
• There is a lot of migration to Brisbane and tourists visit from the other cities.
• It’s hot in summer and pleasant in winter.
At The Level
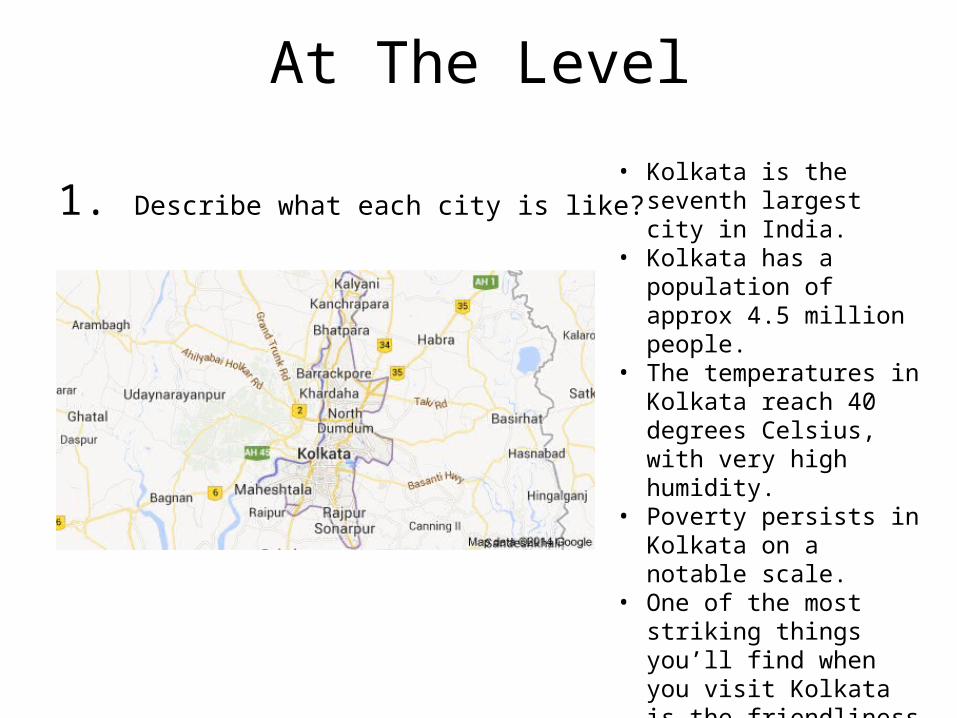
1. Describe what each city is like?• Kolkata is the seventh
largest city in India.• Kolkata has a population of
approx 4.5 million people.• The temperatures in Kolkata
reach 40 degrees Celsius, with very high humidity.
• Poverty persists in Kolkata on a notable scale.
• One of the most striking things you’ll find when you visit Kolkata is the friendliness of its people.
• Kolkata has many festivals throughout the year.
At The Level
2. Create an overlay map for the countries where both cities are located, using data you have sourced.
At The Level3. Explain why people have moved to this city in the past.
Prior to white settlement Indigenous people lived in the Brisbane area because of the abundant amount of food to be found in the river. Good fishing places became campsites and the focus of group activities. In 1824 a penal colony was established for the worst offenders from New South Wales. In 1938 the area was opened to free settlers. This was because more pastoral land was needed due to the increased reliance of Australia on the wool industry.Brisbane is at the centre of a massive population boom in recent years occurring in the south-eastern corner of the Sunshine State. A move to Queensland from the southern states is all about the weather. Each year thousands of people migrate so they can enjoy the year round summer. This sunshine-driven growth has increased Brisbane’s size because Brisbane is still where the bulk of jobs are to be found.
The three villages where Kolkata is located came into the possession of the British East India Company in 1690. The British used the area as a trading base in the East and opened a number of factories. The population grew as industry grew. This trend has continued as people have usually moved to Kolkata because of the increased job opportunities available. Growth accompanied the city when it became the capital of British India, after the development of the port area of Kolkata and the railway system and after rapid industrial growth eg textile sector. In recent years growth in the IT services industry and the manufacturing sector has seen people move to Kolkata.Kolkata has also had its population increased by influxes of refugees. In the 1940’s millions of Hindu refugees came from East Pakistan (now Bangladesh)to Kolkata after the partition of India. In 1971, the war between India and Pakistan led to another massive influx of refugees from the former East Pakistan.
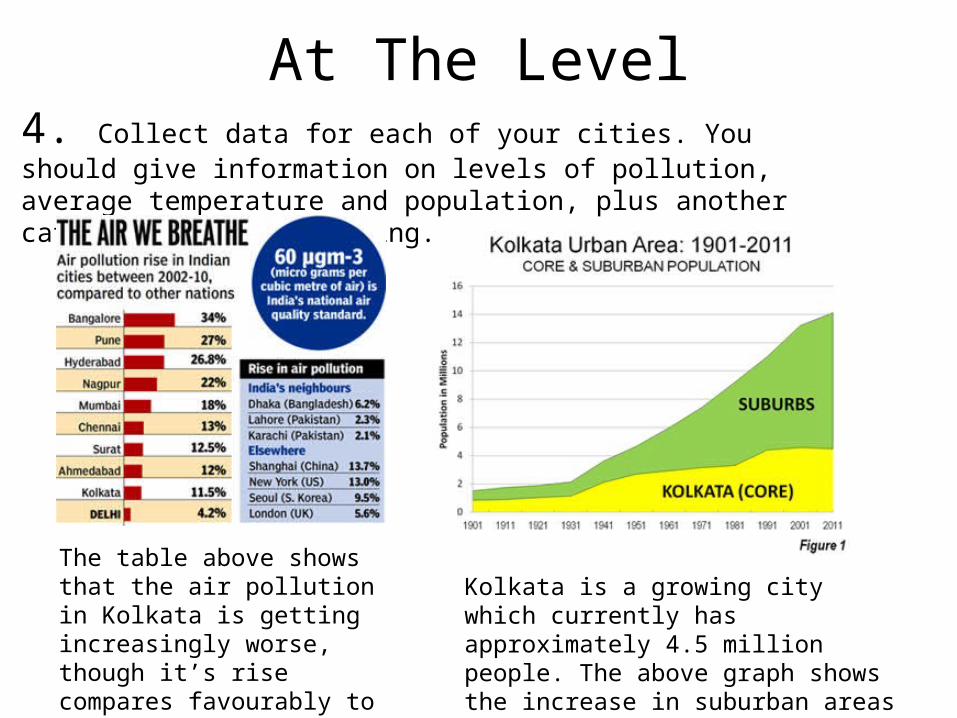
At The Level4. Collect data for each of your cities. You should give information on levels of pollution, average temperature and population, plus another category of your choosing.
The table above shows that the air pollution in Kolkata is getting increasingly worse, though it’s rise compares favourably to other Indian cities and, in fact, to other major cities of the world.
Kolkata is a growing city which currently has approximately 4.5 million people. The above graph shows the increase in suburban areas surrounding Kolkata needed to accommodate the growth.
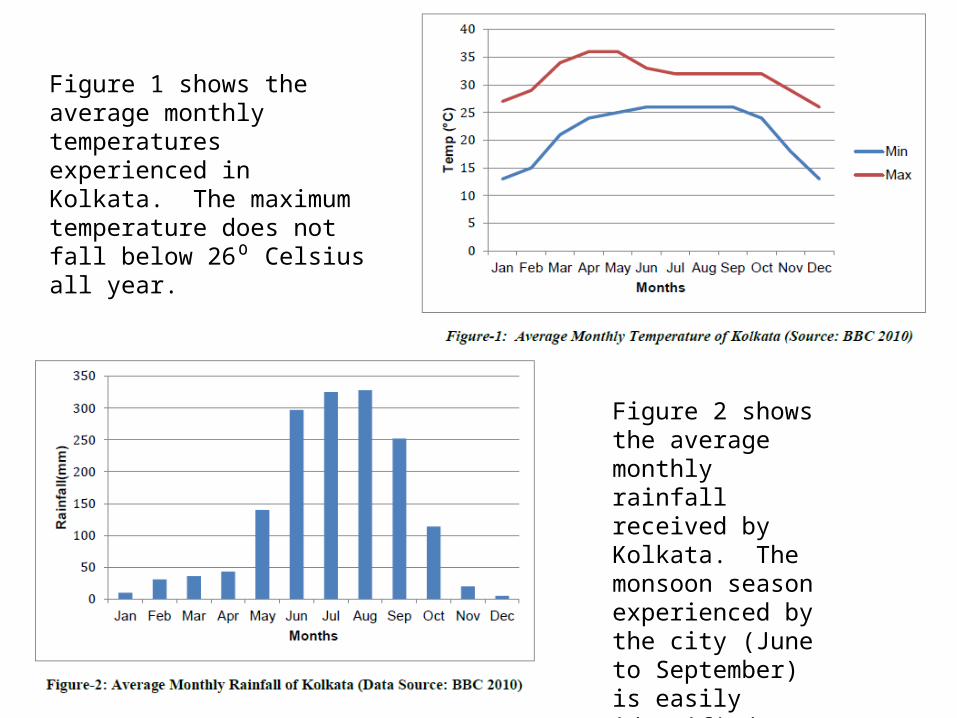
Figure 1 shows the average monthly temperatures experienced in Kolkata. The maximum temperature does not fall below 26⁰ Celsius all year.
Figure 2 shows the average monthly rainfall received by Kolkata. The monsoon season experienced by the city (June to September) is easily identified.
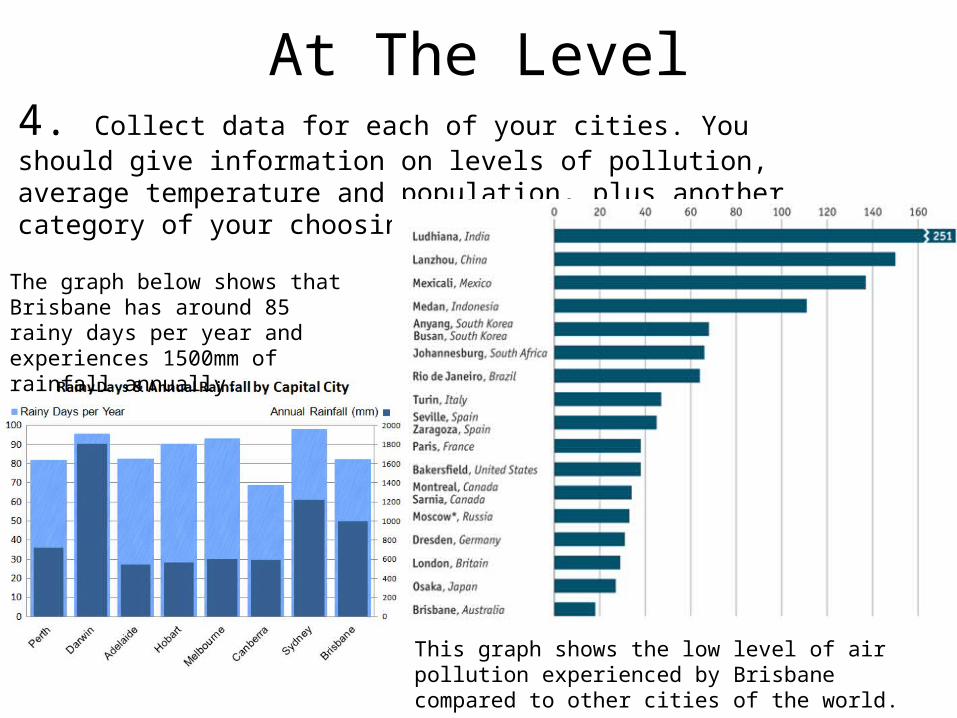
At The Level4. Collect data for each of your cities. You should give information on levels of pollution, average temperature and population, plus another category of your choosing.
This graph shows the low level of air pollution experienced by Brisbane compared to other cities of the world.
The graph below shows that Brisbane has around 85 rainy days per year and experiences 1500mm of rainfall annually.
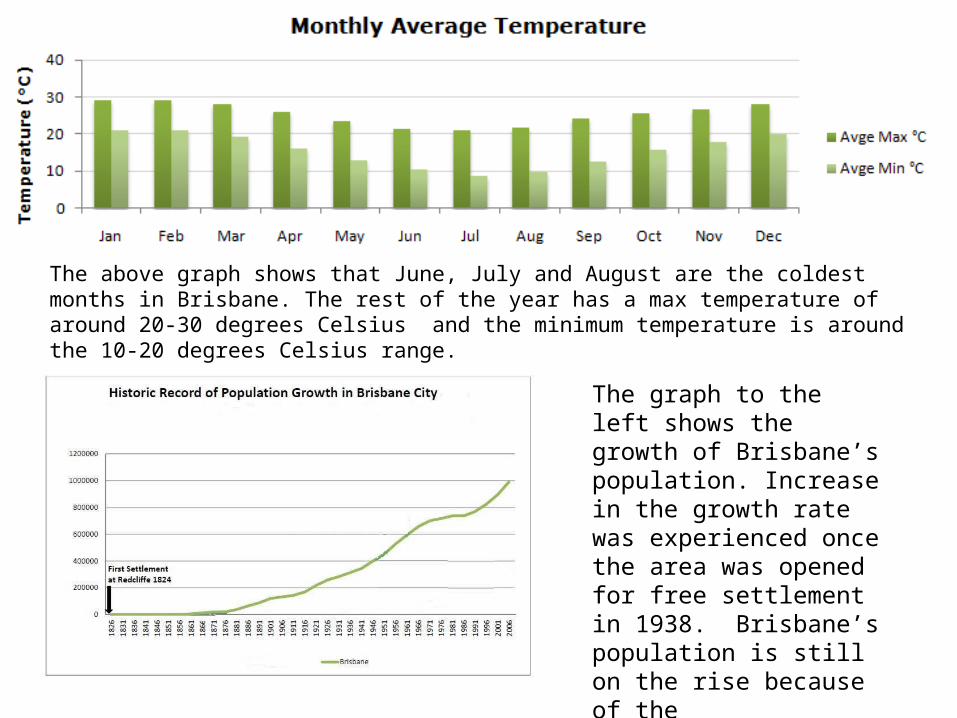
The above graph shows that June, July and August are the coldest months in Brisbane. The rest of the year has a max temperature of around 20-30 degrees Celsius and the minimum temperature is around the 10-20 degrees Celsius range.
The graph to the left shows the growth of Brisbane’s population. Increase in the growth rate was experienced once the area was opened for free settlement in 1938. Brisbane’s population is still on the rise because of the attractiveness of the area.

Above The Level2. Using your overlay maps show the differences and similarities between the two cities
POPULATION
The population density map for Australia clearly shows that the coastal areas are more populated than the interior. There are even parts around the deserts where no one really lives. The major cities stand out by the red dots that appear on the either side of country. The total population of Australia is 22.68 million. Brisbane is the third largest city, with approximately 2 million people.This contrasts greatly to the map of India with it’s total population of 1.2 billion. Unlike Australia with its relatively empty centre, each region of India is heavily populated. Kolkata with a population of 4.5 million people is only the 7th largest city in the country.
Above The Level
2. Using your overlay maps show the differences and similarities between the two cities.
RAINFALL
The rainfall overlay map shows that Australia receives most of its rainfall on its coastal regions. Two thirds of Australia receives less than 40 cm of rainfall annually. Brisbane's average rainfall is around 100 cm a year. The mean annual rainfall for the whole of India is 105 cm with some areas receiving above 400 cm a year. This rainfall is associated mostly with the southwest monsoon. About 75% of the total rainfall occurs between June and September. Kolkata receives approximately 140 cm of rainfall per year, but during the monsoon this can increase to over 350 cm.
Above The Level4. For both cities, use the data that you have included to examine possible problems in the city at the moment. Explain what this may lead to in the future.
In Kolkata, people have to cover their faces from the intense air pollution which invades the city. It is believed that up to 70 percent of people in the city suffer from some form of respiratory problem as a result of the city's air. This may lead to more lives being lost from respiratory related problems.
Bibliography• https://www.google.com.au• http://www.worldatlas.com/• http://www.metvis.com.au/• http://en.wikipedia.org/• http://www.worldweatheronline.com/• http://www.britannica.com/• http://www.mygeography.in• http://www.bom.gov.au• http://www.seeu.edu.mk