urban road transportation externalities: costs and choice...
TRANSCRIPT
Urban Road Transportation Externalities:Costs and Choice of Policy Instruments
Govinda R. Timilsina † Hari B. Dulal
Urban transportation externalities are a key development challenge. Based on the exist-
ing literature, the authors illustrate the magnitudes of various external costs, review
response policies, and measure and discuss their selection, particularly focusing on the
context of developing countries. They find that regulatory policy instruments aimed at
reducing local air pollution have been introduced in most countries in the world. On the
other hand, fiscal policy instruments aimed at reducing congestion or greenhouse gas
emissions are limited mainly to industrialized economies. Although traditional fiscal
instruments, such as fuel taxes and subsidies, are normally introduced for other pur-
poses, they can also help to reduce externalities. Land-use or urban planning, and infra-
structure investment, could also contribute to reducing externalities; but they are
expensive and play a small role in already developed megacities. The main factors that
influence the choice of policy instruments include economic efficiency, equity, country or
city specific priority, and institutional capacity for implementation. Multiple policy
options need to be used simultaneously to reduce effectively the different externalities
arising from urban road transportation because most policy options are not mutually
exclusive. JEL codes: R40, R41, R48
There has been rapid growth in both vehicle production and registration world-
wide. While 246 million motor vehicles were registered worldwide in 1970, that
number had grown to 709 million in 1997 (Powers and Nicastri 2000). By
2007, over 72 million new vehicles were being produced annually, adding to the
existing global vehicle stock (Ward’s Automotive Group 2008). It is not only the
industrialized countries where rapid growth in vehicle ownership is taking place.
Consistent economic growth, rising incomes, and urbanization have led to rapid
The World Bank Research Observer# The Author 2010. Published by Oxford University Press on behalf of the International Bank for Reconstruction andDevelopment / THE WORLD BANK. All rights reserved. For permissions, please e-mail: [email protected];10.1093/wbro/lkq005 Advance Access publication June 3, 2010 26:162–191
at Joint Bank/F
und Library on February 7, 2011
wbro.oxfordjournals.org
Dow
nloaded from
Pub
lic D
iscl
osur
e A
utho
rized
Pub
lic D
iscl
osur
e A
utho
rized
Pub
lic D
iscl
osur
e A
utho
rized
Pub
lic D
iscl
osur
e A
utho
rized
Pub
lic D
iscl
osur
e A
utho
rized
Pub
lic D
iscl
osur
e A
utho
rized
Pub
lic D
iscl
osur
e A
utho
rized
Pub
lic D
iscl
osur
e A
utho
rized
growth in vehicle ownership and usage in many developing countries as well. For
example, in China the total number of registered motor vehicles has increased
more than 11 times from 2 to 25 million between 1980 and 1995 (Gan 2003).
In India, between 1981 and 2002, the size of the bus fleet quadrupled, the
number of motorcycles increased 16-fold, the number of cars increased seven-
fold, and the number of goods vehicles increased five-fold (Pucher and others
2005).
The transport sector is the primary contributor to a number of environmental
externalities, such as greenhouse gas (GHG) emissions and local air pollution—
particularly in urban centers—and traffic congestion. Globally the transport
sector accounts for more than 60 percent of oil consumption and about one
quarter of energy-related carbon dioxide (CO2) emissions (IEA 2006).1
In most urban centers around the world, road transportation is the largest
source of local air pollutants such as carbon monoxide (CO), sulfur dioxide (SO2),
oxides of nitrogen (NOx), volatile organic compounds (VOCs), and total suspended
particulates (TSP). Vehicular emissions account for 40–80 percent of air quality
problems in the megacities in developing countries (Ghose 2002). In rapidly urba-
nizing megacities, air pollution is a serious and alarming problem.2 Air pollution
levels in these cities exceed the air quality standards set by the World Health
Organization (WHO) by a factor of three or more. Air pollution is causing approxi-
mately 2 million premature deaths worldwide every year (WHO 2008). Globally
about 3 percent of mortality from cardiopulmonary disease, about 5 percent of
mortality from cancer of the trachea, bronchus, and lung, and about 1 percent of
mortality from acute respiratory infections in children under five years old are
caused by air pollution (Cohen and others 2005).
Various policy instruments have been implemented or are planned to address
the negative externalities from urban road transportation. These include fiscal
instruments, such as congestion charges, vehicle taxes, fuel taxes, and subsidies
for clean fuels and vehicles. Besides regulatory instruments, such as fuel economy
standards, local air pollution standards have also been implemented. However,
considering the rapid increase in urban transportation externalities, particularly
congestion and emissions, the limited implementation of policies and measures is
inadequate. The expansion of existing instruments and the introduction of new
ones is therefore essential, but such policies and measures are associated with
several issues that require further investigation before they can be recommended
for broader implementation. Some of the pertinent issues include: Which policy
instrument or measure would be the most effective and under what conditions?
Are these policies and measures mutually exclusive? If not, what combination of
these instruments would produce the best results? Answering these questions is
crucial as hundreds of cities across the globe, mostly in developing countries, are
suffering severely from the negative externalities arising from urban road
Timilsina and Dulal 163
at Joint Bank/F
und Library on February 7, 2011
wbro.oxfordjournals.org
Dow
nloaded from
transportation and are currently seeking appropriate instruments to correct them.
This study reviews existing policy instruments and the factors affecting their
selection.
Some existing studies (Acutt and Dodgson 1997; Parry, Walls, and Harrington
2007) have reviewed alternative policy instruments used to reduce urban trans-
portation externalities. These studies, however, focus only on theoretical aspects
of the instruments and do not provide any quantitative information on the
impacts to the economy, environment, or society as a whole.
In the rest of the paper we present estimations of external costs; introduce
different types of policies and measures to control transport sector externalities;
discuss factors influencing policy choices; summarize our key conclusions.
External Costs of Urban Transportation
A large number of studies (for example ADB 2002; World Bank 2002; Deng
2006; Jakob, Craig, and Fisher 2006; ADB and ASEAN 2007) have estimated the
cost of different externalities arising from urban transportation for different
regions in the world. These estimates vary significantly from country to country,
not only because of varying levels of externalities, but also due to the difference
in methods and underlying assumptions. Since it is not feasible to discuss all
available studies, we briefly present estimates of external costs, particularly in
developing countries, for the purpose of illustration.3
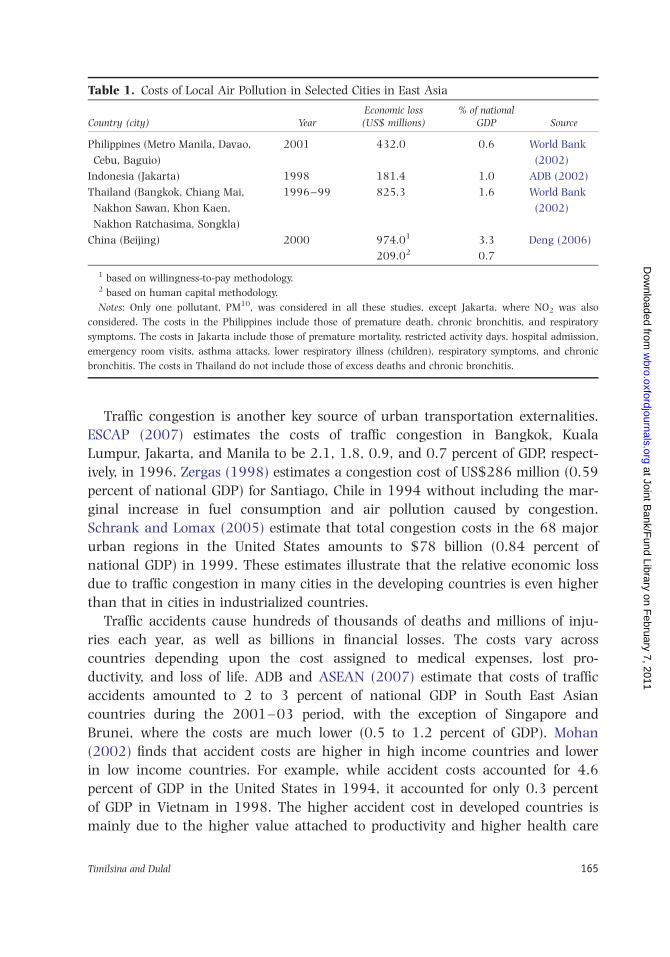
One of the major environmental concerns regarding vehicular transport is its
costs to society in terms of local and global pollution. Table 1 presents the magni-
tude of the costs of one local air pollutant, a particulate matter of size 10 micro-
grams (PM10), in selected cities in East Asia. As can be seen from the table, the
cost of a single air pollutant could range from approximately 1 to 3 percent of
national gross domestic product (GDP).
Note that the costs vary significantly, depending on several factors, such as the
components of costs considered and the methodology used to estimate the costs.
For example, the cost in Indonesia also includes costs of restricted activity days,
hospital admission, and emergency room visits, whereas these costs were not
included in the case of the Philippines. The cost estimated for Beijing using the
willingness-to-pay method is more than four times as high as that estimated
using the human capital approach. The magnitude of local air pollution costs is
relatively smaller in industrialized countries as compared to developing countries
because of the pollution control policies already in place. For example, Jakob,
Craig, and Fisher (2006) estimate the cost of local air pollution from road trans-
portation in Auckland, New Zealand at NZ$58.4 million (or 0.2 percent of the
region’s GDP) in 2001.
164 The World Bank Research Observer, vol. 26, no. 1 (February 2011)
at Joint Bank/F
und Library on February 7, 2011
wbro.oxfordjournals.org
Dow
nloaded from
Traffic congestion is another key source of urban transportation externalities.
ESCAP (2007) estimates the costs of traffic congestion in Bangkok, Kuala
Lumpur, Jakarta, and Manila to be 2.1, 1.8, 0.9, and 0.7 percent of GDP, respect-
ively, in 1996. Zergas (1998) estimates a congestion cost of US$286 million (0.59
percent of national GDP) for Santiago, Chile in 1994 without including the mar-
ginal increase in fuel consumption and air pollution caused by congestion.
Schrank and Lomax (2005) estimate that total congestion costs in the 68 major
urban regions in the United States amounts to $78 billion (0.84 percent of
national GDP) in 1999. These estimates illustrate that the relative economic loss
due to traffic congestion in many cities in the developing countries is even higher
than that in cities in industrialized countries.
Traffic accidents cause hundreds of thousands of deaths and millions of inju-
ries each year, as well as billions in financial losses. The costs vary across
countries depending upon the cost assigned to medical expenses, lost pro-
ductivity, and loss of life. ADB and ASEAN (2007) estimate that costs of traffic
accidents amounted to 2 to 3 percent of national GDP in South East Asian
countries during the 2001–03 period, with the exception of Singapore and
Brunei, where the costs are much lower (0.5 to 1.2 percent of GDP). Mohan
(2002) finds that accident costs are higher in high income countries and lower
in low income countries. For example, while accident costs accounted for 4.6
percent of GDP in the United States in 1994, it accounted for only 0.3 percent
of GDP in Vietnam in 1998. The higher accident cost in developed countries is
mainly due to the higher value attached to productivity and higher health care
Table 1. Costs of Local Air Pollution in Selected Cities in East Asia
Country (city) YearEconomic loss
(US$ millions)% of national
GDP Source
Philippines (Metro Manila, Davao,
Cebu, Baguio)
2001 432.0 0.6 World Bank
(2002)
Indonesia (Jakarta) 1998 181.4 1.0 ADB (2002)
Thailand (Bangkok, Chiang Mai,
Nakhon Sawan, Khon Kaen,
Nakhon Ratchasima, Songkla)
1996–99 825.3 1.6 World Bank
(2002)
China (Beijing) 2000 974.01 3.3 Deng (2006)
209.02 0.7
1 based on willingness-to-pay methodology.2 based on human capital methodology.
Notes: Only one pollutant, PM10, was considered in all these studies, except Jakarta, where NO2 was also
considered. The costs in the Philippines include those of premature death, chronic bronchitis, and respiratory
symptoms. The costs in Jakarta include those of premature mortality, restricted activity days, hospital admission,
emergency room visits, asthma attacks, lower respiratory illness (children), respiratory symptoms, and chronic
bronchitis. The costs in Thailand do not include those of excess deaths and chronic bronchitis.
Timilsina and Dulal 165
at Joint Bank/F
und Library on February 7, 2011
wbro.oxfordjournals.org
Dow
nloaded from
costs. Because the cost of life lost in an accident is higher than the value of
time lost to traffic congestion, the external costs of accidents tend to be higher
than the external costs of congestion. In 2006, accident costs accounted for
$164.2 billion compared to $67.6 billion for congestion in the United States
(Cambridge Systematics 2008).
Policy Instruments to Reduce External Costs
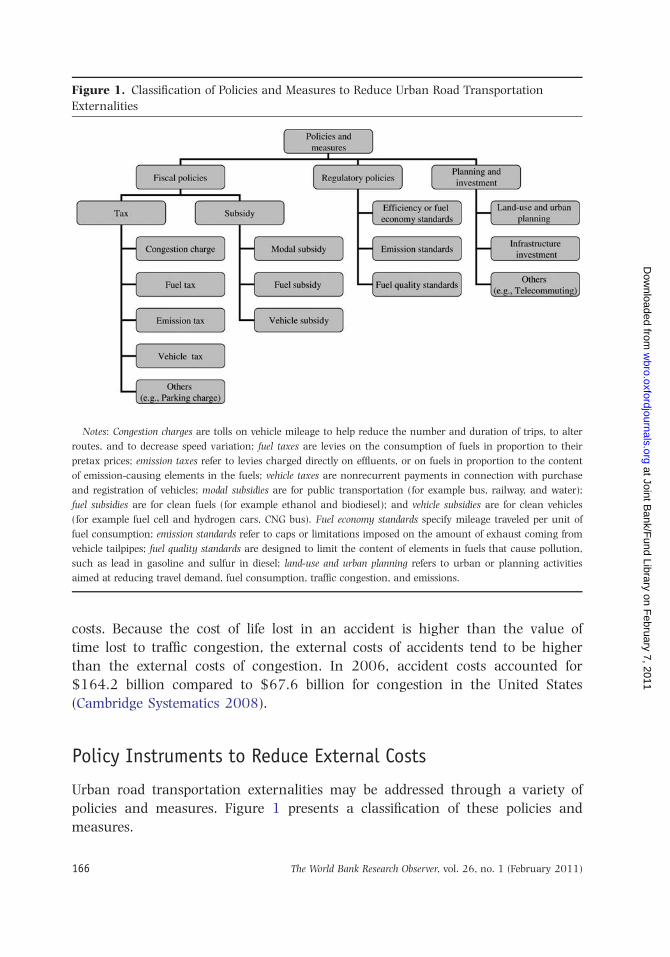
Urban road transportation externalities may be addressed through a variety of
policies and measures. Figure 1 presents a classification of these policies and
measures.
Figure 1. Classification of Policies and Measures to Reduce Urban Road Transportation
Externalities
Notes: Congestion charges are tolls on vehicle mileage to help reduce the number and duration of trips, to alter
routes, and to decrease speed variation; fuel taxes are levies on the consumption of fuels in proportion to their
pretax prices; emission taxes refer to levies charged directly on effluents, or on fuels in proportion to the content
of emission-causing elements in the fuels; vehicle taxes are nonrecurrent payments in connection with purchase
and registration of vehicles; modal subsidies are for public transportation (for example bus, railway, and water);
fuel subsidies are for clean fuels (for example ethanol and biodiesel); and vehicle subsidies are for clean vehicles
(for example fuel cell and hydrogen cars, CNG bus). Fuel economy standards specify mileage traveled per unit of
fuel consumption; emission standards refer to caps or limitations imposed on the amount of exhaust coming from
vehicle tailpipes; fuel quality standards are designed to limit the content of elements in fuels that cause pollution,
such as lead in gasoline and sulfur in diesel; land-use and urban planning refers to urban or planning activities
aimed at reducing travel demand, fuel consumption, traffic congestion, and emissions.
166 The World Bank Research Observer, vol. 26, no. 1 (February 2011)
at Joint Bank/F
und Library on February 7, 2011
wbro.oxfordjournals.org
Dow
nloaded from
Fiscal Policy Instruments
Fiscal policy instruments are price-based instruments. They include fuel taxes (for
example an excise tax on fuel or a BTU tax), vehicle taxes (for example an owner-
ship, licensing or registration fee), emission and/or pollution taxes or charges (for
example a carbon tax, a sulfur tax), congestion charges or toll taxes, and subsi-
dies (for example for clean fuels, efficient vehicles, and public transportation).
Fuel Tax. Traditionally the fuel tax has been a common instrument to raise gov-
ernment revenues with low administrative costs; it is also used to generate
revenue to finance road maintenance. In many countries, fuel taxes are principal
sources of government revenue. For example in developing countries like Niger,
Nicaragua, South Korea, and Cote d’Ivoire, fuel taxation accounts for more than
20 percent of total state revenue. In industrialized countries, too, fuel taxes are
primary sources of government revenue. For example, in 2004, fuel taxes
accounted for 10 percent of state revenue in the Netherlands, 12 percent in
France, 17 percent in Spain, 17 percent in Japan, and 12 percent in the United
States (Metschies 2005).
Although the fuel tax is introduced mainly to generate government revenues, it
could have a significant impact on the reduction of emissions and traffic conges-
tion. For example, Eltony (1993) finds that a 10 percent increase in fuel price
would cause 75 percent of households to reduce their vehicle mileage within a
year. As a result, 15 percent of households would switch to smaller vehicles and
10 percent to more efficient ones. Hirota, Poot, and Minato (2003) show that a
1 percent increase in the fuel tax would reduce vehicle-miles traveled (VMT) by
0.042 percent. According to Sterner (2006), had the other Organisation for
Economic Co-operation and Development (OECD) countries introduced a gasoline
tax at the level of EU countries such as Italy, the United Kingdom, and the
Netherlands, gasoline consumption in OECD countries would have been reduced
by 44 percent. Conversely, if all OECD countries had a low gasoline tax like the
United States, total OECD gasoline consumption would have been 31 percent
higher.
Vehicle Tax. While fuel taxes are expected to reduce vehicle utilization, vehicle
taxes are expected to discourage vehicle ownership. Various factors are considered
while designing vehicle taxes. These taxes are based on fuel economy in
Denmark, on emission standards in Germany, on vehicle gross weight and fuel
type in Sweden and the Netherlands, and on CO2 emissions in France and the
United Kingdom (Kunert and Kuhfeld 2007). Engine model and engine capacity
are also considered in some countries, such as Thailand, the Philippines, and
Malaysia (Hirota, Poot, and Minato 2003).
Timilsina and Dulal 167
at Joint Bank/F
und Library on February 7, 2011
wbro.oxfordjournals.org
Dow
nloaded from
In some countries, such as Singapore, vehicle taxes have been used as the
primary measure for discouraging private transportation, thereby reducing air
pollution and congestion. Vehicle ownership taxes, including the Additional
Registration Fee, Excise Duty, annual Road Tax, and the Vehicle Quota System
(VQS), have significantly discouraged private vehicle ownership in the country
since the 1970s (Willoughby 2000). During 1990–2002, the VQS succeeded in
bringing down the average annual motor vehicle population growth rate to 2.8
from 4.2 percent (Santos, Li, and Koh 2004). Similarly, strong growth in the
vehicle fleet, especially private cars and motorcycles, was successfully curbed
through a registration tax and an annual license fee in Hong Kong (Khan 2001).
Car-related taxes play an important role in reducing overall VMT and CO2 emis-
sions. Using data from 68 large cities, 49 OECD countries, and 19 non-OECD
Asian countries, Hirota, Poot, and Minato (2003) show that for every 1 percent
increase in ownership taxes, VMT decreases by 0.22 percent, and for every 1
percent increase in acquisition taxes, VMT decreases by 0.45 percent. Similarly a
1 percent increase in acquisition and ownership taxes was found to decrease CO2
emissions by 0.19 percent.
Emission Taxes. Three types of emission taxes are normally proposed, and in some
cases introduced, in order to reduce emissions from urban road transportation.
These are: (i) taxes on local air pollutants such as suspended particulate matters
(SPMs) and VOCs; (ii) taxes on local as well as regional air pollutants, such as
NOx and SOx(for example a “sulfur tax”); and (iii) taxes on GHG emissions (for
example a “carbon tax”). The first type of taxes is not common. The second type
has been introduced in a number of cities, such as Tokyo. A reduction in the
sulfur content of fuel is important not only to reduce SO2 emissions, but also to
improve the effectiveness of catalysts used to reduce NOx. The carbon tax is the
most widely discussed policy instrument in the literature due to overwhelming
interest from researchers on climate change. Since a carbon tax can be introduced
uniformly to all types of energy consumers (for example households, industry,
government), literature on carbon taxes that focuses specifically on emissions
from transportation is not common.
Congestion Charges. Congestion charges have been extensively discussed in the lit-
erature since the concept was pioneered by Arthur Cecil Pigou in 1920. It has
been applied in various parts of the world with varying degrees of success. The
area licensing scheme (ALS), introduced in Singapore in 1975, is probably the
first example of congestion pricing. After 23 years in operation, the ALS was
replaced by an electronic version called the Electronic Road Pricing System in
1998. In 2003, the city of London introduced a congestion charge scheme in
which vehicles entering a 22 square kilometer zone comprising core shopping,
168 The World Bank Research Observer, vol. 26, no. 1 (February 2011)
at Joint Bank/F
und Library on February 7, 2011
wbro.oxfordjournals.org
Dow
nloaded from
government, entertainment, and business districts were required to pay a conges-
tion charge of £5 between 7 a.m. and 6.30 p.m. on weekdays. The charge has
been increased to £8 since July of 2005.
Congestion charges not only help to correct transportation externalities but
can also generate a significant amount of revenue. For example, annual revenues
generated through congestion charges are much higher than the annual operat-
ing costs in Singapore and Norway. Congestion charges are thus designed differ-
ently depending on the goals. In Singapore, the United States, and the United
Kingdom, the primary objective behind road pricing is congestion relief; whereas
in Norway it was initially designed to generate revenue and is currently aimed at
raising environmental quality and safety. In Singapore and the United Kingdom,
motorists pay charges on a daily basis, unlike the United States and Norway
where motorists pay a toll per passage. In Singapore, charges vary, depending on
peak and off-peak periods.4
The primary objective of a congestion charge is to reduce traffic congestion.
The congestion tax system introduced in London, for example, led to a reduction
in city-center traffic of 12 percent, of which 50–60 percent shifted to public
transport (Transport for London 2004). It is estimated that daily inbound traffic
would be reduced by 5 percent in New York if a toll (set at the level of current
tolls on the two parallel Metropolitan Transportation Authority (MTA) tunnels) or
a variable charge (with MTA tolls modified to match it) were introduced on the
East River Bridge. A London-type congestion charge would reduce daily traffic
volume in the city by 9 percent; if full variable pricing were introduced, the
reduction could reach 13 percent (Zupan and Perrotta 2003).
A congestion charge can also help reduce vehicle emissions. Evans (2007)
shows that the distance vehicles traveled across London was reduced by approxi-
mately 211 million kilometers per year with a £5 charge, and 237 million kilo-
meters per year with an £8 charge. The value of CO2 emissions saved was £2.3
million and £2.5 million with the £5 and £8 charges, respectively. Rich and
Nielson (2007) estimate that proposed road-user charging schemes in
Copenhagen could reduce CO2 emissions by anywhere from 11.5 million tons to
154 million tons annually, depending upon the type of congestion charge, such
as a distance charge, a large toll ring, or a small toll ring. Daniel and Bekka
(2000) find that vehicle emissions in Delaware could be reduced by as much as
10 percent on aggregate and by 30 percent in highly congested areas through
the use of a congestion charge.
Subsidies. Three types of subsidies are common in the transport sector. These are
subsidies to: public transportation (for example bus, railway, and water); clean
fuels (for example ethanol and biodiesel); and clean vehicles (for example fuel cell
and hydrogen cars, compressed natural gas (CNG) buses). While subsidies for
Timilsina and Dulal 169
at Joint Bank/F
und Library on February 7, 2011
wbro.oxfordjournals.org
Dow
nloaded from
public transportation could reduce both emissions and congestion, subsidies for
cleaner fuels and vehicles do not necessarily help reduce congestion.
Subsidies for public transportation could be the main fiscal instrument for
modal shifting from private transportation (for example car) to public transpor-
tation (for example rail or bus). Public transportation is already subsidized in
many countries around the world for several reasons. In developing countries,
public transport subsidies are necessary mainly because low-income households
can neither afford to own private vehicles nor pay the actual fare if public trans-
portation is not subsidized. Public transportation is highly subsidized in industri-
alized countries as well. For example, only 25 percent of the total capital and
operating expenses in the United States and 50 percent in Europe are covered by
fares for public transit (Brueckner 1987).
Public transportation subsidies can be interpreted as environmental policy
instruments from two angles. First, existing subsidies could have contributed to
both reducing emissions and congestion because some users of public transpor-
tation could have used private transportation and thus increased emissions or
worsened congestion in the absence of such subsidies. For example, Cropper and
Bhattacharya (2007) find that removal of the bus subsidy (that is a 30 percent
increase in fares) would reduce bus commuters by 10–11 percent in Mumbai,
India. Second, additional subsidies on purely environmental grounds could help
reduce emissions and congestion by encouraging travelers to switch to public
from private transportation.
Subsidies are a key fiscal policy instrument for the promotion of clean fuels,
particularly the use of biofuels. Subsidies for biofuels are common practice in
countries where their production is significant (for example in Brazil, the United
States, and Germany). In Brazil, sales taxes on hydrous ethanol (containing
water) and E25 (25 percent ethanol) are smaller than that for gasoline (Coyle
2007). In the European Union, 21 countries grant a tax exemption (full or
partial) for each liter of biodiesel supplied to the market, and 20 countries grant
tax exemptions for ethanol (Kutas, Lindberg, and Steenblik 2007). Biofuel subsi-
dies are often justified on the basis of their alleged positive effects on climate,
energy, and agricultural policy goals.
Several major subsidies and incentives have been introduced by the federal and
state governments in the United States. The federal incentives include: the
Biodiesel Blenders’ Tax Credit, the Small Producer Tax Credit, the Federal
Biobased Products Preferred Procurement Program, the United States Department
of Agriculture (USDA) Energy Systems and Energy Efficiency Improvements
Program, and the USDA Value-Added Producer Grant Program. It is argued that
without the existing federal and state subsidies, which average about $0.80 per
gallon, ethanol production in the United States would not be economically viable
(Saitone, Sexton, and Sexton 2007).
170 The World Bank Research Observer, vol. 26, no. 1 (February 2011)
at Joint Bank/F
und Library on February 7, 2011
wbro.oxfordjournals.org
Dow
nloaded from
There exists a consensus among existing studies that subsidies are necessary to
promote clean vehicles. Rubin and Leiby (2002) argue that, without subsidies, no
substantial hybrid penetration is possible; they estimate that a permanent subsidy
of $1,600 per vehicle would ensure a market share of hybrid vehicles at about
45 percent, while a $4,000 subsidy could increase the share to 90 percent in the
United States. Ichinohe and Endo (2006) show that in order to achieve an
8 percent energy-related CO2 emissions reduction in Japan by 2030 from the
1990 level, the share of hybrid passenger cars in 2030 would need to be 62
percent, which would require a subsidy of $1.23 billion a year. Haan, Peters, and
Scholz (2007) find that tax rebate incentives in Swiss cantons could lead to sig-
nificant increases in sales of such cars in those areas. Similarly Potoglou and
Kanaroglou (2007) find that reduced monetary costs, purchase tax relief, and low
emission rates are the factors that would encourage households to buy cleaner
vehicles within the metropolitan area of Hamilton, Canada. The total cost of the
electric vehicle (EV) is at least 50 percent more than that of gasoline-powered
cars; thus its air pollution mitigation benefits alone would not be enough to give
the EV a clear advantage against all conventional cars (Funk and Rabl 1999).
In many developing countries, EVs and vehicles run on alternate fuels are sub-
sidized by the government. For example, in major Chinese cities, such as Beijing,
Shanghai Tianjin, Shenzhen, Xi’an, Chongqing, and Changchun, local govern-
ments provide financial support to encourage the use of CNG and Liquid
Petroleum Gas in transport (Zhao 2006). In Malaysia, monogas vehicles receive a
50 percent discount and bifuel or dual fuel vehicles receive a 25 percent discount
off the road tax (Hirota, Poot, and Minato 2003).
Other Fiscal Instruments. Other fiscal instruments mainly include parking charges,
which can reduce transport sector externalities by discouraging driving through
an increase in the costs of car use. Parking charges could instigate a switch over
to public transportation from private transportation (Acutt and Dodgson 1997).
For example, a reduction in the parking subsidy from 100 to 30 percent of the
cost of parking for all employees in government offices in Ottawa, Canada led to a
20 percent reduction in single car trips and also caused a modal shift through a
17 percent increase in public transit use within a year (Wilson and Shoup,
1990). Through simulation studies of five British cities, Dasgupta and others
(1994) demonstrate that doubling parking charges reduces the share of central
area trips by car by 13 percent.
Regulatory Policy Instruments
Regulatory instruments are legal instruments that alter the behavior of individ-
uals, firms, or both by enforcing technical standards or mandates. They include
Timilsina and Dulal 171
at Joint Bank/F
und Library on February 7, 2011
wbro.oxfordjournals.org
Dow
nloaded from
standards for fuel economy, emissions, and fuel quality. They reduce transport-
sector negative externalities by imposing technological innovations (for example
efficient and less polluting vehicles), mandating cleaner fuels (for example
unleaded gasoline and low sulfur diesel), and compelling the retirement of old
and polluting vehicle stock.
Fuel Economy Standards. Fuel economy standards have been introduced, mainly in
developed countries (for example the United States, Canada, Japan, and European
countries), for a number of reasons, such as energy security, local air pollution,
and climate change. In the United States, although the Corporate Average Fuel
Economy (CAFE) standard is lauded as the main policy instrument to reduce
transport sector emissions, it was initially introduced from an energy security per-
spective in the early 1970s and was aimed at cars and light trucks (light
vehicles). Currently vehicles with a gross vehicle weight rating of 8,500 pounds
or less are legally obliged to comply with CAFE standards. The 2007 Energy Bill
included a provision to achieve 35 mpg by 2020. The CAFE standards resulted in
a remarkable improvement in the average on-road fuel economy of new cars and
light trucks from an average of 14 mpg in the mid-1970s to 21 mpg in the mid-
1990s (Zachariadis 2006). Besides the United States, Australia, Canada, Japan,
China, and South Korea have specified fuel economy standards for their vehicles.5
In Japan, the government has established a set of fuel economy standards for
gasoline and diesel powered light-duty passenger and commercial vehicles. These
targets are to be met by 2005 for diesel and by 2010 for gasoline. The average
fuel economy of gasoline vehicles is expected to increase by 23 percent from the
1995 level by 2010. Regulations for diesel vehicles are structured slightly differ-
ently, including a fixed average regulated emission limit value, which is used for
certification and for production control (Bauner, Laestadius, and Iida 2008).
In Europe, fuel economy standards are expressed in terms of CO2 emissions to
reflect E.U. concerns on climate change. The E.U. automobile industry is com-
mitted to a CO2 emission target of 140 grams per kilometer by 2008/2009, 25
percent lower than the 1995 level of 186 grams per kilometer, with a further
reduction to 120 grams per kilometer by 2012. The Japanese and Korean auto-
manufacturers also signed similar agreements with the European Commission
(EC) in 1999; however, they agreed to meet the target of 140 grams per kilometer
in 2009 instead of 2008 (Dieselnet 2005).
A number of studies have assessed the impacts of fuel economy standards on
fuel consumption and emission reduction (see, for example, DeCicco 1995;
Greene, 1998; Parry, Walls, and Harrington 2007). Improvement of fuel economy
at the rate of 6 percent a year would result in savings of 2.9 million barrels of
gasoline a day and 147 million metric tons of carbon emissions a year (DeCicco
1995). CAFE standards have led to about a 50 percent increase in on-road fuel
172 The World Bank Research Observer, vol. 26, no. 1 (February 2011)
at Joint Bank/F
und Library on February 7, 2011
wbro.oxfordjournals.org
Dow
nloaded from
economy for light-duty vehicles during the period 1975 –95 so that consumers,
in the late 1990s, spent over $50 billion a year less on fuel than what they other-
wise would have spent at 1975 mpg levels (Greene 1998).
Emission Standards. The implementation of emission standards is the most direct
way of reducing local air pollution (such as CO, VOC, SPM). These emissions
require substantial reduction to meet local ambient air quality standards, and
they cannot be effectively reduced through fiscal or other regulatory instruments.
Emission standards have been introduced in practice in many countries since the
1970s. However, levels of emission standards, vehicle coverage, monitoring, and
enforcement differ across countries.
In the United States, emissions standards for CO, VOC, and NOx have been in
place since 1975 (USEPA 1999). Among the states, California, which began to
regulate vehicle emissions before the federal government, leads in imposing strin-
gent environmental regulations.
In Canada, the federal government introduced the On-Road Vehicle and Engine
Emission Regulations in 1999 for vehicles and engines manufactured or imported
into Canada on or after January 1, 2004. The regulations are similar to estab-
lished emission standards and test procedures for on-road vehicles in the United
States (CONCAWE 2006).
In Europe, emission regulations have been implemented since the late 1970s
and early 1980s (CONCAWE 2006). The European Union adopted Euro I, Euro
III, and Euro IV standards in 1996, 2000, and 2005, respectively. Euro V regu-
lations, which new models were obliged to meet starting October 1, 2008, and
new registrations of vehicle models certified earlier are supposed to meet starting
October 1, 2009, are even more stringent (Bauner, Laestadius, and Iida 2008). In
Japan, the emission standards are on a par with standards adopted in Europe and
the United States.
In response to rapidly deteriorating urban air pollution, developing countries
have also initiated adoption and enforcement of emission standards. Stringency of
the standard, however, varies across countries and cities depending upon the level
of air pollution and other factors. Emission standards in these countries are softer
compared to those in developed countries. However, some developing countries,
such as China, aim to introduce Euro IV standards starting from 2010 (Liu and
others 2008). Countries such as Bangladesh, India, Indonesia, Sri Lanka, Nepal,
Singapore, South Africa, Argentina, Brazil, and Chile have introduced Euro stan-
dards, whereas Malaysia, the Philippines, South Korea, and Saudi Arabia have
implemented U.S. emission regulations. Some countries like Colombia, Ecuador,
and Mexico have provided flexibility by adopting both the U.S. equivalents and
E.U. standards.
Timilsina and Dulal 173
at Joint Bank/F
und Library on February 7, 2011
wbro.oxfordjournals.org
Dow
nloaded from
Fuel Quality Standards. Realizing the public health danger of pollutants such as lead
and oxides of sulfur, many countries started reducing the level of these elements in
fuels in the early 1990s. Starting in January, 1995, leaded gasoline sales were
banned in the United States. Similarly leaded gasoline was banned in the European
Union, effectively from January 1, 2000, although some countries like Greece, Italy,
and Spain were granted a grace period of some extra years to phase out lead. Use of
leaded gasoline has been banned in many developing countries as well. For
example, it was banned in sub-Saharan Africa on January 1, 2006.
The sulfur content of fuels has also been cut substantially in several countries.
In the United States, the gasoline sulfur content standard has been set at less
than 5 milligrams per kilogram since 2007 through a sulfur control program
introduced in 2004. EU Directive 2003/17/EC introduced a new phase-in require-
ment for both gasoline and diesel, restricting the maximum sulfur content to 10
milligrams per kilogram from January 1, 2009 (CONCAWE 2006).
Fuel quality regulations and specifications have been introduced in many devel-
oping countries. The standards, however, vary significantly across countries. In
countries like Argentina, Kenya, and Bolivia, the maximum allowable limit for
sulfur in fuels is 500 milligrams per kilogram, which is one fourth of that in
Pakistan, one third of that in Guatemala, El Salvador, Honduras, Malaysia, and
Tanzania, and half of that in Bangladesh, India, the Philippines, Thailand,
Columbia, Paraguay, Nicaragua, and Panama (CONCAWE 2006).
China is taking aggressive steps toward containing hazardous components in
fuel. Leaded gasoline was successfully phased out by the local government in
Beijing by 1998. At present, sulfur content ranges from 300 to 500 ppm for gaso-
line and from 500 to 800 ppm for diesel fuel in Beijing (Hao, Hu, and Fu 2006).
Other Laws and Regulations. Although fuel economy standards, emission standards,
and fuel quality standards are the most frequently used regulatory instruments,
several others have been experimented with, to varying degree of success. Italy has
adopted a policy which bans private cars from entering city centers. In Swiss cities
such as Bern and Zurich, the restrictive measures taken by the government has made
driving so difficult that many Swiss prefer riding public transport to reach the city
centers (Bonnel 1995). Mexico City instituted the so called “No-Driving Day”
program in 1989, which mandated not driving one day during the week (Monday to
Friday) and two days during serious pollution episodes. During the weekends, odd and
even license plate numbers are used, which forces one half of all cars to be parked.
Planning and Investment
Planning and investment includes urban or regional planning activities that may
lower the level of externalities from transportation by reducing travel demand,
174 The World Bank Research Observer, vol. 26, no. 1 (February 2011)
at Joint Bank/F
und Library on February 7, 2011
wbro.oxfordjournals.org
Dow
nloaded from
fuel consumption, traffic congestion, and emissions. This includes the expansion
of existing, and the construction of new, infrastructure, such as bus rapid transit
(BRT), surface train, subways and metros.
Land Use and Urban Planning. Transport sector externalities can be reduced
through land use and urban planning that leads to less urban sprawl and lower
dependence on vehicular transportation. Several studies have shown that there
exists a statistically significant relationship between the intensity of land use and
the frequency and duration of vehicle travel (Frank and Pivo 1995; Mindali,
Raveh, and Salomon 2004). A number of studies, such as Newman and
Kenworthy (1989) and Bagley and Mokhtarian (1998), suggest that higher
density reduces transport energy consumption (and thereby associated emissions)
by lowering the vehicle miles traveled.
Using data from 84 cities around the world, Lyons and others (2003) empiri-
cally demonstrate that minimizing the outward growth of cities and providing
support for compact city planning principles directly benefits the environmental
quality of cities. Through a comparative study of two Nashville, Tennessee neigh-
borhoods, NDRC (2003) finds that the neighborhood that was 68 percent denser
had 25 percent fewer vehicle miles traveled and 7 percent less toxic emissions per
capita per day. Holden and Norland (2005) show, based on the results of a survey
conducted in eight residential areas in Oslo, Norway, that increased densities lead
to low energy use for both housing and everyday travel. Litman (2005) finds that
people living in city centers in Davis, California typically drive 20–40 percent
less, and walk, cycle, and use public transit two to four times more than their
suburban counterparts. In the greater Toronto area, average commuter distance
increases by 0.25 kilometer for every one kilometer away from the city’s central
business district, and the average commuter distance increases by 0.38 kilometer
for every one kilometer away from the major suburban employment center (Miller
and Ibrahim 1998). Based on ex post evaluation of 30 years of compact urban
development in the Netherlands, Geurs and van Wee (2006) conclude that urban
sprawl, car use, emissions, and noise levels would have been much higher than
their current levels had there been no compact urban development policies.
Infrastructure Investment. Investments in public transport infrastructure, particu-
larly bus rapid transit (BRT) and railways (for example metro, surface, and elev-
ated rails), help reduce all types of externalities (that is congestion, emissions, and
accidents). For example, commuter rail produces almost half as much CO2 emis-
sions as an average car trip per passenger kilometer of travel in the United States
(ABA 2007). Similarly BRT is considered to be one of the more environmentally
friendly modes of urban transportation as it leads to reduced travel duration,
improved air quality, increased pedestrian space and bike use, and less private
Timilsina and Dulal 175
at Joint Bank/F
und Library on February 7, 2011
wbro.oxfordjournals.org
Dow
nloaded from
vehicle use (Molina and Molina 2004). The TransMilenio BRT project in Bogota,
Colombia is estimated to have reduced: the emission of CO2 by 14.6 million
metric tonsduring the first 30 years of its operation; 93 percent of traffic fatalities;
40 percent of local air pollutants; and 32 percent of travel time as compared to
the transportation that would have been implemented otherwise (Lee 2003). The
BRT system in Mexico City is expected not only to reduce CO2 emissions by 0.28
metric tons but also to produce US$3 million in health benefits each year from
reduced local air pollutants (Vergara and Haeussling 2007).
Over the last two decades, BRT has been promoted to address transport sector
externalities in both industrialized and developing countries. Several cities in
industrialized countries have expanded existing coverage or constructed new BRT
systems, including Pittsburgh, Los Angeles, and Honolulu in the United States;
Ottawa in Canada; Brisbane and Adelaide in Australia; Leeds, London, Reading,
and Ipswich in the United Kingdom; Nantes in France; Eindhoven in the
Netherlands; and Nagoya in Japan. Similarly many developing countries have
also constructed BRT systems, such as China (Beijing), Thailand (Bangkok), India
(Delhi and Hyderabad), Bangladesh (Dhaka), Ghana (Accra), South Africa (Cape
Town), Senegal (Dakar), Tanzania (Dar es Salaam), Guatemala (Guatemala City),
Peru (Lima), and Chile (Santiago).
Other infrastructure investments, such as metro, light rail, and electric bus
systems, have been tried with mixed success. Mackett and Edwards (1998)
observe reductions in private vehicle use and congestion as a result of metro
systems in Atlanta and Baltimore, and metro and light rail systems in Memphis
and Miami in the United States, but find no evidence of such reductions in other
cities such as Adelaide (Australia), Manchester (United Kingdom), and San Jose
(United States), although air pollution is seen to be mitigated in Sacramento
(United States). Using a unique panel dataset for five major cities—Boston,
Atlanta, Chicago, Portland, and Washington DC—that upgraded their rail transit
systems in the 1980s, Baum-Snow and Kahn (2000) show that investment in rail
reduces private car use, reduces congestion, and improves the environment. The
Trolleybus System in Quito, Ecuador has been successful in substituting private
with public transportation. The 11.2 kilometer trolley bus line is estimated to
reduce the emission of contaminants by 400 tons annually; it has also reduced
travel time by 50 percent (Rogat 2003).
Telecommuting. Telecommuting refers to working from a distance (for example
home or neighborhood business centers) instead of commuting to an office to
work. The increased penetration of cellphones and internet access could make tel-
ecommuting a viable alternative in both industrialized and developing countries.
Until now, telecommuting has been practiced primarily in industrialized countries.
The database of the Statistical Indicators Benchmarking the Information Society
176 The World Bank Research Observer, vol. 26, no. 1 (February 2011)
at Joint Bank/F
und Library on February 7, 2011
wbro.oxfordjournals.org
Dow
nloaded from
indicates that the teleworking labor force accounts for 25 percent of the total
labor force in the United States and 5 percent (Spain) to 26 percent (the
Netherlands) of the total labor force in European countries in 2002 (Gareis,
Husing, and Mentrup 2004).6
A number of studies have been carried out to assess the impacts of telecommut-
ing, particularly on congestion and air pollution. Koenig, Henderson, and
Mokhtarian (1996) show that home-based telecommuting reduces personal
vehicle trips by 27 percent, VMT by 77 percent, total organic gas emissions (TOC)
by 48 percent, CO emissions by 64 percent, NOx emissions by 69 percent, and
particulate matters (PM) emissions by 78 percent as compared to nontelecom-
muting days. Center-based telecommuting reduces VMT by 53 percent, TOC by
15 percent, CO emissions by 21 percent, NOx emissions by 35 percent, and PM
emissions by 51 percent again as compared to nontelecommuting days
(Mokhtarian and Varma 1998).
The reduction potential of telecommuting on transport sector externalities has
also been observed in developing countries. Dissanayake and Morikawa (2003)
investigated the role of telecommuting in reducing transport sector externalities
in Bangkok. Their findings show a significant reduction if telecommuting is inte-
grated with other policy instruments such as road pricing and fuel taxes.
Mamdoohi, Kermansha, and Poorzahed (2006) find that in Tehran jobs such as
working with a PC, talking on the telephone, teamwork, and participating in
meetings are suitable for telecommuting.
The Choice of Policy Instruments
One of the crucial questions most developing countries are currently facing concerns
the type of instruments to introduce to reduce externalities from urban road transpor-
tation. The answer is not straightforward. The principal factor that affects the choice
of a policy instrument is the economic factor. The economics, however, includes indir-
ect as well as direct costs and benefits, including the value of avoided externalities
damage. Technical factors, such as the physical characteristics of the externalities,
and institutional factors, such as institutional capacity, could also play a role.
Efficiency
Economic efficiency compares policy instruments using a broader common
denominator, such as welfare cost. While a large volume of literature estimating
the welfare impacts of some policy instruments, such as fuel taxes, congestion
tolls, and fuel economy standards, is available, this is not the case for other
instruments.
Timilsina and Dulal 177
at Joint Bank/F
und Library on February 7, 2011
wbro.oxfordjournals.org
Dow
nloaded from
The magnitude as well as the direction of the welfare impact of a policy instru-
ment depends on a number of factors, such as the valuation of avoided externality
damages and the ways in which the revenue generated through the instruments
(for example toll revenue, fuel tax revenue) is recycled back into the economy.
Economic intuition suggests that a fuel tax or congestion toll will cause aggregate
welfare loss unless the avoided externality damages are accounted for in welfare
impacts (see for example Parry and Bento 2002; Nelson, Gillingham, and Safirova
2003).7 Revenue recycling schemes significantly influence welfare impacts. Proost
and van Dender (2002) find that if the revenue generated through gasoline taxes
is recycled to cut labor taxes, it would even improve welfare.
Several studies have measured the welfare effects of fuel economy regulations.
The results of the studies, however, differ widely not only in magnitude but also
in the direction of the welfare effect. Kleit (2004) demonstrates that a long-run
increase in the CAFE standard not only causes huge welfare loss but also that it is
an inefficient instrument for fuel conservation. However, this result could change
if the value of avoided externalities were considered. Parry, Walls, and Harrington
(2007) find that, contingent upon how consumers value fuel economy technol-
ogies and their opportunity costs, higher fuel economy standards can produce
anything from significant welfare gains, to very little or no effect, to significant
welfare losses. If the values of reducing oil dependency and climate change are
accounted for, fuel economy standards could be welfare-improving.
Studies of the welfare impacts of other policy instruments, such as emission
standards, subsidies, and infrastructure investment, are not available, and there-
fore it is difficult to confirm if these instruments would generate net benefits to
society. Nevertheless, emission standards are likely to produce net social benefits
because they do not necessarily lead to a cut in fuel consumption and therefore
do not cause welfare loss. Moreover, the value of avoided externalities (for
example the reduction of pollution related mortality and morbidity) would out-
weigh the implementation costs. Similarly infrastructure investment would create
economic spillover through interindustry linkages and job creation and therefore
could increase overall benefits to society.
While literature comparing costs of all the policy instruments considered here
are not available, some studies compare tax and efficiency instruments to control
GHG emissions. Crandall (1992) finds the carbon tax to be much more efficient
than a petroleum tax, which is more efficient than CAFE standards, in reducing
GHG emissions. The CAFE would cost the economy at least 8.5 times as much as
a carbon tax with equivalent effects on carbon emissions. Inefficiency on the part
of the CAFE is mainly due to its failure to equate the marginal costs of reducing
fuel consumption across all uses, including usage of older vehicles and nonvehi-
cular consumption. Several studies (for example Austin and Dinan 2005; West
and Williams 2005; Fischer 2008) empirically demonstrate that a gasoline tax
178 The World Bank Research Observer, vol. 26, no. 1 (February 2011)
at Joint Bank/F
und Library on February 7, 2011
wbro.oxfordjournals.org
Dow
nloaded from
would be cheaper than fuel economy standards in reducing gasoline consumption
and associated emissions. Nivola and Crandall (1995) argue that the United
States would have saved at least as much oil by reducing the number of miles
driven in all types and vintages of vehicles, at about a third of the economic cost,
if a fee of just 25 cents a gallon had been added to the cost of gasoline nine years
ago. Dowlatabadi, Lave, and Russell (1996) demonstrate that enhanced CAFE
standards might have little or no effect on urban air pollution and might generate
a less than proportional reduction in GHG emissions. They also show that the
CAFE is not the most cost effective way of lowering NO, VOC, and GHG emissions.
Portney and others (2003) argue that by reducing the number of gallons con-
sumed per mile, the CAFE standards make driving cheaper, which might lead to
an overall increase in pollution (that is a rebound effect). However, Greening,
Greene, and Difiglio (2000) find that such a rebound effect is very small.
Gallagher and others (2007) argue that, although the CAFE standards are politi-
cally attractive and induce innovation among other things, it might not be the
right policy instrument when it comes to ensuring energy security through
reduced fuel consumption.
Equity
The distributional effects of a policy instrument also influence its choice. For
example, if fuel used for public transportation (for example diesel) is taxed, it
increases the cost of public transportation—the mode mostly used by low income
households—and thus discourages the substitution of high emission private trans-
portation with low emission public transportation. Moreover, taxation on fuels
used for freight transportation increases the costs of transporting goods. Therefore
fuel taxation should be discriminatory and aimed at encouraging the use of
public transportation, resulting in a lower burden on low income households. For
this reason, many developing countries tax gasoline higher as compared to diesel;
sometimes the latter is even subsidized.
The scheme of recycling tax revenue also has important equity implications.
Wiese, Rose, and Schluter (1995) show that both the absolute and relative
burden of the fuel tax on the lowest income households would increase if fuel tax
revenue is allocated by the government for general spending instead of it being
rebated to households. Richardson (1974) and Arnott, de Palma, and Lindsey
(1994) argue that congestion charges could benefit higher income groups that
value the time gained, and that people with small economic margins could be
worse off. As congestion charges disproportionately impact on the travel choice of
lower income households, revenue redistribution is the key to the acceptability of
congestion charging schemes. According to Evans (1992), low-income groups
can benefit from congestion charges if the revenue generated is invested in public
Timilsina and Dulal 179
at Joint Bank/F
und Library on February 7, 2011
wbro.oxfordjournals.org
Dow
nloaded from
transportation as these groups use this transportation more often than higher
income groups. Further strengthening this argument, Eliasson and Mattsson
(2006) demonstrate that women and low-income groups benefit the most when
the revenue from fuel or congestion taxes is used for improving public transport.
The distribution impacts of congestion pricing depend upon where different popu-
lation groups live and work, their mode of transportation for commuting, and the
ways in which revenues collected are allocated. Parry and Bento (2002) show
that the net effect of a revenue-neutral tax on congestion can stimulate labor
force participation at the margin.
Implementability
Most studies comparing the economics of policy instruments (for example fuel tax,
fuel economy standards, emission standards) ignore the costs of implementation.
While this does not affect the total costs of some instruments, such as fuel or emis-
sion tax, it would have significant effects on the total costs of other instruments,
such as emission standards. The implementation of emission standards requires a
system or institution to monitor and enforce the standards, and this is costly.
Existing studies (for example Faiz and others 1990; Mage and Walsh 1992) argue
that without a rigorous inspection and maintenance (I/M) program, smoke and
particulate emissions from vehicles cannot be controlled in developing countries.
Many countries have introduced emission inspection programs for automobiles
(CONCAWE 2006), but the lack of institutional capacity (for example lack of train-
ing of personnel, poor quality test equipment) curtails the effective implemen-
tation of policy instruments, particularly emission standards. In India, for
example, more than 15 percent of drivers do not take I/M tests, and those who
take it pass without truly controlling their emissions (USAID 2004). In Nepal,
between 16 and 32 percent of vehicles failed the emissions test between 2000
and 2002 (Faiz, Ale, and Nagarkoti 2006). In Chongqing, China only 10 percent
of vehicles brought in by drivers failed the emissions test, as against 40 percent
that failed when flagged down by roadside inspectors (USAID 2004).
In low-income countries with limited institutional capacities, an instrument
with smaller or no monitoring costs (for example fuel tax, emission tax) would be
more effective than those requiring large monitoring or administrative and com-
pliance costs.
Balancing the Criteria in Choosing Instruments
Developing a policy framework and balancing various factors within the frame-
work is a key challenge for reducing negative externalities from the transport
sector. The sections below briefly highlight this issue.
180 The World Bank Research Observer, vol. 26, no. 1 (February 2011)
at Joint Bank/F
und Library on February 7, 2011
wbro.oxfordjournals.org
Dow
nloaded from
Framework for Choice. As discussed above, selection of policy instruments depends
on several factors. It is always challenging to compare these factors because some
are quantifiable while others are not. Those such as economic efficiency and dis-
tributional effects can be quantified.8 However, other factors like institutional
capacity, implementation, or administrative hurdles cannot readily be quantified.
Quantitative valuation of factors, notably differences in distributional impacts, is
also elusive. Some policy instruments differ as they have differing objectives, even
if their impacts can be quantified using numerical models (for example reduction
of congestion vs emissions). Therefore an analytical framework consisting of both
quantitative and qualitative assessments are needed to balance various criteria for
selecting a policy instrument or a portfolio of instruments for reducing transport
sector externalities. Acutt and Dodgson (1997) developed a matrix of both quanti-
tative and qualitative indicators (for example costs and benefits to the govern-
ment, consumer welfare, distributional effects, administrative complexity for
implementation) for various policy instruments. Eskeland and Jimenez (1992)
also discuss various criteria for choosing policy instruments for pollution control
in developing countries.
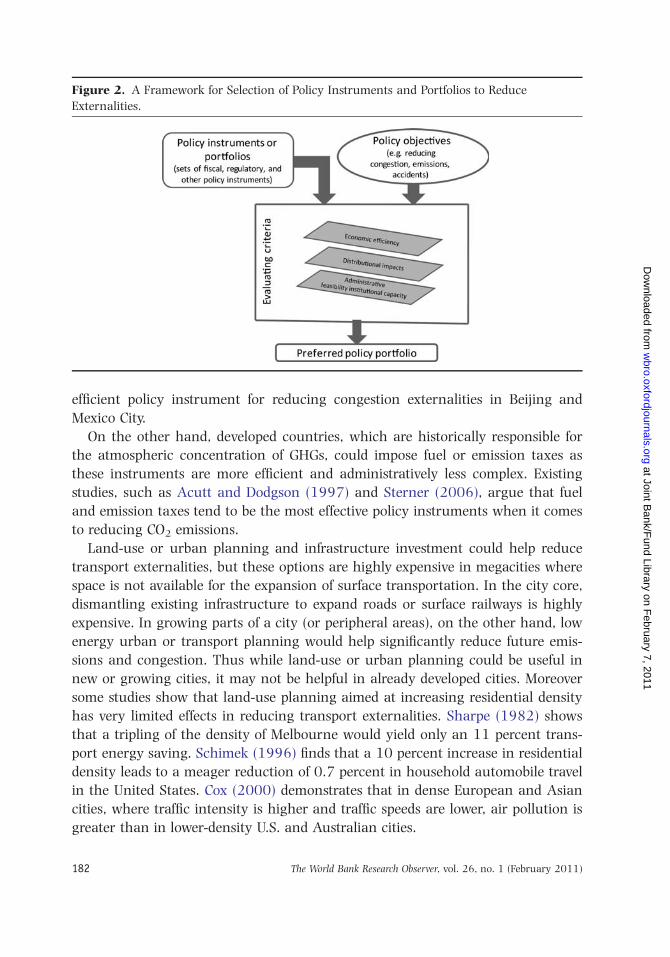
A simplified representation of a framework for selecting among portfolios of
policy instruments is presented in figure 2. The first step is to define the objectives
of the policy intervention. In order to accomplish the objectives, various combi-
nations of policy instruments then need to be evaluated against various criteria,
including economic efficiency, distributional effects, and administrative feasibility
or institutional capacity. Consideration of multiple criteria would be necessary
because some policy instruments are superior to others with respect to one cri-
terion, while the reverse is the case in terms of other criteria.
Country Criteria. Many cities, particularly in developing countries, are facing
severe local air pollution problems. The costs of pollution damage, including costs
of mortality and morbidity due to local air pollution, are significantly higher than
the costs of other emissions such as GHG. Note that most developing countries
with the exception of big emitters, such as China, India, Brazil, Indonesia, and
South Africa, contribute very little to the global concentration of GHG emissions
that cause climate change. Thus they do not consider reducing GHG emissions a
priority. Instead these countries give higher priority to policy instruments that
substantially reduce local air pollution. Obviously emission standards would be
the most effective instruments for reducing local air pollution. Traffic congestion
is emerging as a key problem in many cities in developing countries, causing
huge costs to the economy. Congestion charges could be the most efficient option
for resolving this problem. Anas, Timilsina, and Zheng (2009) and Parry and
Timilsina (2009), for example, find that a congestion toll would be the most
Timilsina and Dulal 181
at Joint Bank/F
und Library on February 7, 2011
wbro.oxfordjournals.org
Dow
nloaded from
efficient policy instrument for reducing congestion externalities in Beijing and
Mexico City.
On the other hand, developed countries, which are historically responsible for
the atmospheric concentration of GHGs, could impose fuel or emission taxes as
these instruments are more efficient and administratively less complex. Existing
studies, such as Acutt and Dodgson (1997) and Sterner (2006), argue that fuel
and emission taxes tend to be the most effective policy instruments when it comes
to reducing CO2 emissions.
Land-use or urban planning and infrastructure investment could help reduce
transport externalities, but these options are highly expensive in megacities where
space is not available for the expansion of surface transportation. In the city core,
dismantling existing infrastructure to expand roads or surface railways is highly
expensive. In growing parts of a city (or peripheral areas), on the other hand, low
energy urban or transport planning would help significantly reduce future emis-
sions and congestion. Thus while land-use or urban planning could be useful in
new or growing cities, it may not be helpful in already developed cities. Moreover
some studies show that land-use planning aimed at increasing residential density
has very limited effects in reducing transport externalities. Sharpe (1982) shows
that a tripling of the density of Melbourne would yield only an 11 percent trans-
port energy saving. Schimek (1996) finds that a 10 percent increase in residential
density leads to a meager reduction of 0.7 percent in household automobile travel
in the United States. Cox (2000) demonstrates that in dense European and Asian
cities, where traffic intensity is higher and traffic speeds are lower, air pollution is
greater than in lower-density U.S. and Australian cities.
Figure 2. A Framework for Selection of Policy Instruments and Portfolios to Reduce
Externalities.
182 The World Bank Research Observer, vol. 26, no. 1 (February 2011)
at Joint Bank/F
und Library on February 7, 2011
wbro.oxfordjournals.org
Dow
nloaded from
Telecommuting could help in reducing transport externalities in cities where
the service sectors (for example banking and government services) are the main
providers of employment. On the other hand, it does not help much in industrial
cities where the physical presence of the labor force is needed in manufacturing
facilities.
Some developing countries that import petroleum products find it hard to
maintain the required fuel quality standards due to the lack of their own refi-
neries. This is because such countries without their own refineries may not be in
a position to enforce regulations related to fuel standards. Nepal, for example,
without its own refinery, depends on imported products and is experiencing
severe air pollution problems related to the high levels of benzene in imported
gasoline (Kiuru 2002).
A policy instrument that works in one country may not necessarily work in
others with different socioeconomic and cultural settings. For example, policy
instruments like the ALS, which was viewed as very successful in Singapore,
might not work in countries like India or Indonesia, due to the different socioeco-
nomic and political settings (Chin 1996).
Multiple Instruments. The existing literature (for example Molina and Molina
2004) suggests that externalities from urban transportation cannot be solved
through one specific policy instrument; instead it requires a portfolio of policy
measures that best suit each city’s specific circumstances. For example, local air
pollutants (such as SPM, CO, VOCs, and lead) require substantial reduction to
avoid their effects on human health. However, policy instruments such as fuel
taxes or fuel economy standards to cut these emissions to the required level
would not be feasible technically and economically. Therefore emission standards
with strong monitoring and enforcement mechanisms are required for this
purpose. On the other hand, taxes and fuel economy standards would be more
efficient options for reducing fuel consumption and CO2 emissions, and a conges-
tion toll would be more effective in reducing traffic congestion. Hence a city suf-
fering from local air pollution and congestion, and emitting significant amounts
of CO2, might benefit from emissions standards, fuel taxes, and congestion
charges.
Imposing vehicle ownership taxes may discourage car ownership but not its
use by motorists. In order to discourage both ownership and usage, it may be
necessary to implement car ownership taxes and other charges related to vehicle
use concurrently (Faiz and others 1990). Thus a well-designed tax on vehicle
ownership and use would be more effective than the introduction of these instru-
ments in isolation.
Although urban planning can be an effective means of reducing travel
demand, preventing fragmentation, and providing opportunities to choose more
Timilsina and Dulal 183
at Joint Bank/F
und Library on February 7, 2011
wbro.oxfordjournals.org
Dow
nloaded from
environmentally friendly modes of transport, it alone is not capable of reducing
all the negative externalities associated with the transport sector. The scale of
urban transportation externalities can be reduced significantly only when the
land-use or urban planning approach is combined with an appropriate set of
infrastructure, management, and pricing measures.
Conclusions
In this study we have illustrated the magnitude of the external costs of urban
transportation in developing countries and discussed the choices of policy instru-
ments to reduce these externalities. The costs of these externalities to society
amount to billions of dollars every year in many countries. The existing literature
indicates that the relative magnitudes of local air pollution and congestion costs
(that is in terms of percentage of GDP) are even higher in developing countries as
compared to those in industrialized ones. The costs, however, also vary signifi-
cantly due to methodological differences, coverage of externality components, and
underlying assumptions.
There exist three types of policies and measures to control the externalities: (i)
fiscal policies, such as fuel and emission taxes, congestion charges and subsidies
for clean fuel and vehicles, and public transportation; (ii) regulatory policies, such
as standards for fuel economy, emissions, and fuel quality; and (iii) planning and
investment measures, such as land-use or urban planning and infrastructure
investment. These policies and measures are not mutually exclusive. Instead there
exists a general consensus in the literature that a portfolio approach or proper
integration of various policies and measures is necessary to reduce effectively
externalities from urban road transportation.
Local air pollution is the priority concern for many developing countries; there-
fore emission standards would be the most appropriate in those countries which
have not already introduced standards to reduce local air pollution. Other policy
instruments, such as fuel economy standards, congestion or fuel taxes, urban
planning, and investments, may help but would not be sufficient to reduce local
air pollution to the level required to maintain ambient air quality standards as
specified by the World Health Organization. Developing countries which have
already introduced emissions standards could further strengthen standards and
enforcement mechanisms, depending upon their required local air quality
standards.
Despite the rich theoretical literature, congestion charges are limited in practice
to a few cities in industrialized countries, such as Singapore, London, and
Stockholm. Since it is the most efficient instrument for reducing traffic conges-
tion, megacities in developing countries which are suffering heavy economic
184 The World Bank Research Observer, vol. 26, no. 1 (February 2011)
at Joint Bank/F
und Library on February 7, 2011
wbro.oxfordjournals.org
Dow
nloaded from
losses due to congestion should consider congestion taxes. Although infrastruc-
ture investments, such as expansion of roads, could help reduce congestion, this
might not reduce fuel consumption and emissions. Moreover the expansion of
roads is often constrained by space in city cores, which suffer the most from
congestion.
Fuel taxes are common around the world, but they have been aimed primarily
at raising government revenues. Still, they are interpreted as policy instruments
for reducing transport sector externalities because the level of these externalities
would be higher in the absence of such taxes. However, a fuel tax should be dis-
criminatory; while fuel used for private vehicles should be taxed, fuels used for
public transportation should not. Otherwise substitution of high emission private
transportation with low emission public transportation would not occur. Fuel
taxes on private transportation are more likely to produce the desired results in
those cities where good public transportation systems exist. Taxing fuel used in
private vehicles, along with investment in public transportation, such as BRT,
could produce better results as compared to policy instruments implemented in
isolation.
Subsidies are provided to public transportation, clean fuels, and clean vehicles.
Public transportation subsidies, common in both industrialized and developing
countries, are not originally intended to reduce emissions. However, they contrib-
ute to the reduction of transport sector externalities as the level of these external-
ities would be higher in the absence of such subsidies. Subsidies also accelerate
the deployment of cleaner vehicles, such as electric vehicles, hybrid vehicles, and
CNG buses. Recycling revenues generated from fuel or congestion taxes for subsi-
dizing clean vehicles is an example of complementing a subsidy policy with a tax
instrument.
Various factors affect the selection of policy instruments for reducing urban
transportation externalities. These include the relative damages of externalities;
economic efficiency and distributional impacts of control measures and policies;
and institutional capacity or administrative feasibility. An analytical framework
that accounts for both quantitative and qualitative assessments of all influencing
factors is necessary for selecting an appropriate portfolio of policy instruments for
reducing negative externalities from urban transportation.
Notes
Govinda R. Timilsina is Senior Research Economist and Hari B. Dulal is a consultant in theDevelopment Research Group, The World Bank, 1818 H Street, NW, Washington, DC 20433, USA.;tel.: 1 202 473 2767; fax: 1 202 522 1151; email address: [email protected]. Theauthors sincerely thank Ashish Shrestha, Roger R. Stough, Christopher J. Sutton, ZacharyA. Moore, Gershon Feder, Walter Vergara, Maureen Cropper, Mike Toman, Patricia Mokhtarian, Jack
Timilsina and Dulal 185
at Joint Bank/F
und Library on February 7, 2011
wbro.oxfordjournals.org
Dow
nloaded from
Nilles, Asif Faiz, and Alex Anas for providing insightful comments on the whole or parts of thepaper. The views expressed in this paper are those of the authors only and do not necessarily rep-resent the World Bank and its affiliated organizations.
1. As of year 2006.2. Beijing, Cairo, Dhaka, Jakarta, Mexico City, and Shanghai rank in the top ten cities in the
world in terms of emissions of TSP, SO2, and NO2 (Gurjar and others 2008).3. See VTPI (2009) for the literature on estimating the external costs of transportation.4. “Congestion charge” and “road pricing” are used interchangeably in some literature. In this
paper we have distinguished between the two and focus only on congestion charges, as the purposeof road pricing could be different from reducing traffic congestion (for example revenue generation).
5. The programs in Australia and Canada were started in the late 1970s. While the Australianprogram is a voluntary one, the Canadian program has been mandatory since 1982 and resemblesthe U.S. CAFE standards.
6. Note that the number of teleworkers or telecommuters alone does not say much about theirrole in reducing congestion and emissions; a more important factor is how frequently (how manydays in a year) they telecommute.
7. Depending upon revenue recycling schemes, some households might experience an increase inwelfare (see for example Evans 1992; Proost and van Dender 2002; Eliasson and Mattsson 2006).
8. Existing studies, such as Parry and Bento (2002) and Parry and Timilsina (2009), developedanalytical models to measure economic efficiency of various fiscal policy instruments. Wiese, Rose,and Schluter (1995) developed an applied general equilibrium model to measure distributionaleffects of a fiscal policy instrument. Studies such as West and Williams (2005) and Austin andDinan (2005) developed analytical models to quantify economic efficiency of regulatory policyinstruments. Anas, Timilsina, and Zheng (2009) developed a multilogit model to compare fiscal andregulatory policy instruments.
References
ABA (American Bus Association). 2007. Comparison of Energy Use and CO2 Emissions from DifferentTransportation Modes. Washington, DC: American Bus Association.
Acutt, M.Z., and J.S. Dodgson. 1997. “Controlling the Environmental Impacts of Transport:Matching Instruments to Objectives.” Transportation Research 2(1):17–33.
ADB (Asian Development Bank). 2002. Study on Air Quality in Jakarta, Indonesia: Future Trends,Health Impacts, Economic Value and Policy Options. Manila, Philippines: ADB.
ADB and ASEAN (Asian Development Bank and Association of South East Asian Nations). (2007).Regional Road Safety Program Accident Costing Reports. Manila: ADB and Jakarta: ASEAN.
Anas, A., G.R. Timilsina, and S. Zheng. 2009. “An Analysis of Various Policy Instruments to ReduceCongestion, Fuel Consumption and CO2 Emissions in Beijing.” World Bank Policy ResearchWorking Paper WPS, 5068. Washington, DC: The World Bank.
Arnott, R., A. de Palma, and R. Lindsey. 1994. “The Welfare Effects of Congestion Tolls withHeterogeneous Commuters.” Journal of Transport Economics and Policy 28:139–61.
Austin, D., and T. Dinan. 2005. “Clearing the Air: The Costs and Consequences of Higher CAFEStandards and Increased Gasoline Taxes.” Journal of Environmental Economics and Management50(3):562–82.
Bagley, M.N., and P.L. Mokhtarian. 1998. “The Role of Lifestyle and Attitudinal Characteristics inResidential Neighborhood Choice.” In A. Ceder, ed., Transportation and Traffic Theory. ElsevierScience:735–58.
186 The World Bank Research Observer, vol. 26, no. 1 (February 2011)
at Joint Bank/F
und Library on February 7, 2011
wbro.oxfordjournals.org
Dow
nloaded from
Baum-Snow, N., and Matthew E. Kahn. 2000. “The Effects of New Public Projects to Expand Urban
Rail Transit.” Journal of Public Economics 77(2):241–63.
Bauner, D., S. Laestadius, and N. Iida. 2008. “Evolving Technological Systems for Diesel Engine
Emission Control: Balancing GHG and Local Emissions.” Clean Technologies and Environmental
Policy, 11(3).
Bonnel, P. 1995. “Urban Car Policy in Europe.” Transport Policy 2(2):83–95.
Brueckner, J.K. 1987. “The Structure of Urban Equilibria: A Unified Treatment of the Muth-mills
Model.” In Edwin S. Mills, ed., Handbook of Regional and Urban Economics, Vol. II: Urban
Economics.:Amsterdam: North-Holland 821–45.
Cambridge Systematics. 2008. “Crashes vs Congestion: What’s the Cost to Society?” (http://www.
aaanewsroom.net/Assets/Files/20083591910.CrashesVsCongestionFullReport2.28.08.pdf).
Chin, A.T.H. 1996. “Containing Air Pollution and Traffic Congestion: Transport Policy and the
Environment in Singapore.” Atmospheric Environment 30(5):787–801.
Cohen, A.J., H.R. Anderson, B. Ostra, K.D. Pandey, M. Krzyzanowski, N. Kunzli, K. Gutschmidt, A.
Pope, I. Romieu, J.M. Samet, and K. Smith. 2005. “The Global Burden of Disease Due to Outdoor
Air Pollution.” Journal of Toxicology and Environmental Health 68:1–7.
CONCAWE. 2006. Motor Vehicle Emission Regulations and Fuel Specifications: Part 2 Historic Review
(1996–2005). Brussels: CONCAWE.
Cox, W. 2000. “How Smart Growth Intensifies Traffic Congestion and Air Pollution.” Independence
Issue Paper 7-2000, Golden, CO: Independence Institute.
Coyle, W. 2007. “The Future of Biofuels: A Global Perspective.” Amber Waves 5(5):24.
Crandall, R.W. 1992. “Policy Watch: Corporate Average Fuel Economy Standards.” The Journal of
Economic Perspectives 6(2):171–80.
Cropper, M.L., and S. Bhattacharya. 2007. “Public Transport Subsidies and Affordability in
Mumbai, India.” Policy Research Working Paper 4395. Washington, DC: World Bank.
Daniel, J.I., and K. Bekka. 2000. “The Environmental Impact of Highway Congestion Pricing.”
Journal of Urban Economics 47(2):180–215.
Dasgupta, M., R. Oldfield, K. Sharman, and V. Webster. 1994. “Impact of Transport Policies in Five
Cities.” Transport Research Laboratory Project Report PR107, Wokingham, UK: Department of
the Environment and Department of Transport.
DeCicco, J.M. 1995. “Projected Fuel Savings and Emissions Reductions from Light-vehicle Fuel
Economy Standards.” Transportation Research 29(3):205–28.
Deng, X. (2006) “Economic Costs of Motor Vehicle Emissions in China: A Case Study.” Transportation
Research 11(3):216–26.
Dieselnet. 2005. “Cars: Greenhouse Gas Emissions.” (http://www.dieselnet.com/standards/eu/ghg.
php).
Dissanayake, D., and T. Morikawa. 2003. “Analyzing Telecommuting as an Urban Transport Policy
for Developing Countries.” Paper presented at the 21st Road Engineering Association of Asia and
Australasia (REAAA) Conference, Queensland, Australia, May 18–23.
Dowlatabadi, H., L.B. Lave, and A.G. Russell. 1996. “A Free Lunch at Higher CAFE? A Review of
Economic, Environmental and Social Benefits.” Energy Policy 24(3):253–64.
Eliasson, J., and L. Mattsson. 2006. “Equity Effects of Congestion Pricing: Quantitative Methodology
and a Case Study for Stockholm.” Transportation Research 40(7):602–20.
Eltony, M. 1993. “Transport Gasoline Demand in Canada.” Journal of Transport Economics and Policy
27:193–208.
Timilsina and Dulal 187
at Joint Bank/F
und Library on February 7, 2011
wbro.oxfordjournals.org
Dow
nloaded from
ESCAP (United Nations Economic and Social Commission for Asia and the Pacific). 2007.“Sustainable Infrastructure in Asia: Overview and Proceedings.” Seoul Initiative Policy Forum onSustainable Infrastructure. Seoul, Korea, September 6–8, 2006.
Eskeland, G., and E. Jimenez. 1992. “Policy Instruments for Pollution Control in DevelopingCountries.” The World Bank Research Observer 7(2):145 –69.
Evans, A.W. 1992. “Road Congestion Pricing: When Is It a Good Policy?” Journal of TransportEconomics and Policy 26:213–43.
Evans, R. 2007. Central London Congestion Charging Scheme: Ex post Evaluation of the QuantifiedImpacts of the Original Scheme. London: Transport for London.
Faiz, A., B.B. Ale, and R.K. Nagarkoti. 2006. “The Role of Inspection and Maintenance in ControllingVehicular Emissions in Kathmandu Valley, Nepal.” Atmospheric Environment 40(31):5967– 75.
Faiz, A., K. Sinha, M. Walsh, and A. Varma. 1990. “Automotive Air Pollution: Issues and Optionsfor Developing Countries.” Working Paper 492. Washington, DC: World Bank.
Fischer, C. 2008. “Comparing Flexibility Mechanisms for Fuel Economy Standards.” Energy Policy36(8):3106– 14.
Frank, L.D., and G. Pivo. 1995. “Impacts of Mixed Use and Density on the Utilization of ThreeModes of Travel: Single Occupant Vehicle, Transit, and Walking.” Transportation Research Record,Washington, DC.
Funk, K., and A. Rabl. 1999. “Electric versus Conventional Vehicles: Social Costs and Benefits inFrance.” Transportation Research 4:397–411.
Gallagher, K.S., G. Collantes, J. Holdren, H. Lee, and R. Rosch. 2007. “Policy Options for ReducingOil Consumption and Greenhouse-Gas Emissions from the U.S. Transportation Sector.” ETIPDiscussion Paper, summer. Belfer Center for Science and International Affairs, HarvardUniversity.
Gan, L. 2003. “Globalization of the Automobile Industry in China: Dynamics and Barriers inGreening of the Road Transportation.” Energy Policy 31(6):537–51.
Gareis, K., T. Husing, and A. Mentrup. 2004. “What Drives eWork? An Exploration intoDeterminants of eWork Uptake in Europe.” Paper presented at the 9th International TeleworkWorkshop, September, 6– 9, Heraklion, Greece.
Geurs, K.T., and B. van Wee. 2006. “Ex post Evaluation of Thirty Years of Compact UrbanDevelopment in the Netherlands.” Urban Studies 43(1):139–60.
Ghose, M.K. 2002. “Controlling of Motor Vehicle Emissions for a Sustainable City.” TERI InformationDigest on Energy and Environment 1(2):273–88.
Greene, D.L. 1998. “Why CAFE Worked?” Energy Policy 26(8):595–613.
Greening, L.A., D.L. Greene, and C. Difiglio. 2000. “Energy Efficiency and Consumption: TheRebound Effect—A Survey.” Energy Policy 28:389–401.
Gurjar, B.R., T.M. Butler, M.G. Lawrence, and J. Lelieveld. 2008. “Evaluation of Missions and AirQuality in Megacities.” Atmospheric Environment 42:1593–606.
Haan, P.D., A. Peters, and R.W. Scholz. 2007. “Reducing Energy Consumption in Road Transportthrough Hybrid Vehicles: Investigation of Rebound Effects, and Possible Effects of Tax Rebates.”Journal of Cleaner Production 15:1076–84.
Hao, J., J. Hu, and L. Fu. 2006. “Controlling Vehicular Emissions in Beijing During the LastDecade.” Transportation Research, 40(8):639–51.
Hirota, K., J. Poot, and K. Minato. 2003. “Do Policy Incentives Affect the Environmental Impact ofPrivate Car Use? Evidence from a Sample of Large Cities.” Paper prepared for the 43rd Congressof the European Regional Science Association, August, 27– 30, Jyvaskyla, Finland.
188 The World Bank Research Observer, vol. 26, no. 1 (February 2011)
at Joint Bank/F
und Library on February 7, 2011
wbro.oxfordjournals.org
Dow
nloaded from
Holden, E., and I.T. Norland. 2005. “Three Challenges for the Compact City as a Sustainable Urban
Form: Household Consumption of Energy and Transport in Eight Residential Areas in the Greater
Oslo Region.” Urban Studies 42(12):2145–66.
Ichinohe, M., and E. Endo. 2006. “Analysis of the Vehicle Mix in the Passenger-car Sector in Japan
for CO2 Emissions Reduction by a MARKAL Model.” Applied Energy 83:1047–61.
IEA (International Energy Agency). 2006. “Energy Prices and Taxes.” In Quarterly Statistics 2006.
Paris: OECD.
Jakob, A., J.L. Craig, and G. Fisher. 2006. “Transport Cost Analysis: A Case Study of the Total Costs
of Private and Public Transport in Auckland.” Environmental Science & Policy 9:55–66.
Khan, A.M. 2001. “Reducing Traffic Density: The Experience of Hong Kong and Singapore.” Journal
of Urban Technology 8(1):69–87.
Kiuru, L. 2002. “Worldwide Fuel Quality Trends: Focus on Asia. Better Air Quality in Asian and
Pacific Rim Cities.” Paper presented at Hong Kong Convention and Exhibition Centre (HKCEC),
December 16–18.
Kleit, A.N. 2004. “Impacts of Long-Range Increases in the Fuel Economy (CAFE) Standard.”
Economic Inquiry 42(2):279–94.
Koenig, B., D.K. Henderson, and P.L. Mokhtarian. 1996. “The Travel and Emissions Impacts of
Telecommuting for the State of California Telecommuting Pilot Project.” Transportation Research
4(1):13–32.
Kunert, U., and H. Kuhfeld. 2007. “The Diverse Structures of Passenger Car Taxation in Europe and
the EU Commissions Proposal for Reform.” Transport Policy 14(4):306–16.
Kutas, G., C. Lindberg, and R. Steenblik. 2007. “Biofuels: At What Cost? Government Support for
Ethanol and Biodiesel in the European Union.” The Global Subsidies Initiative (GSI) of the
International Institute for Sustainable Development (IISD), Geneva, Switzerland.
Lee, M-K. 2003. “TransMilenio Bus Rapid Transit System of Bogota, Colombia.” UNEP Collaborating
Centre on Energy and Environment, Roskilde, Denmark.
Litman, T. 2005. “Land Use Impacts on Transport: How Land Use Factors Affect Travel Behavior.”
Victoria Transport Policy Institute, Victoria, BC, Canada.
Liu, H., K. He, D. He, L. Fu, Y. Zhou, M.P. Walsh, and K.O. Blumberg. 2008. “Analysis of the Impacts
of Fuel Sulfur on Vehicle Emissions in China.” Fuel 87(13–14):3147–54.
Lyons, T.J., J.R. Kenworthy, C. Moy, and F. dos Santos. 2003. “An International Urban Air Pollution
Model for the Transportation Sector.” Transportation Research 8:159 –67.
Mackett, R.L., and Marion Edwards. 1998. “The Impact of New Urban Public Transport Systems:
Will the Expectations Be Met? Transportation Research 32(4):231–45.
Mage, D.T., and M.P. Walsh. 1992. “Case Studies of Motor Vehicle Pollution in Cities around the
World.” In David T. Mage and Olivier Zali, eds., Motor Vehicle Air Pollution: Public Health Impact
and Control Measures. Geneva: World Health Organization.
Mamdoohi, A.R., M. Kermansha, and H. Poorzahed. 2006. “Telecommuting Suitability Modeling:
An Approach Based on the Concept of Abstract Job.” Transportation 33:329–46.
Metschies, G.P. 2005. International Fuel Prices, 4th edn. Eschborn, Germany: Deutsche Gesellschaft
fur Technische Zusammenarbeit (GTZ).
Miller, E.J., and A. Ibrahim. 1998. “Urban Form and Vehicle Usage.” Transportation Research Record,
Washington, DC.
Mindali, O., A. Raveh, and I. Salomon. 2004. “Urban Density and Energy Consumption: A New
Look at Old Statistics.” Transportation Research 38:143–62.
Timilsina and Dulal 189
at Joint Bank/F
und Library on February 7, 2011
wbro.oxfordjournals.org
Dow
nloaded from
Mohan, D. 2002. “Traffic Safety and Health in Indian Cities.” Journal of Transport and Infrastructure
9:79–92.
Mokhtarian, P., and K. Varma. 1998. “The Trade-off Between Trips and Distance Traveled in
Analyzing the Emissions Impacts of Center-Based Telecommuting.” Transportation Research 3(6):
419–28.
Molina, M.J., and L.T. Molina. 2004. “Critical Review: Megacities and Atmospheric Pollution.”
Journal of Air Waste Management Association 54(6):644–80.
NDRC (Natural Resources Defense Council). 2003. “Environmental Characteristics of Smart Growth
Neighborhoods: Case Studies in Sacramento and Nashville.” New York: Natural Resources
Defense Council. (http://www.nrdc.org/cities/smartGrowth/char/charinx.asp).
Nelson, P., K. Gillingham, and E. Safirova. 2003. “Revving up the Tax Engine: Gas Taxes and the
DC Metro Area’s Transportation Dilemma.” Urban Complexities Issue Brief 03-05, Resources for
the Future, Washington, DC.
Newman, P., and J. Kenworthy. 1989. Cities and Automobile Dependence: An International Sourcebook.
Aldershot, UK: Gower Technical.
Nivola, P.S., and R.W. Crandall. 1995. “The Extra Mile: Rethinking Energy Policy for Automotive
Transportation.” The Brookings Review 13(1):30–4.
Parry, I.W.H. 2002. “Comparing the Efficiency of Alternative Policies for Reducing Traffic
Congestion.” Journal of Public Economics 85(3):333–62.
Parry, I.W.H., and G.R. Timilsina. 2009. “Pricing Externalities from Passenger Travel in Mexico
City.” World Bank Policy Research Working Paper WPS 5071. Washington, DC: The World Bank.
Parry, I.W.H., M. Walls, and W. Harrington. 2007. “Automobile Externalities and Policies.” Journal of
Economic Literature 45:373–99.
Portney, P.R., I.W.H. Parry, H.K. Gruenspecht, and W. Harrington. 2003. “Policy Watch: The
Economics of Fuel Economy Standards.” The Journal of Economic Perspectives 17(4):203–17.
Potoglou, D., and P. Kanaroglou. 2007. “Household Demand and Willingness to Pay for Clean
Vehicles.” Transportation Research 12:264– 74.
Powers, W.F., and P.R. Nicastri. 2000. “Automotive Vehicle Control Challenges in the 21st Century.”
Control Engineering Practice 8(6):605–18.
Proost, S., and K. van Dender. 2002. “Methodology and Structure of the Urban Model.” In B. De
BorgerS. Proost, eds., Reforming Transport Pricing in the European Union: A Modelling Approach.
Cheltenham, UK: Edward Elgar:135–69.
Pucher, J., N. Korattyswaropam, N. Mittal, and N. Ittyerah. 2005. “Urban Transport Crisis in India”.
Transport Policy 12(3):185– 98.
Rich, J., and O.A. Nielsen. 2007. “A Socio-economic Assessment of Proposed Road User Charging
Schemes in Copenhagen.” Transport Policy 14(4):330– 45.
Richardson, H.W. 1974. “A Note on the Distributional Effects of Road Pricing”. Journal of Transport
Economics and Policy 8:82– 5.
Rogat, J. 2003. “The Electric Trolleybus System of Quito, Ecuador.” UNEP Collaborating Centre on
Energy and Environment (UCCEE), Risø National Laboratory, Roskilde, Denmark.
Rubin, J., and Y. Leiby. 2002. “Transition Modeling: A Comparison of Alternative Fuel and Hybrid
Vehicles.” Joint Statistical Meetings, August 11–15, New York City.
Saitone, T.L., R.J. Sexton, and S.E. Sexton. 2007. “The Effects of Market Power on the Size and
Distribution of Benefits from the Ethanol Subsidy.” Agricultural Issues Center, University of
California.
190 The World Bank Research Observer, vol. 26, no. 1 (February 2011)
at Joint Bank/F
und Library on February 7, 2011
wbro.oxfordjournals.org
Dow
nloaded from
Santos, G., W.W. Li, and W.T.H. Koh. 2004. “Transport Policies in Singapore.” Research inTransportation Economics 9:209–35.
Schimek, P. 1996. “Household Motor Vehicle Ownership and Use: How Much Does ResidentialDensity Matter?” Transportation Research Record 1552:120–5.
Schrank, D., and T. Lomax. 2005. “Urban Mobility Study.” Texas Transportation Institute. (http://mobility.tamu.edu/ums).
Sharpe, R. 1982. “Energy Efficiency and Equity of Various Urban Land Use Patterns.” Urban Ecology7:1–18.
Sterner, T. 2006. “Fuel Taxes: An Important Instrument for Climate Policy.” Energy Policy 35(6):3194–202.
Transport for London. 2004. “High Level Voluntary Environmental Assessment of TransportStrategy Revision: Central London Congestion Charging: Environmental Assessment.” Annex ofReport to the Mayor. (http://www.tfl.gov.uk/tfl/cc-ex/reports.shtml).
USAID (United States Agency for International Development). 2004. “Vehicle Inspection andMaintenance Programs: International Experience and Best Practices.” Washington, DC: USAID.
USEPA (United States Environmental Protection Agency). 1999. “The History of Reducing TailpipeEmissions.” Washington, DC: USEPA.
Vergara, W., and S. Haeussling. 2007. “Transport and Climate: Lessons from the Partnershipbetween Mexico City and the World Bank.” Sustainable Development Working Paper 29.Washington, DC: The World Bank.
VTPI (Victoria Transport Policy Institute). 2009. “Transportation Cost and Benefit and Analysis:Literature Review.” (www.vtpi.org).
Ward’s Automotive Group. 2008. Ward’s Automotive Yearbook 2008. Southfield, MI: Penton Media.
West, S.E., and , IIIR.C. Williams. 2005. “The Cost of Reducing Gasoline Consumption.” TheAmerican Economic Review 95(2):294–9.
Wiese, A.M., A. Rose, and G. Schluter. 1995. “Motor-fuel Taxes and Household Welfare: An AppliedGeneral Equilibrium Analysis.” Land Economics 71:229–43.
Willoughby, C. 2000. “Singapore’s Experience in Managing Motorization, and its Relevance to OtherCountries.” Discussion Paper TWU-43. Washington, DC: The World Bank.
Wilson, R., and D. Shoup. 1990. “Parking Subsidies and Travel Choices: Assessing the Evidence.”Transportation 17:141–57.
WHO (World Health Organization). 2008. “Air Quality and Health.” Fact Sheet 313. (http://www.who.int/mediacentre/factsheets/fs313/en/index.html).
World Bank. 2002. Environment Monitor 2002. Air Quality (Philippines and Thailand CountryReports). Washington, DC: The World Bank.
Zachariadis, T. 2006. “On the Baseline Evolution of Automobile Fuel Economy in Europe.” EnergyPolicy 34(14):1773– 85.
Zergas, C. 1998. “The Costs of Transportation in Santiago de Chile: Analysis and PolicyImplications.” Transport Policy 5(1):9–21.
Zhao, J. 2006. “Whither the Car? China’s Automobile Industry and Cleaner Vehicle Technologies.”Development and Change 37 (1):121–44.
Zupan, J.M., and A.F. Perrotta. 2003. “An Exploration of Motor Vehicle Congestion Pricing inNew York.” Regional Plan Association, New York.
Timilsina and Dulal 191
at Joint Bank/F
und Library on February 7, 2011
wbro.oxfordjournals.org
Dow
nloaded from