urban poverty report - samuelhall.orgsamuelhall.org/reports/drc pin urban poverty report.pdf ·...
TRANSCRIPT

A Study of Poverty, Food Insecurity and Resilience in Afghan Cities
Urban Poverty
RepoRt

this publication was commissioned by the Danish Refugee Council
(DRC) and people in Need (pIN) and was prepared and conducted
solely by Samuel Hall. the views and analysis contained in the
publication therefore do not necessarily represent DRC and pIN’s
views.
this report should be cited using the following referencing style:
Samuel Hall 2014, “A Study of poverty, Food Security and
Resilience in Afghan Cities.” For DRC and pIN.
For permission to photocopy or reprint any part of this work,
please send your request to DRC and pIN.
Graphic design: Maiken Lyster thonke, www.lysth.dk
Samuel Hall is a leader in conducting quality field research and providing expert analysis and strategic
consultancy to public and private sector organisations operating in present and post conflict regions.
Covering Asia, Africa and the Middle East since 2009, Samuel Hall brings evidence-based and participa-
tory research findings from the field to the tables of policy and decision makers. Our areas of expertise
include monitoring and evaluation; strategy and impact assessments; as well as economic, migration,
governance and rule of law, education and protection research. Our offices are located in Nairobi,
Jordan and Kabul. Contact us at [email protected]
Visit us at www.samuelhall.org
Urban Poverty
RepoRtA Study of Poverty, Food Insecurity and Resilience in Afghan Cities
2 Urban poverty Report Urban poverty Report 3

ACRONYMS
ACF ....................Action Contre la Faim
AREU ..................Afghanistan Research and evaluation Unit
ARTF ..................Afghanistan Reconstruction trust Fund
CS.......................Case Study
CSI......................Coping Strategy Index
CSO ....................Central Statistics organisation
DDS ....................Dietary Diversity Score
DRC ....................Danish Refugee Council
FAO ....................Food and Agriculture organisation
FCS ....................Food Consumption Score
FGD ....................Focus Group Discussion
HFIAS .................Household Food Insecurity Access Scale
IDLG ...................Independent Directorate for Local Governance
IDP ......................Internally Displaced person
IFPRI ..................International Food policy Research Institute
JICA ...................Japanese International Cooperation Agency
GDMA .................General Directorate for Municipal Affairs
GiZ ......................Deutsche Gesellschaft für Internationale Zusammenarbeit
KII .......................Key Informant Interview
KIS ......................Kabul Informal Settlement
KSP ....................Kabul Solidarity programme
KURP ..................Kabul Urban Reconstruction programme
LRRD ..................Linking Relief, Rehabilitation and Development
MICS ..................Multi-Indicator Cluster Survey
MOLSAMD .........Ministry of Labour, Social Affairs, Martyrs and Disabled
MoPH .................Ministry of public Health
MoRR .................Ministry of Refugees and Repatriation
MRRD .................Ministry of Rural Rehabilitation and Development
MUDA .................Ministry of Urban Development Affairs
NGO ....................Non-Government organisation
NNS ....................National Nutrition Survey
NSP ....................National Solidarity programme
NRVA ..................National Risk and Vulnerability Assessment
PIN......................people in Need
PSU ....................primary Sampling Unit
UNHCR ...............United Nation High Commissioner for Refugees
UNODC ...............United Nation office on Drugs and Crime
VAM ....................Vulnerability Analysis and Mapping
WASH .................Water, Sanitation, Hygiene
WB ......................World Bank
WFP ....................World Food programme
WHH ...................Welt Hunger Hilfe
ExECUTIVE SUmmarythis urban poverty study shows alarmingly high levels of poverty and food insecurity and low levels of resilience in the main Afghan cities.
the urban poor are the first impacted by the slowdown of the Afghan economy and the political turmoil linked to the presidential elections and are now in distress.
4 Urban poverty Report

overview of key indicators per city
Table 1
Note (>60% of total HH expenditure) (poor) (moderate + severe)
Food Expenditure (%)
Food Consumption Score (%)
Food InsecurityHFIAS (%)
AverageHDDS
Average ResilienceIndex
Kabul >40 >20 >65 5.51 150
Herat >30 >30 >85 4.97 157
Jalalabad >25 >10 >85 5.97 160
mazar-e-Sharif >55 >25 >80 4.82 159
Kandahar >35 >20 >95 5.44 162
Only 54% of mothers breastfed their infants within the first hour after birth
Household Food Insecurity access Scale by City
FIGURe 1
The numbers represents the amount of people in the survey.
Poor Food consumption
Poor Food consumption in different households based on the FCS.
The urban poor are becoming poorer: 78.2% of urban households were found to fall below the poverty line, a sign that the economic situ-ation of urban households has de-teriorated significantly over the past 3 years. Urban poverty is pervasive across the board and there is little stratification within urban populations or across cities, although Kabul fares slightly better than the other cities.
Urban areas are characterised by high levels of food insecurity and poor dietsLooking at the Food Consumption Score (FCS) shows that 20% of urban Afghans suffer from poor food con-sumption, while a further third show borderline food consumption, leaving less than half with acceptable levels of consumption. Mazar-e-Sharif and Herat show particularly poor levels of food consumption. Dietary diversity is low across the board with poor diets based on cereals and vegetables. Sources of protein are largely missing from urban diets. There are marked differences between the cities when
it comes to dietary diversity, with households in Kandahar reporting a more diversified diet especially com-pared to Mazar-e-Sharif, which has a significantly poorer profile in terms of dietary diversity.
Measuring food insecurity through the Household Food Insecurity Access Sale (HFIAS) shows that anxiety about food access and making negative adjustments to daily food consumption are a common feature of urban life, as more than half the households are severely food insecure on this scale. Kandahar and Jalalabad reported particularly high levels of food insecurity.
Finally, early child development is also at risk in the cities: the survey showed poor breastfeeding practices as only 54% of mothers breastfed their infants within the first hour after birth. Additionally, the majority of mothers extended exclusive breast-feeding beyond 6 months, failing to introduce complementary foods ap-propriately.
Looking at resilience scores shows only tenuous differences between cities and a generally low level of resilience. Kabul fares slightly better than other cities while Kandahar fares worse as the resilience of its house-holds is negatively impacted by poor access to basic services.
Who are the urban poor? Poverty and food insecurity characterise a majority of urban households in all five cities surveyed by this study. Yet, certain sub-groups stand out as particularly vulnerable:
IDPs – especially recently-displaced – are at a clear disadvantage. IDP households, especially if they were displaced recently, are at a particu-lar disadvantage compared to other migration groups. 36% of IDPs have poor food consumption based on the FCS, compared to 26-27% for eco-nomic migrants and only 16 to 18% of returnee households. 68 (±3%) of IDPs are categorized as “severely food insecure”, while returnees match
residents at 58-59%, with economic migrants faring best at 49 (±3%).
While returnees can benefit from social networks and assistance upon return, and economic migrants are often able to prepare for their mi-gration in advance, IDPs are swept away from their place of origin by conflict and natural-disaster. Adjust-ment to life in the city is particularly steep. Displacement to urban areas is fuelled by conflict, not assistance: 80.9% of IDPs moved to the city because of conflict, although Mazar-e-Sharif shows a higher proportion of natural-disaster induced IDPs (13.3%). 93% of urban households report having no intention to move again. Only 10% of IDP households would like to go back to their place of origin. This points to the necessity of facilitating local integration as a dura-ble solution for IDPs in the city.
IDPs living in the informal settlements that have been identified by humani-tarian actors as areas of particular
78,2% of urban house-holds were found to fall below the poverty line
6 Urban poverty Report Urban poverty Report 7

Only a marginal propor-tion of households own livestock (13%) or grow produce (7%).
Winterization is a failure. Donors are not interested. Even the IDPs are fed up. People themselves are asking for durable solutions KII – HLP Task Force
Households’ sanitation facilities
Sanitation Facilities
FIGURe 2
vulnerability show lower levels of resilience than other groups, but living in a KIS is not nearly as strong a determinant of vulnerability as other criteria such as having addicted members of households or being a female-headed household. The main difference comes from access to basic services, for which IDPs living in the KIS are disadvantaged.
Statistical evidence proves the im-pact of specific social vulnerabilities on food security and poverty. The absence of male income-earners, the presence of addicted member(s) of household and the reliance on a single source of income, usually a daily labourer, put urban house-holds at great risk and significantly lower their resilience. Low levels of education also put households at greater risks of food insecurity and lack of access to robust basic ser-vices further decreases households’ resilience. The study showed that disability was a counter-indication for food insecurity, a fact that can be explained by the social protection mechanisms that effectively reach households with a disabled member or a victim of mines. This illustrates the relevance and potential efficiency of social protection mechanisms in a context of general vulnerability and food insecurity.
What are the determinants of food security? Accessing food is the main chal-lenge that urban households face on a daily basis. Food security in the city is a question of income and access to stable employment, both particularly challenging for house-holds with addicts, female-headed households, and households with low levels of education. Low and unreliable income often necessitates reducing the quantity of food in the household on a regular basis. More importantly, it means sacrificing food
diversity, as many food items become unaffordable. It also causes high levels of anxiety as the income each day will determine both the nature and amount of food the household will consume.
Food availability is not a major de-terminant of food insecurity within the targeted Afghan cities, none of which suffers from food shortages. Little price volatility exists based on seasonality but food prices have increased over the past 5 years. In contrast to rural areas, seasonality only contributes to food insecurity through casual labour in the five Afghan cities studied: seasonality of casual labour makes winter a particu-larly difficult season for urban poor, except in Jalalabad where seasonality has less impact. Urban households cannot rely on self-production to complement their food intake as only a marginal proportion of households own livestock (13%) or grow produce (7%), further reducing their ability to absorb income shocks.
Poor sanitation facilities and low awareness about basic hygiene practices mean that food is often unsafe, raising the risk of diarrheal disease and poor nutritional status,
especially for under-five-year-old children. Poor breastfeeding practic-es further increase the problem with infants who lack nutrients and often face long-term consequences on their development.
How resilient are the urban poor? A decade of international assistance and state reconstruction has done little to build the resilience of urban households, who still fare very poorly on some of the key dimensions of resilience: literacy, education and qualified employment. The adap-tive capacities of urban households are further limited by their inability to save money and the necessity to rely on informal credit, as the only safety net accessible to them. The loss of households’ productive abilities upon their arrival in the city – evidenced by very little livestock or agricul-tural production in the cities – further reduces households’ ability to adapt to income shocks or to diversify their food intake. Family networks are not strong enough to support house-holds’ resilience as remittances in cash from abroad or in-kind from rural areas are residual. Better access to basic services in the cities is the only way that urban households can build resilience in the long-term.
Low levels of resilience put urban population at particular risk in a con-text of economic drawdown: 60% of households have reported a deterio-ration of their economic situations over the past 12 months, particularly in Herat and Mazar-e-Sharif. 74.5% noted high food prices as one of the key economic issues they have had to struggle with over the past 12 months. The World Food Programme (WFP) confirmed an increase in the prices of key food items and a dete-rioration of urban households’ pur-chasing power, a combination that put urban households in distress. In the absence of robust resilience
mechanisms at the household level, the main coping strategy available to households is to reduce the quality and the quantity of food consumed. Some safety nets exist at the com-munity level though and urban households can rely on a tight system of informal credit and loans. 76% of households are in debt, a majority of whom to relatives, friends and shopkeep-ers. Intra-community forms of charity also exist, although they are reportedly in decline. Yet, infor-mal credit and charity systems can be exclusionary, especially for newly-arrived households, putting IDPs in more difficult situations.
Urban poverty and food insecurity remains largely unaddressed by national and international actors, as funding and programming largely focus on rural issues. Additionally, there are several gaps in the current approaches:
• Beyond emergency assistance – a “no man’s land” for IDPs? No mechanisms exist for a follow-up on the assistance to recently-displaced populations after the three-month limit of emergency assistance. The present study provides more evidence that these groups are particularly at risk but a robust framework to implement durable solutions for IDPs in the cities is slow to emerge.
• Between humanitarian assistance and large-scale development/in-frastructure projects – a missing link: This study shows that urban livelihoods remain scarce and instable and that the overall level of resilience of poor urban households has not improved enough over the past decade, ex-cept for improved access to basic services in some parts of major Afghan cities. Initiatives to build
8 Urban poverty Report Urban poverty Report 9

resilience remain scarce in the city. The main interventions working on livelihoods are small-scale, short-term vocational training, of which impact remains limited given the poor level of skills that benefi-ciaries usually reach, the lack of links to the market and the overall saturated urban labour markets. Although a small number of actors try to address issues of food se-curity and households’ resilience in the city, the study showed that building resilience of urban house-holds needs long-term program-ming on key issues that can bring actual transformation: education (especially for women), structural improvement of the business and productive sectors, and social pro-tection mechanisms in particular.
• Beyond the informal settlements, addressing widespread urban poverty – This study proved that
urban poverty is widespread – and increasing – beyond the limits of the few areas identified by national and international actors. In par-ticular, households with specific profiles and pockets of poverty are to be found everywhere in the city and cannot be easily type-case by convenient indicators and descrip-tors. Yet most of the assistance is concentrated on a few small settlements: across the 5 cities, 12% of non-residents of the KIS reported having received assis-tance, compared to 30% for KIS residents.
Addressing the poverty and re-silience gap in urban populations should be a priority for national and international stakeholders in a context of growing urbanisation in the country. This requires long-term and sustained interventions from both national and international actors.
RECOMMENDATIONS FOR ALL STAKEHOLDERS
Build the resilience of urban households through a long-term commitment to:access to basic services: Bridge the gap be-
tween cities in terms of access to basic services,
as they play a key role in building resilience in the
long run. Community-based programming, based
on community contribution in cash and labour
force, is a sustainable way of improving and
maintaining basic services in the city and should
be further supported. Donors should maintain
their focus on infrastructure investments, looking
at the gaps in other cities than Kabul, and espe-
cially focusing on Kandahar, where the situation is
considerably worse, especially when it comes to
access to electricity.
access to education and literacy: this study
showed that education is a determinant of house-
hold resilience. It is also a safeguard against
inter-generational transmission of poverty. Yet,
access to education is still unevenly distributed
across the 5 major cities and by gender: living in
the city does not guarantee access to education.
Long-term commitment to education projects –
especially those aimed at increasing girls’ access
to high school and higher education – should still
be at the top of the agenda.
Workforce qualification: Vulnerability and food
insecurity in the cities are first and foremost a
problem of access to stable livelihoods. Structural
changes are required for the urban workforce to
diversify their skills and step away from casual
labour that keeps households in a circle of debt
and poverty. Designing long-term programmes
of qualification for urban skills – specialising in
services and business management in particular –
would help reduce the increasing gap between the
urban labour supply and demand.
Address urban households’ difficulties in accessing food by:
building on existing female livelihood
strategies: this study did observe forms of
livelihood accessible to women (albeit in a limited
scale). Usually home-based, they include tailor-
ing, sewing, pistachio shelling, cleaning chickpeas,
cleaning wool etc. these represent interesting
opportunities for women to be economically active.
Yet, the study shows that women’s weak position
in the labour market means that they work for ex-
tremely low salaries. organisations could work on
building the bargaining power of these women by
setting up cooperatives of production and playing
an intermediary role in salary negotiations.
Developing specific protection and livelihood
programmes for households with addicted
members: the study shows that these households
are at particular risk, as addicts often use any
income or asset available to purchase drugs. Drug
addiction being stigmatised, these households lose
the support of their communities, leaving children
and women in a situation of high vulnerability. Ad-
diction was also a significant predictor for food
insecurity. While drug addiction is increasing in
Afghan cities, the response of national and inter-
national actors should be built up to prevent situ-
ations of extreme vulnerability. organisations like
DRC with a specific focus on displaced populations
should also take addiction into account in their
programming as drug use and associated risks
are particularly high – and increasing – among
returnees. the issue of addiction among returnee
households from pakistan and Iran is a question
that DRC should approach through a regional
strategy, as drug use often starts in exile.
building long-term mechanisms of social
protection: Urban households suffer from a lack
of safety nets and the dissolution of community-
based protection mechanisms. Yet, this study
showed that mechanisms of social protection –
such as the pension distributed to the disabled
and victims of mines – could have a real impact on
food security. Investing in sustainable systems of
social protection should therefore be a priority to
fill the gap left by receding systems of community
and religious charity. In particular, the training
of social workers embedded in the communities
should be a priority to identify households at par-
ticular risk and improve the referral mechanisms
– within and outside communities.
Recognize an urban geography of poverty by adjusting targeting to the profiles of poverty in the cities: at the community level: the study has shown
that IDp households were particularly vulner-
able but that poverty and lack of resilience were
widespread beyond the limit of the informal settle-
ments identified by the KIS task Force, as people
other than IDps and IDps living outside the KIS are
also vulnerable. the geographic scope of interven-
tions should therefore increase beyond the KIS.
Communities with a concentration of IDp house-
holds, especially those who have been recently-
displaced, should be targeted as a priority, but
programming should also focus on other vulner-
able households whether from the host community
or with different migratory profiles.
at the household level: Use fine targeting methodo-
logies: the Resilience Index: the study shows that
there was little stratification amongst urban
poor. targeting is highly challenging and should be
based on a solid combination of indicators to avoid
arbitrary delineation between poor groups. one
option is to opt for blanket targeting of hot spots
of poverty and food insecurity in urban areas.
Another option – especially if resources are
limited – is to base targeting on a refined grid of
selection criteria. the study points at key vari-
ables to identify the most vulnerable households
in the city. A simplified resilience index (detailed
in the recommendation section below) based on
proxy means allows for a robust identification of
the poorest. this system can be explained to com-
munities to avoid resentment.
10 Urban poverty Report Urban poverty Report 11

target male members of households with
training on food literacy: the study showed
that male members of households are in charge
of purchasing food in a large majority of urban
households. the poor diets of urban households
also show a low level of awareness about the
benefits of diversified diets. Men should therefore
be targeted as a priority by awareness-raising
campaigns surrounding food. the study found that
food budget was often the key determinant of food
choices, meaning that training on food literacy
should include components on budget-manage-
ment and take into account the constraint of low
budgets.
Increase awareness raising about hygiene
practices surrounding food, especially for
women: the survey shows that levels of aware-
ness about appropriate hygiene practices are still
low amongst the urban poor, leading to increased
risks of diarrhoea, especially for children. Specific
training on hygiene requirements for food prepa-
ration should be provided. this could be incor-
porated into entrepreneurial or social activities
offered for women – a class on food safety in meal
preparation for example. Community kitchens are
a good model to follow for this type of interven-
tions in urban settings.
raise awareness about the impact of tea
consumption during meal on iron absorption:
tea consumption during meal inhibit the absorp-
tion of iron, an issue particularly problematic
when no enhancing factors (fish, meat etc.) are
consumed as is the case for most Afghan house-
holds. Advocate for tea to be consumed between
meals instead of during the meal to address the
problem of iron deficiency, particularly for preg-
nant women, women and children.
Significantly build up awareness raising on
adequate breastfeeding practices: Breast-
feeding practices were found to be highly inade-
quate to provide for infants’ nutrition needs in the
cities. A large effort of awareness-raising should
target mothers but also female health workers
working on deliveries in public clinics for them
to provide adequate information and care after
the birth. At the community level, women centres
combined with eDC centres could be established
within the communities as places where care
and development services for young children are
easily available, along with training focusing on
breastfeeding.
Tailor awareness raising campaigns and training to the gap identified within households to increase food security and improve nutrition
TABLE OF CONTENTS
EXECUTIVE SUMMARY ........................................................................................................................... 5
INTRODUCTION .....................................................................................................................................15 Background And objectives of the Study ................................................................................ 15
Research objectives .................................................................................................................... 17
Research Framework .................................................................................................................. 17
Structure of the Report ............................................................................................................. 21
METHODOLOGY .....................................................................................................................................22 Building A Resilience Score ........................................................................................................ 22
Geographic Scope ........................................................................................................................ 23
Quantitative Data ......................................................................................................................... 23
Qualitative Data ............................................................................................................................ 25
Constraints And Limitations ....................................................................................................... 27
2. VULNERABILITY AND FOOD INSECURITY: THE PLIGHT OF AFGHAN CITIES ...............................29 A. Urban profiling: Key Migratory patterns ............................................................................. 31
B. High Levels of Vulnerability And Food Insecurity In the Cities......................................... 35
C. Satisfying Levels of Access to Basic Services .................................................................. 47
3. DETERMINANTS OF FOOD INSECURITY AND LACK OF RESILIENCE ................................ 52 A. the Impact of Migration & Displacement on Food Insecurity And Vulnerability............ 56
B. Social Vulnerabilities: Key Drivers of Food Insecurity And Lack of Resilience ............. 61
C. education And Access to Services Limit Vulnerability ...................................................... 71
D. Food Availability: High At the Community Level, Low At the Household Level ............... 73
e. Food Utilisation: problematic Hygiene practices ................................................................ 74
4. RESISTING TO SHOCKS: URBAN MECHANISMS OF RESILIENCE ............................................81 A. Which Shocks Impact Urban Households? ........................................................................... 83
B. How Do the Urban poor Resist economic Shocks? ........................................................... 85
5. CONCLUSION - PROGRAMMING FOR THE URBAN POOR...........................................................92 Gaps In existing Urban programming ....................................................................................... 94
Recommendations ......................................................................................................................101
ANNEXES .............................................................................................................................................114
REFERENCES ......................................................................................................................................124
12 Urban poverty Report Urban poverty Report 13

1IntroDUCtIonBACKGROUND AND OBjECTIVES
OF THE STUDY
A new urbanity – defined as an urban lifestyle, with urban characteristics and traits – is blooming in Afghanistan, supported by an estimated 5.7% annual urban growth rate since 20011. Still in majority rural, the country is joining the global trend of urbani-sation with at least 30% of the population now living in cities, 50% of which in Kabul2. According to the
World Bank, the urban population should repre-sent 40% of the Afghan population by 20503. When insecurity plagues the rest of the country, Afghan urban areas are often perceived as rare safe havens. Much of the coun-try’s stability rests now in the capacity of urban centres to remain strong economic and social hubs.
Pic. 1.1 Photo credit: Lalage Snow
“Even if the diversity of food available is higher in urban areas, the rate of food insecurity is also higher. Because in the city, you have to pay for a lot of other things, not only food items. Households have to pay for their rent, for electricity… So in terms of the quantity of food that households are able to access in the city, urban households are actually worse-off.”
14 Urban poverty Report Urban poverty Report 15

Afghanistan’s rapid urbanization is the result of migration and displacement dy-namics: rural to urban migration, economic migration, significant conflict-induced inter-nal displacement fuelled by high levels of insecurity, especially in the remote districts, and sudden displacements of population due to natural disasters such as drought, landslides and floods. Displacement trends are on the rise as Afghanistan completes a full security and political transition, with visible signs of instability and heightened conflict directly impacting civilians. Afghan cit-ies are often perceived as better-off than rural areas as they benefit from:• Security from conflict, which is on the
rise in most rural districts; • Prosperity in a country where poverty,
un- and under-employment are prevalent; • Availability of basic services where ac-
cess to water, electricity and health is still an everyday challenge in the major-ity of provinces and many rural areas.
A few urban centres are the recipients of most displacement patterns: Kabul first and foremost, and the four other important regional capitals: Herat and Mazar-e-Sharif for their booming economy; Kandahar and Jalalabad as bastions of relative security in provinces where insecurity in rural areas is increasing. Afghanistan counts today over 6 million Afghan refugee returnees and approximately 1 million internally displaced persons – the majority of whom migrate to urban areas with little or no intention to return home4. At a time of decreasing voluntary returns to Afghanistan – 11,000 refugees returning as of July 2014 (UN-HCR) – economic migrants and internally displaced persons (IDPs) now compose most of the influx of populations towards the cities today. The urban population pro-file is changing as a result. Afghan cities are at the intersection of two major dynamics: multiform migration to urban areas and economic drawdown that point to urban poverty as one of the acute challenges for Afghanistan in the coming
years. The urban challenge in 2014 Afghanistan is three-fold:
1. National and municipal authorities lack the financial and technical capacities to manage displacement. The question of unregulated urbanisation is increas-ingly turning into a heated political issue in spite of recent legislative improve-ments. In particular, the IDP Policy sup-ported by the Ministry of Refugees and Repatriation (MoRR) and UNHCR, the Informal Settlement Upgrading policy, which should soon be finalised, and the National Food Security Policy open the way for a more solid legal framework for national authorities and international ac-tors to operate. Yet, urban poverty is still a ‘black box’ for many actors operat-ing in Afghanistan5. In 2014, necessary services and infrastructure, social and legal frameworks and non-governmental support are not in place to tackle this challenge.
2. Informal settlements are burgeoning with new groups settling in areas falling outside of out-dated municipal plans, making it difficult for municipalities to provide adequate levels of services to people living there. These informal set-tlements are now a common feature of Afghan cities and represent an esti-mated 80% of the Kabul population and 69% of its residential land6. While popu-lations have invested in these areas and develop them in some ways, these increasingly represent pockets of urban poverty. Strikingly, the latest 2011-2012 National Risk and Vulnerability Assess-ment (NRVA) noted an increase in food insecurity between 2007 and 2011 in urban areas, reporting an augmentation from 28.3% of the urban population to 34.4% in 2011-127.
3. Urban poverty is on the rise with wor-rying signs of economic collapse in Afghanistan: national economic growth
has slowed down significantly under the cumulative effect of the withdrawal of international military forces, reduction of international funding and reduction of private investments due to the current instable political context8. Construction, transportation and services sectors that had benefited from the international presence are now in decline, discom-bobulating the dynamism of the urban economy.
Where is the data to inform policy makers?In the absence of a census, data are lack-ing to inform policies and programmes in urban areas. In a city like Kabul, assistance and knowledge are concentrated on the main group that has been identified as needing humanitarian assistance: Internally Displaced People (IDPs) within the Kabul Informal Settlements (KIS)9. Outside these little is known about urban poverty. This is even truer for many international organisa-tions and donors, which have focused ef-forts on rural areas for the past decade and have only recently turned their attention to the challenges faced by Afghan cities.
Precise data on levels of poverty, vulnerability or food security in the cities are lacking, as is a precise identification of vulnerable sub-groups, across gender, age or migration history.
On the other hand, a precise knowledge of the nature of resilience in the Afghan urban population is also lacking: what mecha-nisms prevent households and communi-ties from starvation? What factors make some households more resilient to shocks and instability than others? What strate-gies, if any, do individuals, households and communities build up to survive and develop in difficult environments?
The present research was commissioned by the Danish Refugee Council (DRC) and People in Need (PIN) to fill this knowledge gap and uncover the nature, level and complexity of poverty, food security and re-silience amongst Afghan urban households and communities. DRC and PIN commis-sioned this study in the framework of a two-year project funded by the European Union under its ‘Linking Relief, Rehabilita-tion and Development’ (LRRD) programme.
4. See Samuel Hall-NRC-IDMC-JIPS (2012), Challenges of IDP Protection – Research Study on the protection of internally displaced persons in Afghanistan. 5. Quote from a
Key Informant Interview (KII) with an NGO-worker in Kabul. 6. World Bank (2005), ‘Why and how should Kabul upgrade its informal settlements’ in Kabul Urban Policy Notes,
Series n.2, p.1. 7. Central Statistics Organisation, (2014), National Risk and Vulnerability Assessment 2011-12, Afghanistan Living Conditions Survey. Kabul, CSO, p. 51.
Research objectivesThe objectives of the study are three-fold:
building Knowledge
the research provides
evidence-based analysis on
the levels of food security,
vulnerability and resilience of
the Afghan urban population. In
particular, it compares migra-
tion groups (host community,
Internally Displaced persons
(IDps), returnees and econom-
ic migrant), across the five
major Afghan cities – Kabul,
Herat, Jalalabad, Mazar-e-
Sharif and Kandahar – and
across gender.
Informing Programming
the study provides actionable
recommendations for pIN and
DRC to develop their urban
programming. In particular,
both organisations plan on
developing urban livelihood
projects, including urban agri-
culture projects, and will use
recommendations to inform
targeting and implementa-
tion for pilot programmes in
Mazar-e-Sharif, Herat and
Jalalabad.
advocacy
this research unlocks solu-
tions to the challenges of
urban poverty. It provides evi-
dence and recommendations
for national and international
actors on the strategic and
programmatic adjustments
needed to better apprehend
urban poverty and food in-
security.
8. World Bank (2013), Afghanistan Economic Update, p.3. Available at https://openknowledge.worldbank.org/bitstream/handle/10986/16656/820120WP0WB0Af0Box037985
5B00PUBLIC0.pdf 9. Kabul Informal Settlements (KIS) are 50 locations identified by the humanitarian community and the Ministry of Refugees and Repatriation (MoRR) for the
distribution of humanitarian assistance, especially in the winter. An official list is kept and updated by the KIS task force, gathering the main organisations working in these areas.
16 Urban poverty Report Urban poverty Report 17

1. Ecker, O & Breisinger, C (2012): The Food Security System, A new Conceptual Framework. IFPRI Discussion Paper.
Key reSearCH QUeStIonS 4 PILLarS oF FooD SeCUrIty11
avaILabILIty access use - utilisation stabilityWhat are the determi-
nants of food insecurity
and vulnerability in urban
areas?
How resilient are the
urban poor and based on
which mechanisms?
How can programming best
address urban food in-
security and vulnerability?
Sufficient quantities of food available on a consistent
basis
The ability for household to produce and or purchase the food needed by all household
members to meet their di-etary requirements and food
preferences as well as the as-sets and services necessary to achieve and maintain an optimal nutritional status.
Based on knowledge of basic nutrition and care, as well as adequate water and sanitation, each member of the household is able to get an intake of sufficient and safe food adequate to each
individual’s physiological requirements. Additionally, an individual’s health status can affect her/his ability to absorb or utilize nutrients
from food.
Food security can be a tem-porary state as it depends on the stability of supply and ac-cess to food. This can be im-pacted by prices and weather variability as well as political
and economic shocks.
Who are the urban poor? What is the impact of displacement, migration and return on poverty and food insecurity?
poverty Line
proportion of food in total household expenditure
Food Consumption Score
Household Food Insecurity Access Scale
Coping Strategy Index
Sources of income and type of employment
What is the level of access to basic services?Distance to nearest health facility and school
Water system
electricity
What are the determinants of food insecurity?By migratory profiles
Regression analysis of factors impacting vulnerability
What is the level of resilience of the urban poor?How does it vary across migratory groups and gender?What specific shocks impact food security in urban areas?What are the ‘positive’ and ‘negative’ coping strategies house-holds rely on in urban areas?
Where are the gaps in the coverage of urban food insecurity? Which type of interventions would help building up the resil-ience of urban poor?
Research FrameworkMain Concepts and Definitions
10. FAO, Food Insecurity Information for Action, Practical Guides, 2008. 11. Ecker, O & Breisinger, C (2012): The Food Security System, A new Conceptual Framework. IFPRI
12. Nord, M., Andrews, M. & Carlson, S., 2005. Household Food Security in the United States, 2004, USDA Economic Research Service. Available at: http://www.ers.usda.gov/
Publications/ERR11/ 13. IPCC, (2001) 14. Adger (2000), ‘Social and ecological resilience: are they related?’ in Progress in Human Geography, 24:347. 15. EU-FAO, ‘Measur-
ing Resilience : A Concept Note on the Resilience Tool’. in Food Security Information for Decision-Making – Concept Note
1. Themes and Indicators: Food Security, Vulnerability and Resilience
This research was designed with the key concepts of food security, vulner-ability and resilience. With the reduction of poverty, hunger and malnutrition by half by 2015 as the first of the Millennium Development Goals (MDGs), resilience is attracting more and more attention in the humanitarian and development com-munity. Yet its definition – and perhaps more importantly, its practical applica-tions – remain flimsy. In a country where robust mechanisms linking humanitarian
and development assistance are still being developed, words like resilience provide a conceptual transition beyond emergency relief, care and maintenance, to longer term solutions. Key concepts used for this research are defined as follows:
Food Security‘Food Security exists when all people, at all times, have physical, social and economic access to sufficient, safe and nutritious food for a healthy and active life’ (1996 World Food Summit). Food security is necessary to maintain optimal nutrition-al status, in terms of both caloric intake and sufficient quality (variety and micro-nutrient intake)10. Practitioners further
defined the components of food security during the 2009 World Food Summit, which pointed at four main pillars neces-sary to understand the factors underpin-ning food security at the household level.Food insecurity, particularly in the long-term, has an impact on nutritional status (micronutrient deficiencies, stunting, wasting, etc.), which can in turn affect both physical and mental health. Although food insecurity largely stems from poverty or income inequality, it is not a necessary result of poverty. Additionally, food insecu-rity has been identified among households classified as non-poor.12
Vulnerability and Resilience: Both concepts of vulnerability and resil-ience are useful as they offer a dynamic understanding of poverty. They propose a multi-faceted concept of poverty that goes beyond access to food and income and takes into account dimensions such as access to services or household’s adaptability to shocks:
• Vulnerability is ‘the degree to which a system is susceptible to and unable to cope with adverse effects of specific risks/hazards’13
• The concept of resilience is comple-mentary to that of vulnerability: it is ‘the ability of groups or communities to cope with external stresses and dis-turbances as a result of social, political and environmental change14.
The concept of resilience provides a good basis to analyse households’ and commu-nities’ strategies to prevent and cope with crises that may endanger their food secu-rity, as it draws a dynamic picture of food security, whereby components other than access to food are taken into account. There is little consensus amongst stake-holders on how to measure resilience. The present study used the FAO-EU resilience tool, which takes into account a large range of factors affecting resilience:
• Social Safety Nets• Access to Basic Services• Assets• Income and Food Access• Adaptive Capacity15
In order to collect comparable data, the research was based on existing standard indicators of food security, poverty and vulnerability, using cut-off points adapted
18 Urban poverty Report Urban poverty Report 19

Internally displaced persons
refugees
returnees
economic migrants
Host Commu-nity
“persons or groups of persons who have been forced or obliged to flee or to leave their homes or places of habitual residence, in par-ticular as a result of or in order to avoid the effects of armed con-flict, situations of generalised violence, violations of human rights or natural or human-made disasters, and who have not crossed an internationally recognised State border.” IDps are considered to be in displacement until they are able to find a durable solution. the UN recognises three main durable solutions: return to the place of origin, local integration or re-settlement
Any person who “owing to well-founded fear of being persecuted for reason of race, religion, nationality, membership of a particular social group or political opinion, is outside the country of his nationality and is unable or, owing to such fear, is unwilling to avail himself of the pro-tection of that country; or who, not having a nationality and being out-side the country of his former habitual residence as a result of such events, is unable or, owing to such fear, is unwilling to return to it. ”
those who have gone through the process of return, “the act or process of going back.” In this study, the term refers to returned refugees. Returnees are considered as such until they are fully ‘re-integrated’ in their society of origin. Reintegration can be defined as “a process that should result in the disappearance of differences in legal rights and duties between returnees and their compatriots and the equal access of returnees to services, and opportunities “
those who choose to move in order to improve their lives and living conditions, internationally or within a country. economic migrants are treated very differently under international law.
A community that has IDp, returnee or migrant households living amongst non-migrant households
UN Guiding Principles on
Internal Displacement
(as cited in “Challenges
of IDP Protection”
1967 Protocol relating to
the Status of Refugees
2013 UNHCR Statisti-
cal Online Population
Database
2004 UNHCR Handbook
for Repatriation and Re-
integration Activities, p.5
UNHCR Refugee Protec-
tion and Mixed Migration
Adapted from UNHCR:
IDPS in Host Families and
Host communities.
Concept Definition Source
• Chapter 1: Introduction and Method-ology – introduces the research con-text, the objectives of the study and the analytical framework it was based upon. It gives a detailed overview of the methodology used for the study.
• Chapter 2: Urban Profiling – focuses on assessing levels of food insecurity and vulnerability in the 5 targeted cit-ies and across groups under scrutiny.
• Chapter 3: Determinants of Urban Poverty – analyses the main deter-minants of vulnerability and food insecurity and looks at the four pillars detailed above.
• Chapter 4: Resilience of the Urban Poor – looks at coping mechanisms and analyse resilience amongst the urban poor.
• Chapter 5: Recommendations for Action – will analyse existing program-ming gaps and suggest recommenda-tions for PIN and DRC as well as for other stakeholders.
16. See Annex.2 for detailed breakdown of the resilience score per indicator. 17. Ibid, p.1.
to the Afghan context. A resilience score was also calculated taking into account the five main dimensions of resilience mentioned above and using context-spe-cific cut-off points for each indicators. The research team developed the resilience score based on the FAO-EU model and drawing upon a similar system developed by People in Need in Mazar-e-Sharif for ease of comparison16.Each component o f household resilience is assessed through a series of indica-tors to generate a composite index of household resilience. “This index gives an
overall quantitative “resilience score” that clearly shows where investments needs to be made to further build resilience”17
2. Target Groups: Comparing Migration GroupsThe research is based on the comparison of levels of resilience across four key mi-gratory groups: returnees, IDPs, economic migrants and host community, using standard definitions for each of them:
Structure of the ReportThe report will be structured as follows:
20 Urban poverty Report Urban poverty Report 21

targeted Cities - Quantitative Survey
Quantitative Component of the research Qualitative Component of the research
Survey of 5,411 households
Survey of 149 communities
45 Focus Group Discussions
28 Case Studies
42 Key Informant Interviews
Key InDICatorS oF FooD SeCUrIty anD Poverty
Food Security
vulnerability
early Child Development
• Food Consumption Score (FCS): a proxy indicator measuring
caloric intake and diet quality at the household level based on
the past 7 days food consumption recall for the household.
• Household Dietary Diversity Score (HDDS)• Household Food Insecurity Access Scale (HFIAS), which is
based on the perception of households of their level of food
security and the usual responses that household would give
to a situation of food insecurity18.
• Coping Strategy Index (CSI)
• Per capita consumption to compare household based on the
2011-2012 official poverty line of 1,710 AFN per person per
month
• Monthly Income• % of food in total household expenditure• Dependency Ratio• Household Asset • Debt and Savings• Access to basic services• Access to assistance• Literacy and Education
• Initiation of Breastfeeding• Exclusive breastfeeding
18. Coates, J, Swindale, A and Bilinsky, P (2007), Household Food Insecurity Access Scale (HFIAS) for measurement of household food access: Indicator guide v3. Washington,
DC: FHI 360/FANTA.
Methodology
Building a Resilience Score
This research was designed to provide representative data of both the urban population of the five main Afghan cities and the main migration groups living in these cities. Based on a series of quan-titative and qualitative tools, the method-ology offers opportunities to triangulate information through a household survey, a community survey and qualitative data.
Quantitative tools were designed using standard indicators in use in the country to create a robust index of urban resilience.
These key variables were combined to create a resilience score based on cut-off points adapted to the Afghan context. The detail of the resilience score is available in Annex.
Geographic Scope
Research and data collection were con-ducted over the months of May and June 2014 in five major Afghan cities: Kabul, Herat, Jalalabad, Mazar-e-Sharif, Kan-dahar. These cities were selected for the study because they represent the main urban hubs of the country and allow the research to have a wide geographic span, covering five of the main regions of the country. These cities are also of special interest for PIN and DRC’s programming
Quantitative DataHousehold Survey (5,410)
Questionnaire – The household sur-vey was based on a questionnaire of 94 closed questions. The questionnaire was developed so as to comprise the migra-tion profile of households, and the main standard indicators to measure poverty and food security of households, in-dicators of hygiene and breastfeeding practices as well as key socio-economic indicators. A rapid overview of the key food security and poverty indicators used for the study is provided in annex.
Sampling – The household survey includ-ed four main categories of respondents in each city: local residents, returnees, IDPs and economic migrants. The sample size aimed at capturing 270 respondents per category for a total of 1,080 respondents per city and 5,400 respondents in total. This sample size gives us representative data at the city level with a statistical rigor of 5% of margin of error and 95% confi-dence level.
Within each city, the sampling was based on a grid approach, to allow for a com-prehensive coverage of the cities. In order to include informal settlements in the study, cities were not defined based on their administrative boundaries but on their physical characteristics: cities where defined as spaces with a continuum of dense residential areas. Each city was di-vided into Primary Sampling Units (PSUs) based on a grid approach. A total of 30 to 34 PSUs were defined per city so as to ensure a geographic mapping that covers various socio-economic categories across each part of the cities, including informal settlements. The field teams cover 30 to 34 PSUs in 10 days in each city based on the following sampling strategy:
22 Urban poverty Report Urban poverty Report 23

break down of area observations
Table 1.2
20. Population by city: In 2012-2013. Based on official estimations of the Central Statistics Organisation (CSO) in its 2012-2013 Estimated Population of Afghanistan.
USe oF ranDom anD QUota-baSeD SamPLeS
the survey was conducted with 5410 respondents, 2511
of whom were selected at random from a selected set of
neighbourhoods in the five cities. the remaining 2899 were
filtered to provide an equal representation of the four mi-
gration profiles tracked by the study. examination of cross
sections other than migration profile were performed on
the initial random sample, eliminating sampling bias, while
comparisons of the various migration profiles were per-
formed on the entire sample, ensuring adequate represen-
tation of each migration history. error margins reported
are based on a 95% confidence interval.
1. Phase 1: Random Sampling (5 days): the first half of respondents in each city are to be randomly selected, with the two field team surveying 12 PSUs in 5 days.
2. Phase 2: Quota/Purposive Sampling (5 days): a quota system is then used mid-way to adjust and ensure that suf-ficient targets are reached within each of the sub-groups throughout the 12 remaining PSUs19.
The first phase provided a snapshot of the natural composition of the city and representative findings at the city level. The second phase simply added a quota system for migration categories. Respondents are to be interviewed in full privacy and away from other household members to ensure confidentiality.Within each PSU, the field teams first re-ported to the local community leader, usu-ally the wakil. After an initial introduction to the study and getting the authorization to proceed, the team used a fixed-point and fixed-interval random technique in-volving the following steps:Divide enumerators across the PSU
• Start from a landmark in the area: generally a mosque or a school
• Select every other 3rd home, shops or office location.
• Ask to speak to the head of household or their spouse. (Above the age of 18).
• No gender breakdown is to be im-posed but the teams were composed of an equal number of male and female enumerators to aim at an equal gender-breakdown amongst respondents.
The final sample is detailed in the fol-lowing table. Some respondents qualify as both returnees and IDPs, explaining that the total number of respondents is not equal to the sum of each category of respondents.
19. Except for Kabul, where the survey was conducted over 12 days and Kandahar, over 11 days.
Area Observations (149)
In order to get contextualised and loca-tion-specific data on each of the commu-nities visited, the research team collected information about the community compo-sition, access to basic services and key socio-economic features, including main sources of livelihoods, access to land and housing and food security status.
The area observations were based on a semi-structured questionnaire, combining quantitative and qualitative information. Team leaders were asked to fill in these questionnaires based on the interviews of key community members: head of CDC, wakil, mullah and elders in particular.
Area observation questionnaires were filled in each of the PSUs surveyed for this research, except when no relevant stake-
holder was available to be interviewed or conditions of survey were too difficult, es-pecially in Kandahar. The final breakdown is detailed in the table abowe.
Qualitative Data A series of qualitative tools were designed to get an in-depth understanding of vari-ous dynamics at the household and com-munity levels, including practices related to food, coping strategies and gender-specific features of poverty and resilience. The study relied on the following tools:
• Focus Group Discussions (45) – In each city, 8 to 10 focus group dis-cussions were organised to get the perception of communities on their living conditions, main challenges to food security and needs, for a total of 45 FGDs across the board. In order
# of PSUs Local Residents Returnees AverageHDDS
Economic Migrants
Total
Kabul 34 144 372 476 265 1,091
Herat 30 259 210 253 370 1,072
Jalalabad 30 253 411 279 213 1,066
mazar-e-Sharif 30 372 160 295 310 1,081
Kandahar 33 428 317 259 149 1,100
Total 157 1,456 1,470 1,562 1,307 5,410
Local Residents Returnees IDPs Economic Migrants Total
Kabul
Herat
Jalalabad
mazar-e-Sharif
Kandahar
Total
Final Sample
Table 1.1
M
71
107
92
151
237
526
F
73
152
161
211
191
798
M
208
117
211
94
147
778
F
163
93
200
66
170
692
M
256
113
166
143
92
770
F
220
140
113
152
167
792
M
132
103
75
174
64
526
F
133
174
76
136
85
604
M
539
525
528
533
526
2651
F
552
547
538
548
574
2759
24 Urban poverty Report Urban poverty Report 25

Qualitative Data Collection
Table 1.3
• to avoid bias and to respect cultural conventions, FGDs were conducted with groups of male and groups of fe-male respondents separately. Groups of 5 to 7 respondents were gathered for each FGD. In each city, to the extent possible, a same number of FGDs were conducted with men and with women. FGD were moderated by national consultants and based on structured guidelines covering various aspects of intra-households issues related to poverty and food secu-rity, including access to livelihoods, seasonality, purchasing habits and hygiene practices.
• Case Studies (25) – Case studies aimed at capturing the experience and specific challenges faced by vulner-able members of the communities, including female-headed households, widows, elderly heading households and families with disabled or addicted members. Case studies were con-
ducted through a one-to-one in-depth interview based on a series of open questions.
• Key Informant Interviews (42) – A series of KIIs was conducted at the national and city level in order to get perspective from practitioners and key stakeholders on the issue of food se-curity and urban poverty. KIIs targeted donors, Non-Governmental Organi-sations (NGOs) operating in urban environment, UN agencies working on related issues and governmental actors (at the ministerial and municipal level). Key informant interviews lasted approximately one hour and were conducted based on semi-structured guidelines and adjusted to each kind of respondents, based on their area of expertise to collect the most relevant data from each of them.
The following table summarises qualitative data collected for this research:
Constraints and Limitations
Impact of Afghan Presidential Elections – Most of the fieldwork for this study was conducted during the presidential elec-tions in Afghanistan. This had an effect on both:
• The sample, as teams were not able to reach their targets in Jalalabad and Herat because of the second round and as a tense security context forced teams to be cautious and avoid cer-tain areas in the city;
• The findings, as elections have had a brutal effect on the Afghan economy, stopping investments and reducing demand for daily labour significantly in the months before the elections. The elections have had a negative impact on the livelihoods, income and food security of the urban poor. The results of the present study are likely to have been impacted by this difficult economic environment and this study represents a snapshot of the difficult situation mid-2014.
Exclusion Bias of the wealthiest areas – The wealthiest areas of cities are diffi-cult to survey because it raises important security issues for the field teams, as they are composed of highly secured com-pounds, often protected by armed guards and checkpoints. They have not been in-cluded in the sample20. There is therefore an exclusion bias of the wealthiest areas of the cities and a focus on middle class and poor areas of each city. Yet, the grid approach did allow for a large geographic coverage of urban areas.
Complex identification of migration pat-terns – Most Afghan households are char-acterised by complex migration history, a complexity that can hardly be captured by a quantitative survey. In particular, causes and motivations to move are more
complex that the dichotomy between economic migrant and internally displaced households, leading to difficulties in the identification of these groups. Often, households have moved in response to a combination of intricate factors. For the purpose of this research, team lead-ers with years of experience of working on migration-related issues trained enu-merators specifically for them to be able to go round the problem of identification through follow-up questions to respond-ents but categories of IDPs and economic migrants must not be considered as watertight, as they overlap very often in practice.
Impact of seasonality on findings – The survey was conducted in May and June, i.e. is in the post-harvest period for all the five cities. This is considered as the best period in terms of food security. Yet, as shown in the research below, the impact of seasonality on urban markets and access to food for urban households is limited as households’ livelihoods are not tied to agriculture and food supply in the city is not largely reduced. The impact of seasonality on the findings is therefore limited.
Challenges with data collection in Kan-dahar – Kandahar appeared as an outlier on some food security indicators, possibly the result of a different understanding of the question by enumerators using Pash-to. A series of call backs was organised to check and triangulate the data. This triangulation showed a difference in the results found for the Food Consumption Score as the second round of data collec-tion found a FCS more in line with the pro-file of the city and of other urban centres. The findings from this triangulation were integrated in section 2.
Overview of Qualitative Data Collection
26 Urban poverty Report Urban poverty Report 27

Pic. 2.1: Jogi children playing in Zahirud-
din Faryabi, an informal settlement in
Mazar-e Sharif
Photo credit: Ann-Katrina Bregovic
‘We don’t have particular relations with the Pashtun of our community because we don’t speak the same language. But they live their lives, we live ours and we do not have any problems with one another.’
2VULNERABILITY AND FooD InSeCUrIty:
THE PLIGHT OF AFGHAN CITIES
> Fleeing conflict, uprooted populations make up the urban landscape and have no intention to leave
> the urban poor are becoming poorer
> Urban areas are characterised by high levels of food insecurity and poor diets
28 Urban poverty Report Urban poverty Report 29

migration status
FIGURe 2-1
Migration Profile per City (random sample)
A. Urban Profiling: Key Migratory Patterns
Migration Profiles
The displaced make up the urban land-scape: local residents, a minority?
The populations of Kabul, Mazar- e-Sharif, Kandahar, Herat and Jalalabad form a complex patchwork of uprooted people and few consider themselves as local residents. Only 24% (±2%) of respondents have always lived where they live now. Another quarter are economic migrants, about 20% have returned from exile in a foreign country, and almost 30% have been internally displaced. Almost half of the internally displaced have also lived abroad, a reminder of the complex migratory history that characterises each household.
Figure 2.1 highlights specific migration patterns that characterise each of the cities: above
• Mazar-e-Sharif confirms its status as the economic hub of the North, at-tracting important rural to urban eco-nomic migration, with 43% (± 4%) of the sample being economic migrants. The economic dynamism and the
relative safety of the city are important factors explaining this trend.
• Jalalabad and Herat confirm their status of high return areas, with high proportions of returnees - 44% of respondents in Jalalabad have lived abroad and 33% in Herat, propor-tions that are unsurprising given the border position of both provinces next to respectively Pakistan and in Iran. Many returnees could not go back to their place of origin upon return to Nangarhar province and chose to set-tle in Jalalabad, as shown by the high number of IDP/returnees in the city.
• Both Kandahar and Herat still have a strong basis of local residents who did not leave during the conflicts, whilst Kabul on the other hand presents a very mixed profile with each migration category represented.
The internally displaced (with or without an additional returnee background) make up close to half of Kabul respondents (48% ± 5%) and around one third of the inhabitants of Jalalabad and Mazar-e-Sharif (35% ± 4% respectively). The
Key findings - section 2
Fleeing conflict, uprooted popula-tions make up the urban landscape and have no intention to leave
• The displaced make up the urban landscape with only a minority of local residents in all 5 cities.
• Displacement is fuelled by conflict, not assistance: 80.9% of IDPs moved to the city because of conflict, although Mazar-e-Sharif shows a higher proportion of natural-disaster induced IDPs (13.3%).
• All evidence points to a relatively smooth integration into the social structures of the cities and few inter-community or inter- ethnic group tensions. Economic integration is a different story.
• 93% of urban households report hav-ing no intention to move again. Only 10% of IDP households would like to go back to their place of origin.
The urban poor are becoming poorer
• 78.2% of urban households were found to fall below the poverty line, a sign of that the economic situation of urban households has deteriorated significantly over the past 3 years.
• Urban poverty is pervasive across the board and there is little stratifica-tion within urban populations or across cities, although Kabul and Kandahar fare slightly better than the three other cities.
Urban areas are characterised by high levels of food insecurity and poor diets
• Findings from the FSC show that 20% of urban Afghans suffer from poor food consumption, while a further third show borderline food consumption, leaving less than half with acceptable levels of consumption, despite the fact that the survey was conducted post-harvest.
• Herat and Mazar-e-Sharif show the poorest levels of food consumption while both Kandahar and Jalalabad have the highest proportion of house-holds who appear to enjoy relative nutritional stability.
• Dietary diversity is low across the board with poor diets based on cere-als and vegetables. Sources of protein are largely missing from the diet.
• Looking at dietary diversity unveils differences between the cities, with households in Kandahar reporting a more diversified diet and Mazar-e-Sharif a significantly less satisfying profile in terms of dietary diversity.
• Measuring food insecurity through HFIAS shows that anxiety about food access and making negative adjust-ments to daily food consumption are a common feature of urban life, as more than half the households are severely food insecure on this scale. Kandahar and Jalalabad fare particularly poorly on this metric.
• The survey highlighted poor breast-feeding practices. Overall only 54% of mothers breastfed their infants within the first hour after birth. Additionally, the majority of mothers extended exclusive breastfeeding beyond 6 months, failing to introduce comple-mentary foods appropriately. This fact may contribute to the high level of stunting among Afghan children.
• Urban households benefit from sat-isfying access to basic services, with the exception of Kandahar, where this is still highly problematic.
Only tenuous differences exist between cities as poverty and food insecurity are widespread, with the exception of the population Kabul that fares slightly bet-ter.
30 Urban poverty Report Urban poverty Report 31

Urban Assistance Programmes are not a pull factor It is important to note that the exist-ence of assistance programme only seems to play a very marginal role in the decision-making of uprooted populations. Given the scarcity of assistance programme targeting urban population as a whole, it is unlikely that assistance is an im-portant factor. This is an important finding given the debate on urban assistance fuelling more displace-ment, especially when it comes to the Kabul Informal Settlements (KIS). This study goes against this common assumption that urban programmes of assistance will en-courage further displacement and migration, as other much stronger factors determine the choice of households to move to the five biggest Afghan cities.
Social integration in the city: The importance of social networks Afghan urban centres are attrac-tive hubs as they are perceived as offering what remote rural areas cannot – or cannot anymore – offer rural populations: job opportuni-
ties, safety and basic services. Even when urban labour markets are saturated and basic services over-stretched, it is the “myth of the city” that bring people to the cities: figure 2.3 (below) shows that the existence of work opportunities in the cities (50.5%), security in urban areas (39.7%) and the existence of exist-ing networks (24.3%) are the three main pull factors determining the choice of destination for displaced and returnee populations. The exist-ence of social networks is funda-mental in influencing the choice of their destination, confirming past research22. Indeed, as relatives are one of the primary sources of sup-port and potential assistance, their presence in the city is crucial for newly-arrived households. Qualita-tive data showed that most house-holds were satisfied about their move to the city and did not face particular challenges integrating. In particular, only very rarely inter-community tensions were reported. Patterns of residency varied signifi-cantly location by location and do not allow to conclude on a certain trend: certain areas see households from different ethnic groups and
22. Harpviken, Kristian Berg (2009) Social Networks and Migration in Wartime Afghanistan. Basingstoke: Palgrave Macmillan. 22. Harpviken, Kristian Berg (2009) Social Networks and Migration in Wartime Afghanistan. Basingstoke: Palgrave Macmillan.
lower proportion of IDPs in Herat (13%) is surprising given how heated the issue of internal displacement is for the capital of the Western region. This low result can be explained by several factors, including the fact that Herat counts important settle-ments of protracted IDPs outside the limit of the city, such as Maslakh, and that the IDP settlements inside the city (Minaret or Kareezak for example were surveyed later on during the data collection, hence not included in the random sample on which these results are based). Still, the lower proportion of IDPs in Herat shows that the proportion of IDPs spread out in the city is perhaps lower than stakeholders consid-ers it to be. In the mix of factors that lead households to live their place of origin to settle to the city of Herat, a lot of them rank economic necessity first.
Displaced households moving to Af-ghanistan’s urban centres stem almost exclusively from rural areas. While Mazar-e-Sharif and Kabul attract substantial numbers of arrivals from other provinces, apparently as hubs of work opportuni-ties, migration to the other cities stems in majority from rural areas in the same province. Rural backgrounds mean that displaced households settle in the city
unprepared to the specificities of life in the city, in particular in terms of economic opportunities, making integration in urban socio-economic structures more difficult.
Conflict fuelling internal displacementInternal displacement is first and fore-most a consequence of conflict and persecution. Yet, Mazar-e-Sharif counts a higher proportion of natural-disaster induced IDPs, a fact that can be explained by the recurring droughts that touch the Northern and Central regions, pushing people to abandon their place of origin to move to Mazar-e-Sharif (figur 2-1).
The bulk of city inhabitants arrived in the city they currently live in more than three years ago as reported by 76% (±2%) of randomly-selected respondents. Look-ing specifically at IDPs shows that a large part of this population has now entered protracted displacement with 28% of the IDPs who set up more than three years ago having moved to the city between 5 and 10 years ago and 37% between 11 and 20 years ago. The impact of the time in displacement on poverty is analysed further in section 3.
Why did you move to this city?
FIGURe 2-2
Pull Factors - Why did you move to this city?
‘We don’t have particular rela-tions with the Pashtun of our community be-cause we don’t speak the same language. But they live their lives, we live ours and we do not have any pro-blems with one another.’
FGD Women, Herat, Naw Abad
Internal Displacement and its reasons
FIGURe 2-1
Internal Displacement and its reasons (n= 741)
0% 10% 20% 30% 40% 50% 60% 70% 80% 90% 100%
150
98
157
132
63
32 Urban poverty Report Urban poverty Report 33

Difficult adaptation upon return
Compared to pakistan and where we lived during our
migration, this area is quite bad.
We don’t have access to clean water and the streets
are unpaved. the Municipality disposes off the garbage
on the hill close to the place where we live, which has
created lots of problems for us.
Qala Ahmad Khan
FGD Men, Kabul
Displacement brings better life
Life is better in this community
because we have somewhat
access to medical services and
job opportunities.
We like our life here.
Chahar Asyab
FGD Women, Jalalabad
2011 World Bank-Samuel Hall Research on IDPs in Urban Settings23. These multiple studies show that any at-tempt at articulating durable solutions for these populations will have to take this into account.This does not mean that intra-city move-ments are not common. On the contrary, qualitative fieldwork shows that most
newly-arrived households – especially IDP households – settle in several areas of the city and often change locations. Two main patterns can be identified here: a) communities moving as a group, often after being threatened by expulsion; b) households moving individually when they are no longer able to pay rent in their cur-rent locations.
23. See Samuel Hall-NRC-IDMC-JIPS (2012), Challenges of IDP Protection – Research Study on the protection of internally displaced persons in Afghanistan. p. 46. World
Bank-Samuel Hall (2011) Research Study on IDPs in Urban Settings – Afghanistan . 24. NRVA 2011-12, p. 45
area of origin mixed in the communities while other areas see clear gathering of households based on their areas of origin. Still, in both cases, most respondents reported certain indifference amongst groups and no particular tensions. Qualitative data showed a notable differ-ence of perception of the change dis-placement brought to their lives between returnees and IDPs. Returnees having benefited of relatively higher living stand-ards while abroad were more likely to complain about the level of services and quality of life that Afghan cities offered. IDPs on the other hand would point at access to services and security as major improvements brought to their life by an urban life. Women were particularly sensi-tive to the improvement an easier access to services made to their life upon dis-placement.
Plans for the future: No intention to leaveIn a very large majority of cases, urban residents, whether they were displaced, returned from abroad or are from the city have no intention to leave, as 93% of households said that they had no intention to leave. IDPs are the category with the highest proportion of respondents report-ing an intention to move again (10%) as shown in figure 2-3.These findings confirm with a striking ab-sence of ambiguity that populations who moved to the city, whether upon return, to flee insecurity or for economic reasons, have no intention to go back to their place of origin nor to settle somewhere else. This confirms the findings of several past studies, including Samuel Hall/NRC IDP Protection Study, which found 76.2% of IDPs preferring local integration, and the
B. High Levels of Vulnerability and Food Insecurity in the Cities
The urban poor are becoming poorer: Poverty indicators show high levels of poverty across the board and a deterioration of urban purchasing power
A large majority of urban households below the official poverty line For the 2011-12 NRVA, the CSO calculated
a poverty line of 1,710 AFA per person per month, allowing the organisation to calculate ‘the percentage of the popula-tion whose monthly per capita expen diture is below the poverty line’ or head-count index24. Using this cut-off point, the present research finds high levels of poverty across the board within Afghan cities.
Intention to move
FIGURe 2-3
Do you intend to move again? If yes, where? (n=5422)
Poverty Line by City (expenditure) Poverty by city (Income)
FIGURe 2-5
% of households below the official poverty line
Income per person per day
< AFA 1710 > AFA 1710
34 Urban poverty Report Urban poverty Report 35

25. The NRVA poverty headcount is calculated based on household monthly expenditure per person. 26. The recall period for income and expenditure in the survey referred
to the past 30 days. It should also be noted that numeric indicators such as income and expenditure are relatively soft, especially in households where those vary significantly
from one month to the other.
“The city is very homogenous in terms of poverty. There is no real stratification, no sub-groups to look for.
Poverty is simply widespread.”
KII, Kabul, NGO
to secure 20 days of work per month and a 7.4-member household27 – something most households do not achieve – the monthly income of the household (as a proxy for expenditure) still falls significant-ly below the poverty line. The household of a government employee in a ministry – 9,110 AFA/month for employees below directors in Kabul and 5,000 to 7,000 at the provincial level – would also fall below this poverty line28. The poverty line is not satisfying and other, more astute, indica-tors must be looked at to complete the analysis of poverty in Afghan cities, as detailed above.
The high proportion of poor households is directly linked to the size of urban house-holds that remain very high, especially in Kandahar and Jalalabad, which showed
an average size of households of 9.6 and 9.5 members respectively, while the three other cities fared below the national aver-age with 7.1 members.
Food expenditure in total household expenditure The proportion of food in the total house-hold expenditure is considered as one of the reliable indicators of poverty with households spending over 60% of their budget on food categorised as poor and households spending between 40 and 60% of their budget on food as borderline, based on the cut-off points established by the Food Security Afghanistan Cluster (FSAC)29. The survey found relatively high levels of poverty across the board with Mazar-e-Sharif standing out:
The present survey found urban house-holds under scrutiny to be overwhelm-ingly poor and poverty in the cities to be increasing, even based on Afghan national standards. The 2011-12 NRVA had found a proportion of ‘poor’ house-holds in the cities of 28.9%, significantly lower than the 78.2% found by the pre-sent survey25. The higher proportion of poor households in the current study can be linked to several phenomena and must raise the attention of stakeholders to the deterioration of urban poor purchasing power as Afghanistan’s economy slows down:
• The data for the NRVA was collected in 2011, at a moment where the Afghan economy was still benefiting plainly from international and military-related investment, especially in the city. This artificial economic boom is rapidly receding, leaving urban popu-lations struggling for livelihoods. While an exclusion bias of richest urban are-as may account for an over-represen-tation of poor households, the findings of this study are clear evidence of the impact of the economic slowdown on the main Afghan cities and of the risk of accelerated rates of poverty with the completion of the political and security transition.
• Qualitative data showed that the elec-tions had a negative impact on the economy of Afghan cities, as invest-ments were frozen with the fear of potential instability in the midst of the elections. Therefore, day-labour em-ployment opportunities in construction and other key sectors became scarce for poor urban households, which explains the low purchasing power recorded by this survey26. This is an-other clear indication of the potential impact of political instability on urban households, as the election process is still ongoing. Although a snapshot,
the present survey highlights worrying trends for urban populations.
• The NRVA is a national survey and its urban areas cover also medium and small cities, unlike this study. The results of this study therefore confirm the idea that the rapid urbanisation of the largest Afghan cities over the past 10 years had led to a significant increase in urban poverty in these cities. Informal settlements, increased competition for access to labour and basic services and higher living prices are more common in the largest cities of the country than in the middle-size provincial capitals.
At the city level, the survey found few differences between cities, although Kabul and Kandahar households fared slightly better with respectively 77.6% and 76.6% of house-holds surveyed falling under the poverty line established by the government and Jalalabad and Herat at the bottom with respectively 83.6% and 82.2% of households surveyed below the poverty line.
Qualitative fieldwork confirmed the findings and the prevalence of overwhelming poverty within Afghan cities. These results suggest a low level of socio-economic stratification within the cities with the main cut-off point being between the poor and the extremely poor households.
These findings also raise questions in regard to the official poverty line as an adequate tool to analyse poverty in post-2014 Afghanistan. Qualitative data shows that daily income for workers relying on daily labour in the cities is about 250 AFA. Even in a good case scenario, assuming a household with two income-earners able
27. Based on the national average. 28. This issue has been aknowledged by the government. The World Bank and GiROA have tried to address this
issue through the Capacity Building for Results (CBR) process that revise the salary grid of the government. 29 FSAC, (2013), Seasonal Food Secu-
rity Assessment – Afghanistan (July-September 2013), p.15
average Size of Households per City
FIGURe 2-6
Average number. of household members
The significant differences across cities are not surprising and reflect the ethnic divide between Pashtun and non-Pashtun provinces. Across the board, the fact that urban households still present high numbers of members on average can be linked to the fact that one household may host extended families, given the high cost of housing in the cities.
Food expenditure scale
FIGURe 2-7
Food Expenditure Scale (by city)
36 Urban poverty Report Urban poverty Report 37

Food consumption score (FSC)
FIGURe 2-8
Food Consumption Score (Random Sample)
(± 4%) of inhabitants enjoying acceptable food consumption. Conversely, only 30% to 50% of those surveyed in other cities could claim this status. Mazar-e-Sharif and Herat present the higher proportions of households with poor food consump-tion with respectively 31% and 25% of households reporting poor levels of food consumption in both these cities.
Given the fact that Kandahar represented an outlier on this indicator, a second round of data collection was organised to check and triangulate the data on food consumption in the Southern city. The second set of data was collected based on a random selection of households from the first survey. The data was collected three months later and in different condi-tions, hence is not directly comparable, but provides a robust basis to triangulate the FCS in Kandahar33.
The second round of data collection in Kandahar suggests a profile of the popu-lation’s food consumption more aligned with the four other cities, as shown in figure -2-10.
According to this smaller sample, 47% of households enjoyed acceptable food
consumption, 29% of them were border-line and 24% had poor food consump-tion. This still puts Kandahar at the top of the 5 cities in terms of the proportion of households reaching acceptable food consumption, alongside Jalalabad. On the other hand, it does point at a significant issue of food security in the city given the proportion of households having poor or borderline food consumption.
Given the high level of food insecurity found by this study in Kandahar, and given the profile of the four other cities in terms of food consumption, policy makers should not over-estimate Kandahar’s
33. 246 households were randomly selected from the first sample and were asked the same questions on food consumption than during the first survey.
On the food expenditure scale, Mazar-e-Sharif displays particularly alarming levels with over half of its urban poor (55% ± 4%) dedicating more than 60% of their total household spending to the purchase of food. On the whole, two out of five of the surveyed households fit this crite-rion. The Food Security and Agriculture Cluster (FSAC), which conducted a food security survey in 2013 with a large rural component, had found 28% of house-holds considered to have a poor access to food)30. As the FSAC Assessment was largely conducted in the post-harvest season, it is likely that rural households would spend less of their total expenditure on food. Still, except in Mazar-e-Sharif, a majority of urban households spend more than half their budget on non-food items, indicating a certain diversity of expendi-tures. Qualitative fieldwork suggests that rent, electricity, transportation and health expenses are also important in the budget of urban households.
Uncertain food security in urban areas Findings on food security largely cor-roborate indicators of poverty, drawing a rather bleak picture. Urban areas are characterised by high levels of food inse-curity across the board, despite notable variations across cities. The following section examines these variations in the
quality of urban diets and access to food of households amongst the urban popula-tion.
Food Consumption Score According to the Food Consumption Score (FCS), which weighs the different types of food consumed during the previ-ous week, 20% (±2%) of urban Afghans suffer from poor food consumption, while a further third are borderline, leaving less than half with acceptable levels of con-sumption, despite the fact that the survey was conducted post-harvest.
Categories were defined based on the classification established by the FSAC with a FCS below 28 considered to be poor, between 28.1 and 42 borderline and above 42 acceptable31 as shown in figure 2-8.
While worrying, these figures indicate a slightly higher level of food security in the biggest Afghan cities than in the rest of the country, if compared to the find-ings of the NRVA. The latter found 34.4% of urban households to be food insecure although NRVA’s calculation is based on calorie intake32. If broken down by city, the survey found significant differences: the food consumption score which measures caloric intake and the quality of diet at a household level yields surprisingly positive results for the city of Kandahar, with 80%
30. Ibid. 31. Ibid, p.36 32. NRVA 2011-12, p. 53.
Food consumption score by city
FIGURe 2-9
Food consumption score by city
FSC in Kandahar
FIGURe 2-10
FSC in Kandahar – Second data collection
38 Urban poverty Report Urban poverty Report 39

Household Dietary Diversity per city
Table 2-2:
Household Dietary Diversity per city (24-hour recall)
Dietary Diversity per city
Table 2-1:
Dietary Diversity per city. Numbers represent the average number of days per week that each food group is consumed.
Dietary Diversity Score by City
FIGURe 2-11
Dietary Diversity per City – 7-day recall. Red (1 to 4): Poor; Yellow (5 to 7): borderline; Dark green (8-9): acceptable.
34. Household dietary diversity calculated with a 7-day recall period
positive results based on the FCS collect-ed in the first survey. Kandahar’s inhabit-ants enjoy higher levels of dietary diversity (see below) but poor food consumption is still an issue for the city. Looking at dietary diversity provides another way to assess the quality of
urban diets based on the diversity of food components that households consume34 and to qualify the results of the food con-sumption score to see if variations across cities have to do with the diversity of food available in each city.
Dietary diversity was also measured through the household dietary diversity score (HDDS) recording all the food con-sumed by a household over the past 24 hours per food groups.
These various indicators of dietary di-versity show:
• The poverty of urban diets in general, as cereals (usually bread) remain the basis of urban poor’s diets. Eating meat, fruit, or dairy products remain relatively rare even for urban households. This was confirmed by the qualitative data, which showed that meat was usually consumed once a week in the best cases to once a month in general. Eggs were a more common source of protein. Most households re-ported eating bread and vegetables, accompanied by tea, for the three meals of the day. Tea consumption at mealtime inhibits iron absorption, limiting utilization of nutrients, a key aspect of food security. Fruits were also often considered to be too ex-
pensive for households’ budgets.
• Compared to the national figures found by the NRVA, the general die-tary diversity has decreased among urban households, a likely conse-quence of a decrease in purchasing power since 2011. For example, the NRVA found an average of 2.6 days of protein consumption per week nationally and 3.3 days per week in urban areas35. This survey found a maximum of 1.88 days of consump-tion of proteins per week identified among the population in Kandahar. While the consumption of sugar and oil is equivalent to that found in the NRVA, the consumption of tubers, dairy products and fruit is less important amongst the households surveyed for this study. The only positive finding is the fact that the consumption of vegetables is signifi-cantly higher among urban house-holds than recorded in the NRVA ranging from 3.1 days on average in Herat to 5.38 in Mazar-e-Sharif.
40 Urban poverty Report Urban poverty Report 41
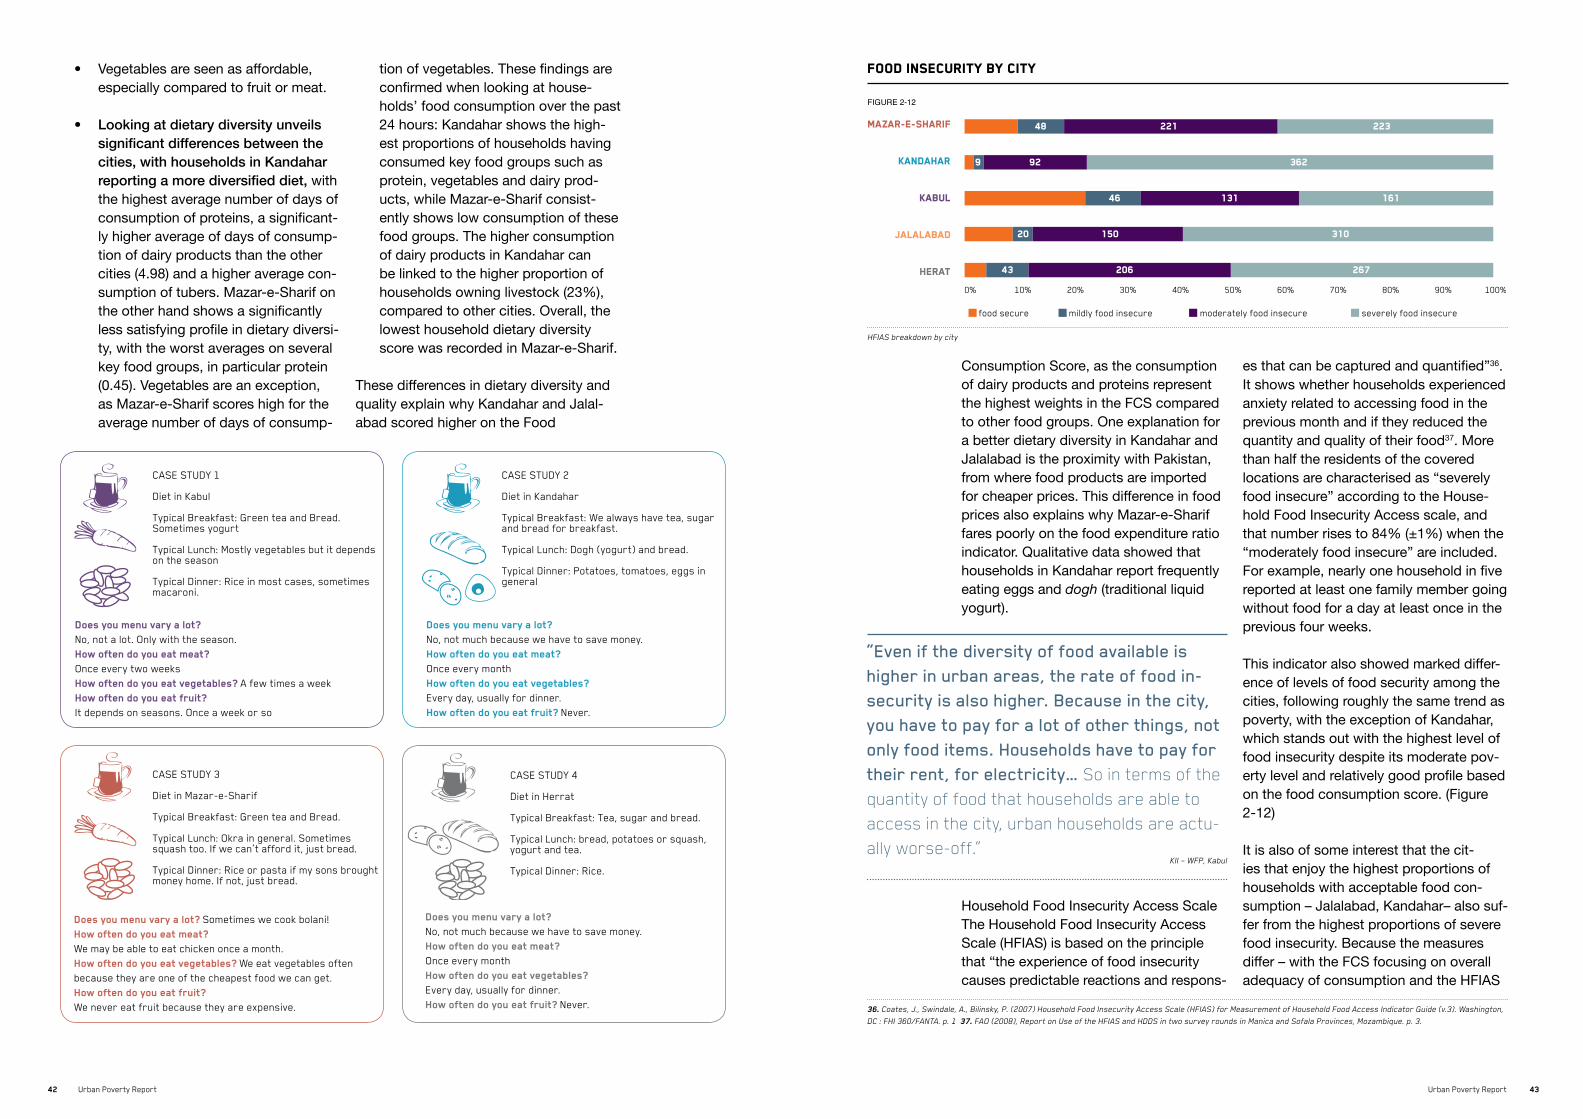
“Even if the diversity of food available is higher in urban areas, the rate of food in-security is also higher. Because in the city, you have to pay for a lot of other things, not only food items. Households have to pay for their rent, for electricity… So in terms of the quantity of food that households are able to access in the city, urban households are actu-ally worse-off.”
KII – WFP, Kabul
Food insecurity by city
FIGURe 2-12
HFIAS breakdown by city
Does you menu vary a lot? No, not a lot. only with the season. How often do you eat meat? once every two weeksHow often do you eat vegetables? A few times a weekHow often do you eat fruit?It depends on seasons. once a week or so
Does you menu vary a lot? Sometimes we cook bolani! How often do you eat meat? We may be able to eat chicken once a month. How often do you eat vegetables? We eat vegetables often because they are one of the cheapest food we can get. How often do you eat fruit? We never eat fruit because they are expensive.
Does you menu vary a lot? No, not much because we have to save money. How often do you eat meat? once every monthHow often do you eat vegetables? every day, usually for dinner. How often do you eat fruit? Never.
Does you menu vary a lot? No, not much because we have to save money. How often do you eat meat? once every monthHow often do you eat vegetables? every day, usually for dinner. How often do you eat fruit? Never.
• Vegetables are seen as affordable, especially compared to fruit or meat.
• Looking at dietary diversity unveils significant differences between the cities, with households in Kandahar reporting a more diversified diet, with the highest average number of days of consumption of proteins, a significant-ly higher average of days of consump-tion of dairy products than the other cities (4.98) and a higher average con-sumption of tubers. Mazar-e-Sharif on the other hand shows a significantly less satisfying profile in dietary diversi-ty, with the worst averages on several key food groups, in particular protein (0.45). Vegetables are an exception, as Mazar-e-Sharif scores high for the average number of days of consump-
tion of vegetables. These findings are confirmed when looking at house-holds’ food consumption over the past 24 hours: Kandahar shows the high-est proportions of households having consumed key food groups such as protein, vegetables and dairy prod-ucts, while Mazar-e-Sharif consist-ently shows low consumption of these food groups. The higher consumption of dairy products in Kandahar can be linked to the higher proportion of households owning livestock (23%), compared to other cities. Overall, the lowest household dietary diversity score was recorded in Mazar-e-Sharif.
These differences in dietary diversity and quality explain why Kandahar and Jalal-abad scored higher on the Food
Consumption Score, as the consumption of dairy products and proteins represent the highest weights in the FCS compared to other food groups. One explanation for a better dietary diversity in Kandahar and Jalalabad is the proximity with Pakistan, from where food products are imported for cheaper prices. This difference in food prices also explains why Mazar-e-Sharif fares poorly on the food expenditure ratio indicator. Qualitative data showed that households in Kandahar report frequently eating eggs and dogh (traditional liquid yogurt).
Household Food Insecurity Access Scale The Household Food Insecurity Access Scale (HFIAS) is based on the principle that “the experience of food insecurity causes predictable reactions and respons-
es that can be captured and quantified”36. It shows whether households experienced anxiety related to accessing food in the previous month and if they reduced the quantity and quality of their food37. More than half the residents of the covered locations are characterised as “severely food insecure” according to the House-hold Food Insecurity Access scale, and that number rises to 84% (±1%) when the “moderately food insecure” are included. For example, nearly one household in five reported at least one family member going without food for a day at least once in the previous four weeks.
This indicator also showed marked differ-ence of levels of food security among the cities, following roughly the same trend as poverty, with the exception of Kandahar, which stands out with the highest level of food insecurity despite its moderate pov-erty level and relatively good profile based on the food consumption score. (Figure 2-12)
It is also of some interest that the cit-ies that enjoy the highest proportions of households with acceptable food con-sumption – Jalalabad, Kandahar– also suf-fer from the highest proportions of severe food insecurity. Because the measures differ – with the FCS focusing on overall adequacy of consumption and the HFIAS
36. Coates, J., Swindale, A., Bilinsky, P. (2007) Household Food Insecurity Access Scale (HFIAS) for Measurement of Household Food Access Indicator Guide (v.3). Washington,
DC : FHI 360/FANTA. p. 1 37. FAO (2008), Report on Use of the HFIAS and HDDS in two survey rounds in Manica and Sofala Provinces, Mozambique. p. 3.
42 Urban poverty Report Urban poverty Report 43

the survey measured the breast-feeding practices of women who had had a child in the past five years, in order to get a picture of early Child Development (eCD) in the cities. In particular, the survey measured how long after birth were infants breastfed, based on mothers’ reports. As noted by UNICeF: “early initiation of breastfeeding is important for both mother and child. the first liquid secreted by the breast, known as colostrum, is produced during the first few days after delivery. Colostrum is highly nutritious and contains antibodies that provide natural immunity to the infant. It is recommended that chil-dren be fed colostrum immediately after birth (within one hour).”39
The survey found overall that 54% of mothers would breastfeed their children within the hour after their birth. this result is in line with the Multiple Indicator Cluster Survey (MICS) but is below UNICeF’s findings in the nutrition survey conducted with the Ministry of public Health (MopH). the latter found that 69.4% of mothers had breastfed their new-born within the first hour. In accordance with the national nutrition survey though, the present survey found that 93% of infants started breastfeeding within one day after birth (vs. 89.9% in the UNICeF/MopH survey). Yet, the present study found stark differences across cities in terms of breastfeeding practices, with mothers in Kabul, Herat and Mazar-e-Sharif, more likely to breastfeed their infant rapidly: 69.3% of mothers in Kabul re-ported having breastfed their infant within an hour, compared to 67% in Herat and 59% in Mazar-e-Sharif. Jalalabad and Kandahar on the other hand presented more worrying profiles with respectively 44.3% and 36% of mothers reporting having breastfed their child within one hour. Various hypotheses may explain these
differences across cities. In particular, it can be ex-plained by two main factors: different levels of aware-ness regarding adequate breastfeeding practices across the cities on the one hand; different levels of access to adequate assistance during delivery and post-delivery, as women in pashtun areas may be less likely to deliver in healthcare facilities, hence lack-ing the proper counselling and post-natal care that women could receive in other cities. Looking at exclusive breastfeeding post-6 months, the survey found surprisingly high reports of exclusive breastfeeding with an average of 14 months through-out the overall sample. While a long recall period (5 years) may lead to imprecise answers, this finding is still telling as it points to the fact that women rely on breastfeeding for periods that are too long for chil-dren to get the nutrients and vitamins that they need for their early development. Breastfeeding is the cheapest option for women, which may explain these very long periods of breastfeeding to the detriment of infants’ nutrition. the latest National Nutrition Survey found that 40.9% of children were stunted, 20.9% of whom severely40. Inadequate breastfeeding practises, such as relying for too long on breastfeeding as the main component of children’s diet, may be one of the issues to consider to address the issue of stunting in the country.
39. MoPH, UNICEF (2013), Afghanistan Nutrition Survey, p. 38. 40. MoPH-UNICEF
(2013), National Nutrition Survey (2013), p.29.
Early Child Development: Breastfeeding Practices
focusing on perception of access to food – these results may indicate a discrepan-cy between the actual quality and quan-tity of food consumed by a household and the levels of anxiety and uncertainty that households reach, when it comes to accessing food, illustrating two different facets of the problem of food insecurity. The FCS is a crude measure of adequacy of consumption, and has been found to underestimate food insecurity at the household level in some cases – though it correlates well with dietary diversity, as measured by the HDDS. The HFIAS, on the other hand, “relies on subjective report of food insecurity experiences,” with some research suggesting that households at different income levels may interpret the questions in the scale differently38. In the case of Kandahar, a particular sense of fear about access to food, perhaps related to high levels of conflict or previous dis-ruptions in food supply, could be driving the particularly severe levels of food inse-curity identified. Furthermore, the fact that households in Jalalabad and Kandahar are significantly larger increases the difficulty for households to secure access to food for all members and the general feeling of insecurity when it comes to food.
Finally, as developed below, Jalalabad and Kandahar were the two cities with the
highest levels of addiction, a key predic-tor of severe food insecurity. Additionally, Kandahar has the lowest levels of educa-tion compared to other cities; education is protective against food insecurity. Both factors could partly account for the high levels of severe food insecurity food found in these cities, alongside an adequate food consumption score.
Coping Strategy Index The coping strategy index confirms that the difficulty of accessing food means that urban households have to rely frequently on negative coping strategies. The FSAC considers that a score above 15 is severe to extremely severe (above 30). A major-ity of urban households scored below 7, meaning that they can be considered as having a minimal reliance on detrimental coping strategies, which was particularly the case in Mazar-e-Sharif and Kabul. Kandahar and Jalalabad are character-ised by larger proportions of moderate to severe coping strategies.
The relatively good position of Mazar-e-Sharif with only 8% of households show-ing a very severe profile in terms of coping strategies confirms the findings of the HFIAS and further demonstrates the fact that the main issue faced by Mazar-e-Sharif’s inhabitants has to do with being
reduced Coping Strategy index per city
FIGURe 2-13
38. Jones AD, Ngure FM, Pelto G, Young SL. What are we assessing when we measure food security? A compendium and review of current metrics.
Advances in Nutrition. 2013. 4:481-505.
able to afford a diversity of food items. Herat on the other hand fares consist-ently poorly on a variety of food security indicators, from the FSC to the HFIAS and the CSI, as 14% of households surveyed there presented very or extremely severe
profiles in terms of coping strategies. This suggests that the high level of poverty in Herat is not compensated for by cheaper food items that could help the urban poor in accessing food.
Reduced Coping Strategy Index (the higher the score the more households resort to negative coping strategies)
44 Urban poverty Report Urban poverty Report 45

C. Satisfying Levels of Access to Basic Services
Comparing levels of poverty between KIS and NON-KIS locations
One key aspect at the community level is access to basic services, especially as most urban poor live among informal set-tlements. Yet this section shows that liv-ing in a city makes a difference in terms of access to basic services, with the exception of Kandahar, where access to basic services is still highly problematic.
Satisfying access to basic services, except in Kandahar “Migration, lack of planning, inability of municipalities to adjust and the rise of informal settlements are fuelling urban poverty”. Informal settlements are con-sidered to be the main recipients of the urban poor, who suffer in particular from
a lack of access to basic services as well as from a lack of security of tenure. Based on the area observations, the following tables provide an overview of the level of access to basic services at the community level per city. All findings are presented by percent of total number of communities surveyed per city.
Overall, the review of access to basic services highlight Kandahar’s weaker access for most of the services but also shows that most urban communities now have access to basic services – even if their reliability and the quality of services provided is not always guaranteed.
In Kabul city, organisations gathered under the umbrella of the Kabul Informal Settle-ments (KIS) task Force have identified a list of prior-ity areas of interventions. In most cases, these are recent informal settlements where internally displaced have established themselves upon moving to the city. the migratory profile of house-holds living in the KIS is not uniform though, as further groups – including economic migrants – have some-times established within the KIS. Usually residing on land that they do not own, these households also live in precarious conditions, and are sometimes in need of emergency assistance, especially during the winter. Members of the KIS task Force conducted several assessments of the needs in the 50+ KIS and provide for
various forms of assistance, in particular food and non-food emergency kits during the winter to help families survive harsh weather con-ditions. Following the same model, additional informal settlements have been iden-tified in other of the main Afghan cities, especially in Herat, where Herat Informal Settlements have also been listed41.the present study looked at whether living in these informal settlements was a factor of vulnerability and on which dimensions of poverty that would play in particular. the survey showed that if there is a difference be-tween the levels of poverty within and outside the KIS, it is perhaps more nuanced than one would expect:the resilience index shows an 8-25 point difference between the scores of KIS
residents and those non-residing in the KIS, with KIS residents exhibiting a higher degree of vulnerability. Yet, given the 40-point overall standard deviation in the KIS, the difference is not dramatic.In terms of resilience, a lin-ear regression model shows that living in a KIS affects resilience but not nearly as much as other criteria of vulnerability reviewed below. Residing in a KIS is a mod-erately negative factor of resilience, especially when it comes to the dimension ‘ac-cess to basic services’.
41. Note that large parts of urban informal
settlements are not included in these
areas, designated and identified by the
humanitarian community.
Resilience index The resilience index (RI) provides a more comprehensive understanding of vulnerability, as it takes into account the capacities and ways households can cope with shocks and situations of stress. It takes into account access to basic services as one of the key dimensions of resilience: easy access to services reduces households’ diver-sion of resources to access those and increases the capacity of households to react rapidly to shocks. The resilience index is compiled over several dimen-sions relevant to the vulnerability of a household to structural changes (strife, drought) or the vagaries of everyday life (job loss, theft). Dimensions include access to food, access to basic services, social safety nets, assets, and adaptive capacity (multiple sources of income, debt levels, levels of education etc.) Although the theoretical range of the RI runs from zero to 400, respondents scored be-tween 40 and 295, with a median and mean of 165: The higher the score, the least resilient a household is. Looking at the resilience index only shows minor variations between cities, with Kabul slightly better off than the four other cities (table 2-2).
Breaking down the resilience index by dimensions and by city shows that
Kabulfares slightly better on three of the five dimensions of resilience: adaptive capacity; food access and basic servic-es. Inhabitants of Kandahar on the other hand are worse off in terms of access to basic services while Herat shows more vulnerability in terms of food access in figure 2-14.Overall, the review of poverty and food security indicators show that poverty is prevalent across Afghan areas, while food insecurity is high due to poor diets and high levels of anxiety relative to accessing food, painting a rather bleak picture.
There is a gap between the income accessible to most of the urban popu-lation and the level of resources they need to guarantee adequate levels of food security. Comparisons between cities show only tenuous trends as pov-erty and food insecurity are widespread across the board, with the exception of Kabul that fares slightly better.
mean resilience score by city
Table 2-2
Food consumption score by city
Mean Resilience ScoreHERAT 157
jALALABAD 160 KABUL 150
KANDAHAR 162 MAzAR-E-SHARIF 159
overall Sample 158
resilience dimensions by city
FIGURe 2-14
Resilience Dimensions per city
Urban poverty Report 47

In 94% of communities visited, there was no public sewage system. In general, people rely on sceptic tanks within their own compounds and organise at the community
Area Observations - % of communities reporting access to piped water per city
access to piped water
FIGURe 2-15
accessing Health Facilities: easier in Kabul and Herat
Table 2-4
Access to Health Facility per city
Accessing Health Facilities: Easier in Kabul and HeratArea observations show clear patterns by city in terms of access to basic services, with Kabul and Herat benefiting from easier access to health facilities, while the average distance to a health facility is significantly higher in Mazar-e-Sharif and Kandahar, and to a lesser extent Jalalabad, as highlighted in table 2.3. This reflects the various levels of investments in the public infrastructure of each city.
Public Electricity: widespread but not equally reliable A vast majority of communities (83.9%) reported being connected to the public grid, across the board, with only Ka-bul reporting a slightly lower proportion (74.3%), a fact that can be linked to the higher proportion of IDP settlements – usually excluded from public basic ser-vices – than in the other cities. Within the communities, and also to a large extent 90 to 100% of households were reported to be benefiting from electricity, a fact that confirms the findings of the households survey where 79% of households reported having access to public grid and an ad-ditional 4% to solar electricity. Overall, the level of access to public electricity is high across the 5 cities targeted and confirm the impact of living in a city on access to public services, as only 63.8%
of rural households reported having had access to any source of electricity in the past month for the NRVA42.
Yet, the main differences appear when it comes to the reliability of access to elec-tricity, as Kandahar appears to be signifi-cantly disadvantaged compared to the 4 other cities. This could even get worse as electricity provision is expected to deteriorate with the withdrawal of inter-national troops. In 28% of communities surveyed, electricity was considered to be not reliable (several power cuts a day) or not reliable at all (days without elec-tricity). On the other hand 29% of com-munities had access to very reliable and 43% to reliable electricity (a few power cuts per week). Here there are significant differences between cities with Kandahar by far in the worst situation as 48% of communities said that access to electric-ity was not reliable and 32% said that it was not reliable at all. On the other end of the spectrum, Mazar-e-Sharif and Herat fare much better. Kandahar’s poor access to reliable electricity is also confirmed by the household survey as households in Kandahar were much more likely to report long cuts of electricity (37% vs. 11% in the overall sample) and much less likely to report reliable access to electricity all day (6% vs. 45% in the overall sample).
Piped Water: Inexistent in Kandahar Stark difference also appears between cities when looking at access to piped water
For piped water as well, Herat benefits from a better provision of public services, while Kandahar is significantly disadvantaged with only 5% of communities reporting access to piped water. To compensate for the absence of piped water, a majority of communities rely on wells dug inside households’ com-pounds, in Kandahar and in other cities alike. Private wells are a reliable source of safe water, as long as deep waters are not con-taminated by pollution. As soon as water is provided through a pipe system, communi-ties have to pay through a system of meters measuring their consumption.
Prices reported varied from 25 AFA per cubic meter to 40-50 AFA depending on areas. When households rely on wells for water, they do not have to pay for their consump-tion. In the absence of proper sewage system, the risk of contamination of underground water is increasing in Afghan cities. The topol-ogy of Kabul and the high rates of informal settlements make it a challenge for basic service provision to the increasing number of households living on the slopes of the hills of the city, especially when it comes to sewage system and piped water schemes.
42. NRVA (2013), p. iv
48 Urban poverty Report Urban poverty Report 49

Schooling by city
FIGURe 2-16
Schooling by City and Gender
access to education: Strong disparities across cities
By contrast, “only two in five rural house-holds live within two kilometres of a primary school“43. Differences between cities were less acute than for other basic services although children in Kandahar do have to walk longer distance to reach their schools than in the four other cities. Accessibility of schools translates into relatively low proportions of out-of-school children in the 5 cities, albeit with strong disparities across cities as shown above.
Overall, a majority of parents (63%) send all their school-aged children to school but with a strong difference between Jalalabad and Kandahar on the one hand (respectively 46 and 40%) and the three other cities where 70% to 79% of house-holds send all their school-aged children to school. Children’s schooling is the highest in Kabul (79% of households). The divide between Pashtun and non-Pashtun cities is clear as Jalalabad present the higher proportions of households sending only their boys to school but Kandahar does show a worryingly proportion of households where no child is attending school. From a poverty and vulnerability point of view, this means that inter-gener-
ational transmission of poverty is likely to be much higher in Kandahar.
• This section confirms that house-holds do find better access to basic services when they move to the city. This has a general impact on their resilience as it allows in par-ticular to a) reduce the potential risks of health-related shocks; b) improve their sanitation and hygiene levels; c) allow for children to access educa-tion, one of the key determinants of resilience. Kandahar fares worryingly low on these parameters, compared to the four other cities, as a result of both a lack of services accessible and cultural constraints limiting accessibil-ity for women and girls.
Education is a key dimension of re-silience. Being able to access schools easily is a key component in preventing vulnerability to pass on from one generation to the other. It is particularly important for girls as ‘safety’ on the
way to school plays a decisive role in parents’ decisions to send their girls to school. The survey of communities showed that a large majority of them had schools available for boys and girls less than 30 minutes walking away.
43. NRVA (2013), p. xx
Urban poverty Report 51

3DETERMINANTS OF FooD InSeCUrIty AND LACK OF RESILIENCE IN THE CITIES
>Current conditions of the ur-ban poor vary dramatically based on their migration history: IDps – especially recently-displaced – are at a clear disadvantage
>extreme vulnerability fuelled by social vulnerabilities: female-headed households, addiction and
forms of employment as key drivers of vulnerability
>Food Security in the city is impacted by access to income and nutrition security bt poor hygiene practices
“For sure, when we lack food, the adults eat less for the children to eat more. But in general, we, the mothers reduce our food shares first for our husband and children to be able to eat.”
Pic. 3.1: A girl from the informal settle-
ment Badam Bagh in Mazar-e Sharif
Photo credit: Ann-Katrina Bregovic
52 Urban poverty Report Urban poverty Report 53

54 Urban poverty Report Urban poverty Report 55
Key findings - section 3
Current conditions of the urban poor vary dramatically based on their migration history: IDPs – especially recently-displaced – are at a clear disadvantage
• Economic migrants and returnees tend to do as well or better than those who never left, in terms of precarity, while IDPs live under con-siderably starker conditions.
• 36% of IDPs have poor food consumption based on the FSC, compared to 26-27% for economic migrants and only 16 to 18% of returnee households.
• 68 (±3%) of IDPs are categorized as “severely food insecure”, while returnees matched residents at 58-59%, with economic migrants faring best at 49 (±3%).
• Higher levels of vulnerability and food insecurity translate into sig-nificantly lower levels of resilience of IDP households. IDPs were at a clear disadvantage in Herat and Jalalabad, Kabul and Kandahar to a lesser extent.
• The present study confirms that newly-displaced fare significantly worse than other IDPs and urban poor more generally.
• Lack of access to adequate housing and to land are two types of vulnerability particularly preva-lent amongst urban IDPs.
Extreme vulnerability fuelled by social vulnerabilities: female-headed households, addiction and forms of employment as key drivers of vulnerability
• A regression analysis showed that the main determinants of extreme vulnerability were a) belonging to a female-headed household; b) hav-ing a single source of income in the household; c) addiction and d) to a lesser extent casual labour as a main source of income.
• Having a disabled member of household (male adult) appeared as a counter-indication for food insecurity, although it did have an impact on poverty. This suggests that the pension received by disa-bled people has a positive impact of households’ resilience.
• Seasonality of casual labour makes winter a particularly difficult season for urban poor, except in Jalalabad where seasonality has a more lim-ited impact.
• Education on the other hand is a strong determinant of food se-curity and of resilience for urban households. A significant gap remains between genders in terms of literacy, reducing women’s abi-lity to cope with shocks.
Food Security in the city is impacted by access to income and nutrition security bt poor hygiene practices
• Food availability is not a major deter-minant of food insecurity within the targeted Afghan cities, which do not suffer from food shortages. Little price volatility exists based on seasonality but food prices have increased over the past 5 years. In contrast to rural areas, seasonality only contributes to food insecurity through casual labour in the five Afghan cities studied.
• Urban households cannot rely on self-production to complement their food intake as only a marginal proportion of households own livestock (13%) or grow produce (7%), further reducing their ability to absorb income shocks.
• Hygiene practices and awareness re-main problematic in many households. Only 33% of respondents reported washing their hands before eating and only 21% of female respondents answered before preparing food. Poor hygiene practices are a risk factor for diarrheal disease and poor nutritional status, especially for under-five-year-old children.

resilience index by migration status
FIGURe 3-2
Resilience Index and Resilience Dimensions by Migration Status
Food consumption score per migration status
FIGURe 3-1
Food Consumption Score by Migration Status - FCS below 28 (red) considered to be poor, between 28.1 and 42 (orange) borderline and above 42 acceptable (dark blue).
“We have no money to buy wheat, oil,
flour or beans. We try to borrow but
we have asked for credits so many times
to the shopkeepers that they will not let
us do that any more. there is no com-
munity support because everyone is poor
here; we can’t even help each other. We
just buy food when our men bring back
money.”
Bagh e Dawood
Focus Group, Women IDPs, Kabul City
56 Urban poverty Report Urban poverty Report 57
A. The Impact of Migration & Displacement on Food Insecurity and Vulnerability
The current conditions of the urban poor vary dramatically by their migration history. On the whole, economic migrants and returnees tend to do as well or better than those who never left, in terms of poverty. However, those who experi-enced internal displacement tended to live under considerably starker condi-tions. IDPs fare worse than other migra-tory groups on a series of indicators, confirming the impact of forced displace-ment on households’ well-being and resilience.
The difference in food consumption, based on the FSC, between the migrant groups is also dramatic. Some 36 (±3%) of IDPs who never lived abroad suffer from “poor consumption” on the FCS, while IDPs who lived abroad and econom-ic migrants have poor consumption rates around 26-27%, with returnee households suffering poor consumption only 16-18% of the time.
Considering the proportion of household expenditures spent on food as an indica-tor of economic well being, the survey
finds that returnees, IDPs and residents perform uniformly poorly, with around two households in five dedicating more than 60% of their expenditure to food, and qualifying as “poor” on the food expendi-ture scale. However, when considering secure access to food, the HFIAS tells a very different story: 68 (±3%) of IDPs are categorized as “severely food insecure”, while returnees matched residents at 58-59%, with economic migrants faring best at 49 (±3%), showing that IDPs are much more likely to experience the distress and anxiety of lacking food for their fami-lies and to be forced into taking drastic measures to deal with food shortages. IDPs are also considerably more likely to go hungry than other migrant groups, with 13 (±2%) suffering “severe hunger” on the Household Hunger Scale, though notably non-migrants scored poorly on this same scale, with 10 (±1.5%) suffering “severe hunger.” In contrast, only about 7% of returnees and less than 5% of economic migrants suffered severe hunger. Over-all, these indicators point to high levels of vulnerability and distress related to securing enough food for the households amongst IDP communities.
IDP Households - Significantly less resilient than other groups44
Higher levels of vulnerability and food insecurity translate into significantly lower levels of resilience of IDP house-holds. Although the internally displaced (IDPs) made up just over a quarter of re-spondents, they accounted for some two thirds of those scoring above 230 on the resilience index (i.e, the top five percent). The internally displaced are at a clear disad-vantage, scoring the highest in four of five resilience index dimensions .
However, this disproportion is not constant from city to city. Although in Herat, IDPs averaged a worrying 60 (±5) points higher than other urban migration groups, the difference was only around ten in Jalalabad, Kabul and Kandahar, while in Mazar-e-Sharif, the internally displaced suffered no significant dis-
advantage. Based on the perception of employment opportunities expressed through pull factors, and the proportion of economic migrants in Mazar-e-Sharif, one might hypothesize that IDPs are also benefitting from employment opportuni-ties in the city.
44. Based on a two-tailed test for group means using a normal distribution; 95% degree of confidence.

mean resilience index by city and migration status
FIGURe 3-3
Mean Resilience Index by City and Migration Status
“People started arriving from Badg-
his, from Shindan, from pashtun Zargan,
from Guzarra (districts of Herat prov-
ince) to settle here. Mostly, these fami-
lies moved because they had no work
in their place of origin. there are only
2 IDp families in the community. Most
of the people own their house here. In
general, they bought their house here
before coming to the neighbourhood.
they bought the old houses, the empty
houses of the area. poor people settled
here because the land is very cheap: 3
beswa cost 500, 000 Afs.”
Darbi Iraq
Community Leader, Herat City
Recently displaces households224 IDp respondents reported having been displaced less than one year ago in the entire sample, 168 of whom are in Herat city. the main indicators show a sharp difference in well-being between this group and the means of all re-spondents and of protracted IDps:
• HFIAS: Recently displaced IDps score a mean of 15.4 (±0.9) compared to a general popula-tion mean of 10.0
• on the household hunger
score, recently displaced households also score higher, with 2.15 compared to a general mean of 1.1. With a margin of error of 0.2 and scores ranging between 1 and 6, this is a significant gap.
• the mean consumption ex-penditure of recently dis-placed households is consid-erably lower than the entire sample at 962 AFA against 1322 AFA for the entire sam-ple.
• Finally, the mean resilience score of recently displaced households is significantly higher than the general population mean at 208.5 (± 5 points) against 157.9 for the entire sample47.
>Both in terms of poverty and of food security, recently displaced households live in considerable distress and enjoy significantly worse living conditions than the average urban households.
58 Urban poverty Report Urban poverty Report 59
Notably, residents of Kabul who never left have the lowest average resilience score of all groups, with all migrants in Kabul at a considerable disadvantage (20-40 points). Of further interest is that Herati returnees, who overwhelmingly spent time in Iran, are significantly more resilient than even the residents who remained. This indicates that Iranian returnees de-rived some advantage abroad that made them more resilient than other groups upon return. Literacy and education are two of the benefits of having spent some time in Iran. It must be noted that the
results in Herat are linked to the inclusion in the sample of the recent caseloads of IDPs who arrived from Badghis and Ghor provinces at the end of 2013 and have settled in Herat in the camps of Kareezak, Pashtan, and Shahee Dayee checkpoint. Given their recent arrival and dire living conditions, these IDPs present very high levels of vulnerability and food insecurity, a reminder that integration in the city’s socio-economic fabric is particularly difficult to achieve for those who are forcibly displaced.
Overall, this comparison of vulnerability and food insecurity levels across mi-gration groups show that forced dis-placement is a stronger determinant of poverty and vulnerability than return. Returnees come back to the country with sets of skills and networks that increased their resilience upon return. Furthermore, returnees often had time to prepare for their return and benefited from various forms of assistance upon return, in par-ticular UNHCR’s return package, which includes a cash grant and shelter assis-tance for a large proportion of returnees45. Some movements of returns had been carefully planned ahead, like for example the Hazara community of Jebrail in the city of Herat, who had purchased land before moving back to the city.
The internally displaced on the other hand are usually forced to leave suddenly and have little choice in the decision to leave. In majority coming from rural areas (see above), they lack the skill set, literacy and urban habits that would facilitate their arrival. Unlike economic migrants, they also have to leave rapidly and with little preparation, putting them at risk of dire poverty, especially in the first years of their displacement. The community of economic migrants of Darbi Iraq in Herat for example is a good example of how communities and households prepare
their migration to mitigate the risks they will face upon arrival:
Recently displaced households: vulnerable among the vulnerable The situation of IDPs in Herat suggests that some stratification exists amongst IDPs based on their time in displace-ment, a trend noted by NRC and UNHCR during an IDP profiling in 2014 in Kabul city46. The present study confirms that the newly-arrived are amongst the most vulnerable groups as the newly-arrived IDPs fared significantly worse than the average urban poor in this study:
45. See MGSoG-Samuel Hall(2013), Evaluation of UNHCR Shelter Assistance Programme. 46. KII with UNHCR and NRC 47. Two-tailed test for the means of the group; 95% confidence interval.

“raising chickens and growing
vegetable and potatoes
was very useful. It was for our own
consumption only. We cannot do this
this year, because they are kicking
us out of this area. We will have to
start our lives, everything again.”
Bagh e Dawood
Focus Group, Women IDPs
Kabul City
Housing arrangements
FIGURe 3-4
Housing Arrangements by Migratory Status
60 Urban poverty Report Urban poverty Report 61
Housing and Land: two key factors in IDPs’ vulnerability A key factor in the vulnerability of IDPs is linked to their situation in terms of hous-ing, access to land and security of tenure as shown above.
IDPs were less likely to own a house than non-migrants, with economic migrants faring somewhat better and returnees owning their houses nearly as often as residents. Of greater concern is the proportion of IDPs living in tents (13%) or temporary shelters (10%): 61% (±6%) of urban poor living in tents were IDPs, although they accounted for one fourth of the total number of respondents. Figure 3.4 illustrates the various hous-ing arrangements IDPs and economic migrants have access to upon arriving in the city. IDPs are significantly more likely to adopt a non-sustainable solution, such as sharing houses or temporary shelters: 43% against 24% for returnees and local residents, confirming the impact of sud-den displacement on vulnerability, as the absence of planning, preparation or networks guiding the displacement means
that households settle in the city with very little visibility and safety nets.
The security of land tenure is a heated question in Afghan cities, as informal set-tlements have burgeoned throughout the past decade, with recently arrived house-holds settling on governmental, municipal or private lands. Eviction and the fear of being evicted plays a role in the communi-ties’ ability to develop, invest and adjust to the life in the city, something to which IDPs and economic migrants are par-ticularly vulnerable. Qualitative fieldwork shows how vulnerability and food security of households are increased by evictions – and to a lesser extent the fear of eviction.
For example, the community of IDPs living in Bagh e Dawood, in the surroundings of Kabul city, has been struggling to secure access to land tenure since their arrival in the city more than 15 years ago. At the beginning, they settled for 4 years in Deh Mazang before being evicted and mov-ing to another area near the Sanatorium in Darulaman, where they could stay for another 10 years. Upon a new round of
evictions, the community moved to this area of Bagh e Dawood, where the land is owned by the Ministry of Defence. The small community is now being threatened with eviction again, as a development project is starting in the area, after the land was bought off – or grabbed depend-ing on the accounts - by a local powerful figure. A direct consequence of this threat of eviction for the community is the loss of the additional sources of food that the community had secured through backyard gardening and poultry raising.
Overall, quantitative and qualitative data both confirm the impact of forced dis-placement on poverty and food security status, as lack of access to land, to hous-ing and sudden disrupt of livelihoods put IDPs in a vulnerable situation, especially for the most recently displaced among them.
B. Social Vulnerabilities: Key drivers of food insecurity and lack of resilience
48. These categories were tested separately but they are not necessarily mutually exclusive as addicted heads of households often leads to the
woman trying to earn money to provide for her family for example.
Beyond migration status, and within an urban population largely poor and vulner-able across the board, a few sub-groups show sign of extreme poverty and call for specific interventions. The research team tested some of the assumptions on vulnerability, including the specific types of vulnerability that female-headed households, elderly-headed households, households with addicted members and households with disabled members.
In order to test the strength of these determinants on the level of poverty and food security, a multinomial logistic regression analysis was conducted on a
series of potentially determinant factors of poverty.
This regression analysis provided evi-dence that the main determinants of extreme vulnerability were a) female-head of households; b) single source of income in the household; c) addiction and d) to a lesser extent casual labour as a main source of income48.

InDICator most determinant factors
Severe food Insecurity based on Household Food
Insecurity (HFIAS)
1. Addiction
2. Female head of household
3. Low level of education
Severe Hunger (Household Hunger Scale) 1. Female head of household
% of food in total household expenditure > 60% 1. Casual labour
poverty (income < 1,710 AFA/person/month)
1. Male disabled adult
2. Addicted member of household
3. Casual labour as source of income
extreme poverty (income below median amongst
households with income < 1,710/ person /month)
1. Having 1 or less sources of income
2. Being disabled
3. Addiction
4. Having a female head of household
5. Casual labour as source of income
Lower Income
1. Addiction
2. 1 or less source of income
3. Female head of household
Overview of main factors for each indicator based on multinomial regression test
overview of main factors for each indicator
Table 3-1Sparghai is a 45-year old widow. She
is originally from Ghazi Abad but her
household moved to Jalalabad for
economic reasons a long time ago. Her
husband died 15 years ago and Spar-
ghai had to take care of 6 children. “It
was very difficult to adjust when he
died and my children were frequently
lacking food”. today Sparghai relies on
the support of her father and on the
income brought by her two sons who
are respectively 12 and 10-year old.
She is frequently worried about the
quantity of food that she will be able to
provide for her children, as the house-
hold constantly lacks money.
Bibi Hawa is 50 years old. originally
from Charkent district in Balkh prov-
ince, she lived 3 years in Iran with her
husband before coming back to Mazar-
e-Sharif City. Her husband was a
porter and passed away 10 years ago,
leaving Bibi Hawa alone with her 3 chil-
dren. “I was in a critical economic situ-
ation when my husband passed away.
It was the case until my sons were old
enough to earn money themselves. We
didn’t have money to buy food and we
all had to be patient when food was
lacking on the table. Nowadays, my 16-
year old son is a carpenter and earns
money for the family. But I am still very
often unable to afford the kind of food
that my children would prefer eating.
Zamarud is originally from Karrukh
district, her family moved to Herat City
because of the repeated droughts and
the lack of economic activities there.
Mother of two sons and two daughters,
Zamarud lost her husband 12 years
ago. Upon the death of her husband,
she faced a difficult situation, as she
had to stand up against her family to
avoid being married to her husband’s
brother. She was also in a very difficult
economic situation. She refused the
forced marriage and decided to start
working for her children. the absence
of livelihood was very tough for the
family at the beginning but Zamarud
managed to find various income-
generating activities. She is now
involved in cleaning wool, cleaning
and shelling pistachios and is a house
cleaner for various families in the
community. Life is still not easy but
Zamarud manages to put food on the
table for her children.
Zakia (55) is a widow. She is also the
eldest member of her family and head
of the household. Zakia is no stranger
to the tragedies of war. First, she lost
her husband in the conflict and later 2
of her children died in a rocket attack
while they were at university. She now
has 3 daughters and 1 son remaining.
1 of her daughters is married and has
3 children. She depends on the income
brought by the son-in-law who is a
casual labourer. Another of her daugh-
ters is married in pakistan and it has
been 2 years since she last saw her.
the remaining stays with her.
Money is very hard to come by. She
earns money by washing clothes in the
residential block close by. Her son-
in-law’s income is split between his
own family and hers so she does not
get much of it. out of desperation the
13-year old son go out to the market
to work as daily labourer. He goes un-
supervised to the market and spends
all day there before returning in the
evening. >Marital Status of Female Heads of Households
WHat IS tHe marItaL StatUS oF Female Heads of Households?
FIGURe 3-5
CaSe StUDy 1> Jalalabad
CaSe StUDy 3 > Herat
CaSe StUDy 4 > KabUL
CaSe StUDy 2 > mazar-e-Sharif
62 Urban poverty Report Urban poverty Report 63
Female-headed Households/Widows Female-headed households show signs of extreme poverty, food insecurity and vulnerability. In the general sample, 626 households reported being headed by a woman, or 11.6% of the total number of households. Having a female head of household appeared to be a strong deter-minant of severe food insecurity, to be the strongest determinant for the household to experience severe hunger. Looking at extreme poverty – i.e. households falling below the median amongst households
below the poverty line – shows that a female-headed household is a significant determinant for extreme poverty. Female heads of households and widows have to adapt to difficult socio-economic conditions in a society where a) the type of jobs and salaries accessible to women are scarce and low; and, b) the independ-ency of a female head of household is not guaranteed and they have to rely on the generosity of relatives to survive. The following cases studies illustrate these difficulties:

A week back he came back home empty
handed and cried because he could not find
work that day.
Her kitchen was based in the corner of the
tent she was staying in. It consisted of 1 gas
stove, 1 cooker, 1 plate and 1 bowl. the only
food in the house was rice, which was cook-
ing on the stove for the evening meal. there
was nothing else stored in the house. their
income was daily income so their food pur-
chase was also daily. Whenever, her son/son-
in-law came back they brought home some
rice or potatoes or something else for the
night meal. In addition the daily income was
spent on buying cooking oil, fuel, and water.
that was all they could do with the income.
the last time she had 2 food items in one meal
was a month ago. She couldn’t even remem-
ber the last time she had meat to cook. At
times when they have no food at home, they
boil flour in oil and water and eat that as it is.
everything she owned had been provided by
NGos. they had no other assets. 7 months
ago, her tent had caught fire because they
cook food indoors. ten other tents along with
hers were destroyed. Luckily no one was
injured in the fire but she lost some blan-
kets and bedding. Hence she was now using
blankets given by NGos to cover the floor on
which they sleep. It was lucky that someone
came and provided her with a new tent oth-
erwise she says she and her household would
have to sleep in open air.
Zakia says that it has been the same like this
for the last 11 years since they came back
from pakistan. their conditions as refugees
were much better. In some instances she
considers herself worse off now than when
she left pakistan. She has had to sell of eve-
rything she had owned in pakistan. She has
no answers as to how to increase her fam-
ily’s income. She had hoped that she would
give her children education so that they could
earn a higher income and at least their lives
will be better. But right now she is unable to
do that as well and does not see any ray of
light in the near future.
“my husband is addicted; he takes
whatever he wants from the house to
sell it and buy drugs. Sometimes, he
even takes food from the house to sell
it while my children don’t even have
school uniforms and I’m not able to
pay for the school requirements. He is
addicted to opium, hashish and heroin.
His addiction has had such a negative
impact on my life, on the life of our
children, on our income, on our food
security!”
Adela, 38 years old
Herat, Baba Haji
Percentage of households reporting one of their members to be addicted (by city)
households with one addicted member
FIGURe 3-5
64 Urban poverty Report Urban poverty Report 65
Household with addicted members A total of 377 households – or almost 9% - reported having at least one of their members being addicted, with the follow-ing breakdown per city above49.As a comparison, UNODC estimates the Southern and Northern regions to have the highest prevalence rate (7.2%). Eastern and Western regions follow with
respective prevalence rates of 6.3% and 5.9%50. The issue of addiction as a ma-jor determinant of vulnerability and food insecurity in Afghan cities is important as addiction is on the rise in most Afghan cit-ies and as people surrounding an addict, including children, get addicted rapidly, thereby increasing the chances for poverty to be transmitted between generations.
49. No data on addiction were collected for Kabul City as the indicator was added for the provincial capitals, after the end of the fieldwork in Kabul. The sample size is therefore of
4,320 respondents. 50. MCN-MoPH-UNODC (2009), Afghanistan Drug Use Survey, p.7-8.
51. MCN-MoPH-UNODC (2012), Afghanistan Drug Report – Executive Summary, p. 9 52. Ibid. p.18
All of the five cities studied here as in the list of ‘hot spots’ for drug use identified by UNODC51.
“Drug use is on the rise everywhere,
in every city. Drug is easily available
in the urban markets and people who
have no work, no income, easily get
into it, generally through peer pres-
sure. It comes with many problems: ad-
dicts steal from their own family, from
the mosque. people disregard them.
It put a lot of pressure on women, on
children.”
KII UNODC Staff
Addiction to opiates is particularly high among returnee households – one of DRC’s groups of concern – as they have been identified as a group with particularly high prevalence of drug use and associ-ated risks:
“there are an estimated 30,000 re-
cent heroin users among the returnee
population. the prevalence of drug
use and associated risks amongst this
population is ever increasing and more
services need to be implemented to
address this need.”52
UNODC 2012 Drug Report
Addiction appears to be a very strong determinant for household food insecu-rity, poverty and extreme poverty (being below the median amongst households below the poverty line). Having an addict in the household is also one of the strong-est overall negative drivers of household income, which shows the very high level of vulnerability that households with ad-dicted member(s) are subjected to. Drug addiction – especially addiction of the head of household – is crippling for households’ resilience in many ways as:
• Families lose one or more poten-tial source(s) of income, especially male sources of income;
• Drug addicts are likely to sell household’s assets or to use most of the household’s income to finance addiction;
• Families with drug addicts gradu-ally lose the support of their com-munities, as they are perceived as threats to the community, making it even more difficult for families to access food.

Main Issues faced by households (per city)
main problems faced by households (by city)
FIGURe 3-7:
Mean Family size vs. number of income earners (by city).
mean family size and numbers of earners
FIGURe 3-8
66 Urban poverty Report Urban poverty Report 67
The lack of job opportunities was reported as particularly acute in Herat, Mazar-e-Sharif and Jalalabad cities, suggesting that the eco-nomic slow-down takes a different hit on cities’ economy. Figure 3.10 below suggests that construction and transportation are particularly important sectors in Herat, Mazar-e-Sharif and Jalalabad, while Kan-dahar and Kabul present relatively more diversified economic profiles. This would explain the particular anxiety of households in these three cities as investments slow down in the construction sector.
Poor access to stable labour and income contributes to the house-holds’ vulnerability in various ways:
“In the past, when the foreign-
ers were around, most people
would work in construction and
get daily labour as contractors.
But now everybody is unem-
ployed. We all have difficulty
finding money. Most people try
to do street vending but the
police does not let us do that.”
Community leader, Kabul City, Wasilabad
High dependency ratio within households Urban households remain heavily dependent on one or two sources of income for entire families. Kabul fares better than the four other cit-ies under scrutiny with 1.82 aver-age number of household member earning an income. Across the board the dependency ratio of Afghan urban families is very high, making them extremely vulnerable to shocks.
The survey found that 13% of Afghan urban poor have no family income earners and 65% (±2%) have only one income-earner, meaning that a 78% of urban households had one source of income or less, a very high indi-cator of vulnerability. The ratio of number of earners to family size is worse in Kandahar and Jalalabad with 26% and 24% of families, respectively, having none or only one family earner for every ten fam-ily members, in stark difference to cities such as Mazar-e-Sharif (7%) and Herat (9%). This is linked to the higher size of households in these two provinces, increasing the level of vulnerability of households in these two provinces
Sources of income and nature of employment determining resilience Across the board, access to employ-ment and livelihood – especially stable employment – is pointed at as the key determinant of food insecurity and vul-nerability for urban households. Access to food is highly dependent on house-holds securing enough daily income to
purchase food. As noted above, access to employment and forms of employment are particularly determinant in the level of poverty of households. Lack of job op-portunities was reported as the first of the problems faced by urban households in every city but Kandahar.
“Food Security and poverty are first and foremost a problem of live-lihoods in the cities. House-holds lack in-come, lack cash, hence cannot meet their food needs. You need to improve live-lihood to improve food security”.
KII NGO, Kabul

Main Sectors of Employment of Urban Households
main Sectors of employment
FIGURe 3-10
Main Sectors of activities accessible to women
activities accessible to women
FIGURe 3-9
68 Urban poverty Report Urban poverty Report 69
Female Employment: Marginal, even in the cities In urban areas too, the main income earn-ers are male adults and youth to a very large extent. The findings of this study confirm that the urban environment is not particularly conducive to a higher level of female participation in the labour market the cities. Only 13% of house-holds reported having at least one female adult earning an income for the family. Women participating in income-generating activity remain a last resort for families who have no other choices: widows (23% of these households) or when the spouse is disabled or unable to work (26% of these households). Amongst the 1,274 female respondents randomly selected for this survey, only 193 or 15% reported earning an income for the family, confirm-ing the low rate of participation of women to the labour force in the cities. This low participation of women in the workforce reinforces the dependency of households on a limited number of sources of house-holds, further decreasing their level of resilience.
Qualitative and quantitative data show that the main forms of employment ac-cessible to women are low qualified and low-income jobs such as house workers (cleaning) and home-based activities, in particular tailoring, sewing and embroi-dery. Other home-based activities vary and are specific to each city. In Herat for example, women would sometimes bring income to their households by shelling pistachio during the pistachio season. In other cities, women would for example trim and clean wool at home. The public sector, which is often considered to be one of the main sectors accessible to women, was still poorly represented in our sample with only a marginal propor-tion of active women working in educa-tion, health or other sectors of the public administration. The low levels of literacy and education of urban women detailed above partly explains this poor access to
public positions. Women are therefore not in a position to access high wages: quali-tative data showed that household work-ers would earn approximately 50 AFA per day – or a maximum 1300 AFA per month if they are able to work every working day of the month – far below the average male daily income, which varies between 200 and 300 AFA per day across city.
Overall, this shows that the urban environ-ment is not particularly favourable to fe-male employment, as cultural constraints are still very present in the cities, which do not offer the relative safety that village or rural communities may offer. In rural areas, women are often active in the agriculture sector and in taking care of livestock, activities that are inaccessible once in the city53. Strong cultural constraints and low levels of qualification make it difficult for women to play an economic role in cities: 69% of female respondents reported hav-ing left their houses only 5 days or less in the previous 31 days, a figure that goes up to 81%, the maximum, in Kandahar54. This may change significantly with the change of generation and an increased proportion of girls completing their education and ac-cessing higher education in the cities. Yet, this change is yet to impact urban market labour.
Stability of Employment: a luxury for most urban households The main sectors of employment of urban households are a) construction; b) retail; and, c) transportation. The public sector is also relatively important for urban house-holds. Income earners are mainly working in building construction, retail and in the transport sector.
Figure 3.10 confirms the prevalence of construction and transportation as key economic sectors for Afghan cities across the board, two sectors characterised by high levels of instability in terms of ac-cess to labour and income. There are 527 households, which prime income-earner work in construction, of which 451 are daily labourers and 60 self-employed, both representing highly instable sources of cash. In the entire random sample, only 392 households (15.5%) had sala-ried workers as their main income-earner. Those were mostly working in the public sector, a source of stable but low income.
The percentage of main income-earners working all year round varies from 45% (± 4%) in Mazar-e-Sharif to 67% (± 4%) in Jalalabad, while approximately 30% of main earners can only work on an irregular basis. Mazar-e-Sharif again stands out here with 45% of main income earners making an irregular living only. Yet, all year long does not mean every working day of the year, as daily labourers struggle to se-cure work every day of the week. Irregular employment remains a major tenant of vulnerability for urban households, con-firming past research on the topic55. Income does vary with seasons in the five cities covered although with a slightly different pattern for Jalalabad and Kandahar. Qualitative fieldwork points without ambiguity at the winter as the most difficult season for urban households, as the cold weather makes it impossible for people to work outside and considerably impacts key sectors for urban economy like construction and transportation.
“my husband is a daily labourer. If there is work, he earns 300 Afs per day. But often
there is no work. these days, he goes to find work at 4 in the morning but it has been
several days in a row that he could not find work for the day.”
FGD Women, Mazar-e-Sharif, Wali Asr
53. ILO (2012), Afghanistan: Time to move to Sustainable Jobs. Study on the State of Employment in Afghanistan, Summary Report, p.4. 54. Based on random sample (n=1,274). 55. See Samuel Hall for ILO (2012), Time to Move to Sustainable Jobs : A Study of the State of Employment in Afghanistan.

Difficult Winter in Herat
Most of the people of our area are daily workers. Some of
them work in construction and other work on the market.
the work is good in the summer but people are completely
unemployed in the winter. there is not any construction or
daily work in the winter and living conditions are very tough
at that period of the year.
FGD Men – Herat (Babaii)
absence of work in the winter in Kandahar
our households’ earning decrease in the winter. My hus-
band for example is a daily worker and uses his motorcycle
to earn money every day. But in the winter he cannot work,
there is too much rain and mud, transportations stop for the
most part.
FGD Women – Kandahar (Mulaya Naw)
Is this season (winter) usually a period of low/average/high income?
Is winter a period of LoW income?
Table 3-2
Level of education of respondents per city
level of education
FIGURe 3-12
70 Urban poverty Report Urban poverty Report 71
Yet, the variation is not as acute in Jalal-abad and Kandahar as it is in the other cities, because of their different weather patterns. Summers are also difficult seasons for daily labour as extremely hot temperatures also slow down construction activities. Winters are milder and allow for households to continue working during the winter to a larger extent than in the three other cities. This is especially the case in Jalalabad.
Qualitative fieldwork confirmed that Jalalabad enjoys more stable access to income throughout the year, while on the other hand, income in Herat and Mazar-e-Sharif-e-Sharif is particularly season-sensitive with respectively 71% and 74% of households who highlight winter as a period of low income.
Household with disabled adult members: A counter-indicator of food insecurity Disability is commonly seen as a key determinant of poverty and vulnerability in the country, especially if it affects male adults, the main potential income-earners within families. In these cases, disability has a huge opportunity cost for families as they lose their most reliable source of income. It may also induce higher levels of expenses on non-food items, espe-cially health-related expenses, potentially endangering food security. Yet, the multi-nomial regression test highlighted male adult disability as a counter-indicator for food insecurity. The statistical test
did show that disability was a factor in poverty and extreme poverty. The impact of disability on income and expenditure is easily understandable but the fact that these households are less food insecure is counter-intuitive. This surprising finding can be explained by the fact that a) the disabled are eligible for a cash grant distributed by the Minis-try of Labour, Social Affairs, Martyrs and Disabled (MoLSAMD) every month, one of the only components of a social protec-tion policy actually in place and function-ing in the country; and, b) the fact that households with disabled members may be priority recipients of community sup-port and charity. Within an urban popula-tion characterised by extremely high vul-nerability, receiving a regular cash transfer is enough to push people away from the category of the most vulnerable.
C. Education and Access to services limit vulnerability
Beyond the negative drivers of poverty and food insecurity in the cities, the study also identified some of the key factors limiting vulnerability and poverty among urban households.
Education and Access to Basic Services impacting food security Education stands out among Afghani-stan’s urban poor because of the impact it appears to have on food security. Mean scores on HFIAS scale range from 6 to 11 between education levels, despite an overall standard deviation of just 6 points. This suggests a strong dose-response relationship of education to HFIAS scores, with education showing a protective effect against food insecurity. As a result, those with no formal educa-tion have a 59±2% probability of suffering “severe food insecurity,” those having at-tended only primary school had a 41±6% probability, and those who attended high school had only a 28±6% chance of suf-fering severe food insecurity.
In an environment where levels of educa-tion and literacy remain generally low, education makes a significant difference in offering access to different types of jobs, in the public sector or in services,
allowing for more stable sources of liveli-hoods than non-educated households. Higher levels of education also lead to higher levels of awareness about the nutri-tion and food requirements of a house-holds and higher ability to manage the household’s finance and expenses in a sustainable way. While the overall level of education of the population is increasing, the generation of heads of household has been particularly disadvantaged in terms of access to education, as it has to endure decades of conflict and migration. For this generation, a high level of education is still rare enough to be an important factor de-creasing the vulnerability of households, even amongst urban populations.
Educational levels vary considerably by city and by gender. While 80% (± 4%) of Kandahar residents have no formal education, this is only the case for 59% (±5%) of Kabulis. At 6% (±2%), Kabul also has the highest proportion of respond-ents with high school education and the highest proportion of respondents with a college-plus level of education. Head of household literacy goes hand in hand with respondent education, making it a good approximation for the level of education of the household.

Literacy of Respondents by gender
Who can read?
FIGURe 3-13
Agriculture and Livestock in the city
how many grow vegtables or have livestock?
FIGURe 3-14
72 Urban poverty Report Urban poverty Report 73
A significant difference exists between genders with 83% of female respondents being illiterate compared to 53% of male respondents. The proportion of illiterate women is extremely high and shows that being an urban dweller does not system-atically mean access to education, at least for the current adult generation. It also explains the particular vulnerability of female-headed households.
Migratory groups are also characterised by different levels of literacy and educa-tion, with returnees faring slightly better than displaced households or households who were never forcibly displaced: 37% of heads of households in returnee fami-lies were literate, as against 29% for IDPs and 32% for households who were never forcibly displaced. Having lived in Iran or
Pakistan made it easier for Afghan refu-gees to access education, while access to education remained very difficult in rural Afghanistan, especially for older genera-tions.
• Food Security and resilience are function of education and stability of employment first and foremost. Education entails access to better forms of employment, while stable employment and multiple sources of income reduce the vulnerability of households to shocks. Female-headed households, households with addicted members and households relying on casual labour remain highly vulnerable.
D. Food Availability: High at the community level, low at the household level
Urban Markets & Seasonality on food availability Food availability is not a major determi-nant of food insecurity within the tar-geted Afghan cities, which are all regional centres of trade and business and do not suffer from food shortages. Urban households can benefit from a range of food sources – from the local food carts and street vendor to supermarkets – and adjust their purchasing habits to their pur-chasing power and mobility within the city.
Mobility and knowledge of the city are two important dimensions to get cheap food, as central markets or wholesaler markets offer more advantageous prices than the food carts and small shops available within communities. These two elements are obviously not evenly distributed within the population as female heads of house-holds or disabled may lack the mobility. On the other hand, recently arrived lack the information necessary to navigate their way in the city and find the best food pur-chasing strategies rapidly. These groups are therefore at a disadvantage.
Prices volatility and seasonality have not
been noted by key informants as a major obstacle to food security in the five cities studied.
“there are variations of prices in
urban areas too but the line is some-
how flat compared to rural areas. the
main variable is the availability of work,
not the seasonality of harvest and food
production.”
KII – WFP
Assessing self-production in the cities With the movement to the city from rural areas – whether forced or decided – usu-ally comes a loss of households’ ability to self-produce and to complement their food intake through their own production. While agricultural and gardening skills are part of the traditional skill set of Afghan households, conflict and displacement have often weakened these abilities, espe-cially within urban environment character-ised by high pressure on land. The present study assessed the level of self-production within Afghan cities, as a form of resilience for households, which would be able to produce food comple-ment and to diversify their caloric intake.

Main Source of Drinking Water per city
main Source of Drinking Water
Table 3-3
“The water from the wells is not so clean but people can’t always afford piped water. Usually, we use piped water to drink, for tea, to cook or wash vegetables and use the wells for other purposes (cleaning etc). The water is provided by the mu-nicipality. It costs 26 Afs per makab (cubic meter).”
Darbi Iraq, Herat
74 Urban poverty Report Urban poverty Report 75
The survey shows without ambiguity that urban households have mostly given up on rural forms of livelihoods: 93% of sur-veyed households reported not produc-ing any sort of agricultural or horticultural products, while 87% of households do not own any sort of livestock. In that regard, Jalalabad and Kandahar stand out, as respectively 21% and 23% of households in these cities owned livestock. Jalalabad is also the city with the highest proportion of households producing some prod-ucts. The resilience of livestock in the two Pashtun cities may be linked to the important number of Kuchi families, tra-ditionally raising livestock, although most lost their animals either as a cause or a consequence of their move to the cities. Still, it shows that urban forms of agricul-ture exist in these two cities, while they are practically absent from the three other cities, especially Kabul and Herat.
Among the households producing agricul-tural products in the city, a majority report-ed cultivating vegetables (52%), followed by wheat (32%); fruits (27%) and tubers (18%). In many cases, these productions were combined. To a very large extent, these are cultivated for the own consump-tion of households (in 74% of cases), although another 12% of households
reported earning an income through these productions and 10% of households used it both for consumption and income-gen-eration. Among the households who own livestock, the majority owns small poultry (1 to 10 chickens). Only a very marginal number of urban households own sheep or goats in the city. For livestock as well, a large majority of households prioritise family consumption (72%) over income-generation (15%), although 10% of them combine both.
Overall, urban households can only very marginally rely on additional sources of food that they would produce themselves. Difficult access to land and to water, as much as the lack of habit and tradition of urban agriculture and receding gardens in the cities, explain this absence. The study confirms the quasi inexistence of urban forms of agricultural productions, further increasing the dependency of urban households on income for food security. The inability to increase access to food through self-production further reduces urban households’ resilience.
E. Food Utilisation: Problematic Hygiene Practices
FooD USe/UtILISatIon aS a DetermInant oF FooD SeCUrIty
“Based on knowledge of basic nutrition and care, as well as adequate water and sanita-
tion, each member of the household is able to get an intake of sufficient and safe food
adequate to each individual’s physiological requirements.”
56. Piped water, private pumps, public pumps and wells are improved sources of water. Surface water, pool or water tanks are unimproved. 57. MoPH-UNICEF, (2013), NNS, p. 56.
WASH indicators pointing at poor hygiene practices
of drinking water nationally and the NRVA only 39.4% of households in rural areas. The main difference comes from the ac-cess to piped water, more widespread in the cities (35% of households surveyed, compared to 14.4% nationally)57.
Among the households that do not have a source of water directly accessible in their house or compounds, 62% reported hav-ing a source of water accessible within 15 minutes walking (back and forth). Kanda-har and Mazar-e-Sharif show the highest proportions of households that have to walk more than 30 minutes (respectively 20% and 18% of the households that do not have a source of water in their compound); 6% of households in Mazar-e-Sharif reported not having access to a source of water, suggesting that this may be a particular issue for Mazar-e-Sharif, a finding confirmed by KIIs in the city.
Yet, the source of water is not the only component to consider, as prices of water vary quite significantly from one city to the other, especially when household rely on piped water. This leads to more refined
strategies in terms of use of water with piped water being saved for consump-tion and sometimes food preparation,
while other sources are used for other water needs (laundry and dish washing in particular).
Satisfying access to Safe Water Looking at water sources of urban house-holds shows that most of them have ac-cess to improved water sources56:
Here the urban environment plays a clear role in facilitating households’ access to improved water, as the NNS found 62.9% of households using improved sources

Households’ sanitation facilities
Sanitation Facilities
FIGURe 2 / 3-15
Out of the 63 women who participa-ted in FGDs and had young children: • 23 said that their children get diar-
rhoea at least once a month • 18 at least once a week • Only 14 said either never or a few
time a year.
76 Urban poverty Report Urban poverty Report 77
not having soap. These divergences may also come from the lower prices of prod-ucts – soap in this case – accessible in Jalalabad and Kandahar from Pakistan. In order to test awareness about ad-equate hygiene practices, respondents were asked to list when they should wash their hands. The survey unveils low levels of awareness, even amongst the urban
population, as the only situation frequently cited by respondents was “after defecat-ing” which was cited by 83% of respond-ents, with a significant difference between gender (89% of male respondents against 76% of female respondents). This dif-ference between genders is problematic as women are the main care-givers and are in charge of preparing food for the households. Answers were not prompted, leading to low proportions of spontaneous answers. Worryingly, only 33% of re-spondents reported washing their hands before eating. Only 21% of female re-spondents listed “before preparing food” and 9.8% of female respondents “before feeding children”.
Overall, this shows that levels of aware-ness on adequate hygiene practices remain limited across the board, despite the urban environment. Directly related to these practices, qualitative fieldwork with women showed that diarrhoea is frequent amongst young children, especially during summer. Both in Jalalabad and Kandahar, women pointed at the summer as particu-larly problematic for their children.
Diarrheal disease is in turn a risk factor for poor utilization of food, as Jones et al. (2013) say: “Utilization reflects differences
in the allocation of food within house-holds, the nutritional quality of that food, and variation in the extent to which the nutrients in food are able to be absorbed and metabolized by individuals within the households (e.g. because of differences in health status or the bioavailability of micronutrients).”59 Poor hygiene practices may endanger the nutrition security of urban households. Nutrition security is de-fined as ‘’a situation that exists when se-cure access to an appropriately nutritious diet is coupled with a sanitary environ-ment, adequate health services and care, in order to ensure a healthy and active life for all household members.”60
Overall, this shows that while having ac-cess to relatively safer facilities than their rural counterparts, urban households still display low levels of awareness about hygiene.
Intra-household dynamics regarding food
Purchasing Patterns of the Urban Poor: Men are still in charge Understanding intra-households dynam-ics surrounding food – both in terms of purchasing habits and consumption – is important to inform programming and tailor interventions to the reality of Afghan households.
Both qualitative and quantitative data con-firmed that, while women of the house-holds are in charge of food preparation, it is in most cases male members of the households who are charge of purchas-ing food. In 72% of urban households, only male adults are responsible for food purchases. In only 10% of households female adults were responsible to buy food. In 7% of cases, male and female adults share responsibility, while in 4% male children and adults are in charge of purchasing food. Female responsibilities differed between cities, depending on the
Poor Sanitation FacilitiesA total of 34% of households used flushed latrines, a result that is significantly higher than the national average (9%), but still low in absolute terms. Traditional pit latrines remain the most common form of sanitation, even in the city.
On that aspect as well, cities fared dif-ferently, with Kandahar being the worst off (only 21% of flush latrines) and Herat and Mazar-e-Sharif the most advanced (49% and 42% respectively). This con-firms a trend in terms of access to basic services, by which residents of Herat fare better than their counterparts in other cities, while people living in Kandahar are generally disadvantaged when it comes to access to services and basic facilities.
An important indicator of households’ good hygiene is whether households have to share latrines with other families or not: 24% of urban households surveyed reported sharing their latrines overall, a figure slightly higher than the national average found by the NNS (17%). The difference can be accounted for by the dwelling conditions in urban areas, more crowded and therefore conducive to shar-ing latrines. The survey found a surpris-
ingly high proportion of them sharing latrines in Kabul (41%) compared to other cities (between 26% in Mazar-e-Sharif and 11% in Kandahar). This can be explained by the high pressure on land and housing in Kabul that forces many families to share compounds or houses. In these cases, each family has its own room but may be forced to share facilities such as latrines. Indeed, Kabul presented the highest pro-portion of households sharing their hous-ing facilities with Jalalabad (20 and 22%), 10 points higher than the three other cities. Only 6% of Kandahari households and 9% of Herati households reported sharing their latrines.
Problematic Hygiene practices Hygiene practices remain problematic in many households, raising risk for diarrheal disease and poor nutritional status, especially for under-five-year-old children. A vast majority of urban house-holds reported having soap in their house (82%), a figure based on self-reporting,
hence likely to overestimate the actual proportion58. Yet, the NNS found similar proportions based on direct observations in certain provinces like Kabul (74.2%), Nangarhar (80.3%) and significantly lower results in other (Balkh: 30.8%; Herat: 13.7%). The present study does find Mazar-e-Sharif-e-Sharif to be worse-off with 34% households not reporting having soap in their houses and Herat coming in second position with 19% of households
58. Data on hygiene practices are self-reported, as a full in-site observations was beyond the scope of this study. Data on hygiene are therefore relatively soft as respond-
ents may be ashamed to give honest answers to these questions
59. Jones AD, Ngure FM, Pelto G, Young SL. What are we assessing when we measure food security? A compendium and review of current metrics. Advances in Nutrition.
2013. 4:481-505 60. FAO (2012), The state of food insecurity in the world, Annex. 3
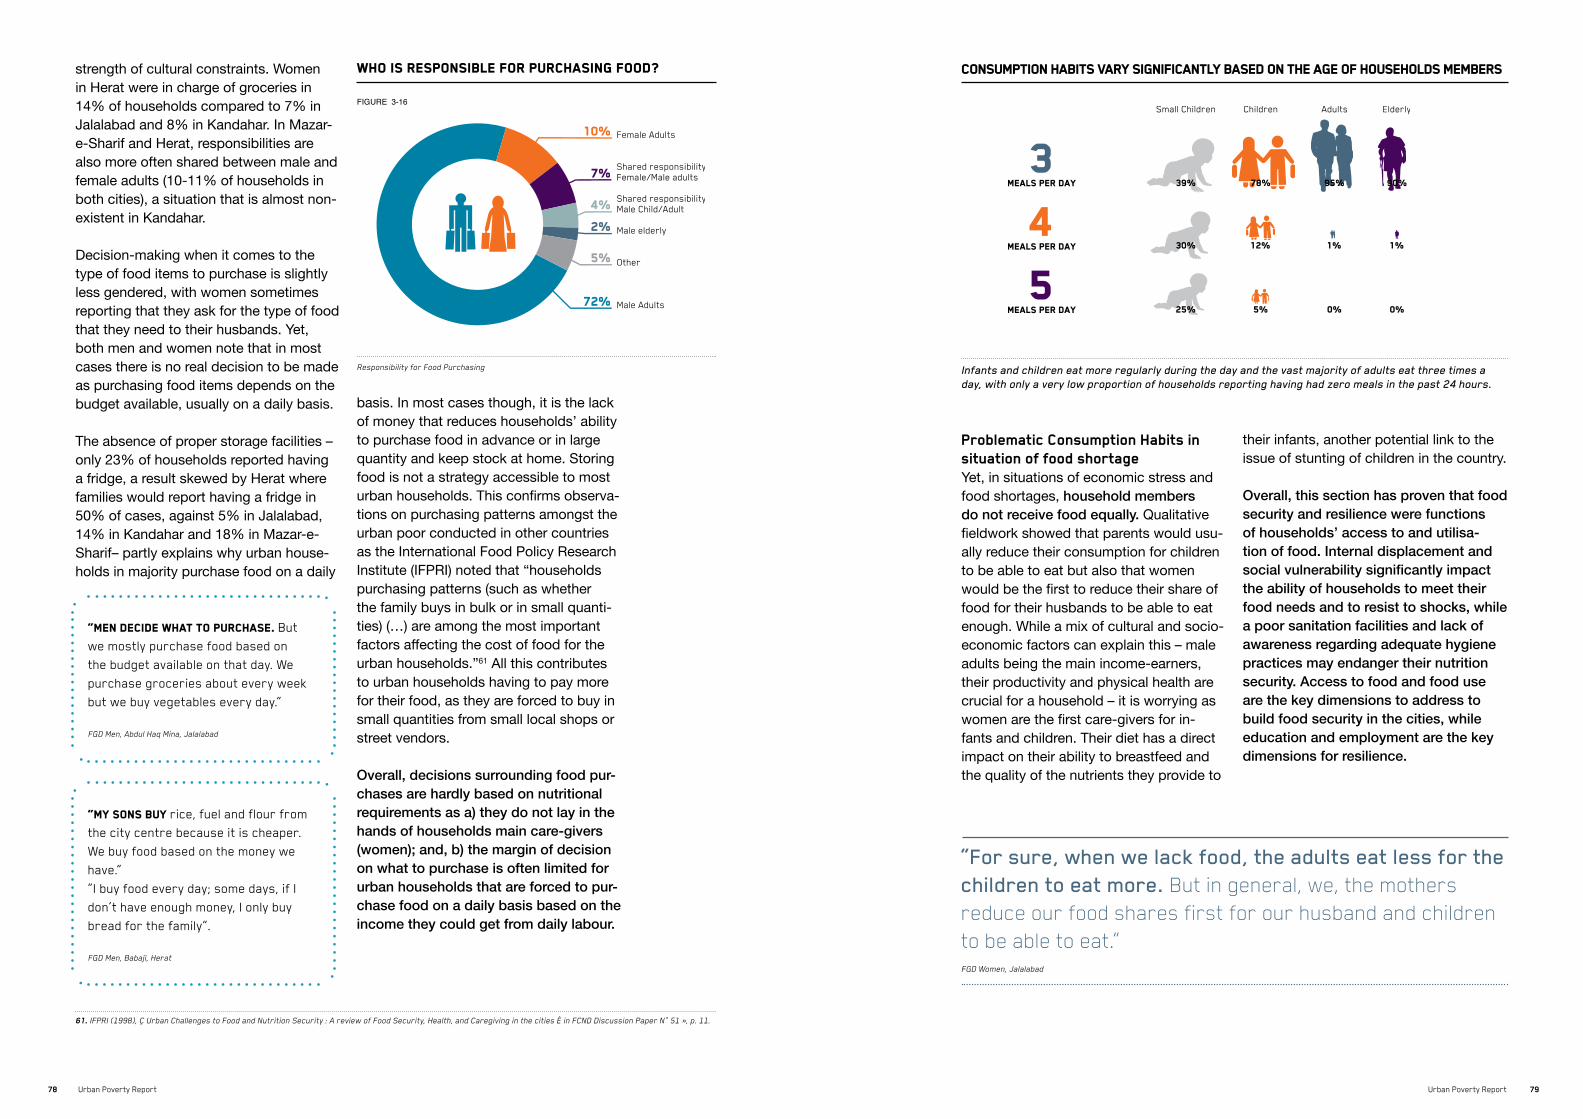
Infants and children eat more regularly during the day and the vast majority of adults eat three times a day, with only a very low proportion of households reporting having had zero meals in the past 24 hours.
Consumption habits vary significantly based on the age of households members
Responsibility for Food Purchasing
Who is responsible for purchasing food?
FIGURe 3-16
“men decide what to purchase. But
we mostly purchase food based on
the budget available on that day. We
purchase groceries about every week
but we buy vegetables every day.”
FGD Men, Abdul Haq Mina, Jalalabad
“my sons buy rice, fuel and flour from
the city centre because it is cheaper.
We buy food based on the money we
have.”
“I buy food every day; some days, if I
don’t have enough money, I only buy
bread for the family”.
FGD Men, Babaji, Herat
78 Urban poverty Report Urban poverty Report 79
strength of cultural constraints. Women in Herat were in charge of groceries in 14% of households compared to 7% in Jalalabad and 8% in Kandahar. In Mazar-e-Sharif and Herat, responsibilities are also more often shared between male and female adults (10-11% of households in both cities), a situation that is almost non-existent in Kandahar.
Decision-making when it comes to the type of food items to purchase is slightly less gendered, with women sometimes reporting that they ask for the type of food that they need to their husbands. Yet, both men and women note that in most cases there is no real decision to be made as purchasing food items depends on the budget available, usually on a daily basis.
The absence of proper storage facilities – only 23% of households reported having a fridge, a result skewed by Herat where families would report having a fridge in 50% of cases, against 5% in Jalalabad, 14% in Kandahar and 18% in Mazar-e-Sharif– partly explains why urban house-holds in majority purchase food on a daily
basis. In most cases though, it is the lack of money that reduces households’ ability to purchase food in advance or in large quantity and keep stock at home. Storing food is not a strategy accessible to most urban households. This confirms observa-tions on purchasing patterns amongst the urban poor conducted in other countries as the International Food Policy Research Institute (IFPRI) noted that “households purchasing patterns (such as whether the family buys in bulk or in small quanti-ties) (…) are among the most important factors affecting the cost of food for the urban households.”61 All this contributes to urban households having to pay more for their food, as they are forced to buy in small quantities from small local shops or street vendors.
Overall, decisions surrounding food pur-chases are hardly based on nutritional requirements as a) they do not lay in the hands of households main care-givers (women); and, b) the margin of decision on what to purchase is often limited for urban households that are forced to pur-chase food on a daily basis based on the income they could get from daily labour.
“For sure, when we lack food, the adults eat less for the children to eat more. But in general, we, the mothers reduce our food shares first for our husband and children to be able to eat.” FGD Women, Jalalabad
Problematic Consumption Habits in situation of food shortage Yet, in situations of economic stress and food shortages, household members do not receive food equally. Qualitative fieldwork showed that parents would usu-ally reduce their consumption for children to be able to eat but also that women would be the first to reduce their share of food for their husbands to be able to eat enough. While a mix of cultural and socio-economic factors can explain this – male adults being the main income-earners, their productivity and physical health are crucial for a household – it is worrying as women are the first care-givers for in-fants and children. Their diet has a direct impact on their ability to breastfeed and the quality of the nutrients they provide to
their infants, another potential link to the issue of stunting of children in the country.
Overall, this section has proven that food security and resilience were functions of households’ access to and utilisa-tion of food. Internal displacement and social vulnerability significantly impact the ability of households to meet their food needs and to resist to shocks, while a poor sanitation facilities and lack of awareness regarding adequate hygiene practices may endanger their nutrition security. Access to food and food use are the key dimensions to address to build food security in the cities, while education and employment are the key dimensions for resilience.
61. IFPRI (1998), Ç Urban Challenges to Food and Nutrition Security : A review of Food Security, Health, and Caregiving in the cities È in FCND Discussion Paper N° 51 », p. 11.

Pic. 4.1: Shopkeeper shows his notebook
where he keeps track of all the credits
of the community members – Kabul
“It is very common for me to give credit to the people of the community. All the credits I gave are written down here. But I give credit to the persons I know only. I don’t give credit to the returnees from Iran and Pakistan be-cause I only want to give credit to the families I really know.”
Shopkeeper, Kabul
4RESISTING
SHoCKS: URBAN MECHANISMS OF RESILIENCE
> Urban households struggle to adjust to the current eco-nomic drawdown
> At the household level, very little coping mechanisms are available for urban house-holds, who mostly rely on negative strategies reducing
their food quality and quantity. Yet, existing safety nets at the community level – infor-mal credit and charity – of-fer some protection to urban households, a protection that is lacking for recently-dis-placed IDp households.
80 Urban poverty Report Urban poverty Report 81
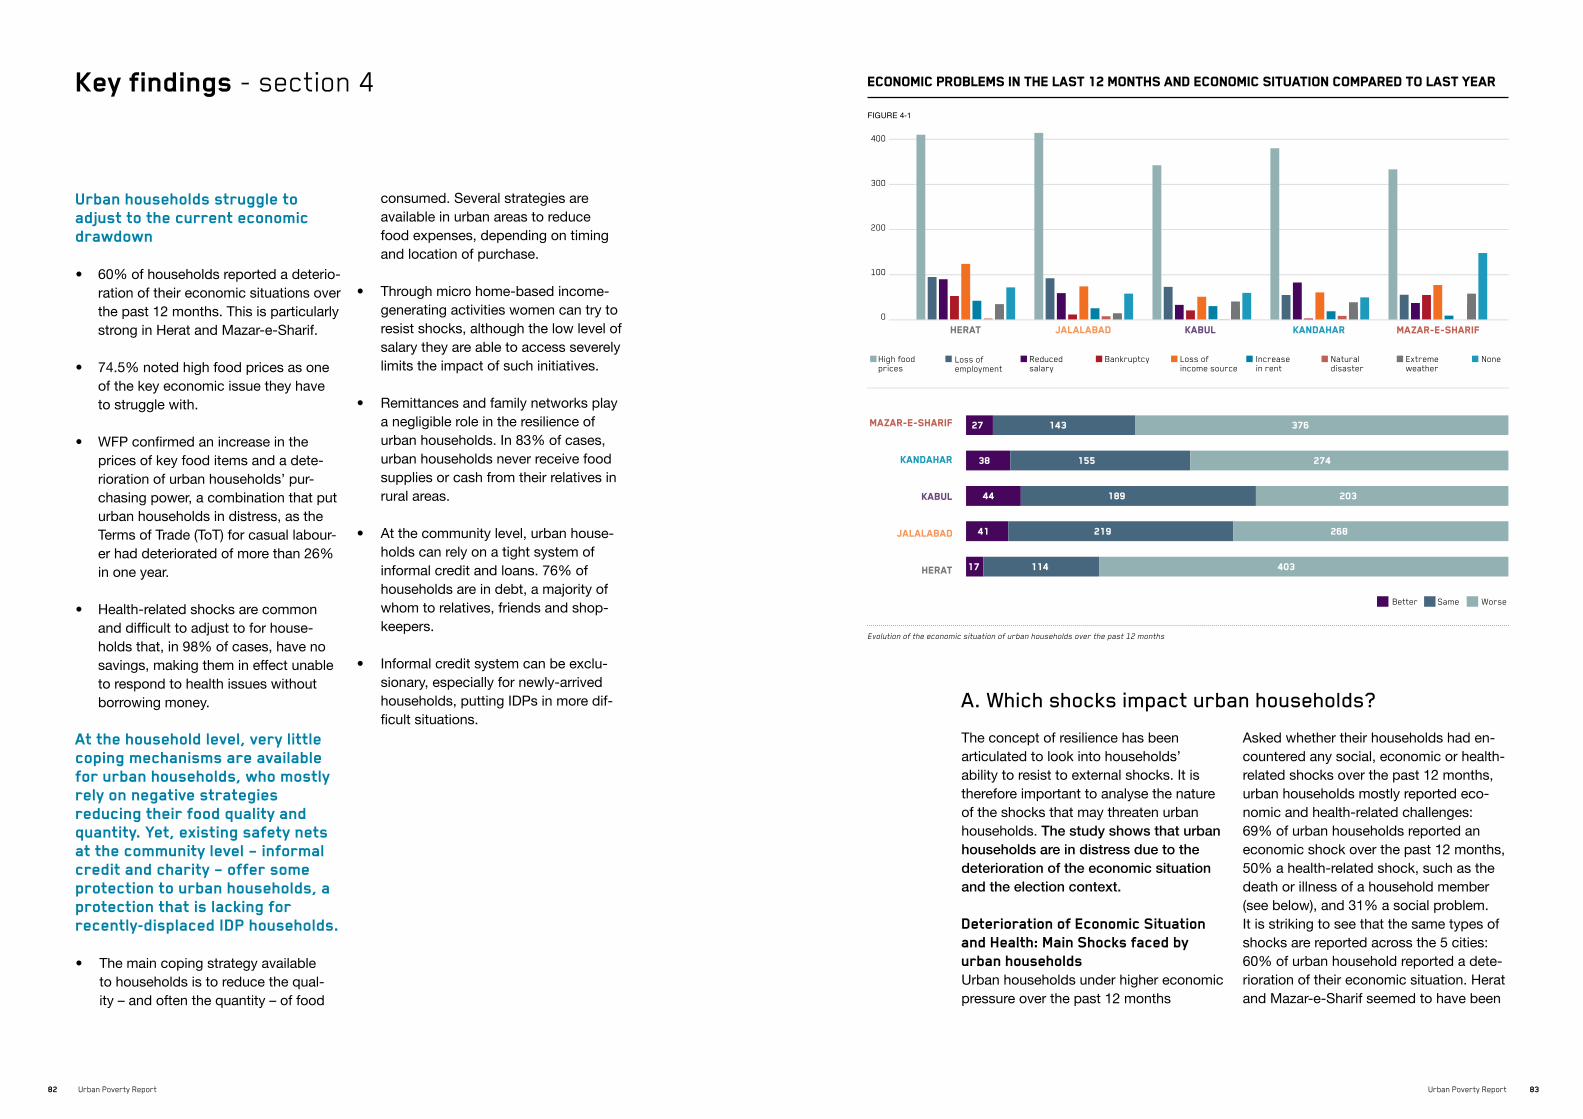
eConomIC ProbLemS In tHe LaSt 12 montHS and eConomIC SItUatIon ComPareD to LaSt year
FIGURe 4-1
Evolution of the economic situation of urban households over the past 12 months
82 Urban poverty Report Urban poverty Report 83
Key findings - section 4
A. Which shocks impact urban households?
The concept of resilience has been articulated to look into households’ ability to resist to external shocks. It is therefore important to analyse the nature of the shocks that may threaten urban households. The study shows that urban households are in distress due to the deterioration of the economic situation and the election context.
Deterioration of Economic Situation and Health: Main Shocks faced by urban households Urban households under higher economic pressure over the past 12 months
Asked whether their households had en-countered any social, economic or health-related shocks over the past 12 months, urban households mostly reported eco-nomic and health-related challenges: 69% of urban households reported an economic shock over the past 12 months, 50% a health-related shock, such as the death or illness of a household member (see below), and 31% a social problem. It is striking to see that the same types of shocks are reported across the 5 cities: 60% of urban household reported a dete-rioration of their economic situation. Herat and Mazar-e-Sharif seemed to have been
Urban households struggle to adjust to the current economic drawdown
• 60% of households reported a deterio-ration of their economic situations over the past 12 months. This is particularly strong in Herat and Mazar-e-Sharif.
• 74.5% noted high food prices as one of the key economic issue they have to struggle with.
• WFP confirmed an increase in the prices of key food items and a dete-rioration of urban households’ pur-chasing power, a combination that put urban households in distress, as the Terms of Trade (ToT) for casual labour-er had deteriorated of more than 26% in one year.
• Health-related shocks are common and difficult to adjust to for house-holds that, in 98% of cases, have no savings, making them in effect unable to respond to health issues without borrowing money.
At the household level, very little coping mechanisms are available for urban households, who mostly rely on negative strategies reducing their food quality and quantity. Yet, existing safety nets at the community level – informal credit and charity – offer some protection to urban households, a protection that is lacking for recently-displaced IDP households.
• The main coping strategy available to households is to reduce the qual-ity – and often the quantity – of food
consumed. Several strategies are available in urban areas to reduce food expenses, depending on timing and location of purchase.
• Through micro home-based income-generating activities women can try to resist shocks, although the low level of salary they are able to access severely limits the impact of such initiatives.
• Remittances and family networks play a negligible role in the resilience of urban households. In 83% of cases, urban households never receive food supplies or cash from their relatives in rural areas.
• At the community level, urban house-holds can rely on a tight system of informal credit and loans. 76% of households are in debt, a majority of whom to relatives, friends and shop-keepers.
• Informal credit system can be exclu-sionary, especially for newly-arrived households, putting IDPs in more dif-ficult situations.

vam - aFGHanIStan marKet PrICe bULLetIn JUne 2014 - HIGHLIGHtS63
• Current average wheat price in main cities of Afghanistan is significantly higher than
the same time last year (June 2013): +19.2%
• Current average wheat price significantly higher than the last 5-year average price of
the same months: + 37%
• Average retail price of wheat flour has slightly increased compared to the same month
last year: + 6.4%
• Retail price of rice (low quality) has slightly decreased compared to the same time last
year: - 5.5%
• Retail price of rice has significantly increased compared to the last 5-year average
price of the same months: + 22.9%
• Considering the terms of trade (tot) – a proxy indicator of the purchasing capacity of
households relying on casual labour and wheat prices on the market – the tot signifi-
cantly deteriorated due to an increase in the wheat price and a decrease in average
labour wage: -26.3%
Kind of health problems in the past 12 months by city
FIGURe 4-2
Health Problems over the past 12 months.
84 Urban poverty Report Urban poverty Report 85
hit particularly strongly by the economic slow down with respectively 75% and 69% of households reporting a deteriora-tion of their economic situation over the past 12 months.
Looking at the nature of the economic shocks faced by urban households shows that they suffered from the conjunction of an increase in food prices and a decrease in access to labour and labour wage. High food prices were reported by 74.5% of urban households as the key economic challenge they faced over the past 12 months. The market price bulletin es-tablished by the World Food Programme based on their monitoring system of food prices allows us to compare the percep-tion of urban households about food prices against the actual fluctuations of the market62:
Looking at the evolution of prices of key food items for urban households confirms that the high food prices they reported is based on actual rise on the market, or,more accurately, on a real deterioration of the purchasing power of urban house-holds, directly impacting their vulnerability and food security.
Significantly, the three other economic shocks reported frequently by urban households were: a) loss of income source (15%); b) loss of employment (14.7%); and, c) reduced income (11.9%), confirm-ing the tense labour conditions in Afghan major cities. The conjunction of difficult conditions on urban labour markets and increase in food prices explains the high level of anxiety of the urban poor.
This confirms that accessing food is one of the key challenges and preoccupa-tions of urban households. Worryingly, several indicators point to a deterioration of the situation of urban households on that matter. This deterioration may be explained by the conjunction of an eco-nomic slowdown in key urban sectors and the impact of the elections.
Health-related issues: a recurring risk for urban households Contrarily to situations of economic stress, which are highly dependent on macro-economic dynamics, health-related shocks are a recurring challenge for urban and rural households alike.
62. WFP VAM (2014), Initial Market Price Bulletin for the Month of June 2014 (Reported in July 2014). http://documents.wfp.org/stellent/groups/public/documents/ena/
wfp267063.pdf. Comparison is based on the Market price bulletin for the month of June 2014 – allowing for comparisons with June 2013, which corresponds to the recall
period in the household survey. 63. Ibid.
Health problems may turn crippling for urban households for various reasons:
• For the costs in medical treatment they may incur. Even with access to public health facilities, the cost of medication is often too high for urban households to follow the treatment prescribed by doctors. For serious illnesses, many urban households will prefer travelling abroad to get treat-ment, in particular to Pakistan or India, increasing the overall costs of treat-ment for households.
• Death and funerals also incur relatively high costs for families.
• The serious illness or death of any productive member of the households can rapidly put households in dire sit-uations, as detailed above in the case of widows. In a context where most households only rely on one source of
income, the immobilization or loss of an income-earner can turn dramatic.
In the absence of strong social protec-tion mechanisms, health-related events are amongst the most problematic for urban populations as they can rapidly put urban households on the edge. As noted above, urban households often do not earn enough money to prepare for unforeseen circumstances, something visible in the absence of food stocks and particularly striking when considering that 98% of urban households do not have any savings. Even taking into account a possible under-reporting of savings, this finding highlights the blatant lack of safety net at the household level and the inability to face shocks, an important dimension of households’ resilience.
B. How do the urban poor resist economic and social shocks? The findings of this study point to a gen-eral level of poverty within the five major Afghan cities and show urban households that are easily on the edge of severe food insecurity in a general context of deterioration of urban economies. In the absence of savings, any shock may prove
dramatic. In this context, it is important to understand how urban households react to shocks, survive and the extent to which strategies at the community and household levels increase their level of resilience.

maIn CoPInG StrateGIeS aDoPteD In tHe LaSt 12 montHS by CIty
FIGURe 4-3
Main Coping Strategies (by city)
86 Urban poverty Report Urban poverty Report 87
Few Coping Mechanisms available at the household Level As illustrated by the reduced coping strat-egy index detailed above, urban house-holds regularly have to rely on various coping strategies to adapt to the econom-ic hardship many of them are struggling with.
The first conclusion to draw from the review of coping strategies that urban households rely on is the fact that most of them are negative either because they
are likely to have a detrimental impact on households’ food intake or because they prioritise short-term subsistence over long-term resilience of the households. Positive coping strategies such as set-ting up an income-generating activity or looking for additional jobs were extremely marginal. These positive strategies are be-yond the capacities of most urban house-holds in situation of economic distress, as they require either capital or additional man force, both elements generally lack-ing for urban households.
Lowering the quality and quantity of food consumed Across the board, lowering the quality of the food consumed by the household is a very common strategy, albeit with large differences between cities. Households living in Mazar-e-Sharif and Herat were particularly likely to have relied on this coping strategy over the past 12 months (see figure 4.14). This confirms previous observations showing that in the current context Mazar-e-Sharif and Herat do not fare well, despite their previous economic dynamism.
Lowering quality of food takes two main forms: a) reducing the diversity of food items consumed by the household, some-times to a very drastic diet made of bread and tea; b) reducing the quality of food items purchased to limit expenses. Big cities like the ones on review here offer various tricks for households to purchase less quality food items. Qualitative field-work allows us to give a more precise
picture of what these coping strategies entail in practice:
• Meat, oil and sugar are the first food items to be sacrificed in times of hardship because they are expensive. Fruits are generally rarely consumed because of their price but their con-sumption would also reduce.
• Urban markets offer a variety of op-portunities to buy food for various prices. Changing the timing and loca-tion to purchase food allows house-holds to save some money, often to the detriment of quality. For example, buying vegetables in the evening instead of in the morning allows for households to get vegetables cheaper. Yet, this often means getting damaged or rotten vegetables. Buying old bread is also an option when nothing is left.
The following case study shows an exam-ple of the strategies surrounding food for deprived households:
CaSe StUDy – elderly head of household, Darbi Iraq, Herat
Abdul Rafoor is 73 years old and has a family composed of 5 people: himself, the head of household, his wife, their 2 daughters and the child of one of his daughters. the husband of his daughter is ad-dicted and has disappeared. For a year, his daughter was alone with her kid and he decided to take them back in his house. the child is 4 or 5 years old. His daughters are respectively 25 and 17 years old. the younger one is not married yet. they all live together. Abdul Rafoor is from Darbi Iraq. He was born in this neighbourhood. He only went to Iran for 6 or 7 months for work but never moved there full time with his family. the main issue for the family is that at this stage no one is able to work to earn money. Abdul Rafoor is the only man in the family and
he is too old to work. He cannot stand properly and has pain in his legs. Health issues have prevented him from working for the past 9 years. Before that, he used to own a bakery in the city centre and to work there. He saved some money, which he is now using to pay for the family’s daily needs. Unfortunately, Abdul Rafoor is coming to the end of his savings and this year, for the first time, he had to accept the bag of flour that someone gave him. the girls do no work, they did not go to school ei-ther. they are not literate and can barely write their own names. the girls help out during the pistachio season, when they help cracking the pistachios. the family shares a small house with another household. they bought a plot of land in the neigh-bourhood a long time ago. Six years ago, they had to sell half of the plot to another family to get
cash for the daily expenses of the family. the entire family lives of this money right now. And this is coming to an end. the family’s usual meal is com-posed of low quality white rice, sometimes accompanied by pota-toes. once a week, the family eats meat. there are vegetables on the table about twice a week, usually squash or okra. the family never had to skip meals because of a lack of money but, when there is no money left, they resort to buying cracked old bread from the bazaar as it is very cheap. the family’s future is uncertain: there is no one, no relatives to help them. the husband of the first daughter proved more of a burden than a support and the second daughter is not married yet. Abdul Rafoor is not sure if he will be able to provide for his family for much longer.

How often do you receive food from relatives in rural areas?
FIGURe 4-4
Transfers from Rural Areas
88 Urban poverty Report Urban poverty Report 89
Micro home-based initiatives In spite of the fact that very few house-holds reported setting up a new activity to cope with lack of income and/or short-ages, qualitative fieldwork showed that women would sometimes try and partici-pate through micro income-generating ac-tivities. As they require initial skills, these activities are not accessible to all women but confirm that women can participate in economic activities more easily when these are home-based, hence compatible with conservative cultural norms. Here are some of the examples mentioned by female respondents:
• “In the winter, when we earn less mon-ey, we suffer a lot. I often try to get involved in sewing blankets at home in order for us to earn some money.” Kacha Gray, Jalalabad
• “The poor women or women in poor families sometimes clean and spin the wool at home. But the earnings are not good; women only earn 20 to 30 AFS per day and it is not enough even to buy bread” Hindu Suzan, Herat
• “In situation of food shortage, I try my besttofindsomehome-basedjobs,like tailoring for example, for us to earn some money.” Chahar Rahi Maras-toon, Jalalabad
As mentioned briefly above, women’s participation in economic activities is often born out dire necessity, something confirmed by these examples. This clearly puts them in very disadvantageous bar-gaining situations, partially explaining the extremely low incomes they are able to secure through these activities. The fact that female employment is often negative-ly perceived and women’s inexperience of the labour market may also explain the poor terms of labour they are able to secure.
Positive coping strategies – or the lack thereof Relying on migration for livelihood? Mobility has always been one of the cop-
ing mechanisms of Afghan households, when facing hardship. It is important to assess the impact of urbanisation and insecurity on this traditional strategy. The quantitative survey suggests that internal and external work migration are limited and province-specific, at least for urban households. Labour migration with Iran is still an important dynamic in the Western region of the country, despite the increas-ingly tough position of the Iranian state on Afghan migrants. Yet, only a marginal pro-portion of households in Herat reported resorting to this over the past 12 months, suggesting that urbanisation may be trumping international labour migration. In Jalalabad on the other hand, households noted that migration for livelihood within Afghanistan was still a strategy for 8% of households.
These figures suggest that mobility is decreasing with urbanization, although a certain under-estimation is likely, especial-ly when the migration is linked to ‘illegal activities’, such as poppy cultivation or crossing illegally the border. The qualita-tive fieldwork showed that some of these movements, perhaps not considered as ‘migration’ by households, are still in place. Male members of households from Kabul would often go to Jalalabad during the winter for labour. In Herat and Kanda-har, the season of poppy harvest triggers important movements:
“Families are settled now but there
are still important movements for
people to find labour. Male members
of households still go regularly to Iran.
Some never come back. Male members
of families would also go to Farah or
Helmand during the poppy harvest sea-
son, in May and June. there are also
some movements during the wheat
harvest and men go to the country side
to get daily labour.”
Community Leader, Herat
Relying on remittances and family net-works for livelihood? Only a tiny fraction of urban households reported internation-al remittances as one of their sources of cash, confirming the very low proportion found by the 2011-12 NRVA (3%). Sev-eral factors may explain the low level of remittances such as the increasing hard-ship faced by Afghan workers in Iran and the global economic crisis. In any case, international remittances do not seem to be a reliable and stable resilience factor for urban households. The survey also aimed at measuring the resilience of urban-rural networks upon migration and displacement to assess whether urban households could count on their links with relatives and commu-nities in their place of origin as an addi-tional source of cash or in-kind products. If that was the case, urban households could then compensate the lack of self-production as a complementary source of food. Yet, the survey shows that urban households can only very rarely rely on their place of origin and networks with rural areas for subsistence. In 83% of cases, households never received any food supply from their relatives living in rural areas. This mechanism was only observed in Kandahar, which stood out on that matter as 22.6% of households there reported receiving often to regularly food supplies from rural areas, far above the proportion in other cities.
Overall, this shows that urban households,
regardless of their migratory profiles, can only rarely rely on extra-urban networks – whether international or with rural areas – to complement their income and sup-port their access to food. Whether forced or not, displacement to the city does not provide households with the safety net that an access to additional sources of food would represent, except in Kandahar where the integration between rural and urban areas is more solid.
Safety Nets at the Community Level
Tight system of informal credit and loans The second most common coping strat-egy is to purchase food on credit from local shopkeepers and/or to get a loan from relatives. Only 30% of households reported having taken out credit from their local shops over the past 12 months, but qualitative fieldwork confirms how per-vasive the system of local credit is in the city.
Based on this system, households are able to access food even when they are out of cash and to repay shopkeepers whenever they get money back. This happens especially during the winter, the most difficult season. Shopkeepers would usually wait until the spring (around Naw-ruz) to be paid back, adjusting to the sea-sonality of urban income and illustrating the endogenous capacities of communi-ties to respond to urban poverty.

Is your household in debt?
FIGURe 4-5
Level of Debt
90 Urban poverty Report Urban poverty Report 91
It is important to note that this system of credit is based on trust and does not come with any system of interest. Usually, credit is taken on small quantities of food items until the households’ main income-earners receive their salary. As such, it provides a rather efficient safety net against dire situations of food shortage as it comes with no additional cost and no administrative delay.
“It is very common for me to give
credit to the people of the community.
All the credits I gave are written down
here. But I give credit to the persons
I know only. I don’t give credit to the
returnees from Iran and pakistan be-
cause I only want to give credit to the
families I really know.”
Shopkeeper, Kabul
Taking loan from relatives and members of the community is also extremely frequent. AREU 2006 study of urban livelihoods already pointed at informal credit as a key coping strategy for urban households. Years later, the informal system of credit remains a determinant feature of urban life64, as illustrated by the very high pro-portion of households in debt found by the survey.
Friends, relatives and shopkeepers rep-resent the bulk of the creditors in every city. Only in Mazar-e-Sharif and Kabul, a small proportions of households bor-rowed money from the bank or even from a micro-finance institution in the case of Mazar-e-Sharif.Shopkeeper
This confirms the strength of the infor-mal credit system in the city as the first and often sole safety net accessible to the urban poor. Because it links most members of the community and it is not
based on interest, it represents a strong resilience mechanism for households in situation of crisis. Yet the fact that infor-mal loan and credits are generally relied on for households’ consumption means that very little of these loans are used for longer term investments that could in-crease the resilience of urban households. Living on credit, households are not able to make any savings as all surplus of income is used to repay debts. The 2006 AREU study came to the same conclusion eight years ago, suggesting that almost a decade of international investment in the country has hardly altered the forms of urban poverty on the ground, nor it has weakened traditional resilience mecha-nisms at the community level.
Yet, as illustrated by the quote, the system of informal credit is not without flaws, in particular as it comes with its own exclusion mechanisms. Because it relies on trust and community control, new-comers and people from different communities are less likely to be granted credit, leaving these groups with very few subsistence mechanisms to rely on in period of food shortages. The IDPs – es-pecially the most recently displaced – are particularly at risk to be in this situation:
“In the previous area we lived in, in
Ghor province, we had enough water and
food. Most of us had jobs. We used to
consume the products of our animals. But
now we do not have anything. No one has
helped us. All of us have to borrow money
but it is very difficult for us to borrow
money because no one knows us in Herat.”
FGD IDP Men, Herat
Despite these difficulties, the lack of net-work that characterises IDP households upon arrival seems to be compensated by the number of shopkeepers and poten-tial sources of credit accessible in the city and IDPs reported having relied on credit and loan in the same proportions than other migratory groups over the past 12 months. This absence of significant difference suggests that IDP households are able to establish and activate these informal networks relatively rapidly upon their arrival. Yet, the situation of recently arrived IDPs in Herat suggests that there is a gap – a critical moment – between IDPs’ establishment in a neighbourhood and the moment they will be able to rely on local networks, probably the window of most blatant vulnerability for displaced households moving to the city.
Community Charity: a resilient institu-tion for the poorest of the poor? Beyond the system of informal loan sup-porting poor communities, charity also plays its role to assist households in dire situation, usually on an ad-hoc basis. Both community-based and faith-based mech-anisms of charity exist at the community level, at least in theory. Islam requires eve-ry wealthy Muslim to pay the zakat, a 10% tax on their property, to be used as charity for the community. The second, called khairat, refers to the any “form of charity in the form of cash, food, fruits, second-hand clothes, cooked dish, shared by the richer members of the community with the
less fortunate” as defined by the interest-ing mapping of social protection mecha-nisms conducted by War Child UK and the DoLSA in Herat65. In its mapping, War Child concludes that both modes of char-ity are declining rapidly in urban areas, as a result of a dissolution of traditional structures and an urban way of life, where households are less closely-knit to each other than in rural communities. Yet, the findings of the present study would nuance this conclusion, as field observations showed that community-based charity was still active, at least for the most ‘visibly’ destitute families, such as female-headed households and house-holds with disabled members. While the zakat is not institutionalised through a regular system of collection, as is the case in some other Muslim countries66, the richest members of the community are still expected to distribute for the most vulnera-ble. Two main forms seem of charity are still present, even if fading away, in urban areas:
• Ad hoc support to the families in criti-cal situations, especially widows upon the death of their husband. This would usually be constituted of in-kind or small cash-based donations directly to the family in need.
• Yearly donations to the community: usually taking place once a year, around the month of Ramazan, and made of in-kind distribution of food (rice, bread etc) to the poorer house-holds of the community.
Still, these forms of community protec-tion have the tendency to fade away with the dissolution of communal structures in the city and the high levels of hardship that most urban households experience themselves. The dissolution of traditional forms of safety nets is a huge risk for the resilience of the urban poor, who, in the absence of a solid system of social protection established by the state, have very few strategies to engage in to avoid starvation.
64. SchŸtte, A (2006), Searching for Security : Urban livelihoods in Kabul. Case Study Series, p. 46. 65. DOLSA-War Child, Social Protection Mechanisms in Herat, Afghanistan : A mapping report. p. 11. 66. Pakistan has developed a state-based system of redistribution of
zakat for example.

5ConCLUSIon PROGRAMMING FOR THE URBAN POORLooking at urban poverty in the main Afghan cities in 2014 shows alarmingly high levels of poverty and food insecurity and low levels of resilience amongst urban population
across the board. the urban poor are the first impacted by the economic slowdown and the political turmoil linked to the presidential elections and are now in distress.
92 Urban poverty Report Urban poverty Report 93
Who are the urban poor? Poverty and food insecurity characterise a majority of urban households in all five cities surveyed by this study. Kabul was the only city that fared consistently slightly better than the four others, although it is characterised by considerable hardship. Urban populations show little socio-eco-nomic stratification, with an overwhelming majority of poor households and still a very thin urban middle class. Amongst the poor, some sub-groups do stand out as particularly vulnerable though:
• IDP households, especially if they were displaced recently, are at a particular disadvantage compared to other migration groups. While return-ees can benefit from social networks and assistance upon return, and economic migrants are often able to prepare for their migration in advance, IDPs are swept away from their place of origin by conflict and natural-dis-aster. Adjustment to life in the city is particularly steep.
• Statistical evidence proves the im-pact of specific social vulnerabilities on food security and poverty. The absence of male income-earners, the presence of addicted member(s) of household and the reliance on a single source of income, usually a daily labourer, put urban households at great risk and significantly lower their resilience.
• Inhabitants of the KIS show lower levels of resilience, mostly due to their lower of access to basic services.
What are the determinants of food security? Accessing food is the main challenge that urban households face on a daily basis. Food security in the city is a question of income and access to stable employment. Addiction, female-headed households, and low levels of education are also key determinants of food insecurity. In cities
with dynamic markets all types of food are available and the impact of seasonality on food availability is limited. Poor and unreli-able income often necessitates reducing the quantity of food in the household on a regular basis. More importantly, it means sacrificing food diversity, as many food items become unaffordable. It also causes high levels of anxiety as the income each day will determine both the nature and amount of food the household will con-sume. . Poor sanitation facilities and low awareness about basic hygiene practices mean that food is often unsafe, raising the risk of diarrheal disease and poor nutritional status, especially for under-five children. Poor breastfeeding practices fur-ther increase the problem with infants who lack nutrients and often face long-term consequences on their development.
How resilient are the urban poor? A decade of international assistance and state reconstruction have done little to build the resilience of urban households, who still fare very poorly on some of the key dimensions of resilience: literacy, education and qualified employment. The adaptive capacities of urban households are further limited by their inability to save money and the necessity to rely on informal credit, as the only safety net ac-cessible to them. The loss of households’ productive abilities upon their arrival in the city – evidenced by very little livestock or agricultural production in the cities – fur-ther reduces households’ ability to adapt to income shocks or to diversify their food intake. Family networks are not strong enough to support households’ resilience as remittances in cash from abroad or in-kind from rural areas are residual. Bet-ter access to basic services in the cities is way that urban households can build resilience in the long-term.

94 Urban poverty Report Urban poverty Report 95
Gaps in existing Urban programming The humanitarian and development in-tervention in Afghanistan has long been ‘rural-centred’, based on the demographic profile of the country and the dire needs for basic services and humanitarian as-sistance in remote areas. The urbanisation trend and all the challenges it entails – especially in terms of poverty and resil-ience – still have to attract the attention of donors and international actors to support national institutions that lack the financial and technical capacities to respond ad-equately to these challenges. This section will look at the existing programmes in the cities and the main gaps of these interven-tions in order to shape the recommenda-tion section.
Main streams of programming in urban areas
Three main types of programming co-exist in the cities: a) large-scale programmes of infrastructures supported by a few key donors; b) emergency assistance for internally displaced people; c) small-scale projects run by non-governmental organi-sations – national and international – fo-cusing on specific target groups within the city.
Support to urban infrastructures Urban areas have attracted large-scale infrastructure programmes supported by a few key donors, such as the Japanese International Cooperation Agency (JICA), the German Cooperation agency (GiZ), the World Bank and USAID. Focusing on key urban infrastructures, such as road pavement, water supply or municipal planning, these programmes have allowed for a real improvement in the life of urban residents over the past decade. Pumping in important sum of money – USAID Kabul City Initiative alone had a budget of $120 million – these programmes have focused on the main cities of the country first, with
Kabul, Herat or Mazar-e-Sharif or Kanda-har attracting important funding.
These progammes were usually coupled with huge investment in capacity-building for municipal authorities and staff of key line departments, the Independent Direc-torate for Local Governance (IDLG) and the Ministry for Urban Development Affairs (MUDA). Capacity-building was designed to cover both procurement, planning and monitoring on the one hand and the re-quired technical capacities for urban plan-ning on the other: GIS, technical surveys etc.
Two different approaches can be identified in the direct interventions of donors on urban development:
• A top-down and technical approach – with sometimes over-ambitious programmes on the one hand;
• An increasing component of com-munity-based programming focusing on community participation and with greater chances to be sustainable.
JICA’s Project for the Promotion of Kabul Metropolitan Area Development illustrates the first of these approaches, as the agen-cy brought in important technical exper-tise and support to Kabul Municipality for the development of a ‘Greater Kabul’ that would include a ‘New City’ in the close district of Deh Sabz. JICA also prepared a master plan for the New City and a new Masterplan for the existing Kabul. This enormous project was broken down in three phases, focusing for the first phase on an initial development area close to the city before extending further. Yet, the development of the New City is on hold due to the numerous land conflicts sur-rounding the development of Deh Sabz. The project encountered a high level of resistance from local communities to a point where the situation turned violent. JICA is also suspicious about the trans-parency and capacity of the Deh Sabz New City Development Authority (DCDA)
they set up to overview the project in the district. The project is halted until the land conflicts are solved, security is deemed satisfying and the DCDA has secured additional funding to pay for the huge infrastructure projects. Another example is the World Bank-funded Kabul Urban Reconstruction Programme for a total of $31 million between 2005 and 2008 but extended several times until completion of some components of the programme, which focused heavily on the upgrading and development of urban services (water supply, sanitation, solid waste manage-ment…) in Kabul.
On the other hand of the spectrum, UN-HABITAT is implementing another type of urban development programme, also supported by JICA and based on commu-nities’ participation. UN-Habitat supports the establishment of a representative body at the community level, an urban equiva-lent to the CDCs established in rural areas by the National Solidarity Programme of the Ministry of Rural Rehabilitation and Development. These local bodies decide the priorities of the community in terms of development and overview the imple-mentation of projects. In majority, urban communities request the construction of roads for their communities. Whichever the project, communities are asked to contribute for 30-40% of the investment while JICA covers for the rest of the costs. The community is also expected to pro-vide labour and to improve the drainage system and footpaths in their area. The important community contribution means that community members are invested in the success of the project and its sustain-ability.
• Taking into account the fact that ac-cess to basic services is an important dimension of poverty and resilience and that poverty is fuelled by the lack of access to basic services in the informal settlements, these large-scale programmes served an important function to support urban develop-ment.
Emergency Assistance for internally displaced persons Another stream of assistance targeting urban areas provides emergency hu-manitarian assistance to the IDPs living in the informal settlements of the cities. The emergency assistance for newly-displaced is supposed to last for three months maximum but the dire situation of IDPs in some of the informal settlements has called for further assistance to be distributed to IDP households in needs. This assistance distributed in the city is born out of the conclusion that some IDP children and adults still die of cold and hunger in the harsh winter of the cities of the North and West in particular (Kabul, Mazar-e-Sharif and Herat). An important component of the assistance provided includes winter kits to help IDP families survive winters. Still, most of the assis-tance is concentrated in the areas listed by the Task Force in charge of coordinat-ing emergency assistance for IDPs.
Kabul is the city where the assistance efforts have been the most intense for IDPs through the framework of the KIS. SolidaritŽs Internationales, Welt Hunger Hilfe (WHH), Action Contre la Faim (ACF) or Ashiana, have been able to go beyond emergency assistance and to provide education services and vocational train-ing, or to work on WASH projects within the settlements.
Emergency assistance for IDPs in the cit-ies raises increasing questions for organi-sations, donors and national authorities alike. Repeated calls for emergency as-sistance for the winter is now considered with increasing frustration by the donors, who question the relevance of an interven-tion that has to be repeated every year. Assistance to the KIS – also informally called IDP camps – is an extremely heated and politicised question for municipal and national authorities who do not support any type of mid- or long-term interven-tions with these populations.

Winterization is a failure. Donors are not interested. Even the IDPs are fed up. People themselves are asking for durable solutions. KII – HLP Task Force
assistance received by migration status
FIGURe 5-1
Assistance received by migration group
96 Urban poverty Report Urban poverty Report 97
Ad-hoc and targeted interventions for vulnerable groups Even if it remains marginal, at a small and local scale, some NGOs have also started working on urban poverty, usually through ad-hoc interventions designed to target specific sub-groups. Initiatives with street children, households combatting drug addiction and small vocational trainings have been developed. These initiatives are disparate, non-systematic and charac-terised by their small-scale and localised impact but they are often based on a fine ground knowledge of urban populations that can be of use for other actors enter-ing this field of interventions. War Child in Herat is a good example of an organi-sation targeting vulnerable women and children in the city, in an effort to combat poverty in urban areas. Save The Children is also active in urban areas with specific programmes targeting street children.
Interestingly, the WFP has recently started paying more attention to urban areas and developed an unconditional cash and voucher programme for urban areas. The programme will aim at targeting 32,000 households in Herat, Jalalabad, Kabul and Mazar-e-Sharif for a total of approxi-mately 244,000 individuals impacted. The programme is designed like an urban safety net with a cash distribution of 2000 AFA every 3 months for the most vulner-
able families. The main selection criteria include disability, elderly heads of house-holds and female-headed households living in the city. An e-voucher component of this programme has been piloted in Ka-bul to test the feasibility of e-distribution through mobile money in urban areas.
Main Gaps in interventions identified
Urban poverty and food insecurity remain largely unaddressed by national and inter-national actors, as funding and program-ming largely focus on rural issues. Addi-tionally, there are several gaps in current approaches:
• Beyond emergency assistance – a “no man’s land” for IDPs? The case of recently displaced IDPs from Ghor and Badghis in Herat raises a series of questions on the ability of national authorities and their international
partners to address the dire needs of urban caseloads. These IDPs were duly identified and assisted upon their arrival in the city, especially during the difficult winter they had to pass in Herat. Yet, no mechanisms exist for a follow-up on their assistance after the three-month limit of emergency as-sistance and authorities in Herat have failed to support adequately these populations. The present assessment provides more evidence that these populations are particularly at risk but a robust framework to implement durable solutions for IDPs in the cities is slow to emerge.
• Between humanitarian assistance and large-scale development/infrastructure projects – a missing link: This study showed that urban livelihoods re-mained low and instable and that the overall level of resilience of poor urban households has not improved drasti-cally over the past decade, except for improved access to basic services in some parts of major Afghan cities. Initiatives to build resilience remain scarce in the city. The main interven-tions working on livelihoods are small-scale, short-term vocational training, of which impact remains limited given the poor level of skills that beneficiar-ies usually reach, the lack of links to the market and the overall saturated urban labour markets. Although a small number of actors have tried to address issues of food security and households’ resilience in the city, the study showed that building resilience of urban households needs long-term programming on key issues that can bring transformation: education – especially for women – and structural improvement of the business and productive sectors in particular.
Beyond the informal settlements, ad-dressing widespread urban poverty – This study proved that urban poverty is widespread – and increasing – far beyond the limits of the few areas identified by
national and international actors. In par-ticular, households with specific profiles and pockets of poverty are to be found everywhere in the city, and cannot be easily type- cast by convenient indica-tors and descriptors. The urban poor are everywhere in the 5 cities surveyed for this study. Yet most of the assistance is concentrated on a few small settlements: across the 5 cities, 12% of non-residents of the KIS reported having received assistance, compared to 30% for KIS residents.
Challenges with programmingin the city
Programming in the city is not easy and requires a long-term engagement of ac-tors to understand the dynamics they are dealing with. Here are several of the challenges that Afghan cities pose to the successful implementation of projects:
• Opposition and reluctance of mu-nicipal authorities who consider the issue of unregulated urbanisation as a dynamic that can and should be reversed, in spite the wealth of evi-dence showing the contrary. There is therefore an important reluctance – and sometimes an open opposition – to humanitarian assistance being delivered in urban areas, as they as seen as fuelling rural to urban migra-tion and increasing the problem of urban poverty. This is especially the case for recently-displaced IDPs, who are unwelcome in most of the cities surveyed for this study. This translates into a constant battle between human-itarian actors and municipal authorities over the type of projects that can or cannot be implemented, especially in the KIS.
• Targeting outside the pre-identified informal settlements is a difficult exercise as actors lack cohesive community structures on which to rely on for an accurate identification of the most vulnerable. Plus the fact

PIN and DRC’s Programming - Under the LRRD
programme of the eU, pIN and DRC are looking into
developing programmes of urban agriculture, a
type of programming that pIN has already started
to develop with some success in Mazar-e-Sharif.
Urban agriculture can be defined as “the produc-
tion in the home or plots in and around urban and
peri-urban areas. (…) It can include green rooftop
farming, backyard gardens, community gardens,
commercial farms and public institutional gardens
managed by schools and hospitals.”67 this type of
programming is appropriate for areas where land
is scarce as it only requires limited spaces.
Urban agriculture in afghan cities:
> Highly Relevant - the results of this study sup-
port the development of initiatives based on
urban agriculture in the cities. the relevance of
these is proven by a) the low level of resilience
of the urban poor; b) their inability of self-pro-
duce when moving to the city; c) the high levels
of inactivity of women in urban areas.
> Higher Interest amongst women - the inter-
est for urban agriculture is much higher in
Jalalabad, Kandahar and Mazar-e-Sharif than in
Kabul and Herat. this can be linked to the higher
proportions of households owning livestock in
these cities and, in the case of Kandahar, with
the stronger networks between rural areas and
the city. overall, this suggests that Herat and
Kabul – and to a large degree Mazar-e-Sharif
– may be increasingly turning towards urban
lifestyles that are seen as incompatible with ag-
ricultural activities. Yet, interestingly, the survey
found a higher level of interest amongst female
respondents, of whom 52% noted that they
would be interested in such training, compared
to 44% for their male counterparts. Further-
more, experience shows that most respondents
request training in sewing or tailoring, despite
the market saturation around these activities.
> Support of national authorities – overall,
governmental and municipal actors interviewed
for this study showed support and a certain
level of enthusiasm for potential programmes of
urban agriculture, as this type of programming
overlaps with some of the priorities they have
identified for urban development: a) small and
medium enterprises and livelihoods on the one
hand; b) greeneries and environmental concerns
on the other. they all noted the caveat that this
type of initiatives should be developed in close
cooperation with municipal authorities, which
could be of great support to address the ques-
tion of land that may render any initiative of this
kind difficult.
67. Peprah, K. Amoah, S.T., Akongbangre J. (2014) : Ç Sack Farming : Innovation for Land Scarcity Farmers in Kenya and Ghana È in International Journal of Innova-
tives Research and Studies, vol.3, Issue 5, p.31.
HeLp implemented two projects of gardening and
small agriculture in Herat. In Jebrail, HeLp provid-
ed training on how to plant produces. the organi-
sation helped communities finding two big plots
of land to rent and develop. An agreement was
found with landowners to share the production to
cover rent: 25% to the owner, 75% to the produc-
ers. HeLp organised beneficiaries in 2 groups of
30 people per plot, covering in total 60 families.
trainees were trained to work together and the
tool kits at the end were pooled to allow for the
purchase of more expensive equipment. A long-
term approach was adopted to provide counselling
and technical support after the end of the training
and to identify all the technical hurdles that could
endanger the sustainability of the project: irriga-
tion system, provision of seeds, provision and
maintenance of material etc. Agriculture engi-
neers are in charge of following-up with targeted
communities.
the second project puts the emphasis on market
integration and is implemented in Shebeekan.
HeLp established a women training centre, where
women learn food processing and produce yogurt
and butter. HeLp identified potential groups who
could be responsible for transporting products
to Herat to increase the market opportunities of
women’s productions. HeLp also identified ad-
equate selling points in the city where the prod-
ucts could be sold for a good price, increasing the
sustainability of the project. the whole system is
now in place and well-rooted in the community.
BEST PRACTICES: HELP’S PROGRAMME OF URBAN AGRICULTURE IN HERAT
PROGRAMMING FOCUS: DEVELOPING AGRICULTURE IN THE CITY?
98 Urban poverty Report Urban poverty Report 99
that extremely vulnerable households may be found within relatively well-off communities make it difficult for actor to catch households in need. Few indicators allow for a robust targeting strategy as the overall level of poverty and vulnerability is high everywhere in the city.
• Saturated labour markets in the city make it difficult for livelihood interven-tions to succeed in having an impact, at least when they are implemented
based on the current model of short-term (3 or 6 months of training) train-ing and little follow-up on the ability of beneficiaries to enter the labour market.
• Access to land is a heated issue for urban populations, especially in Ka-bul, where informal settlements have developed at a high pace over the past decade. Urbanisation and large movements of land grabbing have contributed to increase the pressure
on land in Afghan major cities. Taking reports of eviction and fear of eviction as a proxy for the land pressure urban households are subjected to shows that Kabul, Kandahar and Jalalabad have higher levels of pressure on land: 19%, 26% and 22% of households re-ported having faced these issues over the past 12 years, as opposed to 14% in Herat and 3% in Mazar-e-Sharif. Programming in these three cities may prove more challenging and requires taking into account access to land
from the early stages of the project design. The issue of land calls for two kinds of approaches: a) considering initiatives that are not land-intensive (ex: sack agriculture); and, b) factoring in programmes’ design and timeline the skills and tine necessary to secure land arrangements.

100 Urban poverty Report Urban poverty Report 101
Recommendations
Addressing Urban Poverty and the Resilience Gap:
FOR ALL ACTORS
> Build the resilience of urban households through a long-term commitment to:
• Access to basic services: Bridge the gap between cities in terms of access to basic services, as they play a key role in building resilience in the long run. Community-based programming, based on community contribution in cash and labour force, is a sustainable way of improving and maintaining basic services in the city and should be further supported. Donors should maintain their focus on infrastructure investments, looking beyond Kabul at the gaps in other cities, and especially at Kandahar, where the situation is considerably worse, especially when it comes to access to electricity.
• Access to education and literacy: this study showed that education is a deter-minant of household resilience. It is also a safeguard against inter-generational transmission of poverty. Yet, access to education is still unevenly distributed across the 5 major cities and by gender: living in the city does not guarantee access to education. Long-term commitment to education project – especially those aimed at increasing girls’ access to high school and higher education – should still be on the top of the agenda.
• Workforce qualification: Vulnerability and food insecurity in the cities are first and foremost a problem of access to stable livelihoods. Structural changes are required for the urban workforce to diversify their skills and step away from casual labour that keeps households in a circle of debt and poverty. Designing long-term programmes of qualification for urban skills – specialising in services and business management in particular – would help reduce the increasing gap between the urban labour supply and demand.
> Recognize an urban geography of poverty by adjusting targeting to the profiles of poverty in the cities:
• At the city level – Kandahar showed high levels of food insecurity and poor ac-cess to basic services further reducing the resilience of households living in that city. Mazar-e-Sharif also fared poorly on a number of food security indicators, suggesting that these two cities may need more attention than cities like Kabul or Herat and Jalalabad, located in areas of high return where a lot of urban interven-tions are concentrated.
• At the community level – the study has shown that IDP households were particularly vulnerable but that poverty and lack of resilience was widespread far beyond the limit of the informal settlements identified by the KIS Task Force, as people other than IDPs and IDPs living outside the KIS are also vulnerable. The geographic scope of interventions should therefore increase beyond the
KIS. Communities with a concentration of IDP households, especially those who have been recently-displaced, should therefore still be targeted as a priority, but programming should also focus on other vulnerable households whether from the host community or with different migratory profiles.
• At the household level – Use fine targeting methodologies: the Resilience Index: the study shows that there was little stratification amongst urban poor. Targeting is highly challenging and should be based on a solid combination of indicators to avoid arbitrary delineation between poor groups. One option is to opt for blanket targeting of hot spots of poverty and food insecurity in urban areas. Another option – especially if resources are limited – is to base targeting on a refined grid of selection criteria. The study points at key variables to identify the most vulnerable households in the city. A simplified resilience index (as detailed below) based on proxy means allows for a robust identification of the poorest. This system can be explained to communities to avoid resentment.
> Address urban households’ difficulties in accessing food by:
• Building on existing female livelihood strategies: This study did observe forms of livelihood accessible to women (albeit in a limited scale). Usually home-based, they include tailoring, sewing, pistachio shelling, cleaning chickpeas, cleaning wool etc. These represent interesting opportunities for women to be economically active. Yet, the study shows that their weak position in the labour market means that they work for extremely low salaries. Organisations could work on building the bargaining power of these women by setting up cooperatives of production and intervening in salary negotiations.
• Developing specific protection and livelihood programmes for households with addicted members: The study showed that these households were at particular risk, as addicts often use any income or assets to purchase drugs. Drug addiction being stigmatised, these households lose the support of their communities, leaving children and women in a situation of high vulnerability. Ad-diction was also a significant predictor for food insecurity. While drug addiction is increasing in Afghan cities, the response of national and international actors should be significantly built up to prevent situations of extreme vulnerability. Organisations like DRC with a specific focus on displaced populations should also take addiction into account in their programming as drug use and associ-ated risks are particularly high – and increasing – among returnees. The issue of addiction among returnee households from Pakistan and Iran is a question that DRC should approach through a regional strategy, as drug use often starts while abroad.
• Building long-term mechanisms of social protection: Urban households suffer from a lack of safety nets and the dissolution of community-based protection mechanisms. Yet, this study showed that mechanisms of social protection – such as the pension distributed to the disabled and victims of mines – could have a real impact on food security. Investing in sustainable systems of social protection should therefore be a priority to fill the gap left by receding systems of charity. In
102 Urban poverty Report Urban poverty Report 103
particular, the training of social workers embedded in the communities should be a priority to identify households at particular risk and improve the referral mecha-nisms – within and outside communities.
> Tailor awareness raising campaigns and training to the gap identified within households to increase food security and improve nutrition:
• Target male members of households with training on food literacy: The study showed that male members of households are in charge of purchasing food in a large majority of urban households. The poor diets of urban households also show a low level of awareness about the benefits of diversified diets. Men should therefore be targeted as a priority by awareness-raising campaigns surrounding food. The study found that food budget was often the key determinant of food choices, meaning that training on food literacy should include components on budget-management and take into account the constraint of low budgets.
• Increase awareness raising about hygiene practices surrounding food, espe-cially for women: The survey showed that levels of awareness about appropri-ate hygiene practices were still low amongst the urban poor, leading to risks of diarrhoea amongst children. Specific training on hygiene requirements for food preparation should be provided. This could be incorporated into entrepreneurial or social activities offered for women – a class on food safety in meal preparation for example. Community kitchens are a good model here.
• Raise awareness about the impact of tea consumption dur-ing meal on iron absorption: Tea consumption during meal inhibit the absorption of iron, an issue particularly problematic when no enhancing factors (fish, meat etc.) are consumed as is the case for most Afghan households. Advocate for tea to be consumed between meals instead of during the meal to address the problem of iron deficiency, particularly for pregnant women, women and children.
• Significantly build up awareness raising on adequate breastfeeding prac-tices: Breastfeeding practices were found to be highly inadequate to provide for infants’ nutrition needs in the cities. A large effort of awareness-raising should target mothers but also female health workers working on deliveries in public clinics for them to provide adequate information and care after the birth. At the community level, women centres combined with EDC centres could be estab-lished within the communities as places where care and development services for young children are easily available, along with training focusing on breastfeeding.
> Work on capacity-building of key urban actors: Urban poverty depends heavily on the capacities of urban authorities to respond to the needs, an area where the gaps are still blatant in the country. Working closely with relevant urban actors on projects can help staff from municipalities, MUDA and IDLG, learn on the job and increase their capacity.
68. See http://www.fukuoka.unhabitat.org/projects/afghanistan/detail20_en.html for more detail.
> Learn from existing successful UN-Habitat programmes: UN-HABITAT has developed successful programming in urban areas that is worth replicating68, in coordination with the agency. In particular, the efforts to incre-mentally register properties, collect small municipal taxes and deliver services to informal settlements are seen as particularly successful by communities and municipal actors alike. Based on the principle of community contributions, they show that urban households are ready to invest in their communities, if they are supported through carefully-designed projects. UN-Habitat could partner with other organisations interested in urban programming to increase the geographic scope of their programme
FOR PIN AND DRC: PROGRAMMING ON URBAN AGRICULTURE
PIN has started implementing a pilot project on urban agriculture addressing the issue of food insecurity and lack of resilience in the cities, with the support of the EU. Some of the modalities of implementation detailed below have already been tested by PIN, which will be able to provide lessons learned for DRC. DRC is now also looking into it and should learn from the lessons drawn by PIN during its pilot. Projects of urban agriculture will typically include a training component and a start-up kit at the end of the training for households to be able to develop their activity. The present study provides several indications how to practically implement this type of programmes in urban envi-ronment:
TARGETING
>At the household level
> Disregard traditional poverty indicators: The present study showed that indicators of poverty are not equally useful to identify finer stratifications among the urban population, as poverty is wide-spread. Relatively soft data like income or expenses are relatively unreliable and do not discriminate enough between sub-groups and types of vulnerabilities. The poverty line – based on monthly expenditure per member of households – does not provide an adequate frame to identify vulnerable households in the cities.
> Use a Simplified Index of Vulnerability: A more robust and comprehensive method of targeting can be based on a user-friendly simplified index of resilience using the following indicators:
• The Food Consumption Score (FCS): this indicator is a good basis for a robust profiling of the level of vulnerability of a household. It is also relatively easy to use and analyse and provides a very handy tool for monitoring and evaluation of the impact of the programme.
• The household dietary diversity score (HDDS): also important in urban areas where one of the important threats to food security is poor diets.

SImPLIFIeD reSILIenCe InDeX
Food Access
Food Consumption Score
< =28.0 3028.1 – 42 15
> 42.0 0
Household Dietary Diversity Score
< 5 205-8 10
> 8 0
Coping Strategy Index
< 8 0
8.1 – 15 5
15-28 10> 28 15
Income
# of source of in-come
< 1 201-2 10
> 2 eXCLUDe
type of incomeCasual labour 20Full-time job eXCLUDe
PSN Household profile
Female-headed household 20
Household with addicted members 15
Household with disabled male adult 15
Migration and Displacement Migratory profile
IDp Household: recently-arrived 20
IDp Household: arrived more than 3 years ago
10
Returnees, local resident or economic migrants
0
ResilienceLevel of education
of head of household
Higher education eXCLUDeSecondary School and High school 0
primary School 5None 20
104 Urban poverty Report Urban poverty Report 105
• The Coping Strategy Index (CSI): There is a need to complement the FSC by looking at the practices born out of food insecurity and the potential risks that they raise for families. The CSI also provides a relatively handy tool to do so and identify risky practices that may endanger the households’ resilience in the long-er-run. Follow-up indicators can be used to refine the analysis of harmful coping strategies and identify, in particular, households where women regularly limit their own quantity of food for other household members to be able to eat. This can be particularly problematic if the woman is taking care of a new-born and should be therefore monitored.
• Number of sources of income: as detailed above, the number of sources of income is a real determinant of vulnerability and lack of resilience amongst urban households. It is also a solid and easily quantifiable indicator, as long as the age and gender of the income-earners are duly recorded. In the current labour mar-ket, a male income-earner relying on casual labour is likely to earn around 5 times the daily income of a female income-earner. The only exceptions to this are if fe-male members of households were able to secure stable employment, especially in the public sector. On the other hand, casual labour is also too widespread to offer a robust selection criterion in and of itself.
• Households with specific types of vulnerabilities: the present study confirmed based on robust statistical evidence the weigh certain factors play in households’ vulnerability, confirming that the ‘Persons with Specific Needs’ (PSN) typology established by UNHCR and other organisations is an adequate tool to test vulner-ability. In particular, households with addicted members; female-headed house-holds/widows, elderly-headed households are particularly determinant criteria of selection.
• IDP households: This study proved that IDP households are significantly more vulnerable than other migratory groups, and that they need a longer period of adjustment to the city than economic migrants or even returnees who received specific support. IDP households should therefore be selected in priority. Yet, this comes with the caveat that IDP households are often still quite mobile upon arrival in the city and households would frequently move before finding a suitable location. Urban agriculture requires time and investment from households. IDP households should therefore have spent at least a year in the community to be selected, in order to prevent the risk of households dropping out in the middle of the project.
• Exclude from the selection: households whose heads of household have received higher education; households with more than 2 income-earners; house-holds with at least one income-earner having a full-time contract.
Conducting a thorough community assessment before starting a project is a necessary but time-consuming and difficult exercise. The series of indicators detailed above can help limiting the assessment to a few meaningful indicators to prevent organisations from wasting time of data collection and analysis. If organisations have enough internal capacities for a more in-depth assessment, the complete resilience index used for this study, with detailed cut-off points is available in annex69.
69. As mentioned previously, this resilience index was designed based on the standard indicators and cut-off points used for Afghanistan and used as a basis the one PIN
developed for its programming in Mazar-e-Sharif
The following box gives an overview of the simplified index of vulnerability that can guide beneficiary selection at the household level.
>At the individual level
> Building women’s resilience Give responsibility to female members of households: the study showed that a) women were more interested by this kind of initiatives; b) most women were inac-tive or unemployed, meaning that the opportunity cost of the time spent in train-ing and following activities is likely to be limited for the household, hence more affordable than for their male counterparts; and, c) women are in charge of food preparation. Selecting female members of households in priority is also a way to increase the impact of the project through a series of secondary effects:
• Strengthening women’s position in the households and decision-making power: As highlighted above and observed in many past researches, women’s role in decision-making remains limited, especially when they do not contribute to the households’ income and well-being. Putting them in charge of a project that

106 Urban poverty Report Urban poverty Report 107
opportunity to pool resources to fund the necessary equipment. For example, instead of 15 or 20 tool kits, beneficiaries can receive one more expensive piece of equipment that will allow for a better productivity. A collective approach also limits the risk of funds being wasted on households giving up mid-way.
> Secure access to land: A key obstacle for urban households to rely on self-pro-duction is accessing land, especially in cities like Kabul where the pressure on land is so high. Poor households usually do not have enough bargaining power to negotiate access to a plot, as landowners will not trust them and they will not have the ability to engage some collaterals. PIN and DRC should therefore work on mechanisms for communities to access plots of land. This includes:
• Prioritise the allocation of a plot of land by the community as a form of contribu-tion to the project. The more invested the community is in the project, the more likely it is to be sustainable.
• In case no land is available, enter into directly negotiations to secure a lease system with private landowners by guaranteeing the transaction. The interven-tion of a third party can help guarantee a fair relationship between the commu-nity and the land owners.
> Coordinate with municipal authorities from the outset of the project. Urban agriculture projects represent interesting authorities for non-governmental actors to link up and work closely with municipal authorities on non-controversial issues.
• Involving governmental authorities in the selection of target areas and in the ne-gotiations to access land: MUDA noted that they had access to land more easily than private or non-governmental actors and that they would be willing to estab-lish leasing systems with landowners to develop urban agriculture or establish greenhouses in the city.
• Coordinate with greenery projects supported by municipalities and IDLG for the establishment of community gardens: greeneries is part of municipalities’ mandate and could represent a good incentive for urban authorities to support initiatives relative to urban agriculture.
• Include a representative of the municipality (preferably a female staff in the department overseeing greeneries) in the training.
> Assess access to water, price of water and potential tensions before imple-mentation: the present study found that access to water and its price could vary significantly for communities. In majority, water did not represent an issue or a source of tension for urban households but a sudden initiative of urban agri-culture can change these balances. The risk for conflict needs to be assessed at the local level and questions of access to water discussed with households and community leaders to prevent future tensions. In order for projects of urban agriculture to be sustainable, it is preferable to select communities with relatively easy access to water. The project must include an irrigation plan for households and communities, to be discussed and approved by community representatives.
will ease family consumption is a good way to strengthen their position and responsibilities in the family.
• Increase the opportunities for women to socialise around a common project: whether im-plemented at the community or at the household level, urban agriculture projects should foster collective management and problem-solving mechanisms, offering for women a forum of discus-sion and socialisation that is often blatantly lacking.
• Additionally, a community kitchen project model could be used to increase women’s resil-ience. Such project could provide women with both a place to socialize, and training on small business skills, food safety (building upon findings regarding hygiene), and nutrition. Such projects have provided income-generating opportunities for women and improved participants’ nutritional intake and budgeting skills in similar settings.70
Community kitchens is a term used to “describe community-focused and –initiated cooking-type pro-
grammes. (…) Community kitchens are known as providing an opportunity for a small group of people
to meet regularly in order to prepare a meal. (…) Community kitchens focus on developing participant
resilience for those experiencing food insecurity and social isolation rather than creating and support-
ing a cycle of dependency and emergency food relief”71.
• Set-up self-help groups for female beneficiaries to discuss the difficulties they face and po-tentially use the structure for micro-loans when needed. As shown in recent studies conducted for the Danish NGO Mission East in Northern Afghanistan, Self Help Groups not only have an economic role to pay, but they also strongly contribute to community mobilisation, awareness raising, and social cohesion – and especially among female members of the community. Con-sidering that it is often more difficult for women to find a job in urban areas, setting up self-help groups may be a pragmatic gender-inclusive instrument.
> Target male members of the community with training on technical services needed for urban agriculture: The project can be designed to associate both male and female members of the community, hence increasing acceptance. Urban greenhouses, irrigation system or transportation and stor-age of produce require specific skills and support that can be left in the hands of male members of the community, who can then find a source of livelihoods linked to the project. Training in plumbing or maintenance of solar panels can be combined with the training women receive in planting.
IMPLEMENTATION MODALITIES
Preliminary Steps
> Privilege projects of urban agriculture based on group work: Training groups of people to work together present several advantages in terms of impact and sustainability of projects. Single households often do not have the capital or labour force to cultivate a plot of land. Working with groups of beneficiaries leads to a higher community involvement in the project and gives the
70. Iacovou M, Pattieson D, Truby H, Palermo C. Social health and nutrition impacts of community kitchens: a systematic review. Public Health Nutrition, 2011. 16(3): 535-543.
71. Ibid, p. 535.

TWO CASE STUDIES ON SACK GARDENING IN KENYA & GHANA75
Sack agriculture allows for urban poor households
who could not afford more expensive f orms of ur-
ban farming to increase their access to food and
generate income from sale of the produce. the au-
thors compare two initiatives of sack agriculture,
one in Kibera (Nairobi), one in Balawa in the Upper
West Region of Ghana.
Methods & Materials: “Sack gardening allows
farmer to grow food by planning 20 to 40 plants
inside and on top of a 50kg sack filled with soil and
using stones or pVC to create a vent in the middle
of the soil through which water is distributed to
the plants in the sack. the material used for the
vent is of importance because it determines how
efficient they system will be at providing water to
all part of the sack. Stones prove more efficient
at this than PVC vent.
Example of kale production in sacks: “once the
kales have reached a certain age (3-4weeks), they
are uprooted and planted in a sack garden. the
sack used was a manila sack filled with a combi-
nation of soil and compost manure. the sack was
filled initially to about 12 inches with the treated
soil, then a hollow tin was placed right at the
center and filled with ballast. Soil was thereafter
added surrounding the tin up to its top and the
tin was then pulled. once it was almost empty,
the tin was topped with more ballast and this was
repeated until the sack is full. this sack therefore
had soil mixed with manure and in its centre a pipe
made of stones to water the vegetation. once full,
20 liters of water is poured right at the centre
of the stone area; then the sides of the sack are
pierced with holes of 2 to 3 centimeters for the
seeds to be planted. the holes are made in such a
way that every line has eight holes and there are
five lines for a total of 40 holes in any given sack.
the kales are left to grow for 2 to 3 months to
reach maturity. A 50kg sack has enough manure to
be used for 3 years.
The authors note that using sacks, soil and stones for the vent means a very limited financial input for households. Composts made out of solid
waste can also be used for the soil.
Example of possible productions: kale and spinach
as leafy vegetables adapt well to sack agriculture.
Crops growing vertically – such as pepper or egg
plants – work also well, while tomatoes may be
more difficult.
Possible threats: Weather variations and humidity
may decrease the durability of the sacks.
Possible partners: Solidarités Internationales
supported this kind of project in Kenya and could
provide lessons learned.
75. Ibid.
108 Urban poverty Report Urban poverty Report 109
> Establish production systems as autonomous as possible: Urban poor house-holds have very little resources to sustain any productive system that requires im-portant inputs. To the extent possible, households should be trained to establish intra-households systems supporting their production. That may include for ex-ample rudimentary systems of rainwater collection and storage as well as water-saving irrigation systems such as drip irrigation. Additionally, a proper “compost corner can be established to allow for composted material to age before being used” for the production.72
> Plan for winter: Greenhouses can also be envisaged to extend as much as possible the period of cultivation and counter the seasonality of urban income. Inexpensive ways of heating can be prioritised: big rocks, cements and buckets of water left in the greenhouse during the day can help maintain an acceptable temperature at night when they radiate the heat back out73, a system that PIN has piloted in Mazar-e-Sharif. More expensive but offering interesting opportunities, solar greenhouses can also be considered. This solution requires more technical equipment, including solar collector, water storage tank, piping systems and a pump.
> Plan for winter 2: Aid and emergency actors may develop prepositioned stocks to avoid predictable (seasonal) pipeline breaks, as there is a recurrent correlation between food insecurity and natural hazards, with seasonal peaks between: 1) December and March (= extreme cold according to OCHA’s hazards calendars), and 2) March and June (= floods), indicating not only the importance of imple-menting short-term humanitarian relief, but also the necessity to anticipate pre-dictable hazards through prepositioned stocks. In this regard, UN agencies and NGOs operating on emergency situations in urban and peri-urban areas critically need to engage more directly with agricultural seasonality if it is to address this fundamental source of risk and vulnerability.
> In cases where access to land plots is impossible, consider other forms of urban agriculture that do not require land plots, such as sack agriculture or rooftop agriculture. This option can be particularly interesting for households living in ar-eas with insecure land tenure and for the KIS, where municipal authorities do not allow long-term development programmes. This option should also be privileged when working with recently-displaced IDPs, as these may move again and as it could be more difficult to secure access to land for them. “Sack gardening or ver-tical gardening are forms of urban agriculture where the cultivation of plants takes place in large sacks filled with soil.”74 (See next page for details).
Selection of Products & Activities
> Prioritize a combination of urban productions to address the issue of food di-versity. The present review of food security in urban areas showed that urban di-ets were poor and not diversified. In particular, dairy products, proteins and fruits are lacking. Vegetables are easier to grow but are also more commonly integrated into urban diets, usually the second food source after bread and rice. Combining productions would allow for communities to benefit sooner from their productions
with the vegetables but also to work on the longer-term on food diversity by also planting fruits. Initiatives of poultry raising and small livestock raising can also be developed in areas where the shortage of protein and dairy products is particu-larly blatant.
> Select products based on local conditions, preferences and markets: Training on urban agriculture must be specific and tailored to the communities where it is implemented. Before selecting the products to grow, a rapid assessment must show what communities want to eat and would be able to sell easily on the local market.
72. True Consulting Group (2007), Best Practices in urban agriculture : a background report for the city of Kamloops to support development of a urban agricultural strat-
egy. p. 42. 73. http://www.gardenandgreenhouse.net/index.php/past-issues-mainmenu-18/35-website-exclusives/819-winter-greenhouse-gardening-tips 74. Peprah,
K. Amoah, S.T., Akongbangre J. (2014) : Ç Sack Farming : Innovation for Land Scarcity Farmers in Kenya and Ghana È in International Journal of Innovatives Research and
Studies, vol.3, Issue 5.

110 Urban poverty Report Urban poverty Report 111
> Choose types of products and species that are better suited for storage: The study confirmed that seasonality had a strong impact on urban poor households, which usually are short of income and see their food security deteriorating at that time of the year. Root vegetables, potatoes or onions are for example much easier to store than tomatoes or peppers which will not be stored easily. Grow-ing products that can be harvested well into the winter can be a way to curve the impact of seasonality on urban households.
Training and Tool Kits
> Include a component of food literacy, nutrition and WASH to the training in order to cover various aspects of food security, including food utilisation, food safety, diet diversity and adequate breastfeeding practices.
> Encourage community contribution: Community members, whether direct beneficiaries or not, should be encouraged to contribute to the project in order to reinforce ownership and acceptance within the community. Small contribu-tions can include tools, sacks, seeds while richer community members should be encouraged to lease small plots of land.
> Plan for flexible tool kits: Tool kits will have to be adjusted to the needs of the targeted communities. In particular, groups of beneficiaries can be offer the op-portunity to ‘pool’ their tool kits to purchase a more expensive piece of equip-ment that can be of higher benefit for the community. PIN and DRC’s technical advisers should be closely involved in the discussions surrounding the request for equipment and help communities identify their needs.
MONITORING AND FOLLOW-UP
> Plan for a long-term follow-up mechanism and post-completion training from the beginning of the project: Urban agriculture are not short-term projects as they require to build the trust of the community and to be available to follow-up and help beneficiaries solve the many issues they will potentially face in their activity. Regular on-site visits should be planned and beneficiaries should be able to contact their trainers even after the end of the project for technical assistance.
> Setting up public monitoring and warning mechanisms: A comprehensive sys-tem to ensure the protection of vulnerable and poor households in emergencies must include timely and reliable monitoring procedures, accompanied by a mech-anism to ensure compliance at the field level. Such a system would establish consistent standards and methodologies for identifying, documenting and verify-ing child rights violations and using this information to mobilize public opinion, inform policymaking and resource allocation and guide program interventions. In this regard, and considering the increasing politicization of socio-economic issues in Afghanistan, it is important to identify objective monitoring and warning procedures – such as source triangulation, through a multi-facetted monitoring and evaluation approach (external independent evaluation, internal monitoring from partnering NGOs, and community-based evaluation).
> Include research for potential market integration after pilot: Potential market niches should be identified for future phases of projects to include a component of transformation and processing (for example of dairy products), of transporta-
tion and commercialisation. In the mid- and long-term, the project should aim at going beyond subsistence agriculture and at supporting beneficiaries entering the market by helping them adding value to their production through processing.
> Regularly assess the income and indebtedness levels of urban and peri-urban households and communities: As shown in this survey, there is evidence that the poverty level of urban households is largely under-estimated. In this regard, it is crucial to get an accurate sense of households’ income and indebtedness on a continuous and frequent basis, to adequately measure their actual dependency on informal or formal sources of credit loaners (banks, hawalas, local economic predators, etc.)
FOR DONORS
> Endorse strategic shifts:
• From rural-centred interventions to urban programming: This study provides ample evidence of the blatant economic crisis that Afghan cities face and the risk it generates for urban population. The urban poor is increasingly poor and that raises political, social and security risks for the stability of the country. In spite of efforts and improved capacities, municipal authorities do not have the technical and financial capacities to adjust to the movement of urbanisation. Donors’ at-tention must adjust and take on board the dynamics of urbanisation and internal displacement.
• Creating “spaces of resilience”: Urban community centres:
Support programmes aiming at improving key infrastructures for food secu-rity in urban areas: An important proportion of food produces is lost because of inefficient or inadequate infrastructures. That includes in particular stor-age facilities; transportation infrastructures and sanitation facilities to limit the amount of waste throughout the food chain.
Creating community centres at local spaces for resilience: assistance requires physical locations for stakeholders to reach the poorest and accom-pany them to practices that are fit with urban characteristics and an urban lifestyle, especially for those displaced and new to such contexts. The set-up of community centres is needed to reach out to the most vulnerable – includ-ing female-headed households who live within invisible physical and social boundaries.
> Emphasize support to:
• Longer-term development projects best suited to building resilience amongst the urban poor: Urban poverty is first and foremost a question of development and resilience of households will be built through a better access to services, higher levels of qualification and access to qualified jobs. This requires the com-mitment of donors for longer projects, as the one-year time span does not suit either development projects or urban agriculture projects. For these to be sus-tainable, organisations must be able to build relations in the community and to

112 Urban poverty Report Urban poverty Report 113
provide technical assistance long after the end of the training. This will only be the case through a long-term commitment with the communities selected.
• Programmes inducing structural economic changes: Afghan labour markets are saturated with under-paid and under-qualified workers and Afghan key economic sectors suffer from the competition of Iran and Pakistan products, with which they are not in a position to compete. Development programmes should aim at counterbalancing the weaknesses of Afghan productive sec-tors (high costs of production in particular) with qualified labour that would support local production and make it able to stand international competition. Only structural changes will support the urban poor in the long term: labour qualification; improve business models and companies’ cost efficiency and performance. This type of programmes requires long-term support and com-mitment from donors.
• Mid-size cities to counter-balance urban growth: Most of the investment targeting urban areas focuses on the five cities under study. This is logical as they concentrate most of the urban population and are the main destination of economic migrants and IDPs. Yet, Afghan national authorities are calling for donors to acknowledge the needs of mid-size cities, such as Khost, Kunduz or Ghazni for example. Investing in mid-size cities would be a way to counter-balance the unregulated growth of Afghan major cities by offering alternative locations for economic migrants and IDPs to settle.
> Advocate with the new administration for:
• An early approval of the informal settlements upgrading policy: The policy should help significantly the work of municipal authorities and support their ability to tackle urban poverty at their level. The approval of the policy should therefore be high on the agenda of the new administration, once the latter is in place. Donors should keep a close watch on the process and advocate for a rapid approval and follow-up process.
• The implementation of the IDP policy and the official recognition of other durable solutions than return: As mentioned above, the IDP policy offers interesting solutions to address the question of IDP caseloads in urban areas. Its implementation will not be easy and may raise important opposition, in particular from municipal authorities. Donors should also advocate for the recognition by municipal authorities and by the new administration of the necessity to envisage other durable solutions than return for IDPs, given the overwhelming intention of IDPs to settle in the cities.
• Social protection mechanisms to be developed for female-headed house-holds and elderly-headed households: Despite a social protection strategy for 2008 to 2013, existing mechanisms of social protection are very scarce and cover only families of martyrs and disabled (including the victims of mine accidents). Yet, this study confirms that widows and households headed by elderly are often in a situation of dire needs and have little means to access livelihoods. These categories should be targeted in priority for future develop-ment of government-led social protection mechanisms.
FOR MUNICIPAL AUTHORITIES AND URBAN ACTORS
> Following the National IDP Policy, acknowledge the need for durable solu-tions other than return - such as local integration – for IDP caseloads living in the cities and coordinate with humanitarian actors to identify opportunities for land distribution and relo-cation. This study, as others have in the past, confirm that IDPs are, in an over-whelming majority, not willing to go back to their place of origin. Taking on board that reality as early as possible will help planning and prevent the establishment of pockets of extreme poverty in the middle of Afghan key cities.
> Livelihoods - Actively support projects of urban agriculture in urban areas: This type of programming is well adapted to the needs of the urban poor and should receive the support of municipal and governmental authorities. These authorities can bring a valuable support in securing access to land through leas-ing system. Projects of urban agriculture can be articulated with the programmes surrounding greenery led by municipalities.
> Infrastructure - Plan for the development of warehouses for storage in urban areas: The lack of such facilities induces an important spoilage of food and the inability to keep seasonal produce and reduce the impact of seasonality.
> Social support - Establish social support community centres: The study shows the dissolution of community-based protection mechanisms. Establishing physical spaces where community members can meet and discuss their issues, as well as receive counselling to solve these issues would help fill-ing that gap directly at the community level. These social support community centres could be established first for women first as way to exchange ideas, find solutions and discuss best practices about the key social issues identified in the study: breastfeeding practise, hygiene practices or anxiety relative to access to food.

anneXeS AND REFERENCES
Urban poverty Report 115
ANNEX. 1
Resilience Index
Category Question in Survey Answer Options Scoring Total Maximum Score
Food Access
FCS <=28.0 30
100
28.1 - 42 15 >42.0 0
HDD <5 20 5-8 10 >8 0
HFIAS Severely Food Insecure 30 Moderately Food insecure 20 Mildly Food Insecure 10 Food Secure 0
HHS Severely Hungry 20 Moderate Hunger 10 Little/No hunger 0
Access to Basic Services
Can you Read and Write
Yes 0
90
No 10 What is your level of education
No Schooling 20 Primary 10 Secondary 10 High School 10 College Diploma 10 University 0 Post Grad 0 Madrassa 15 Other 10
Do you have electricity in your house
No Electricity 5 Public Grid 0 Personal Generator 0 Solar Electricity 0 Other 0
What is the main source for drinking water
Spring Water/River/lake/Canal/Rain water
5
Water Tank 5 Other 0
Is the water source for drinking on your compound?
No 5 Yes 0
How many minutes does it take to bring drinking water to the house?
More than 30 minutes walking 10 Between 15 and 30 minutes walking 5 Less than 15 minutes walking 0
How clean is your water?
We do not do anything to the water 0 I don’t know 5 Other 10 None/Open field 15
ANNEX 1

116 Urban poverty Report Urban poverty Report 117
Samuel Hall 2014: A Study of Poverty, Food Security and Resilience in Afghan cities - Final Report 104
What kind of latrines do your household members use?
Traditional pit latrine 10 Other 0
Are you sharing the latrine with another household?
No 0 Yes 5
Does adult male member/elder have Tazkira
No 5 Yes 0
Social Safety Nets
Have you ever received any assistance from any organisation?
Yes 0
40
No 10
Have you received any assistance for a job?
Yes, Job Placement/Business Start up Grant
0
No 10 Have you received any assistance from personal network?
Yes 0 No 10
Have you received any assistance from International Organisations?
Yes 0 No 10
Assets
What is your present housing arrangement?
Temporary Shelter 30
80
Rented Family house/shared with others
5
Others 0 Do you own land? Yes 0
No 10 Do you have a land deed certificate
No 5 Yes 0
Livestock Ownership Index
Cattle/Buffalo/Horse/Donkey/Mule 0 Poultry/Goat/Sheep/other 5 No Livestock 10
Durable Asset Index No Asset Ownership 25 Little Asset Ownership 15 Moderate Asset Ownership 10 High Asset Ownership 0
Adaptive Capacity
Main Source of household income?
Unemployed 10
90
Day Labourer/Unpaid Family Worker/Domestic Worker/Apprentice
5
Other 0 Any other sources of income?
Yes 0 No 5
Is there any school aged child which is not attending school?
No, there are some who don’t 10 All school aged children go to school 0
How much of your household income is spent on food?
All income 10 More than half 5 Other 0
How much of your household income is spent on fuel and heating?
All income 10 More than half 5 Other 0
Samuel Hall 2014: A Study of Poverty, Food Security and Resilience in Afghan cities - Final Report 105
What does the HH spend daily to go to work?
<100 AFS 0 >100 AFS 5
How much is your household able to save per month?
>500 AFS 0 <500 AFS/I don’t know 2 None 5
How much is your present debt in total?
<12,000 AFS 0 12,000-30,000 AFS 10 >30,000 AFS 15
Is a member of the household addicted to drugs?
Yes 10 No 0
Is a member of the household disabled?
Yes 10 No 0

118 Urban poverty Report Urban poverty Report 119
Samuel Hall 2014: A Study of Poverty, Food Security and Resilience in Afghan cities - Final Report 106
ANNEX 2 – INDICATORS
Food Consumption Score The FCS is a “proxy indicators to measure caloric intake and diet quality at household level, giving an indication of food security of the household. It is a composite score based on dietary diversity, food frequency, and relative nutritional importance of different food groups.”76 The FCS was calculated based on the food groups, weighting system and cut-off points used by the Food Security and Agriculture Cluster (FSAC) for their food security assessment conducted in 2013. The weights applied for each food group were as follows:
To calculate the FCS, and based on the FSAC methodology, the research team: 1. Used standard 7-day food frequency data. As cereals and tubers were surveyed as
different food groups, the higher number of days either cereals or tubers were consumed was chosen. This differs from the FSAC’s formula but only leading to statistically insignificant variations in the results of the survey.
2. Multiplied the values obtained for each food group by its weight and created new weighted food group scores.
3. Summed the weighed food group scores, thus, creating the food consumption score (FCS). The most diversified and best consumption with maximal FCS at 112 means that all food groups are eaten 7 days a week.
The research used the FSAC’s thresholds : a FCS below 28 means a poor food consumption, a FCS between 28.1 and 42 a borderline food consumption, a FCS above 42 an acceptable food consumption. These three categories were used to calculate the percentage of households of poor, borderline and acceptable food consumption.
Food Consumption Indicator Percentage of food expenditure in total household expenditure. The thresholds and categories were based on the Food Security Cluster Assessment. In Afghanistan:
Poor: Food expenditure is more than 60 percent of total household expenditure; Average: food expenditure is at 40-60 percent of total household expenditure; Good: food expenditure is less than 40 percent of total household expenditure.
76 NRVA
Food Group Weight
Cereals and tubers 2
Pulses 3
Vegetables 1
Fruit 1
Meat, fish and eggs 4
Dairy products 4
Sugar, sweet 0.5
Oil, fat 0.5
Condiments, spices 0
Samuel Hall 2014: A Study of Poverty, Food Security and Resilience in Afghan cities - Final Report 107
Coping Strategy Index The CSI used for the study was also based on the methodology developed by the FSAC, as follows :
The CSI (more accurately, it is RCSI: Reduced Coping Strategy Index) is used to quantify the severity of food-based coping strategies. A 7 days recall period is used. It is based on a number of robust negative coping strategies and applies a standard weight depending on the severity of the coping strategy. It is very useful for comparing across regions and countries, or across income/livelihood groups, because it focuses on a set of behaviours. The maximal CSI is when all strategies are applied every day. There are no universal thresholds for RCSI. The weighted score is calculated by multiplying the frequency by the weight. But the higher the RCSI, the more severely the coping is applied by a household, hence the more food insecure the household is.
The weight are as follows :
Coping Strategy Weigh
Rely on less preferred and less expensive foods 1
Borrow food or rely on help from friends or relatives 2
Limit portion size at mealtime 1
Restrict consumption by adults in order for small children to eat 3
Reduce number of meals eaten in a day 1
Household Dietary Diversity
24-hour recall period For a greater precision, additional data was collected to measure the dietary diversity of households over the past 24 hours. The score per household is calculated by coding either “1” if the food has been consumed or “0” if it has not and adding up the result for each food group. The HDDS indicator is the sum of all HDDS divided by the number of households.
7 days recall period Based on the NRVA, the research team calculated a household dietary diversity score based on a 7-day recall period. This gives a) the average number of days per week each food group is consumed by different sub-groups of the sample; b) a score between 0 and 10 calculated for each household based on whether they consumed each of the various food groups over the past seven days.
Poverty line The NRVA calculated the poverty line in Afghanistan based on per capita consumption. The poverty line equals the typical cost of attaining 2,100 calories per person per day and of meeting some basic non-food needs. The official average poverty line for Afghanistan in 2011-12: Afs 1,710 per person per month. A household is defined as poor if the total value of per capita consumption is less than the poverty line77. 77 NRVA, p.177
ANNEX 2 - INDICAtoRS

120 Urban poverty Report Urban poverty Report 121 Samuel Hall 2014: A Study of Poverty, Food Security and Resilience in Afghan cities - Final Report 108
Durable Asset Index The durable asset ownership index is created by assigning weights to the various commodities asked for in Q33 of the household questionnaire. The index scores the ownership level on a scale of 0-100 where 0 being no assets in possession and 100 being all assets. The weights are assigned based on the cost of the various items and their ability to support the family in terms of livelihood or other comforts. The following weights are used for the commodities and then summed across all commodities:
The categories were defined as follows: 1. Category 1-High Assets Ownership: 50-100 2. Category 2-Moderate Asset Ownership: 25-45 3. Category 3-Low Asset ownership: 5-20 4. Category 4-No Asset Ownership: 0
Asset Weight
Fridge 10
Stove 10
TV 10
Radio 5
VCR 5
Mobile 5
Computer 10
Sewing 5
Iron 5
Bicycle 5
Motorcycle 5
Car 10
Tractor 15
Samuel Hall 2014: A Study of Poverty, Food Security and Resilience in Afghan cities - Final Report 109
ANNEX 3
List of Informal Settlements identified by the Task Force and included in the sample for this study:
City Name of Settlement
Kabul
Darulaman
Chahari Qamber
Bagh-e-Dawood
Kabul Nindarai
Bagrami Hussain Khil
Chaman-e-babrak
Sarake Do Karte Naw
Herat
Kareezak
Shayee Dahee checkpoint
Pashtoon
Munarat
ANNEX 3
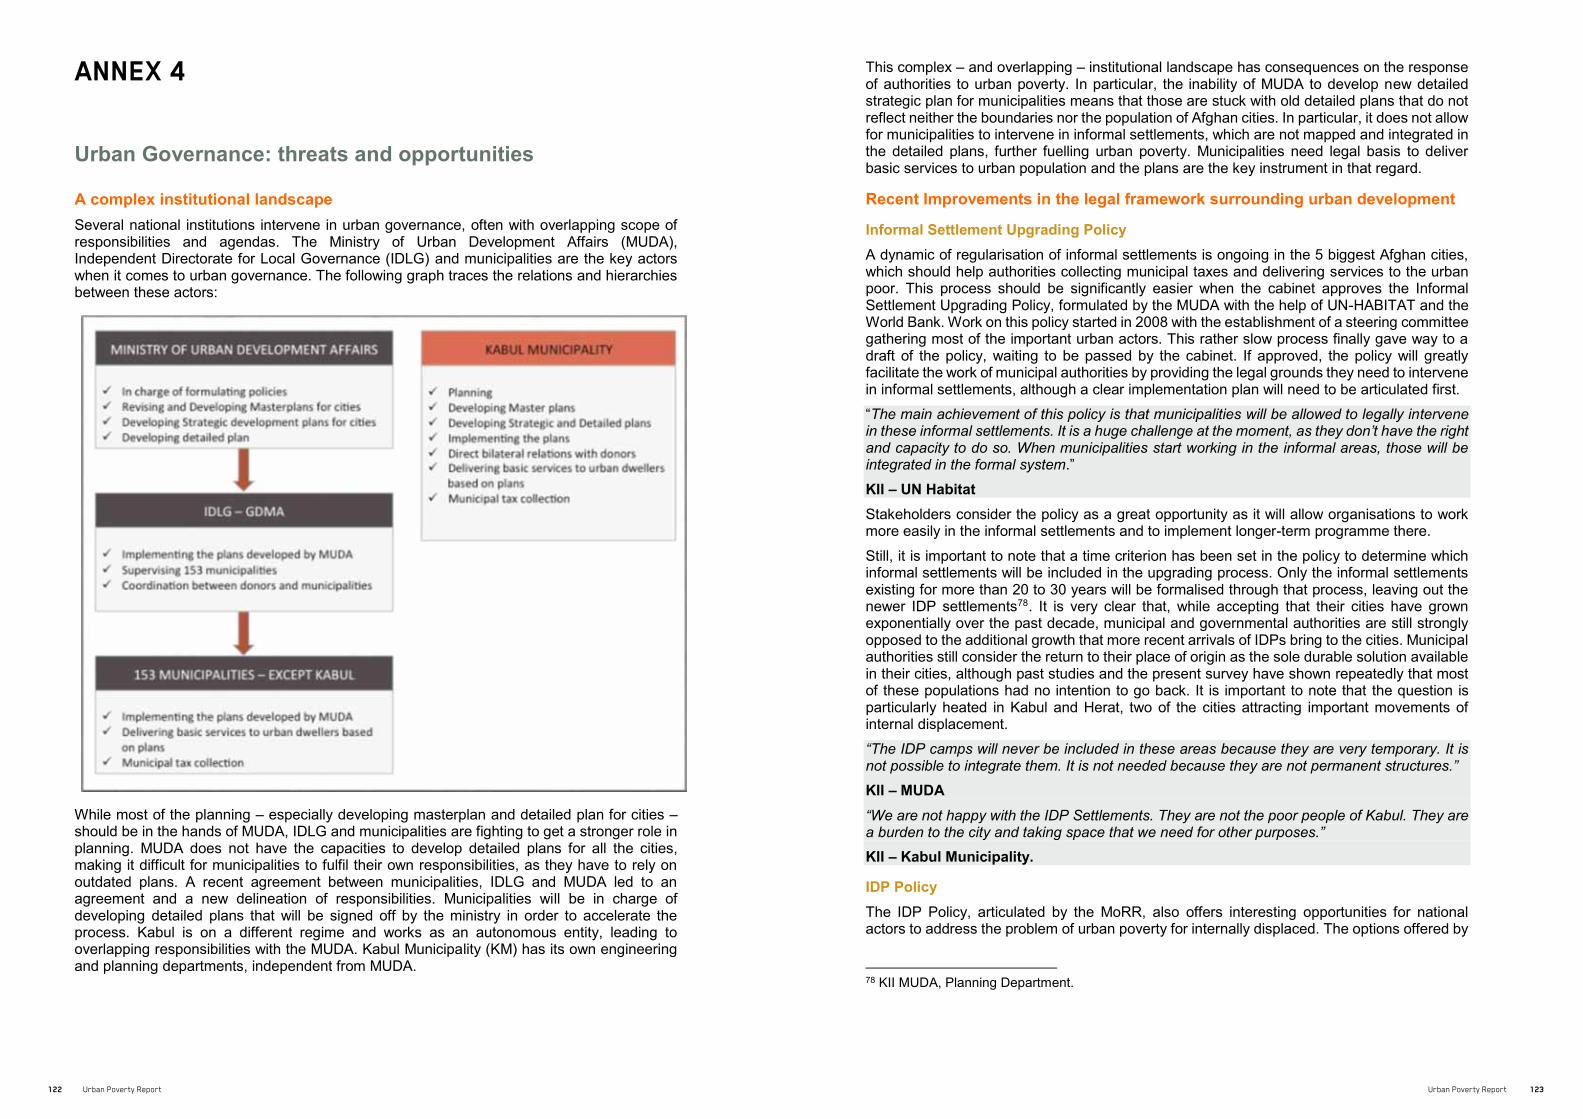
122 Urban poverty Report Urban poverty Report 123
Samuel Hall 2014: A Study of Poverty, Food Security and Resilience in Afghan cities - Final Report 110
ANNEX 4
Urban Governance: threats and opportunities
A complex institutional landscape Several national institutions intervene in urban governance, often with overlapping scope of responsibilities and agendas. The Ministry of Urban Development Affairs (MUDA), Independent Directorate for Local Governance (IDLG) and municipalities are the key actors when it comes to urban governance. The following graph traces the relations and hierarchies between these actors:
While most of the planning – especially developing masterplan and detailed plan for cities – should be in the hands of MUDA, IDLG and municipalities are fighting to get a stronger role in planning. MUDA does not have the capacities to develop detailed plans for all the cities, making it difficult for municipalities to fulfil their own responsibilities, as they have to rely on outdated plans. A recent agreement between municipalities, IDLG and MUDA led to an agreement and a new delineation of responsibilities. Municipalities will be in charge of developing detailed plans that will be signed off by the ministry in order to accelerate the process. Kabul is on a different regime and works as an autonomous entity, leading to overlapping responsibilities with the MUDA. Kabul Municipality (KM) has its own engineering and planning departments, independent from MUDA.
Samuel Hall 2014: A Study of Poverty, Food Security and Resilience in Afghan cities - Final Report 111
This complex – and overlapping – institutional landscape has consequences on the response of authorities to urban poverty. In particular, the inability of MUDA to develop new detailed strategic plan for municipalities means that those are stuck with old detailed plans that do not reflect neither the boundaries nor the population of Afghan cities. In particular, it does not allow for municipalities to intervene in informal settlements, which are not mapped and integrated in the detailed plans, further fuelling urban poverty. Municipalities need legal basis to deliver basic services to urban population and the plans are the key instrument in that regard.
Recent Improvements in the legal framework surrounding urban development
Informal Settlement Upgrading Policy A dynamic of regularisation of informal settlements is ongoing in the 5 biggest Afghan cities, which should help authorities collecting municipal taxes and delivering services to the urban poor. This process should be significantly easier when the cabinet approves the Informal Settlement Upgrading Policy, formulated by the MUDA with the help of UN-HABITAT and the World Bank. Work on this policy started in 2008 with the establishment of a steering committee gathering most of the important urban actors. This rather slow process finally gave way to a draft of the policy, waiting to be passed by the cabinet. If approved, the policy will greatly facilitate the work of municipal authorities by providing the legal grounds they need to intervene in informal settlements, although a clear implementation plan will need to be articulated first.
“The main achievement of this policy is that municipalities will be allowed to legally intervene in these informal settlements. It is a huge challenge at the moment, as they don’t have the right and capacity to do so. When municipalities start working in the informal areas, those will be integrated in the formal system.” KII – UN Habitat Stakeholders consider the policy as a great opportunity as it will allow organisations to work more easily in the informal settlements and to implement longer-term programme there.
Still, it is important to note that a time criterion has been set in the policy to determine which informal settlements will be included in the upgrading process. Only the informal settlements existing for more than 20 to 30 years will be formalised through that process, leaving out the newer IDP settlements78. It is very clear that, while accepting that their cities have grown exponentially over the past decade, municipal and governmental authorities are still strongly opposed to the additional growth that more recent arrivals of IDPs bring to the cities. Municipal authorities still consider the return to their place of origin as the sole durable solution available in their cities, although past studies and the present survey have shown repeatedly that most of these populations had no intention to go back. It is important to note that the question is particularly heated in Kabul and Herat, two of the cities attracting important movements of internal displacement.
“The IDP camps will never be included in these areas because they are very temporary. It is not possible to integrate them. It is not needed because they are not permanent structures.”
KII – MUDA “We are not happy with the IDP Settlements. They are not the poor people of Kabul. They are a burden to the city and taking space that we need for other purposes.”
KII – Kabul Municipality.
IDP Policy The IDP Policy, articulated by the MoRR, also offers interesting opportunities for national actors to address the problem of urban poverty for internally displaced. The options offered by
78 KII MUDA, Planning Department.
ANNEX 4

124 Urban poverty Report Urban poverty Report 125
Samuel Hall 2014: A Study of Poverty, Food Security and Resilience in Afghan cities - Final Report 112
the IDP Policy are ‘huge’79 to address the problem of assistance to IDPs, including complete stop to forced evictions, social housing options and land distribution or relocation. The IDP Policy also introduces significant protective measures to frame forced eviction of IDPs.
Stakeholders agree that the main challenge with the IDP Policy will come with implementation, especially as it is supported by a ministry relatively weak to address the huge issues it raise, especially surrounding access to land tenure and relocation of IDP settlements. The MoRR has for example little traction to influence the position of Kabul Municipality on IDPs. To move forward with the implementation, the IDP task force agreed on a road map. In 2015, implementation road maps will be drafted for 9 pilot provinces, that should include Balkh, Jawzjan, Kunduz, Baghlan, Nangahar, Herat, Baghis, Kandahar, Wardak and Kabul although the list is not finale.
Position of urban authorities on assistance in urban areas The relationship between humanitarian actors and municipal authorities is often tense, in particular on the question of assistance to IDPs. Apart from this highly politicised issue, governmental actors working on urban issues point at the following aspects of their collaboration with international actors:
Regret the lack of coordination on urban development priorities – While governmental actors praise the support of some key donors on urban development (JICA and the World Bank in particular), they find regrettable the fact that some important urban development programmes are designed and implemented with very little coordination with the line ministries, in particular MUDA and IDLG-GDMA. The urban programme of GIZ in Kunduz city or USAID Urban development programmes are examples of this. This prevents national institutions to present the priorities of development they have identified for each city.
Regret the focus on short-term assistance – National authorities are pushing for a stronger focus on development for urban areas. Most of them consider emergency assistance as not having its place in Afghan cities because they keep populations in situations of dependence and do not guarantee any long-term impact for urban populations. “International NGOs sometimes work with urban poor but it is not effective. They are just helping people on the short-term. They are neither generating any employment nor resolving the issues. Food distribution is not the solution.” KII – Municipality of Herat
Support projects of urban agriculture – Overall, governmental and municipal actors interviewed for this study showed support and a certain level of enthusiasm for potential programmes of urban agriculture, as this type of programming overlaps with some of the priorities they have identified for urban development: a) small and medium enterprises and livelihoods on the one hand; b) greeneries and environmental concerns on the other. They all noted the caveat that this type of initiatives should be developed in close cooperation with municipal authorities, which could be of great support to address the question of land that may render any initiative of this kind difficult.
79 KII – HLP Task Force
SAMUEL HALL’S RELEVANT REPORTS:
• 2009, Majidi, Returning refugees in urban areas,
for NRC
• 2011, Research Study on IDPs in urban settings –
Afghanistan, for the World Bank and UNHCR
• 2012, Challenges of IDP Protection in Afghanistan,
for NRC
• 2012, Sustaining the Working Poor in Kabul Informal
Settlements: an Evaluation of Solidarités Interna-
tional’s Vocational Training Programme,
for Solidarités International
• 2012, Time to Move to Sustainable Jobs : A Study of
the State of Employment in Afghanistan,
for ILo.
• 2013, Cost of Hunger Study,
for WFp
• 2013, Cash Programme Review for IDPs in the Kabul
Informal Settlements,
for DRC
• 2013, Afghanistan’s Future in Transition: A Participa-
tory Assessment of the Afghan Youth,
for UNICeF, DMoYA, UNFpA and UNDp
• Forthcoming, Understanding Urban Displaced Youth.
• Forthcoming, Evaluation of Cash-Based Assistance
Programmes to Internally Displaced People in the
Kabul Informal Settlements,
for WHH and DRC
OTHER SOURCES
Adger W.N, (2000),
‘Social and ecological resilience: are they related?’ in
Progress in Human Geography, 24:347
Alinovi, L (2009),
‘Measuring Household Resilience to Food Insecurity:
Application to palestinian Households’,
Working paper for the eC-FAo Food Security programme.
Beall, j. & SchŸtte, S. (2006),
‘Urban livelihoods in Afghanistan’, Synthesis Paper - AREU
Central Statistics Organisation (2014),
National Risk and Vulnerability Assessment 2011-12.
Afghanistan Living Conditions Survey. Kabul, CSo.
Coates, j., Swindale, A., Bilinsky, P. (2007),
Household Food Insecurity Access Scale (HFIAS) for
Measurement of Household Food Access: Indicator Guide
(v.3). FHI 360/FANtA
Collins, G. (2008),
Technical Guidance Sheet: Urban Food Security and
Nutrition Assessments, funded by eCHo and DfID.
DOLSA-War Child, Social Protection Mechanisms in Herat,
Afghanistan : A mapping report
Ecker, O & Breisinger, C. (2012),
‘the Food Security System, A New Conceptual Framework’
in IFPRI Discussion Paper 01166
EU-FAO,
Measuring Resilience: A Concept Note on the Resilience tool
FANTA III,
Household Food Insecurity Access Scale (HFIAS) for
Measurement of Food Access: Indicator Guide,
Version 3 (2007)
FAO (2008),
Food Insecurity Information for Action, practical Guides.
FAO (2008),
Report on Use of the HFIAS and HDDS in two survey
rounds in Manica and Sofala Provinces, Mozambique.
FAO (2012),
The state of food insecurity in the world
FSAC, (2013),
REFERENCES

126 Urban poverty Report
Seasonal Food Security Assessment – Afghanistan (July-
September 2013).
Harpivken, K.B., (2009),
Social Networks and Migration in Wartime Afghanistan.
Basingstoke: palgrave Macmillan.
Iacovou M, Pattieson D, Truby H, Palermo C.
Social health and nutrition impacts of community kitchens:
a systematic review.
Public Health Nutrition, 2011. 16(3): 535-543
IFPRI (1998),
“Urban Challenges to Food and Nutrition Security : A review
of Food Security, Health, and Caregiving in the cities” in
FCND Discussion Paper No 51
jones AD, Ngure FM, Pelto G, Young SL.
What are we assessing when we measure food security? A
compendium and review of current metrics.
Advances in Nutrition. 2013. 4:481-505
MCN-MoPH-UNODC (2009),
Afghanistan Drug Use Survey
MCN-MoPH-UNODC (2012),
Afghanistan Drug Report
Ministry of Public Health-UNICEF (2013),
National Nutrition Survey
Nord, M., Andrews, M. & Carlson, S. (2005).
Household Food Security in the United States, 2004, USDA
economic Research Service. Available at: http://www.ers.
usda.gov/publications/eRR11/
Peprah, K. Amoah, S.T., Akongbangre j. (2014) :
“Sack Farming : Innovation for Land Scarcity Farmers in
Kenya and Ghana” in International Journal of Innovatives
Research and Studies, vol.3, Issue 5.
Ruel, M.T et alii (1998),
‘Urban challenges to food and nutrition security: a review
of food security, health, and caregiving in the cities’ in
FCND (IFPRI) Discussion Paper, n¡51
Schütte, A (2006),
Searching for Security : Urban livelihoods in Kabul. Case
Study Series
Swindale, A., Bilinsky, P (2006),
Household Dietary Diversity Score (HDDS) for Measure-
ment of Household Food Access: Indicator Guide (v.2).
Washington, DC. FHI 360/FANtA.
True Consulting Group (2007),
Best Practices in urban agriculture : a background report
for the city of Kamloops to support development of a
urban agricultural strategy
UN (2004), Guiding Principles on Internal Displacement
UN-HABITAT (2012),
State of the World’s Cities 2012-2013 – Prosperities of
Cities
UNHCR (2004),
UNHCR Handbook for Repatriation and Reintegration
Activities
VAM (2010),
Kenya Urban Comprehensive Food Security & Vulnerability
Analysis (KU-CFSVA) and Nutrition Assessment
WFP (2008),
Food Security Assessment in Urban Areas of Tajikistan
WFP (2009),
Emergency Food Security Assessment Handbook, Second
edition

Urban Poverty RepoRtA Study of Poverty, Food Insecurity and Resilience in Afghan Cities