urban heat island modelling with adms-urban · environment: the lecce (it) case study....
TRANSCRIPT

Stephen Smith
ADMS-Urban & ADMS-Roads User Group Meeting
10th November 2016
London
Urban Heat Island
modelling with
ADMS-Urban:
London case study
ADMS-Urban & ADMS-Roads User Group Meeting 2016
Contents
• Motivation
• Theory & model overview
• Model applications
• Case Study: London
– Model configuration:
• Source data (land use & anthropogenic data)
• Meteorological data
• Model domain & receptor network
– Model results:
• Absolute temperatures
• Temperature perturbations
• Heat maps
• Summary
ADMS-Urban & ADMS-Roads User Group Meeting 2016
Motivation
• Local governments are increasingly interested in green
infrastructure, knowing it can lead to:
– elevated community health and well-being
– improvements in air quality
– reductions in the impact on the local climate
• Urban areas can have a large effect on the local climate, increasing
the temperature; known as the Urban Heat Island (UHI)
• New developments can be designed, constructed and operated with
minimal impact on the local climate
• Increasingly, the impact of new developments on local climate are
considered alongside the impacts on air quality
• ADMS-Urban has been developed to model changes in the local
climate due to land use and anthropogenic heat emissions allowing a
joined up approach to planning assessments

ADMS-Urban & ADMS-Roads User Group Meeting 2016
Theory & model overview
• Urban fabric and morphology influences climate
• Climate variations: local & city scale
• Meteorological conditions change:
– Wind speeds reduce
– Turbulent mixing increases
– Boundary layer height increases due to the increase in turbulent mixing
– Urban fabric retains more heat & has less moisture than rural areas – alters heat flux
balance
• Pollutant dispersion is influenced by meteorological variations. Also:
– Chemical reaction rates are temperature dependent (e.g. ozone production)
– UHI temperature increases alter relative plume buoyancy
due to high building densities
Availability of
water
Boundary layer height
Building fabric &
surface properties
Urban
morphology
Heat flux
variations
Radiation
(day)

ADMS-Urban & ADMS-Roads User Group Meeting 2016
Theory & model overview
• The surface energy balance equation defines how much heat is
available at the surface to be converted into surface sensible and
latent heat:
• Surface sensible heat flux, together with friction velocity and
temperature, define the upwind profile
Surface
Net radiation (long and short
wave)
Ground
heat flux
Surface
sensible
heat flux
Latent
heat flux + - = Anthropogenic
heat +

ADMS-Urban & ADMS-Roads User Group Meeting 2016
Theory & model overview
ADMS-Urban
Temperature &
Humidity
module
Temperature
& humidity
perturbations
from upwind
values
Meteorological
data
Detailed land
use dataset
Buildings
data Normalised building
volume data
Surface
roughness
Surface
albedo
Thermal
admittance
Surface resistance
to evaporation
Meteorological
measurements or
mesoscale model
output
SOURCE DATA INPUT DATA MODEL OUTPUT DATA
Buildings heat
emissions
Traffic heat
emissions
Temperature &
humidity variations
due to land use
Temperature & humidity
increments due to
anthropogenic heat sources
Traffic
data

ADMS-Urban & ADMS-Roads User Group Meeting 2016
• To date, primarily research applications
− Hamilton I, Stocker J, Evans S, Davies M and Carruthers D,
2014: The impact of the London Olympic Parkland on the
urban heat island. Journal of Building Performance
Simulation, 7, issue 2
− Virk G, Jansz A, Mavrogianni A, Mylona A, Stocker J and
Davies M, 2014: The effectiveness of retrofitted green and
cool roofs at reducing overheating in a naturally ventilated
office in London: Direct and indirect effects in current and
future climates. Indoor and Built Environment .
− Virk G, Jansz A, Mavrogianni A, Mylona A, Stocker J and
Davies M, 2015: Microclimate effects of green and cool roofs
in London and their impacts on energy use for a typical office
building. Energy and Buildings, 88, pp 214-228
− Maggiotto G, Buccolieri R, Santo M A, Leo L S and Di
Sabatino S, 2014: Validation of temperature-perturbation and
CFD-based modelling for the prediction of the thermal urban
environment: the Lecce (IT) case study. Environmental
Modelling and Software, 60, pp. 69-83
− Maggiotto G, Buccolieri R, Santo M A, Leo L S and Di
Sabatino S, 2014: Study of the urban heat island in Lecce
(Italy) by means of ADMS and ENVI-MET. Int. J. of
Environment and Pollution, 55, pp. 41-49
Model applications
3.5 km
Pre-Olympic temperature
perturbations to the upwind boundary
layer profile at 2m due to land use
variations 19:00 on 10/06/2006 overlaid
onto a map. © Crown copyright, All rights
reserved. 2009 Licence number 0100031673
Modelling
local land
use changes

ADMS-Urban & ADMS-Roads User Group Meeting 2016
• To date, primarily research applications
− Hamilton I, Stocker J, Evans S, Davies M and Carruthers D,
2014: The impact of the London Olympic Parkland on the
urban heat island. Journal of Building Performance
Simulation, 7, issue 2
− Virk G, Jansz A, Mavrogianni A, Mylona A, Stocker J and
Davies M, 2014: The effectiveness of retrofitted green and
cool roofs at reducing overheating in a naturally ventilated
office in London: Direct and indirect effects in current and
future climates. Indoor and Built Environment .
− Virk G, Jansz A, Mavrogianni A, Mylona A, Stocker J and
Davies M, 2015: Microclimate effects of green and cool roofs
in London and their impacts on energy use for a typical office
building. Energy and Buildings, 88, pp 214-228
− Maggiotto G, Buccolieri R, Santo M A, Leo L S and Di
Sabatino S, 2014: Validation of temperature-perturbation and
CFD-based modelling for the prediction of the thermal urban
environment: the Lecce (IT) case study. Environmental
Modelling and Software, 60, pp. 69-83
− Maggiotto G, Buccolieri R, Santo M A, Leo L S and Di
Sabatino S, 2014: Study of the urban heat island in Lecce
(Italy) by means of ADMS and ENVI-MET. Int. J. of
Environment and Pollution, 55, pp. 41-49
Model applications
Modelling
local climate
mitigation
scenarios
Daily temperature variations on green
and cool roof compared to ‘normal’ roof

ADMS-Urban & ADMS-Roads User Group Meeting 2016
• To date, primarily research applications
− Hamilton I, Stocker J, Evans S, Davies M and Carruthers D,
2014: The impact of the London Olympic Parkland on the
urban heat island. Journal of Building Performance
Simulation, 7, issue 2
− Virk G, Jansz A, Mavrogianni A, Mylona A, Stocker J and
Davies M, 2014: The effectiveness of retrofitted green and
cool roofs at reducing overheating in a naturally ventilated
office in London: Direct and indirect effects in current and
future climates. Indoor and Built Environment .
− Virk G, Jansz A, Mavrogianni A, Mylona A, Stocker J and
Davies M, 2015: Microclimate effects of green and cool roofs
in London and their impacts on energy use for a typical office
building. Energy and Buildings, 88, pp 214-228
− Maggiotto G, Buccolieri R, Santo M A, Leo L S and Di
Sabatino S, 2014: Validation of temperature-perturbation and
CFD-based modelling for the prediction of the thermal urban
environment: the Lecce (IT) case study. Environmental
Modelling and Software, 60, pp. 69-83
− Maggiotto G, Buccolieri R, Santo M A, Leo L S and Di
Sabatino S, 2014: Study of the urban heat island in Lecce
(Italy) by means of ADMS and ENVI-MET. Int. J. of
Environment and Pollution, 55, pp. 41-49
Model applications
Temperature maps for two sites in
Lecce, Italy where ADMS model
output is compared to ENVI-met
20:00 on 10/08/2012
City-scale modelling
& comparisons to
other models
ADMS-Urban & ADMS-Roads User Group Meeting 2016
• To date, primarily research applications
• The Temperature & Humidity module will be available* as part
of ADMS-Urban 4.1 for commercial applications
– Currently being used by Barcelona Regional to model the
Barcelona Urban Heat Island
– Used for climate modelling in ‘Coupling Regional and Urban
processes: Effects on Air Quality’ project (NERC)
Model applications
*extended licence required
ADMS-Urban & ADMS-Roads User Group Meeting 2016
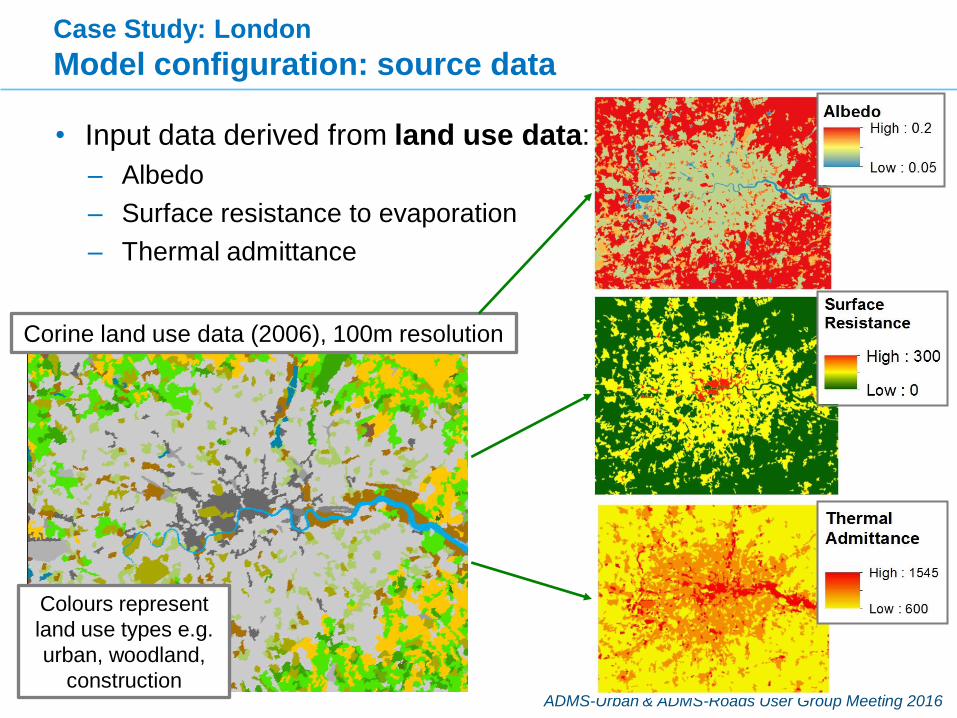
Case Study: London
Model configuration: source data
• Input data derived from land use data:
– Albedo
– Surface resistance to evaporation
– Thermal admittance
Corine land use data (2006), 100m resolution
Colours represent
land use types e.g.
urban, woodland,
construction

ADMS-Urban & ADMS-Roads User Group Meeting 2016
• Input data derived from buildings data:
– Roughness
– Normalised building volume
– Buildings anthropogenic heat
Domestic & non-
domestic
building density
Colours are of non-
domestic buildings
within each ward
Case Study: London
Model configuration: source data
© Crown Copyright and Database Right
2015. Ordnance Survey (Digimap Licence)
Use 3-D buildings
data to calculate
parameters λp and
λF (ArcGIS tools)
Use typical heat
emission rates
(W/m2)

ADMS-Urban & ADMS-Roads User Group Meeting 2016
• Input data derived from road traffic data:
– Road traffic anthropogenic heat
Traffic emissions
inventory data
Roads are scaled
by CO2 emission
rates (g/km/s)
Case Study: London
Model configuration: source data
Model converts CO2
emission rates to heat
energy emission rates
(W/km)
ADMS-Urban & ADMS-Roads User Group Meeting 2016
0
0
3
1.5
6
3.1
10
5.1
16
8.2
(knots)
(m/s)
Wind speed
0° 10°20°
30°
40°
50°
60°
70°
80°
90°
100°
110°
120°
130°
140°
150°
160°170°180°190°
200°
210°
220°
230°
240°
250°
260°
270°
280°
290°
300°
310°
320°
330°
340°350°
100
200
300
400
500
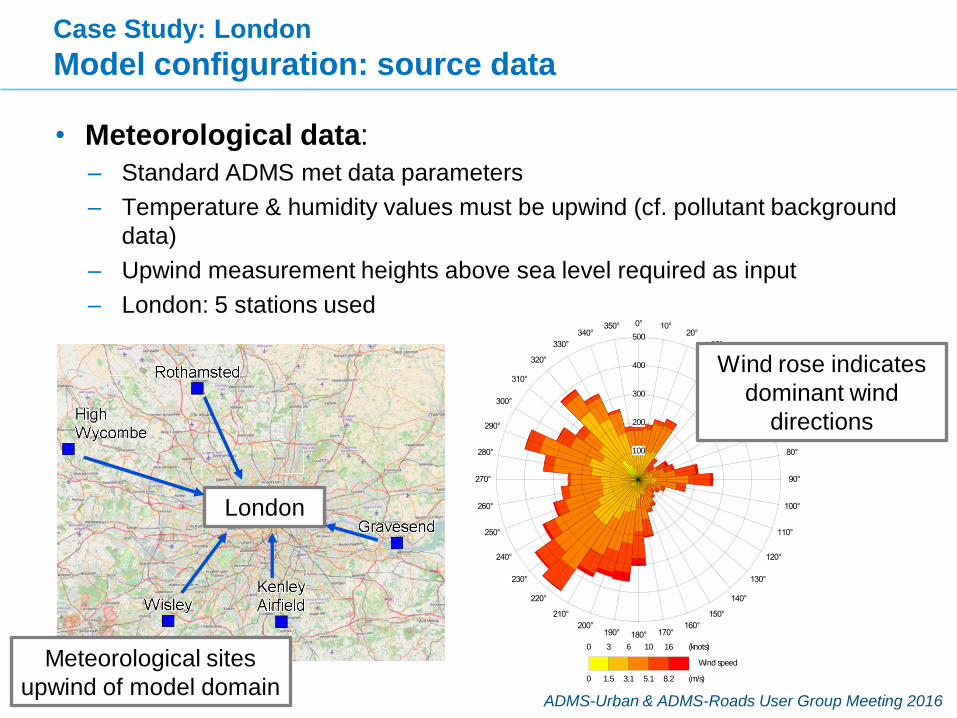
• Meteorological data:
– Standard ADMS met data parameters
– Temperature & humidity values must be upwind (cf. pollutant background
data)
– Upwind measurement heights above sea level required as input
– London: 5 stations used
London
Case Study: London
Model configuration: source data
Meteorological sites
upwind of model domain
Wind rose indicates
dominant wind
directions
ADMS-Urban & ADMS-Roads User Group Meeting 2016
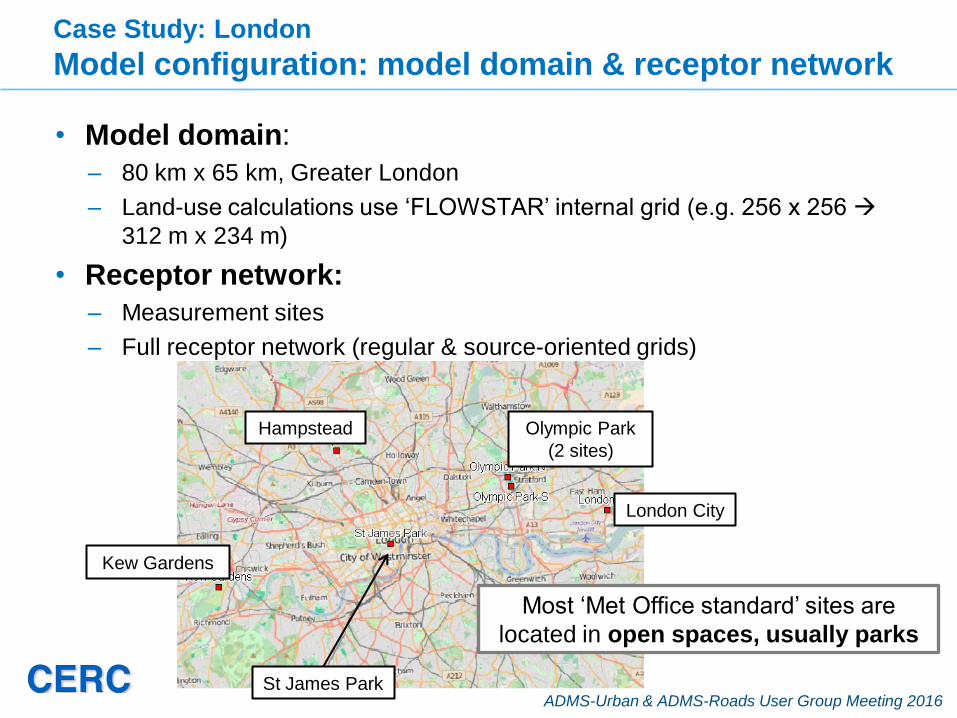
• Model domain:
– 80 km x 65 km, Greater London
– Land-use calculations use ‘FLOWSTAR’ internal grid (e.g. 256 x 256
312 m x 234 m)
• Receptor network:
– Measurement sites
– Full receptor network (regular & source-oriented grids)
Case Study: London
Model configuration: model domain & receptor network
Most ‘Met Office standard’ sites are
located in open spaces, usually parks
Olympic Park
(2 sites)
London City
Kew Gardens
St James Park
Hampstead
ADMS-Urban & ADMS-Roads User Group Meeting 2016
• Absolute temperatures:
– Box and whisker plot
– Frequency scatter plots
• Temperatures perturbations
– Box and whisker plot
– Average diurnal profiles
• August and January 2012
• Note
– Calculation grid resolution may not resolve land use inputs
– Unrefined receptor locations
Case Study: London
Model results

ADMS-Urban & ADMS-Roads User Group Meeting 2016
• Absolute temperatures (August 2012)
– Box and whisker plot
– The ‘box’ shows the 25th, 50th and 75th percentiles*
Case Study: London
Model results: absolute temperatures Tem
pe
ratu
re °
C
*The inter-quartile range
(IQR) = 75th %ile - 25th%ile.
Lower whisker = the lowest
concentration value still
within 1.5 x IQR of the lower
quartile. Upper whisker = the
highest concentration value
still within 1.5 x IQR of the
upper quartile.

ADMS-Urban & ADMS-Roads User Group Meeting 2016
• Absolute temperatures (August 2012):
– Frequency scatter plots of hourly temperatures
– How does it compare to just using upwind temperatures?
Case Study: London
Model results: absolute temperatures
Urban modelled vs.
urban observed
Rural upwind vs.
urban observed
30°C
30°C
ADMS-Urban & ADMS-Roads User Group Meeting 2016
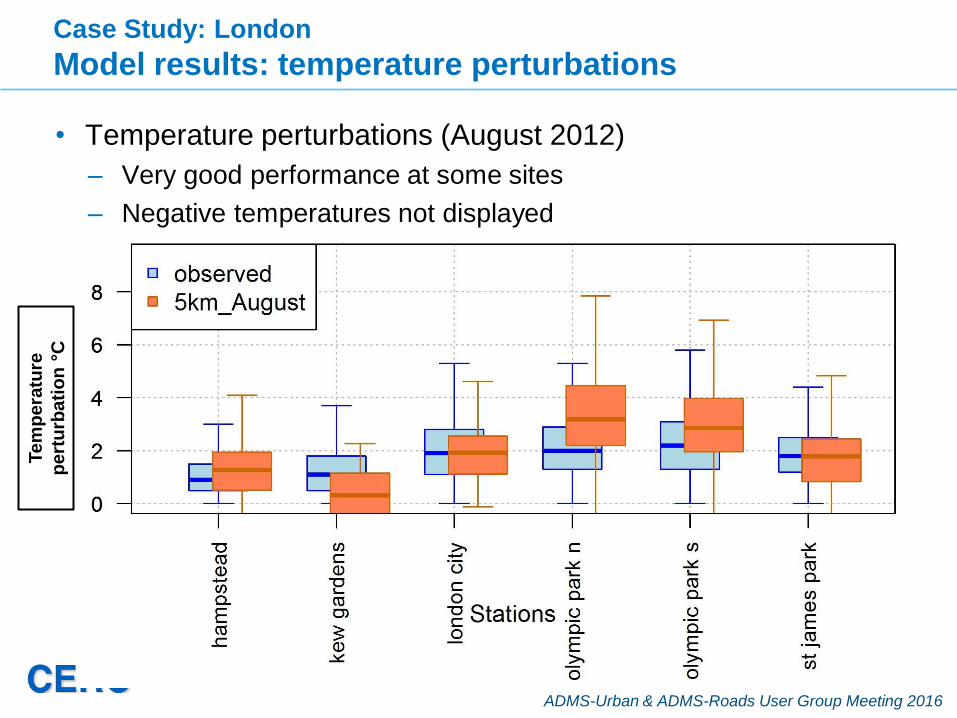
• Temperature perturbations (August 2012)
– Very good performance at some sites
– Negative temperatures not displayed
Case Study: London
Model results: temperature perturbations Tem
pera
ture
pert
urb
ati
on
°C

ADMS-Urban & ADMS-Roads User Group Meeting 2016
• Temperature perturbations (August 2012) relative to upwind
Case Study: London
Model results: temperature perturbations
Tem
pe
ratu
re
pe
rtu
rba
tio
n °
C
Hour of the day
Corine land use data from 2006, site re-
developed for the Olympics (greener)
Missing anthropogenic
heat source on site?
ADMS-Urban & ADMS-Roads User Group Meeting 2016
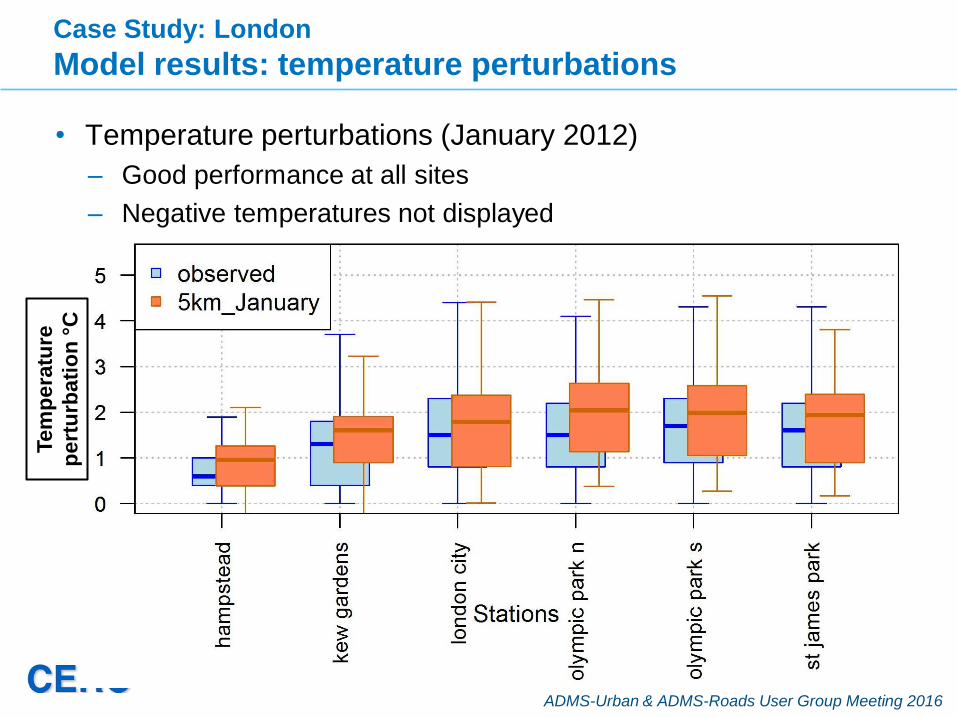
• Temperature perturbations (January 2012)
– Good performance at all sites
– Negative temperatures not displayed
Case Study: London
Model results: temperature perturbations Tem
pe
ratu
re
pe
rtu
rba
tio
n °
C

ADMS-Urban & ADMS-Roads User Group Meeting 2016
Case Study: London
Model results: heat maps
ADMS-Urban modelled surface
temperature (°C) (18 August 2012)
LandSat image of land surface
temperature (°C) (26th June 2011) with
Greater London area border overlaid.
Taken from “Reducing urban heat risk
A study on urban heat risk mapping
and visualisation” July 2014
© Arup / UK Space Agency
Example satellite image of land
surface temperature (June 2011)
Example modelled temperature
~ 3.0 m (August 2012)

ADMS-Urban & ADMS-Roads User Group Meeting 2016
• Example daily variations (August 2012)
Case Study: London
Model results: heat maps
7 am
Midnight 7 pm
Midday
Temperature
perturbation °C
Specif ied points (14)
Temp pert (°C), 7 am
-6
-4
-2
0
2
4
6
8
10
ADMS-Urban & ADMS-Roads User Group Meeting 2016
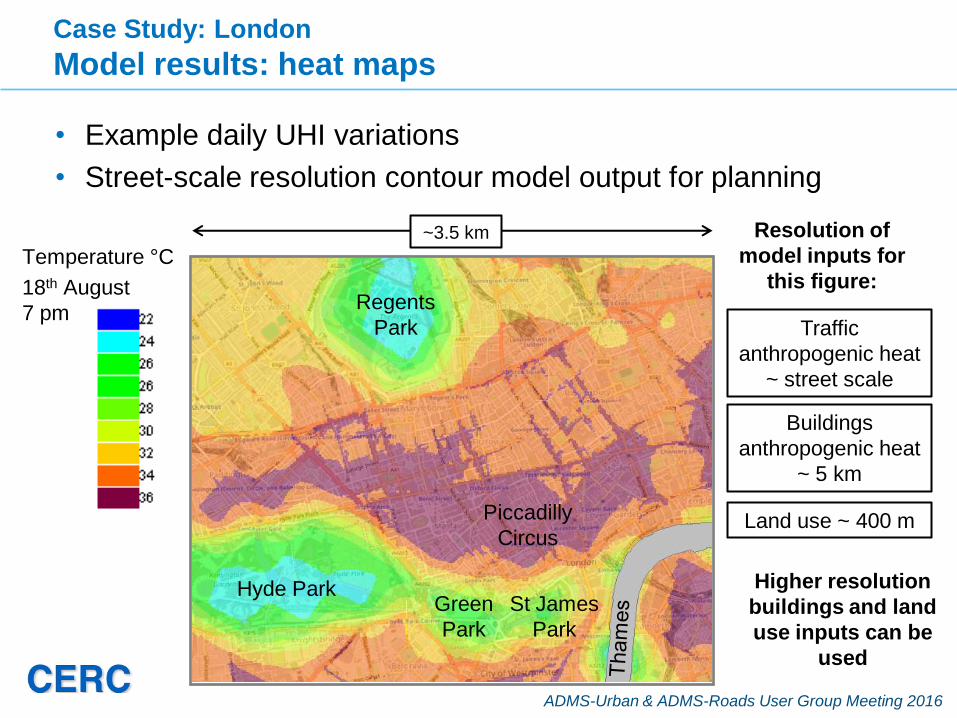
• Example daily UHI variations
• Street-scale resolution contour model output for planning
Case Study: London
Model results: heat maps
Temperature °C
18th August
7 pm
Land use ~ 400 m
Traffic
anthropogenic heat
~ street scale
Buildings
anthropogenic heat
~ 5 km
~3.5 km
Hyde Park Green
Park
St James
Park
Regents
Park
Piccadilly
Circus
Resolution of
model inputs for
this figure:
Higher resolution
buildings and land
use inputs can be
used

ADMS-Urban & ADMS-Roads User Group Meeting 2016
• Example daily UHI variations
• Street-scale resolution contour model output for planning
• Model validation at all site types e.g. data from
wunderground.com
Case Study: London
Model results: heat maps
~4° UHI even on a
cloudy late afternoon
in the autumn

ADMS-Urban & ADMS-Roads User Group Meeting 2016
Summary
• ADMS-Urban 4.1 will include a ‘Temperature & Humidity’
module*
• Good model performance at the city scale
• Ongoing projects to validate at the local scale
• As for air quality, ADMS-Urban is able to model hourly
temperature and humidity variations to a high spatial resolution
• Applications include:
– Planning applications
– Climate change mitigation scenarios
– UHI modelling *extended licence required

ADMS-Urban & ADMS-Roads User Group Meeting 2016
Any questions?