upstream and downstream horizontal r&d networksepubs.surrey.ac.uk/430841/1/upstream and...
TRANSCRIPT
Upstream and downstream horizontal R&D networks�
Dusanee Kesavayuthy Vasileios Zikosz
Abstract
The existing literature on R&D networks has focused on networks among �rms who
compete in the product market (downstream networks). This article develops the literature
by casting the analysis in the context of a vertically related industry, where both downstream
�rms and their upstream suppliers can form horizontal R&D networks.
Our analysis suggests that economic factors, such as within-network R&D spillovers, may
be the driving forces behind the equilibrium network formations. Moreover, the equilibrium
upstream R&D network may have the same architecture as the downstream R&D network
or may di¤er from it. Interestingly, we �nd that stable networks can be socially optimal,
but only in the case where their architectures di¤er across market tiers.
Keywords: Networks, R&D collaboration, input suppliers.
JEL Classi�cation: L13, J50.
�Particular appreciation is expressed to an anonymous referee for very helpful comments.ySchool of Economics, University of the Thai Chamber of Commerce, 126/1 Vibhavadee-Rangsit Road, Din-
daeng, Bangkok, 10400, Thailand. Email: [email protected] author: Department of Economics, University of Surrey, Guildford, Surrey, GU2 7XH, United
Kingdom, Email: [email protected]; and Research Institute for Policy Evaluation and Design, University ofthe Thai Chamber of Commerce, 126/1 Vibhavadee-Rangsit Road, Dindaeng, Bangkok, 10400, Thailand, Email:[email protected].
1
1 Introduction
The incentives for R&D cooperation among competing �rms have been studied extensively in
the literature. The main message is that, in the absence of R&D cooperation, research activity
creates involuntary knowledge spillovers. The creation of such spillovers �which contribute
positively to the R&D stock of rival �rms �imply that innovating �rms cannot appropriate fully
the returns from R&D. This suggests that R&D cooperation can help to internalize spillovers.
A generic �nding is that su¢ ciently large spillovers make R&D cooperation worthwhile and
thereby expand both R&D spending and social welfare (see e.g. d�Aspremont and Jacquemin,
1988; Kamien et al., 1992; Suzumura, 1992; and Belderbos et al., 2004, for empirical evidence).1
During the 1980s and throughout the 1990s, we witnessed a substantial increase in the
number of R&D alliances. The upsurge in R&D alliances re�ects that non-equity forms of
collaboration, such as R&D networks, are steadily becoming more popular relative to equity
forms, such as research joint ventures (RJVs hereafter).2 This empirical pattern has led to the
so-called �age of alliance capitalism�(Dunning, 1995; Narula and Duysters, 2004), where hi-tech
companies engage in a variety of research projects to share know-how and enhance technological
capabilities. A related observation is that in many industries the �locus of innovation�is not so
much the �rm (i.e. a single entity) but a network of R&D alliances where the �rm is embedded
(Powell, Koput and Smith-Doerr, 1996).
The growth of R&D partnerships through networks is also re�ected in the development
of a new strand of literature, distinct from that of RJVs.3 The �rst study to investigate the
impact of product-market competition on R&D network formation is that of Goyal and Moraga-
González (2001). In their pioneering work, they considered a three-stage game: in stage one,
�rms choose their bilateral collaborative links, prior to undertaking their R&D investments in
stage two, and then competing in a Cournot fashion (stage 3). The focus of the analysis is
on the relationships between market competition, R&D incentives and network architecture.
The �ndings suggest that individual incentives to form collaborations are likely to be excessive
1Empirical work has also explored the determinants of R&D cooperation, focusing mainly on the role of �rmsize and R&D intensity (Kaizer, 2002; Leiponen, 2001; Veugelers, 1997).
2For example, Hagedoorn (2002) reports that, in fast-growing innovative industries like computers, telecom-munications and pharmaceuticals, non-equity R&D partnerships reached a total share of more than 90% in allR&D partnerships. This upward trend re�ects that non-equity partnerships allow for greater �exibility relativeto more traditional forms of inter-�rm collaboration �and thereby allow �rms to adapt more e¤ectively to anenvironment characterised by rapid technological change and uncertainty.
3Closer in spirit to the network approach is the �RJV competition�model proposed by Kamien et al. (1992),which is an exception to the norm of R&D co-operation.
2
from a collective viewpoint. Recently, this seminal contribution has been extended in a number
of directions (see e.g. Deroian and Gannon, 2006; Song and Vannetelbosch, 2007; Mauleon et
al., 2008; Westbrock, 2010; Zikos, 2010; Zirulia, 2011; Zu et al., 2011). However, the existing
literature has mainly concentrated on R&D networks in the context of a one-tier industry, where
�rms compete in the product market.4
We develop this literature by casting the analysis in the context of a vertically related in-
dustry, and by allowing not only downstream but also upstream �rms to form horizontal R&D
networks. We analyze the �rms� network formation decisions at both market tiers simulta-
neously, because the upstream R&D network may have an impact on the �stability� of the
downstream network (and vice versa). Intuitively, a more successful upstream �rm (through
its R&D network) can transform its downstream counterpart into a more aggressive competi-
tor. At the same time, a more successful downstream �rm, who bene�ts from its horizontal
collaborations with other �rms, can secure greater pro�t for its upstream supplier. We address
the following questions: Which network architectures will emerge endogenously at the upstream
and downstream market tier of a vertically related industry? Do equilibrium networks maximize
the aggregate level of e¤ective R&D, industry pro�ts and/or social welfare?
A natural way to examine which R&D network architectures will emerge endogenously is to
adopt Jackson and Wolinsky�s (1996) concept of pairwise stability. This concept allows at most
a pair of �rms to alter the network structure at a time. We also enrich the network formation
process by adopting the concept of strong stability developed by Jackson and Van de Nouweland
(2005), which allows any coalition of �rms to deviate between alternative network formations.
In the context of a model consisting of three upstream and three downstream �rms, we show
that, under certain conditions, di¤erent industry structures can be �stable�as upstream and/or
downstream spillovers vary. Speci�cally, if R&D spillovers within-the-upstream network are suf-
�ciently large while R&D spillovers within-the-downstream network are su¢ ciently small, then
downstream �rms as well as their corresponding upstream suppliers may form horizontal R&D
networks which are partially connected. A partial network architecture is asymmetric in that
it includes two of the �rms (at each market tier) but excludes the third. Yet if R&D spillovers
within-the-upstream network are su¢ ciently small, then more R&D links will be established
within the industry (to o¤set the lower degree of spillovers): that is, both the downstream �rms
4A notable exception is Mauleon, Sempere-Monerris and Vannetelbosch (2008).
3
and their upstream suppliers will opt for complete R&D networks. Finally, when upstream
spillovers are su¢ ciently large but downstream spillovers are intermediate, then the equilibrium
upstream network is likely to be di¤erent from the downstream network. Speci�cally, we show
that a partial upstream network might coexist with a complete downstream network. We may
conclude that R&D spillovers, both within the upstream and downstream R&D network, play
an important, yet complex role, in explaining the �rms�network formation decisions.
Closest in spirit to our approach is the article by Mauleon, Sempere-Monerris and Van-
netelbosch (2008) �hereafter MSV �who extend and enrich the existing literature by studying
network formation in the presence of �rm-level labour unions.5 The authors show that, as long
as each �rm settles its own wage, the partial R&D network arises as a strongly stable archi-
tecture,6 whereas the complete R&D network emerges when all the relevant bargaining power
rests with the unions. This implies that stronger unions may promote the formation of R&D
networks. Like MSV, we also cast the analysis in the context of a vertically related industry, but
focus instead on the network formation decisions of both downstream �rms and their upstream
suppliers (who represent labour unions in MSV).
As well as having theoretical signi�cance, we suggest that the present analysis is of empirical
value in light of the observed proliferation of R&D alliances in vertically related industries. The
upsurge in R&D alliances is perhaps most obvious in hi-tech industries such as computers, phar-
maceuticals and telecommunications. For instance, in the computer industry, �rms specialize
in di¤erent market layers, as it is rather di¢ cult for individual �rms to develop technological
capabilities by relying solely on internal research (Cloodt et al., 2006). Within this industry,
upstream �rms are active in di¤erent �elds such as microprocessors (e.g. Intel, Motorola, Texas
Instruments, AMD), software (e.g. IBM, Microsoft, Sun Microsystems, Oracle) and telecom-
munication technologies (e.g. Ericsson, AT&T, Siemens). Cloodt et al. (2006), Palmberg and
Martikainen (2003), among others, identi�ed 121 newly formed R&D partnerships by Intel,
Motorola, Texas Instruments and AMD during the period 1990-1999. Yet R&D partnerships
are common not only between upstream but also between downstream �rms such as personal
computer manufacturers (e.g. Compaq, Dell, Sony, Hewlett-Packard).7 This body of empirical
5We note that labour unions can be thought of as being upstream �rms in the present setting.6MSV qualify this result by showing that the partial network emerges as long as within-network spillovers are
su¢ ciently large.
7Needless to say, R&D collaborations are not only horizontal but also vertical. For vertical R&D collaborationssee, for example, Attalah (2002) for a theoretical framework; and Cassiman and Veugelers (2002) for empirical
4
evidence is an additional motivation for our article.
The article is structured as follows. Section 2 presents our model. Section 3 studies the
upstream and downstream �rms�decisions to form horizontal R&D networks. Section 4 consid-
ers the potential implications of the stable network formations, focusing on aggregate e¤ective
R&D, industry pro�ts and social welfare. Section 5 discusses various aspects of our results,
particularly their relation to the literature and certain assumptions of our model. The last
section concludes the article.
2 The model
We carry out our analysis in a modi�ed version of the R&D network formation model proposed
by MSV. The key di¤erences with our model are the following. First, we postulate that both the
downstream �rms and their upstream suppliers (labour unions in MSV) undertake process R&D
investments. Second, we study simultaneously the stability of the upstream and downstream
R&D networks.8
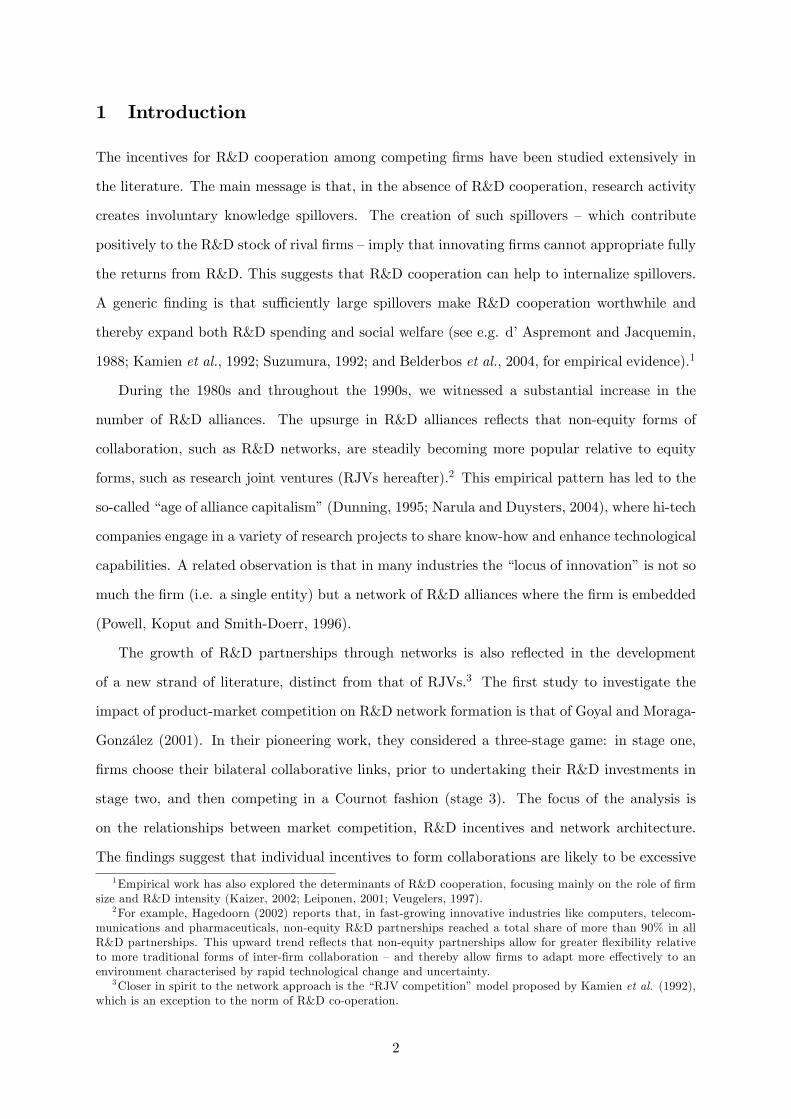
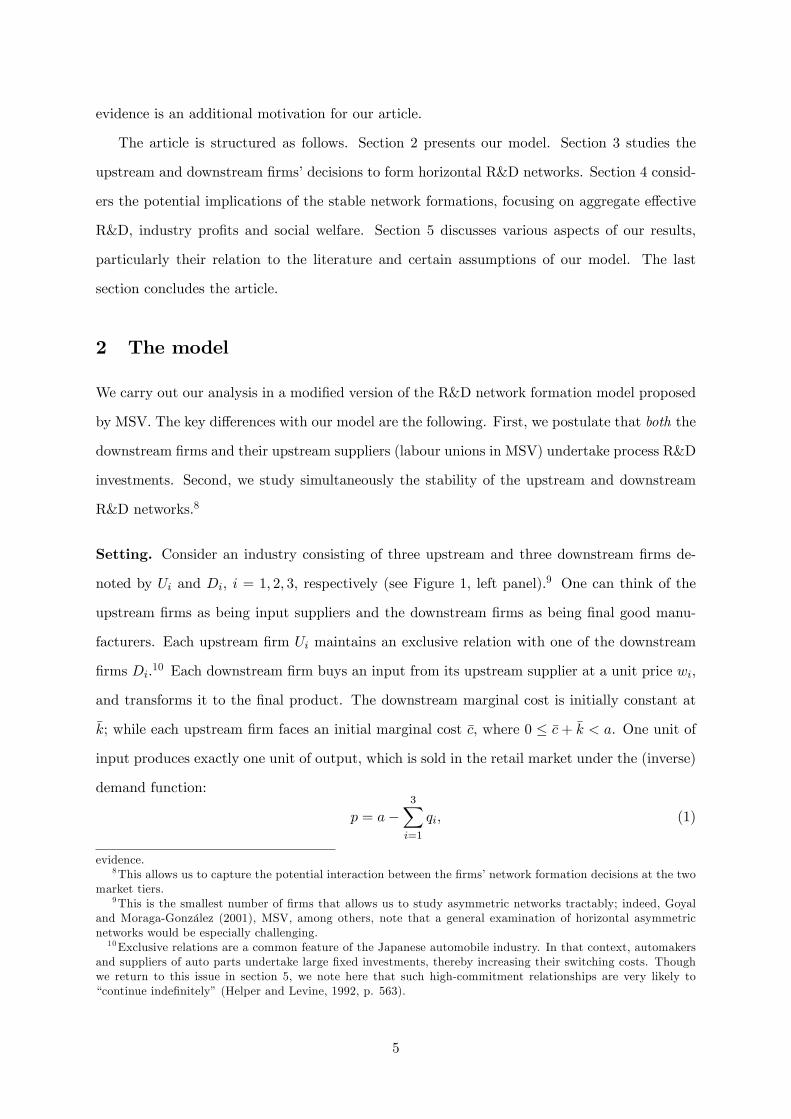
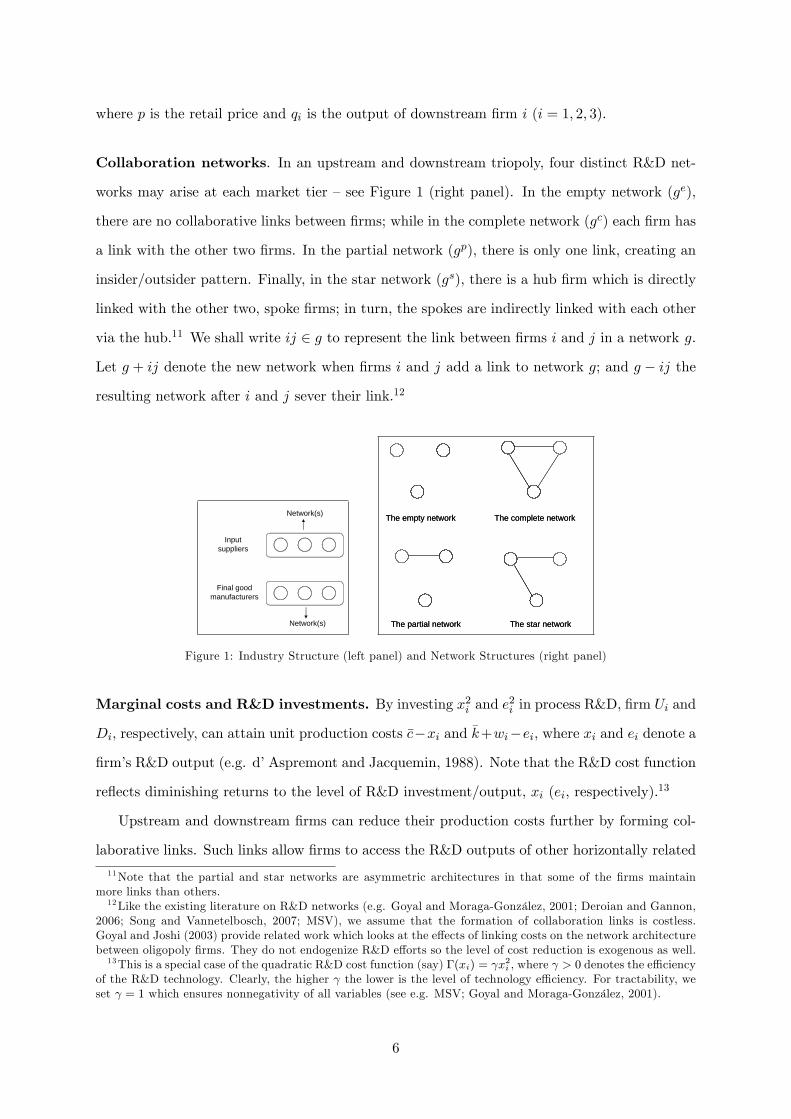
Setting. Consider an industry consisting of three upstream and three downstream �rms de-
noted by Ui and Di, i = 1; 2; 3, respectively (see Figure 1, left panel).9 One can think of the
upstream �rms as being input suppliers and the downstream �rms as being �nal good manu-
facturers. Each upstream �rm Ui maintains an exclusive relation with one of the downstream
�rms Di.10 Each downstream �rm buys an input from its upstream supplier at a unit price wi,
and transforms it to the �nal product. The downstream marginal cost is initially constant at
�k; while each upstream �rm faces an initial marginal cost �c, where 0 � �c+ �k < a. One unit of
input produces exactly one unit of output, which is sold in the retail market under the (inverse)
demand function:
p = a�3Xi=1
qi, (1)
evidence.8This allows us to capture the potential interaction between the �rms�network formation decisions at the two
market tiers.9This is the smallest number of �rms that allows us to study asymmetric networks tractably; indeed, Goyal
and Moraga-González (2001), MSV, among others, note that a general examination of horizontal asymmetricnetworks would be especially challenging.10Exclusive relations are a common feature of the Japanese automobile industry. In that context, automakers
and suppliers of auto parts undertake large �xed investments, thereby increasing their switching costs. Thoughwe return to this issue in section 5, we note here that such high-commitment relationships are very likely to�continue inde�nitely�(Helper and Levine, 1992, p. 563).
5
where p is the retail price and qi is the output of downstream �rm i (i = 1; 2; 3).
Collaboration networks. In an upstream and downstream triopoly, four distinct R&D net-
works may arise at each market tier �see Figure 1 (right panel). In the empty network (ge),
there are no collaborative links between �rms; while in the complete network (gc) each �rm has
a link with the other two �rms. In the partial network (gp), there is only one link, creating an
insider/outsider pattern. Finally, in the star network (gs), there is a hub �rm which is directly
linked with the other two, spoke �rms; in turn, the spokes are indirectly linked with each other
via the hub.11 We shall write ij 2 g to represent the link between �rms i and j in a network g.
Let g + ij denote the new network when �rms i and j add a link to network g; and g � ij the
resulting network after i and j sever their link.12
Inputsuppliers
Final goodmanufacturers
Network(s)
Network(s)
The complete network
The star network
The empty network
The partial network
The complete network
The star network
The empty network
The partial network
Figure 1: Industry Structure (left panel) and Network Structures (right panel)
Marginal costs and R&D investments. By investing x2i and e2i in process R&D, �rm Ui and
Di, respectively, can attain unit production costs �c�xi and �k+wi�ei, where xi and ei denote a
�rm�s R&D output (e.g. d�Aspremont and Jacquemin, 1988). Note that the R&D cost function
re�ects diminishing returns to the level of R&D investment/output, xi (ei, respectively).13
Upstream and downstream �rms can reduce their production costs further by forming col-
laborative links. Such links allow �rms to access the R&D outputs of other horizontally related
11Note that the partial and star networks are asymmetric architectures in that some of the �rms maintainmore links than others.12Like the existing literature on R&D networks (e.g. Goyal and Moraga-González, 2001; Deroian and Gannon,
2006; Song and Vannetelbosch, 2007; MSV), we assume that the formation of collaboration links is costless.Goyal and Joshi (2003) provide related work which looks at the e¤ects of linking costs on the network architecturebetween oligopoly �rms. They do not endogenize R&D e¤orts so the level of cost reduction is exogenous as well.13This is a special case of the quadratic R&D cost function (say) �(xi) = x2i , where > 0 denotes the e¢ ciency
of the R&D technology. Clearly, the higher the lower is the level of technology e¢ ciency. For tractability, weset = 1 which ensures nonnegativity of all variables (see e.g. MSV; Goyal and Moraga-González, 2001).
6
�rms. Let the subscript u denote an upstream R&D network and the subscript d a downstream
R&D network. Following MSV �and given a network pro�le (gnu ; gnd ), where n = c; p; s; e �the
marginal cost of �rm Ui and Di, respectively, is:
cUi(gnu ; g
nd ) = �c� xi � �
�xjt(ij)
+xkt(ik)
�, (2)
cDi(gnu ; g
nd ) =
�k + wi � ei � ��ejt(ij)
+ekt(ik)
�, i 6= j 6= k, i; j; k 2 f1; 2; 3g. (3)
In eq. (2) and (3), � 2 (0; 1] and � 2 (0; 1] denote the rate of knowledge transmission within an
upstream and downstream R&D network, respectively, i.e. within-network R&D spillovers.14
Within-network spillovers depend on the �distance� between collaborating �rms, where t(ij)
refers to the distance between a pair of �rms i and j in terms of the number of links in the
shortest path between them. Following again MSV, we set t(ij) =1 to denote the absence of
a path between �rms i and j.15
From eq. (2) and (3), the �e¤ective�R&D output of �rm Ui and Di, respectively, is:
XUi � xi + ��xjt(ij)
+xkt(ik)
�, (4)
XDi � ei + ��ejt(ij)
+ekt(ik)
�: (5)
This represents the overall reduction in a �rm�s marginal cost as a result of R&D. It consists
of �rm i�s own R&D output, xi (respectively, ei), and the sum of the R&D outputs that �rm i
can access through collaborative links with other horizontally related �rms.16 As eq. (4) and
(5) suggest, �rm i can access only a proportion � (respectively, �) of its partners�R&D outputs.
Pro�ts. For a given network pro�le, (gnu ; gnd ), the pro�ts of an upstream �rm Ui and a down-
stream �rm Di are, respectively:
�Ui(gnu ; g
nd ) = [wi(g
nu ; g
nd )� cUi(gnu ; gnd )] qi(gnu ; gnd )� [xi(gnu ; gnd )]
2 ; and (6)
�Di(gnu ; g
nd ) = [p(g
nu ; g
nd )� cDi(gnu ; gnd )]qi(gnu ; gnd )� [ei(gnu ; gnd )]
2 . (7)
14We thus allow spillovers at the two market tiers not to be necessarily of the same size. We note that potentialdi¤erences in the size of within-network spillovers can result from various sources, such as absorptive capacityand the e¢ ciency of communication channels between collaborating �rms (Attalah, 2002).15Note that if �rms i and j are directly linked, then t(ij) = 1.16For example, in an upstream complete network (say), XUi = xi + �(xj + xk), i 6= j 6= k, i; j; k 2 f1; 2; 3g.
7
The �rst term to the right of eq. (6) captures Ui�s wholesale pro�t. Wholesale pro�t is
the product of the sales volume (qi) and the relevant wholesale pro�t margin. The wholesale
pro�t margin is the di¤erence between the input price (wi) that an upstream �rm charges
and its marginal cost (cUi). In turn, both the input price and marginal cost depend on the
industry structure, (gnu ; gnd ), as well as the position of trading partners Ui and Di within it.
Likewise, eq. (7) re�ects Di�s retail pro�t, which is the product of its sales volume and retail
pro�t margin. The retail pro�t margin is the di¤erence between the retail price (p) and the
downstream marginal cost (cDi).
Timing of events. Upstream and downstream �rms play a four-stage game. In stage one,
the upstream and downstream �rms choose simultaneously their collaborative links to form
horizontal R&D networks. The collection of pairwise links between the upstream (downstream)
�rms de�nes an upstream (downstream) horizontal R&D network, as shown in Figure 1 (right
panel). In stage two, the upstream and downstream �rms choose simultaneously and indepen-
dently their R&D investments (xi and ei, respectively). In stage three, the upstream �rms set
simultaneously their wholesale quantities, resulting in input prices wi � 0. In stage four, the
downstream �rms choose their output levels (qi).
The timing above re�ects that the selection of collaborative links is a long-run and strategic
decision for an upstream and a downstream �rm. This is motivated by the empirical obser-
vation that �rms ask for �strong commitment� from their partners (in terms of involvement
and resources) in order to establish R&D alliances (Hagedoorn, 2002, p. 479).17 In addition,
the timing above which is standard in the R&D network literature captures that the choice of
the R&D investments is longer-run decision than the exact level of wholesale prices. This is
because R&D activity is inherently uncertain, so it may require a relatively long time to come
into fruition; while input prices can be changed more easily and more often (perhaps responding
to small changes in market conditions).
Notation. We shall use the following notation throughout the article. Let the superscripts h
and s denote, respectively, the hub and spoke �rms in a star network (gs); and let the superscript
17 It is worth noting that, by asking for �strong commitment�, �rms try to limit a potential failure of R&Dalliances. The possibility that an R&D alliance fails may be related either with the highly uncertain nature ofR&D activity or with strategic reasons such as an incentive for a �rm to terminate an agreement after it hasbene�ted by more compared to its research partners (Narula and Hagedoorn, 1999). In spite of this possibility,as Narula and Hagedoorn (2004, p. 202) point out, R&D alliances �stand out in terms of their e¤ectiveness�compared to other types of alliances (e.g. sales and marketing alliances).
8
l refer to a linked �rm in the partial network (gp).
3 Main analysis
We solve the game backwards from stage 4 to stage 2. We then turn to the �rst stage for which
we obtain the set of �stable� networks. To this end we use two well-established equilibrium
concepts ��pairwise stability�and �strong stability�.
3.1 Pairwise stability
A simple way to analyze which network architectures are likely to emerge in the present setting
is to consider the concept of pairwise stability. Following Jackson and Wolinsky (1996), we say
that a network is pairwise stable if no �rm has an incentive to delete unilaterally one of its links
and no pair of �rms want to add a new link between them (with one bene�ting strictly and the
other at least weakly).
Because there are 4 network structures that can possibly emerge at each market tier, there
are 16 qualitatively di¤erent industry structures in the present setting. To pin down the pairwise
stable industry structures we proceed as follows. We take as given the network structure at one
of the market tiers, the downstream (say), and ask what network structures will endogenously
emerge between the upstream �rms.18 We then turn to study what R&D networks will arise
between the downstream �rms for a given network between the upstream �rms. Finally, to
determine the equilibrium R&D networks at both market tiers simultaneoulsy, we note that the
network pro�le (gnu ; gnd ), where n = c; p; s; e, is �stable�if and only if the R&D network at one
market tier is a best response to the R&D network at the other market tier.
We now characterize the set of pairwise stable networks. This tells us about the upstream
and downstream �rms�incentives to form collaborative links. The following lemma summarizes
our �ndings.
Lemma 1 In the parameter space (�; �), the following industry structures emerge endogenously
as pairwise stable:
(i) (gcu; gcd) for all parameter con�gurations.
(ii) (gpu(ij); gpd(ij)) if � is su¢ ciently large and � is su¢ ciently small.
18For example, if we ��x�the downstream R&D network to the complete network (say), then upstream �rmscan opt for a complete, partial, star or empty network.
9

(iii) (gpu; gcd) if � is su¢ ciently large.
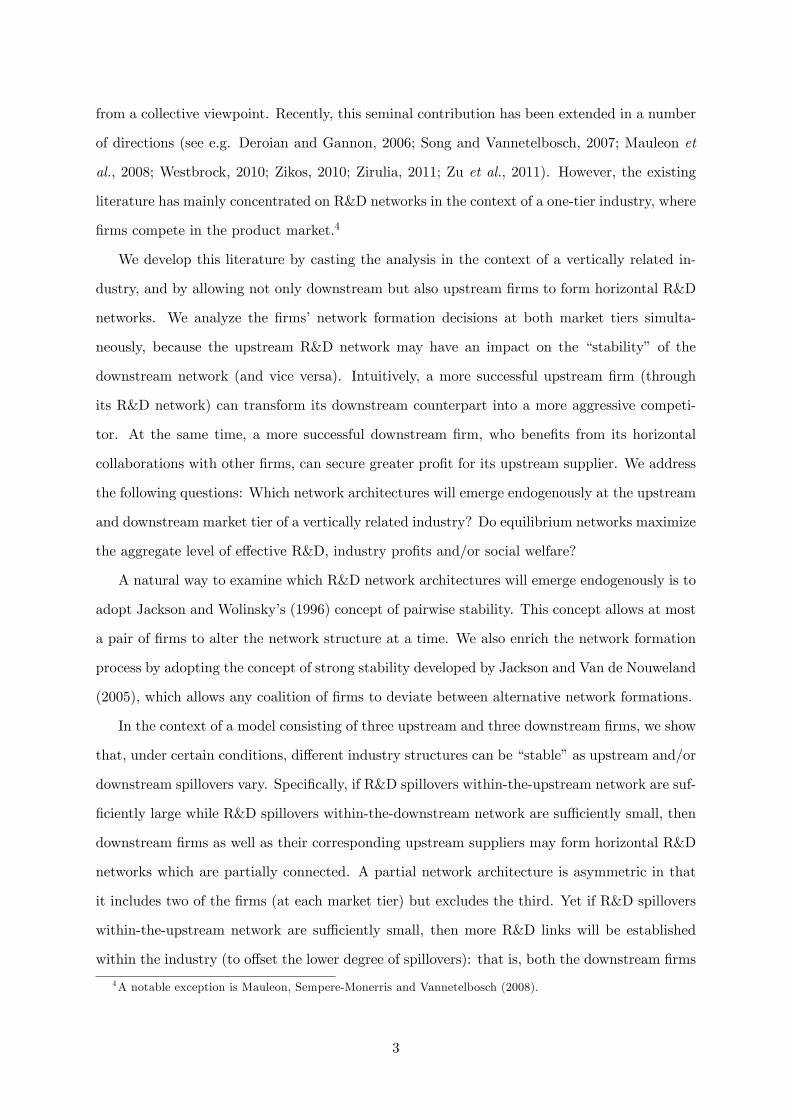
Figure 2 shows the pairwise stable industry structures in the present setting. In particular,
the industry structure (gcu; gcd) emerges for all values of � and �; (g
pu(ij); g
pd(ij)) emerges in the
region to the right of curve C2 and below curve C1; and (gpu; gcd) emerges in the region to the
right of the C3 curve.19
Part (i) of the lemma asserts that at both market tiers �upstream and downstream �a
complete R&D network is pairwise stable. Intuitively, in the star network, the spoke �rms
are in a weaker competitive position vis-à-vis the hub �rm. Therefore, given a complete R&D
network at a market tier, a �rm at the other market tier will not unilaterally sever a link to
become a spoke in the star network.
β
θ
1C
3C
2C
Figure 2: Pairwise stable industry structures
Part (ii) of the lemma states that, at both market tiers, a partial R&D network between �rms
1 and 2, say, is pairwise stable. The stability of the partial network hinges on the competitive
advantage of the linked �rms relative to the isolated (outsider) �rm. This competitive advantage
means that neither of the linked �rms will unilaterally sever their link to form the empty network,
given a partial network at the other market tier. Likewise, even though the isolated �rm bene�ts
by forming a link with an insider, linked �rm (to become a spoke in the star), it is the case that
none of the insiders have an incentive to form such a link (to become the hub in the star). As
lemma 1 suggests, an insider �rm will not form this link provided that spillovers � within the
upstream R&D network are su¢ ciently large; while spillovers � within the downstream R&D
network are su¢ ciently small.19We note that the C1, C2 and C3 curves are the set of (�; �) values that solve the equations �hD(g
pu; g
sd) =
�lD(gpu; g
pd), �
hU (g
su; g
pd) = �
lU (g
pu; g
pd) and �
hU (g
su; g
cd) = �
lU (g
pu; g
cd), respectively.
10
The intuition behind the need for su¢ ciently large upstream and su¢ ciently small down-
stream spillovers can be explained as follows. Greater upstream spillovers � imply that the
competitive advantage of the linked �rms is more pronounced. To put it di¤erently, the insiders
are �strong�while the outsider is �weak�when � is large. Therefore, the linked �rms will have
no incentive to o¤er a link to the isolated �rm.
The competitive advantage of the upstream linked �rms is transferred to their downstream
counterparts through lower input prices.20 As lemma 1 (ii) suggests, the downstream counter-
parts of the upstream linked �rms will form a partial R&D network as well. Interestingly, they
will do so even though spillovers � within the downstream R&D network are su¢ ciently small.
The reason is that the insider downstream �rms are relatively aggressive in product market
competition as they face lower input prices than the outsider �rm. Therefore, they have no
incentive to expand their partial R&D network. Consequently, only one link is established at
the downstream market tier, and an insider/outsider formation results.
The most interesting result, though, is part (iii) of the lemma as it suggests that an asym-
metric industry structure will be pairwise stable. In particular, a partial upstream network
will coexist with a complete downstream network if spillovers � within the upstream R&D
network are su¢ ciently large. This industry structure arises for two primary reasons. First,
in the partial network, the upstream linked �rms have no incentives to form a link with their
isolated counterpart if within-network spillovers � are su¢ ciently large. This is so because the
competitive advantage of the linked �rms is relatively pronounced when � is large. Second, the
upstream isolated �rm does not su¤er a lot (even though � is large), given that its downstream
counterpart maintains an R&D link with both its rivals. Putting this last observation slightly
di¤erently, the additional downstream link helps to compensate for the absence of an upstream
link, thereby increasing the overall pro�t of this vertical chain with an isolated upstream �rm.
3.2 Strong stability
The concept of pairwise stability permits deviations only by a pair of �rms at a time. This
suggests that if we enrich the network formation process to encompass deviations by a coalition
of �rms, then it may no longer be the case that the same network architectures will materialize
in equilibrium. Indeed, it may well be the case that a pairwise stable network is no longer
20We note that forming an upstream (horizontal) R&D link, ceteris paribus, has the e¤ect of raising inputquantities and, thus, reducing input prices.
11
strongly stable.21 Following Jackson and Van de Nouweland (2005), we say that a network is
strongly stable if it survives all possible changes in the number of its links by any coalition of
�rms �because at least one �rm in the coalition would lose from the proposed group deviation.
This constitutes then a re�nement of the set of pairwise stable networks. The �nal network
architectures of our network formation game are put forward in the following proposition.
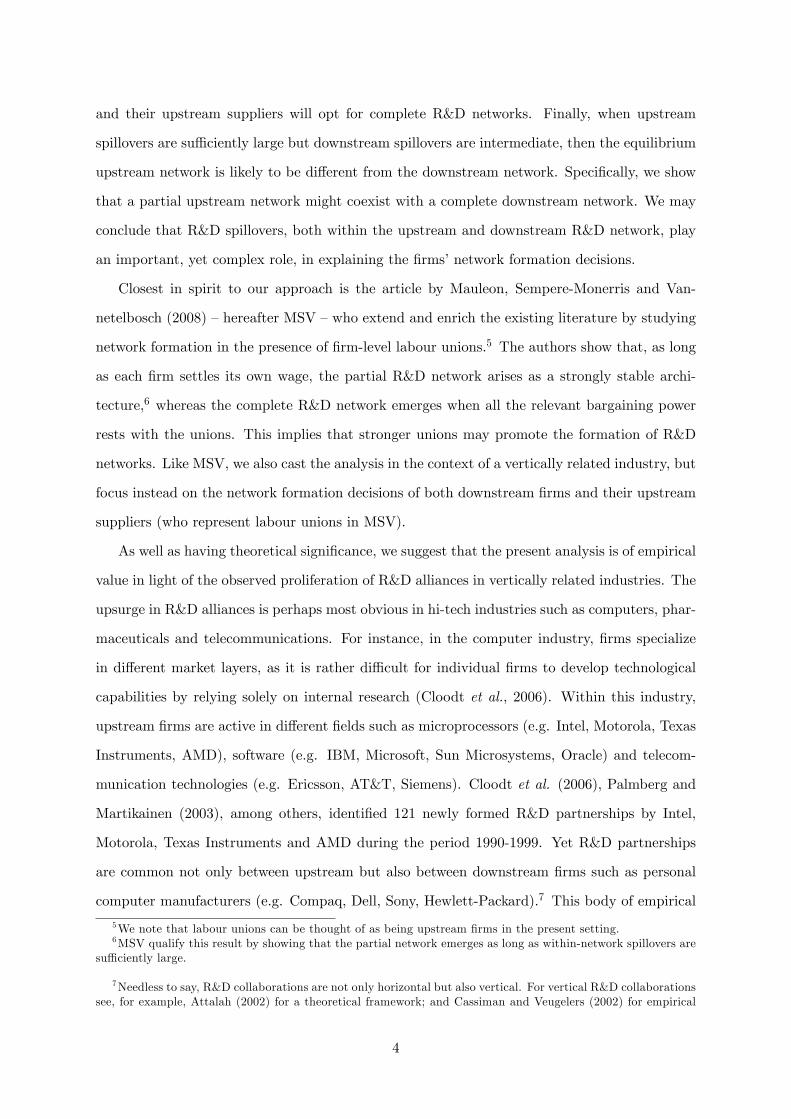
Proposition 1 In the parameter space (�; �), the following industry structures emerge endoge-
nously as strongly stable:
(i) (gcu; gcd) if � is su¢ ciently small.
(ii) (gpu(ij); gpd(ij)) if � is su¢ ciently large and � is su¢ ciently small.
(iii) (gpu; gcd) if � is su¢ ciently large and � is intermediate.
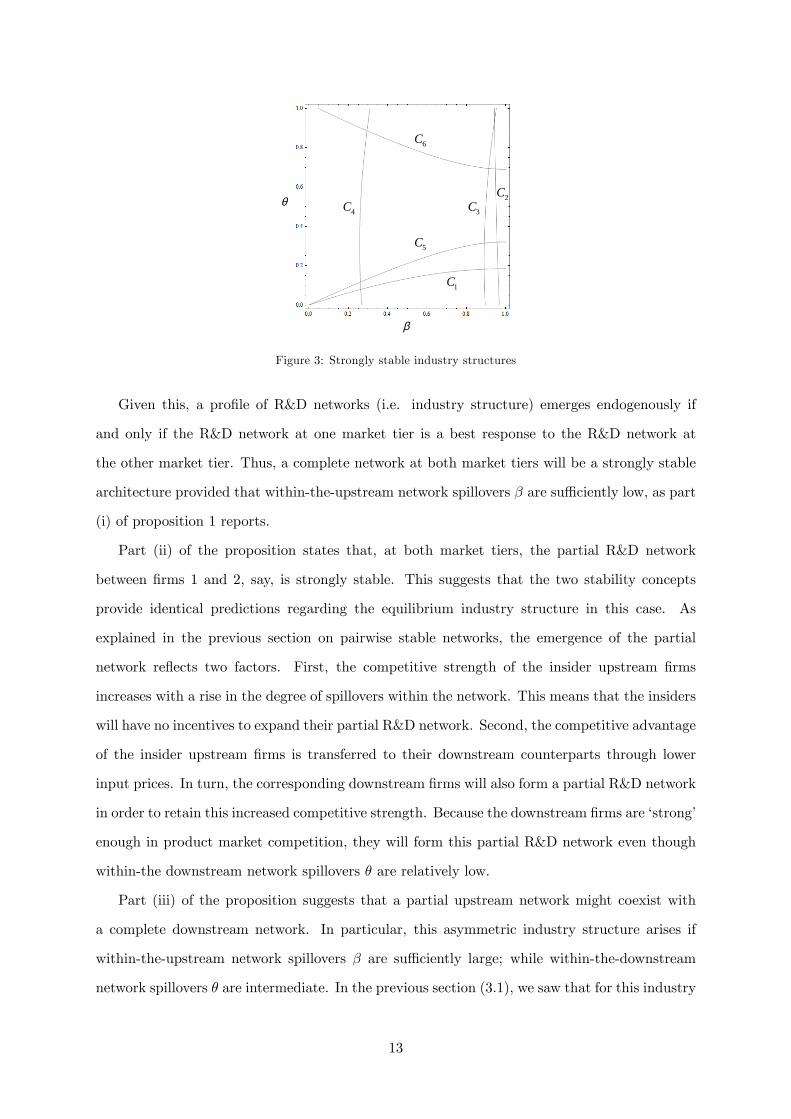
Figure 3 illustrates the content of proposition 1. More speci�cally, the industry structure
(gcu; gcd) arises in the region to the left of curve C4; (g
pu(ij); g
pd(ij)) arises in the region below
curve C1 and to the right of curve C2; and (gpu; gcd) arises in the region to the right of the C3
curve and between curves C5 and C6.22
Part (i) of the proposition can be explained as follows. Consider �rst a complete upstream
network, given a complete network at the downstream market tier. Because strong stability is
a re�nement of pairwise stability, there are two possible deviations from the complete network.
More speci�cally, the three upstream �rms will not jointly deviate to the empty network. How-
ever, a coalition of two upstream �rms has incentives to sever its links with the third �rm in
order to form the partial network. As explained in the previous section (3.1), in the partial
network, the linked �rms enjoy a substantial cost advantage over their rival. This cost ad-
vantage of the linked �rms becomes more pronounced as within-network spillovers � increase.
As a result, the partial network destabilizes the complete network when spillovers are large.
Therefore, the upstream �rms will opt for a complete network only if within-network spillovers
� are su¢ ciently small, given a complete network at the downstream market tier. In contrast,
given a complete network at the upstream market tier, there will be no coalitional deviation by
the downstream �rms to either the partial or the empty network.
21Pairwise stability can be seen as a necessary condition for stability (see Jackson and Wolinsky, 1996; Goyaland Moraga-González, 2001).22We note that the curve C4 is the set of (�; �) values that solve the equation �U (gcu; g
cd) = �lU (g
pu; g
cd); while
the C5 and C6 curves are the set of (�; �) values that solve �D(gpu; gcd) = �lD(g
pu; g
pd).
12
θ
β
1C
3C2C
5C
4C
6C
Figure 3: Strongly stable industry structures
Given this, a pro�le of R&D networks (i.e. industry structure) emerges endogenously if
and only if the R&D network at one market tier is a best response to the R&D network at
the other market tier. Thus, a complete network at both market tiers will be a strongly stable
architecture provided that within-the-upstream network spillovers � are su¢ ciently low, as part
(i) of proposition 1 reports.
Part (ii) of the proposition states that, at both market tiers, the partial R&D network
between �rms 1 and 2, say, is strongly stable. This suggests that the two stability concepts
provide identical predictions regarding the equilibrium industry structure in this case. As
explained in the previous section on pairwise stable networks, the emergence of the partial
network re�ects two factors. First, the competitive strength of the insider upstream �rms
increases with a rise in the degree of spillovers within the network. This means that the insiders
will have no incentives to expand their partial R&D network. Second, the competitive advantage
of the insider upstream �rms is transferred to their downstream counterparts through lower
input prices. In turn, the corresponding downstream �rms will also form a partial R&D network
in order to retain this increased competitive strength. Because the downstream �rms are �strong�
enough in product market competition, they will form this partial R&D network even though
within-the downstream network spillovers � are relatively low.
Part (iii) of the proposition suggests that a partial upstream network might coexist with
a complete downstream network. In particular, this asymmetric industry structure arises if
within-the-upstream network spillovers � are su¢ ciently large; while within-the-downstream
network spillovers � are intermediate. In the previous section (3.1), we saw that for this industry
13
structure to emerge, there was only a requirement on the size of spillovers �.
The intuition can be explained as follows. We �rst note that, given the R&D network at
the downstream market tier, the upstream �rms will not deviate from the partial network.
However, it appears that, given the upstream R&D network, the downstream �rms will force
a deviation from the complete to the partial network if spillovers � are su¢ ciently large or
small. Recall that because the upstream �rms 1 and 2, say, opt for a partial network, their
downstream counterparts bene�t from the ensuing input price reductions. In turn, the lower
input prices increase the competitive strength of the downstream �rms, 1 and 2. It turns out
that if spillovers � within the downstream network are su¢ ciently large, these downstream �rms
will jointly sever their links with the third �rm in order to form a partial network. By doing
so, they can retain their competitive advantage in product market competition over their rival.
Furthermore, the downstream �rms 1 and 2 will also deviate from the complete to the partial
network as long as � is su¢ ciently small. The reason is that small within-network spillovers
mean that the downstream �rms 1 and 2 do not enjoy a substantial access to the R&D results
of the third downstream �rm. Because �rms 1 and 2 already secure their inputs at a lower cost
than the third �rm, proposition 1 implies that they will �nd it pro�table to break both their
links with this �rm. Therefore, compared to the concept of pairwise stability, the coexistence
of a partial upstream network and a complete downstream network becomes less likely and
emerges only if � is su¢ ciently large and � is intermediate (rather than for any � value).
Together, lemma 1 and proposition 1 seem to suggest that within-network upstream spillovers
are more important than downstream spillovers in determining the equilibrium industry struc-
tures. For example, part (i) of the proposition requires a quali�cation only on the size of
upstream spillovers to pin down the strongly stable industry structure. Likewise, part (ii) of the
proposition suggests that a partial downstream network �given a partial upstream network �
is likely to emerge when downstream spillovers are small; but an additional requirement is that
upstream spillovers are large. Of course, a task for future empirical work is a thorough testing
of this theoretical prediction that seems to be relevant in the present setting.
4 Further analysis
In this section we consider some aspects of aggregate performance, focusing �rst on the aggregate
level of e¤ective R&D. Evaluating the di¤erent networks in terms of aggregate e¤ective R&D is
14
important because more R&D implies lower costs and therefore higher input/output quantities.
The resulting decrease in product prices may also bene�t consumers.
By comparing the aggregate level of e¤ective R&D under each strongly stable industry
structure against the other possible industry structures, we can state the following proposition.
Proposition 2 (i) The industry structure (gpu; gcd) maximizes the aggregate level of e¤ective
R&D when it emerges as strongly stable. (ii) In contrast, the other two industry structures,
(gcu; gcd) and (g
pu(ij); g
pd(ij)), may lead to a lower aggregate level of e¤ective R&D compared to
industry structures with fewer collaborative links.
An asymmetric industry structure �a partial upstream network and a complete downstream
network �is desirable in terms of aggregate e¤ective R&D; in contrast, the other two, symmetric,
structures are never optimal. As proposition 2 suggests, these industry structures are actually
dominated by industry structures that contain a smaller number of collaborative links. For
instance, we �nd that an empty network at both market tiers generates higher aggregate e¤ective
R&D than the corresponding industry structure where complete networks are strongly stable.
We now consider industry pro�ts. We say that an industry structure is strongly e¢ cient if
it secures at least as high an aggregate level of pro�ts as any other industry structure; that is,P3i=1[(�Ui+�Di)(g
nu ; g
nd )] �
P3i=1[(�Ui+�Di)(g
nu ; g
nd )0] for any other industry structure (gnu ; g
nd )0,
where n = c; p; s; e. We note that the strongly e¢ cient industry structures are not easily
characterized in the present setting as it proves rather di¢ cult to provide a pro�t ranking of all
possible industry structures.23 Instead, we examine whether there are parameter con�gurations
for which the strongly stable industry structures can maximize industry pro�ts �and thus are
strongly e¢ cient. The following proposition summarizes our �ndings.
Proposition 3 Neither of the strongly stable industry structures is strongly e¢ cient.
Proposition 3 implies that individual and collective interests for R&D collaboration do never
coincide. It is worth noting that such misalignment is particularly severe when either complete
or partial networks arise at both market tiers, i.e. (gcu; gcd) and (g
pu(ij); g
pd(ij)). In both cases, it
appears that a fairly wide variety of industry structures can secure higher aggregate pro�ts.24
23Recall that there are 16 possible industry structures in the present setting.24For example, the industry structure (gcu; g
cd) �within the range of � and � values where it is strongly stable
�is outperfomed by: (gsu; gcd) for all � and �; (g
cu; g
sd) if � is large; (g
su; g
sd) if � is small and � is large. Likewise,
the industry structure (gpu; gpd) performs worse than: (g
cu; g
cd) unless � is large and � is low; (g
su; g
cd) for all � and
�; (gpu; ged) for all � and �.
15
However, when the partial upstream network and the complete downstream network are strongly
stable, then �only�one industry structure performs better in terms of aggregate pro�ts � the
star upstream network and the complete downstream network, (gsu; gcd).
The divergence between individual and collective interests seems particularly pronounced in
the present setting. For this reason, we would like to explore this result further by examining
social welfare under the strongly stable industry structures. We shall de�ne social welfare in
the usual way, as the sum of consumer surplus, upstream and downstream �rms�pro�ts. Social
welfare under an industry structure (gnu ; gnd ) is thus given by:
W (gnu ; gnd ) =
Q2(gnu ; gnd )
2+
3Xi=1
�Ui(gnu ; g
nd ) +
3Xi=1
�Di(gnu ; g
nd ), (8)
where Q(gnu ; gnd ) =
P3i=1 qi(g
nu ; g
nd ). To compute social welfare under the di¤erent networks, we
substitute into (8) the equilibrium outcomes for output and �rm pro�ts.
Proposition 4 (i) If � is su¢ ciently large, then the industry structure (gpu; gcd) maximizes social
welfare when it emerges as strongly stable. (ii) Neither the industry structure (gcu; gcd) nor the
industry structure (gpu(ij); gpd(ij)) is welfare-maximizing.
The result above shows that only one industry structure can be socially optimal in the
present setting. In particular, if within-the-upstream network spillovers are su¢ ciently large,
then the industry structure consisting of an upstream partial network and a complete down-
stream network is socially desirable relative to any other industry structure. In contrast, we
�nd that, when spillovers are su¢ ciently small, this industry structure is socially dominated by
the upstream star network and the complete downstream network, (gsu; gcd). The intuition can
be explained as follows. The upstream partial network and the complete downstream network
secure a higher aggregate level of e¤ective R&D and, thus, consumer surplus than any other
industry structure (recall proposition 2). However, the industry structure consisting of an up-
stream star network and a complete downstream network, (gsu; gcd), leads to higher aggregate
pro�ts. It turns out that the increase in aggregate pro�ts under (gsu; gcd) outweighs the corre-
sponding decrease in consumer surplus when spillovers, �, are small. Therefore, social welfare
is maximized under (gpu; gcd) so long as � is su¢ ciently large.
16
5 Discussion
The aim of this section is to discuss both the relation of our results to the literature and
certain assumptions of the model. We �rst consider the performance of the stable network
formations in terms aggregate e¤ective R&D investment. Our analysis here complements Song
and Vannetelbosch (2007), who consider a model of international R&D collaboration among
three �rms located in di¤erent countries. The authors �nd � in line with us � that stable
networks do not perform well in terms of aggregate e¤ective R&D.25 Taking the next step, the
authors also show that a government policy in the form of R&D subsidies increases e¤ective
R&D investment. In the present article, we �nd that, an asymmetric industry structure within
a two-tier setting �a partial upstream network and a complete downstream network �produces
the highest aggregate level of e¤ective R&D when it emerges as strongly stable.
We now consider the relationship between strongly stable, industry-pro�t maximizing and/or
welfare-maximizing networks. Taken together, propositions 1, 3 and 4 imply that, in the pursuit
of their private interests, the downstream �rms and their upstream suppliers cannot collectively
achieve a pro�t-maximizing outcome but, under certain conditions, may achieve a welfare-
maximizing outcome when the upstream partial network and the complete downstream network
emerge endogenously. We note that other authors have reported similar conclusions regarding
a potential divergence between individual and collective incentives for R&D collaboration. For
instance, Goyal and Moraga-González (2001) do so in an one-tier setting when �rms are located
in the same country; Song and Vannetelbosch (2007) do so when �rms are located in di¤erent
countries; and MSV (2008) do so when �rms settle their own wages.
As a caveat to our conclusions above, we note that an important assumption of the model is
that upstream and downstream �rms are locked into exclusive relations. This assumption can
be justi�ed by assuming that, prior to their network formation decisions, the two parties have
undertaken relationship-speci�c investments (see Symeonidis, 2008). Such investments, which
would prevent the two parties from breaking up, are a common feature of the Japanese auto-
mobile industry, where automakers often engage in high-commitment relationships with their
suppliers.26 In this context, both parties undertake large �xed investments, such as investments
25 In particular, Song and Vannetelbosch (2007) demonstrate that the stable R&D networks �a complete anda partial network �generate a lower aggregate level of e¤ective R&D than the empty network. In the presentsetting, we also con�rm that the empty network at both market tiers outperforms the corresponding completenetworks in terms of aggregate e¤ective R&D.26As Helper and Levine (1992) note, U.S. automakers have also moved progressively towards long-term rela-
17
on �exible automation, information �ow mechanisms and quality control training (Helper and
Levine, 1992).
On the other hand, as Narula and Dysters (2004, p. 207) point out, ��rms seek partnerships
in response to similar moves made by other �rms in the same industry, not always because there
are sound economic rationale in doing so, but in imitation of their competitors�.27 In turn, this
could be a reason behind a potential failure of R&D alliances, as some partners might appear
dishonest by terminating an agreement after they have appropriated important technologies
(Narula and Hagedoorn, 1999).28 In that sense, relationships between downstream �rms and
their upstream suppliers might be longer term than horizontal R&D collaborations and, as
such, they tend to increase switching costs and create �lock-in�. Indeed, Helper and Levine
(1992, p. 563) point out that in the context of the Japanese automobile industry: �As long
as the supplier continues to meet the automaker�s expectations, the supplier can count on the
relationship continuing inde�nitely.�
We next turn to discuss whether the downstream �rms and their upstream suppliers have
incentives for vertical integration in the present setting. To understand this, we note that vertical
integration creates an e¢ ciency e¤ect. That is, it eliminates the double marginalization problem
and thereby transforms the vertically integrated unit into a more aggressive competitor in the
retail market. Similarly, investments in cost reducing R&D and/or R&D collaboration imply
an e¢ ciency-enhancing e¤ect, which also tends to expand the output base of the collaborating
�rms. Notice the presence of complementarities between greater output and lower costs: more
output makes the bene�t from lower costs more pronounced, and lower costs make output
increases more valuable.29 Therefore, due to a larger output base, lower marginal cost �rms (as
a result of R&D collaboration) will �nd it more pro�table to vertically integrate compared to
their non-collaborating counterparts. We conclude that horizontal R&D networks are likely to
strengthen �rms�incentives for vertical integration.30
tionships with their suppliers, thereby enhancing their overall e¢ ciency.27This statement re�ects the so-called follow-my-leader strategy, an idea originating in Knickerbocker (1973).28Narula and Hagedoorn (1999), Podolny and Page (1998), among others, point out that failing R&D alliances
are a common empirical phenomenon. It has been further documented that R&D alliances may not meet thepartners�expectations.29Buehler and Schmutzler (2008) examine the incentives for vertical integration in the presence of endogenous
cost-reducing investments by downstream �rms. In a model where vertical integration entails a �xed cost, theauthors show that the incentives for integration are ambiguous and depend on the market size and the e¢ ciencyof the R&D technology.30Vertical integration of collaborating �rms may also work towards expanding their market dominance over
their non-collaborating counterparts. Such a situation of market dominance seems to be prevalent in this settingparticularly when, under certain conditions, downstream �rms and their upstream suppliers opt for establishing
18
6 Conclusion
Over the last thirty years, we witnessed a substantial increase in the number of R&D collabo-
rations through networks. Such networks are often observed in vertically related industries. In
that context, both downstream �rms and their upstream suppliers form horizontal collaborative
links to pool R&D results with other �rms. However, the existing literature has mainly focused
on R&D networks in the context of a one-tier industry, where �rms compete in the product
market. In the present article we develop the literature by studying the endogenous formation
of horizontal R&D networks at the upstream and downstream market tier of a vertically related
industry. Because the upstream R&D network may have an impact on the stability of the
downstream network (and vice versa), we have considered the situation in which R&D networks
are determined at both market tiers simultaneously.
Our analysis suggests that economic factors, such as within-network R&D spillovers, may
be the driving forces behind the equilibrium network formations. We have found that, under
certain conditions, downstream �rms and their corresponding upstream suppliers may either
form partial or complete R&D networks. Moreover, we have identi�ed the circumstances in
which the equilibrium upstream R&D network is likely to be di¤erent from the downstream
network. That is, a partial upstream network might coexist with a complete downstream
network as long as R&D spillovers within the upstream network are su¢ ciently large; while
spillovers within the downstream network are intermediate.
We have also examined the implications of the stable networks formations for aggregate
e¤ective R&D, industry pro�ts and social welfare. Our analysis suggests that, in the pursuit of
their private interests, the downstream �rms and their upstream suppliers cannot collectively
achieve a pro�t-maximizing outcome. In spite of this negative e¤ect, we have found that, under
certain conditions, both an e¤ective R&D-maximizing and a welfare-maximizing outcome can
be attained but only under the partial upstream and the complete downstream R&D network.
The potential divergence between private and collective interests for R&D collaboration im-
plies that there is room for public policy. As a general policy prescription, our analysis suggests
that the structure of the upstream and the downstream network might be as important for
designing public policy as the extent of within-network R&D spillovers. Further developments
in this area could consider more general demand and cost structures, informational asymmetries
partial R&D networks (that exclude both an upstream and a downstream �rm).
19
and alternative forms of wholesale and retail competition. These extensions which are beyond
the scope of the present paper are promising avenues for future research.
7 Appendix
Proof of proposition 1. Because strong stability is a re�nement of pairwise stability, from
lemma 1, there are three candidates for strongly stable industry structures: (i) (gcu; gcd) for all
parameter con�gurations; (ii) (gpu(ij); gpd(ij)) if � is su¢ ciently large and � is su¢ ciently low;
and (iii) (gpu; gcd) if � is su¢ ciently large and � is intermediate. We consider �rst (gcu; g
cd) and
focus on gcu, given gcd. There are two possible deviations from gcu. More speci�cally, the three
upstream �rms will not jointly deviate to the empty network, because �U (gcu; gcd) > �U (g
eu; g
cd).
A coalitional deviation to the partial network, where two of the upstream �rms in the complete
network sever their links with the third �rm, can be ruled out as long as �U (gcu; gcd) > �U (g
pu; gcd)
� that is, as long as � is su¢ ciently small. To show this, we calculate ��1 � �U (gcu; g
cd)
��lU (gpu; gcd). Let curve C4 in Figure 3 be the set of (�; �) values that solve the equation
�U (gcu; g
cd) = �
lU (g
pu; gcd). We note that lim�!0+��1 > 0 for all � 2 (0; 1]; and lim�!1���1 < 0
for all � 2 (0; 1]. Therefore, there exist critical values of �, such that �U (gcu; gcd) ��lU (gpu; gcd) > 0
if � is su¢ ciently small (i.e. in the region to the left of curve C4 in Figure 3); while �U (gcu; gcd)
��lU (gpu; gcd) < 0 if � is su¢ ciently large.
Further, we note that, given a complete network at the upstream market tier (gcu), there
will be no coalitional deviation by the downstream �rms to either the partial network (because
�D(gcu; g
cd) > �
lD(g
cu; g
pd)) or the empty network (because �D(g
cu; g
cd) > �D(g
cu; g
ed)). Given this, a
pro�le of R&D networks (i.e. industry structure) emerges endogenously if and only if the R&D
network at one market tier is a best response to the R&D network at the other market tier.
Thus, (gcu; gcd) will be a strongly stable industry structure provided that � is su¢ ciently small
(i.e. in the region to the left of curve C4 in Figure 3).
Next, we consider (gpu(ij); gpd(ij)). In this case, it is easy to show that, given a partial R&D
network at a market tier, the linked �rms in the partial network at the other market tier will
not jointly deviate to the complete network, because �lU (gpu; g
pd) > �U (g
cu; g
pd) and �
lD(g
pu; g
pd)
> �D(gpu; gcd), respectively.
Finally, we show that (gpu; gcd) is strongly stable if � is su¢ ciently large and � is intermediate.
20
We �rst note that, given the R&D network at the downstream market tier (i.e. gcd), the up-
stream �rms will not jointly deviate from the partial network to the complete network, because
�lU (gpu; gcd) > �U (g
cu; g
cd). However, given the upstream R&D network (i.e. gpu), the downstream
�rms will force a deviation from the complete to the partial network if spillovers � are su¢ ciently
large or small. To see this, we calculate ��2 � �D(gpu; gcd)� �lD(gpu; g
pd). Let curves C5 and C6 in
Figure 3 be the set of (�; �) values that solve the equation �D(gpu; gcd) = �
lD(g
pu; g
pd). We note that
lim�!0+��2 < 0 for all � 2 (0; 1]; lim�!1���2 < 0 for all � 2 (0:05; 1]; and lim�!0:5��2 > 0
for all � 2 (0; 1]; see Figure 3. Therefore, there exist critical values of �, such that �D(gpu; gcd)�
�lD(gpu; g
pd) < 0 if � is su¢ ciently small or large; and �D(g
pu; gcd)� �lD(g
pu; g
pd) > 0, otherwise (i.e.
in the region between the curves C5 and C6 in Figure 3).
From lemma 1, we know that (gpu; gcd) is pairwise stable if � is su¢ ciently large. Given this, a
pro�le of R&D networks (i.e. industry structure) emerges endogenously if and only if the R&D
network at one market tier is a best response to the R&D network at the other market tier. It
follows immediately that (gpu; gcd) will be a strongly stable industry structure provided that � is
su¢ ciently large and � is intermediate (i.e. in the region to the right of curve C3 and between
curves C5 and C6). Q.E.D.
Proof of proposition 2. We consider the region of (�; �) values where the industry structures
(gcu; gcd), (g
pu(ij); g
pd(ij)) and (g
pu; gcd) are strongly stable. From Figure 3 note that the coordinates
identifying the area where (gcu; gcd) is strongly stable are (0; 0), (0:27; 0), (0:31; 1) and (0; 1); while
the relevant coordinates for the industry structures (gpu; gcd) and (gpu(ij); g
pd(ij)) are, respectively,
(0:89; 0:31), (1; 0:32), (1; 0:69), (0:91; 0:69), and (0:97; 0), (1; 0), (1; 0:18), (0:96; 0:18).
(i) The result follows by comparing X(gpu; gcd) against the level of aggregate e¤ective R&D
in all other industry structures. (ii) Consider the industry structure (gcu; gcd). The result can
be established by comparing X(gcu; gcd) with the aggregate level of e¤ective R&D in an industry
structure characterized by a smaller number of links, (geu; ged), say. Let �X � X(gcu; g
cd) �
X(geu; ged). We note that �X > 0 when � ! 0 and � ! 0; �X > 0 when � ! 0:27 and
� ! 0; �X > 0 when � ! 0:31 and � ! 1; and �X < 0 when � ! 0 and � = 1. Thus,
there exist critical values of � and �, such that X(gcu; gcd) < X(g
eu; g
ed) if � is su¢ ciently small
and � is not too small; while X(gcu; gcd) > X(g
eu; g
ed); otherwise. Next, we consider the industry
structure (gpu; gpd). Again, to establish the result it su¢ ces to compare X(g
pu; g
pd) with the level
of aggregate e¤ective R&D in an industry structure characterized by fewer links, (gpu; ged), say.
21
This implies that X(gpu; ged) > X(gpu; gpd), which holds for all con�gurations of the parameters.
Q.E.D.
Proof of proposition 3. To prove the result, it su¢ ces to show that, for each industry
structure that emerges as strongly stable, there is (at least) one industry structure that leads
to higher industry pro�ts (i.e. the sum of the upstream and downstream �rms�pro�ts). To
this end, we note thatP3i=1[(�Ui + �Di)(g
cu; g
cd)] <
P3i=1[(�Ui + �Di)(g
su; g
cd)] for all � and �
(within the range of values that (gcu; gcd) emerges as strongly stable);
P3i=1[(�Ui+�Di)(g
pu; g
pd)] <P3
i=1[(�Ui + �Di)(gsu; g
cd)] for all � and � (in the region where (g
pu; g
pd) is strongly stable); andP3
i=1[(�Ui+�Di)(gpu; gcd)] <
P3i=1[(�Ui+�Di)(g
su; g
cd)] for all � and � (in the region where (g
pu; gcd)
is strongly stable). Q.E.D.
Proof of proposition 4. (i) The industry structure (gpu; gcd) emerges as strongly stable when �
is su¢ ciently large and � is intermediate (note that the four coordinates indentifying this region
are (0:89; 0:31), (1; 0:32), (1; 0:69) and (0:91; 0:69)). Within this region of � and � values, the re-
sult follows directly from comparing social welfare under (gpu; gcd) against the social welfare levels
under the other possible industry structures. It is fairly easy to show that (gpu; gcd) dominates
every other industry structure in terms of social welfare for all � and �, except for the industry
structure (gsu; gcd). To this end, we calculate the di¤erence �W � W (gpu; gcd) �W (gsu; gcd). We
note that �W < 0 when � ! 0:89 and � ! 0:31; �W < 0 when � ! 0:91 and � ! 0:69;
�W > 0 when � ! 1 and � ! 0:32; and �W > 0 when � ! 1 and � ! 0:69. Thus, there
exist critical values of �, such that W (gpu; gcd) �W (gsu; gcd) < 0 if � is su¢ ciently small; while
W (gpu; gcd)�W (gsu; gcd) > 0 if � is su¢ ciently large.
(ii) To establish the result, it su¢ ces to show that, for each of the industry structures (gcu; gcd)
and (gpu; gpd), there is (at least) one of the other possible industry structures in this setting that
secures higher social welfare. That is, W (gcu; gcd) < W (gsu; g
cd) for all � and � (in the region
where (gcu; gcd) emerges as strongly stable); and W (g
pu; g
pd) < W (gsu; g
cd) for all � and � (in the
region where (gpu; gpd) emerges as strongly stable). Q.E.D.
References
[1] d�Aspremont, C. and Jacquemin, A. (1988) �Cooperative and Noncooperative R&D in
Duopoly with Spillovers,�American Economic Review, 78, 1133- 37.
22
[2] Atallah, G. (2002) �Vertical R&D spillovers, cooperation, market structure, and innova-
tion,�Economics of Innovation and New Technology, 11, 179-209.
[3] Belderbos, R., Carree, M., Diederen, B., Lokshin, B. and Veugelers, R. (2004) �Hetero-
geneity in R&D cooperation strategies,�International Journal of Industrial Organization,
22, 1237-1263.
[4] Buehler, S. and Schmutzler, A. (2008) �Intimidating competitors �Endogenous vertical
integration and downstream investment in successive oligopoly,� International Journal of
Industrial Organization, 26, 247-265.
[5] Cassiman, B. and Veugelers, R. (2002) �R&D cooperation and spillovers: some empirical
evidence from Belgium,�American Economic Review 92, 1169-1184.
[6] Cloodt, M., Hagedoorn, J. and Roijakkers, N. (2006) �Trends and patterns in inter-�rm
R&D networks in the global computer industry: a historical analysis of major developments
during the period 1970-1999,�Business History Review, 80, 725-746.
[7] Deroian, F. and Gannon, F. (2006) �Quality-improving alliances in di¤erentiated
oligopoly,�International Journal of Industrial Organization, 24(3), 629-637.
[8] Dunning, J. (1995) �Reappraising the eclectic paradigm in the age of alliance capitalism,�
Journal of International Business Studies, 26, 461-491.
[9] Goyal, S. and Joshi, S. (2003) �Networks of Collaboration in Oligopoly�, Games and Eco-
nomic Behavior, 43, 57-85.
[10] Goyal, S. and Moraga-González, J.L. (2001) �R&D Networks,� The RAND Journal of
Economics, 32(4), 686-707.
[11] Hagedoorn, J. (2002) �Inter-�rm R&D Partnerships: An Overview of Major Trends and
Patterns since 1960,�Research Policy, 31, 477-492.
[12] Helper, S. and Levine, D. (1992) �Long-Term Supplier Relations and Product-Market
Structure,�Journal of Law, Economics, & Organization, 8, 561-581.
[13] Jackson, M.O. and van den Nouweland, A. (2005) �Strongly Stable Networks,�Games and
Economic Behavior, 51(2), 420-444.
23
[14] Jackson, M.O. and Wolinsky, A. (1996) �A Strategic Model of Social and Economic Net-
works,�Journal of Economic Theory, 71, 44-74.
[15] Kaiser, U. (2002) �An empirical test of models explaining research expenditures and re-
search cooperation: evidence for the German service sector,� International Journal of In-
dustrial Organization, 20, 747-774.
[16] Kamien, M.I., Muller, E., and Zang, I. (1992) �Research Joint Ventures and R&D Cartels,�
American Economic Review, 85, 1293-1306.
[17] Knickerbocker, F. (1973) �Oligopolistic Reaction and the Multinational Enterprise,�Har-
vard University Press, Cambridge, MA.
[18] Leiponen, A. (2001) �Why do �rms not collaborate? The role of competencies and techno-
logical regimes,�In: Kleinknecht, A., Mohnen, P. (Eds.), Innovation and Firm Performance:
Econometric Exploration of Survey Data. Palgrave, pp. 253- 277.
[19] Mauleon, A., Sempere-Monerris, J.J., and Vannetelbosch, V. (2008) �Networks of Knowl-
edge among Unionized Firms,�Canadian Journal of Economics, 41, 971-997.
[20] Narula, R. and Duysters, G. (2004) �Globalisation and trends in international R&D al-
liances,�Journal of International Management, 10, 199-218.
[21] Narula, R. and Hagedoorn, J. (1999) �Innovating through strategic alliances: moving to-
wards international partnerships and contractual agreements,�Technovation, 19, 283-294.
[22] Palmberg, C. and Martikainen, O. �The Economics of Strategic R&D Alliances �A Review
with Focus on the ICT Sector.�21.11.2003.
[23] Podolny, J.M. and Page, K.P. (1998) �Network Forms of Organization,�Annual Review of
Sociology, 24, 57-76.
[24] Powell, W.W., Koput, K.W., and Smith-Doerr, L. (1996) �Interorganizational Collabora-
tion and the Locus of Innovation: Networks of Learning in Biotechnology,�Administrative
Science Quarterly, 41, 116-145.
[25] Song, H. and Vannetelbosch, V. (2007) �International R&D Collaboration Networks,�The
Manchester School, 75(6), 742-766.
24
[26] Suzumura, K. (1992) �Cooperative and noncooperative R&D in an oligopoly with
spillovers,�American Economic Review, 82, 1307-1320.
[27] Symeonidis, G. (2008) �Downstream competition, bargaining and welfare,�Journal of Eco-
nomics and Management Strategy, 17, 247-270.
[28] Veugelers, R. (1997) �Internal R&D expenditures and external technology sourcing,�Re-
search Policy, 26, 303-315.
[29] Westbrock, B. (2010) �Natural concentration in industrial research collaboration,� The
RAND Journal of Economics, 41, 351-371.
[30] Wolfram, S. (1999) �The Mathematica Book�, 4th ed. Cambridge University Press, Wol-
fram Media.
[31] Zikos, V. (2010) �R&D Collaboration Networks in Mixed Oligopoly,�Southern Economic
Journal, 77, 189-212.
[32] Zirulia, L. (2011) �The role of spillovers in R&D network formation,�Economics of Inno-
vation and New Technology, forthcoming.
[33] Zu, L., Dong, B., Zhao, X. and Zhang, J. (2011) �International R&D Networks,�Review
of International Economics, 19, 325-340.
25