upper susquehanna coalition (usc)cast.chesapeakebay.net/...filename=ny_usc_nps_bmpver_q… · web...
TRANSCRIPT
UPPER SUSQUEHANNA COALITION
QUALITY ASSURANCE PROJECT PLAN
PROCEDURES FOR COLLECTING, REPORTING, AND VERIFYING NONPOINT SOURCE DATA IN
THE CHESAPEAKE BAY WATERSHED
MARCH 31, 2017
3/31/2017 1
Upper Susquehanna Coalition
TIOGA SOIL AND WATER CONSERVATION DISTRICT
183 CORPORATE DR.
OWEGO, NEW YORK 13827
607-687-3553
3/31/2017 2
UPPER SUSQUEHANNA COALITION
QUALITY ASSURANCE PROJECT PLAN
PROCEDURES FOR COLLECTING, REPORTING, AND VERIFYING NONPOINT SOURCE DATA IN THE
CHESAPEAKE BAY WATERSHED
USC Administrative Office:
Tioga Soil and Water Conservation District
183 Corporate Dr.
Owego, New York 13827
607-687-3553
USC Watershed Coordinator / Tioga Co. SWCD District Manager
Wendy Walsh
183 Corporate Dr.
Owego, New York 13827
607-687-3553
Project Organization: Upper Susquehanna Coalition (USC)
Prepared by:
Wendy Walsh, USC Watershed Coordinator / Tioga Co. SWCD District Manager
Amanda Barber, USC Agricultural Team Leader / Cortland Co. SWCD District Manager
Chris Yearick, USC GIS Specialist
3/31/2017 3

VERSION TRACKINGThis quality assurance project plan (QAPP) for nonpoint source (NPS) data replaces the March 4, 2016 version and complements the New York Department of Environmental Conservation (DEC) QAPP for point source data (Quality Assurance Project Plan Procedures for Collecting, Reporting and Verifying Point Source Data in the Chesapeake Bay Watershed November 2015).
QUALITY ASSURANCE PROJECT PLAN REQUIREMENTNew York State (NYS) is a recipient of Chesapeake Bay Regulatory and Accountability Program (CBRAP) and Chesapeake Bay Implementation Grant (CBIG) funds from the U.S. Environmental Protection Agency (EPA). CBRAP grants aid the six Chesapeake Bay watershed states and the District of Columbia in implementing and expanding their jurisdictions’ regulatory, accountability, assessment, compliance, and enforcement capabilities in support of reducing nitrogen, phosphorus, and sediment loads delivered to the Bay to meet the Water Quality Goal of the 2014 Chesapeake Bay Watershed Agreement and the Bay TMDL. CBIG funds are awarded for the purpose of implementing the management mechanisms established under the Chesapeake Bay Agreement, with particular emphasis on state programs for control and abatement of nonpoint source nutrient and sediment pollution (including atmospheric deposition as a NPS). Specifically, CBIG awards support the jurisdictions’ implementation of the management strategies developed for each of the applicable outcomes identified in the 2014 Chesapeake Bay Watershed Agreement.
All organizations conducting environmental programs funded by EPA are required to establish and implement a quality system. EPA also requires that all environmental data used in decision making be supported by an approved Quality Assurance Project Plan (QAPP). Activities supported by New York’s CBRAP and CBIG funding that require quality assurance include the compilation, management, and reporting of information on wastewater treatment plants, best management practices (BMPs) for construction sites, stream corridor rehabilitation, wetland restoration, and agricultural BMPs.
QAPP OVERVIEWThe QAPP integrates all technical and quality aspects of a project, including planning, implementation, and assessment (USEPA 2006). The purpose of the QAPP is to document planning results for environmental data operations and to provide a project-specific “blueprint” for obtaining the type and quality of environmental data needed for a specific decision or use. The QAPP documents how quality assurance (QA) and quality control (QC) are applied to an environmental data operation to assure that the results obtained are of the type and quality needed and expected. The QAPP must be composed of standardized, recognizable elements covering the entire project from planning, through implementation, to assessment. These elements are presented in that order and have been arranged for convenience into four general groups. The four groups of elements and their intent are summarized as follows:
3/31/2017 4

A. Project Management - The elements in this group address the basic area of project management, including the project history and objectives, roles and responsibilities of the participants, etc. These elements ensure that the project has a defined goal, that the participants understand the goal and the approach to be used, and that the planning outputs have been documented.
B. Data Generation and Acquisition - The elements in this group address all aspects of project design and implementation. Implementation of these elements ensures that appropriate methods for sampling, measurement and analysis, data collection or generation, data handling, and QC activities are employed and are properly documented.
C. Assessment and Oversight - The elements in this group address the activities for assessing the effectiveness of the implementation of the project and associated QA and QC activities. The purpose of assessment is to ensure that the QA Project Plan is implemented as prescribed.
D. Data Validation and Usability - The elements in this group address the QA activities that occur after the data collection or generation phase of the project is completed. Implementation of these elements ensures that the data conform to the specified criteria, thus achieving the project objectives.
Quality assurance procedures for collection, reporting, and verification of NPS BMP implementation are described in this QAPP. The Upper Susquehanna Coalition (USC) will carry out BMP data collection and reporting in accordance with this QAPP to ensure that data reported are of acceptable quality to meet the needs of the Chesapeake Bay Program (CBP) as specified by the EPA’s Chesapeake Bay Program Office (CBPO).
3/31/2017 5
GROUP A – PROJECT MANAGEMENTThe elements in this group address the basic area of project management, including the project history and objectives, roles and responsibilities of the participants, etc. These elements ensure that the project has a defined goal, that the participants understand the goal and the approach to be used, and that the planning outputs have been documented.
A1 – TITLE AND APPROVAL SHEET
Plan Coverage: This Quality Assurance Project Plan for New York Work Plan for the Chesapeake Bay Program reflects the overall Quality Assurance Program framework and management systems necessary to assure that data reported by the USC are of acceptable quality to meet the needs of CBP.
Approved:
By: _____________________________ Date: ______________________
Wendy Walsh, USC Watershed Coordinator / Tioga Co. SWCD District Manager
By: _____________________________ Date: ______________________
Rich Batiuk, Associate Director for Science, EPA/ Chesapeake Bay Program
By: ______________________________ Date: ______________________
Kevin DeBell, EPA/ Chesapeake Bay Program
By: ______________________________ Date: ______________________
Mary Ellen Ley, QA Coordinator, USGS/Chesapeake Bay Program
3/31/2017 6
A2 – TABLE OF CONTENTSVersion Tracking.........................................................................................................................................................................4
Quality Assurance Project Plan Requirement................................................................................................................4
QAPP Overview............................................................................................................................................................................4
Group A – Project Management............................................................................................................................................6
A1 – Title and Approval Sheet..........................................................................................................................................6
A2 – Table of Contents.........................................................................................................................................................7
List of Figures.......................................................................................................................................................................... 9
List of Tables............................................................................................................................................................................ 9
A3: Distribution List..........................................................................................................................................................10
A4: Project/Task Organization....................................................................................................................................10
A4.1: Project summary................................................................................................................................................ 10
A4.2: Data Collection Program and Key Project Staff.....................................................................................12
A5: Problem Definition/Background........................................................................................................................14
A5.1: USC History and BMP Involvement............................................................................................................14
A5.2: Importance of Data Reporting......................................................................................................................14
A5.3: General BMP Reporting Principles.............................................................................................................14
A6: Project Description – BMP Names, Definitions, and Reporting to NEIEN.........................................16
A7: Quality Objectives and Criteria............................................................................................................................16
A7.1: Accuracy Objectives.......................................................................................................................................... 16
A7.2: Completeness Objectives................................................................................................................................17
A8: Training and Certification of Key Staff.............................................................................................................17
A8.1: Agricultural Team Training and Education............................................................................................18
A8.2: Stream Team Training and Education......................................................................................................19
A8.3: Wetland Team Training and Education....................................................................................................19
A9: Documentation and Records..................................................................................................................................20
A9.1: Data Collection Process and Data Management Systems.................................................................20
A9.2: Data Retention Time and Loss Prevention..............................................................................................21
A9.3: BMP Inspection Forms.....................................................................................................................................21
Group B: Data Generation and Acquisition..................................................................................................................22
B9: Non-direct Measurements.....................................................................................................................................22
3/31/2017 7

B10: Data Management (Tracking and Reporting Procedures)....................................................................22
B10.1: Roles and Responsibilities...........................................................................................................................22
B10.2: Data Management System and Work-Flow Diagram.......................................................................23
B10.3: Basic File Structure and Data Aggregation...........................................................................................24
B10.4: BMP Lifespans and Tracking......................................................................................................................24
B10.5: Quality Assurance and quality control...................................................................................................26
B10.6: Reporting to the NEIEN.................................................................................................................................26
B10.7: Database Upgrade............................................................................................................................................26
Group C: Assessment and Oversight...............................................................................................................................27
C1: Assessment and Response Action.......................................................................................................................27
C1.1: Structure of Assessment Protocol...............................................................................................................27
C1.2: BMP Verification................................................................................................................................................. 27
C2: Communication and Reports to Management...............................................................................................27
Group D: Data Validation and Usability........................................................................................................................29
D1: Data Review, Verification, and Validation........................................................................................................29
D1.1: CBPO Verification Principles.........................................................................................................................29
D1.2: Initial and Follow-Up Verification Requirements................................................................................30
D2: Verification and Validation Methods..................................................................................................................32
D2.1: Selection of Farms and Practices.................................................................................................................32
D2.2: Agricultural BMP Verification Methods...................................................................................................34
D2.3: Agricultural BMP Data Validation...............................................................................................................37
D2.4: Selection of Wetland BMP Verification Sites..........................................................................................37
D2.5: Wetland BMP Verification Methods...........................................................................................................38
D2.6: Wetland Data Validation.................................................................................................................................42
D2.7: Selection of Stream Restoration BMP Verification Sites...................................................................42
D2.8: Stream Restoration BMP Verification Methods....................................................................................42
D2.9: Stream Restoration BMP Data Validation...............................................................................................49
Acronyms.....................................................................................................................................................................................50
References................................................................................................................................................................................... 51
Appendices.................................................................................................................................................................................. 52
1. Appendix 1-NY Draft Ag Sampling Approach .docx2. App 2-AEM Tier 2 Worksheet for Manure and Fertilizer Management.pdf
3/31/2017 8
3. App 3-USC Ag BMP Deff 6.15.docx4. App 4-NEIEN_NPS_BMP_CBP_Data_Flow_P6Appendix_06252015 (USC).xls5. App 5-AEM Tier 1 .pdf6. App 6-USC AG Data Sheet .pdf7. App 7-Work Flow Figure B10.1.pdf8. App 8-AEM 11 Tier 5B BMP Eval Checklist.pdf9. App 9-AEM 11 Tier 5B Plan Eval Checklist.pdf10. WRP Monitoring Worksheet11. USC Stream Project Report
LIST OF FIGURESFigure 1. Upper Susquehanna River watershed.........................................................................................................11Figure 2. AEM Database System work-flow diagram...............................................................................................24Figure 3. BMP lifespan tracking approach....................................................................................................................25Figure 4. USC stream rehabilitation/restoration plan contents..........................................................................46Figure 5. Sample initial verification checklist for stream projects.....................................................................47
LIST OF TABLESTable 1. Nonpoint source BMPs reported to EPA......................................................................................................11Table 2. Focus area team membership...........................................................................................................................13Table 3. Verification principles adopted by the Principals' Staff Committee................................................30Table 4. Summary of verification coverage requirements.....................................................................................31Table 5. BMP-specific load reductions for 2013 vs. no-action scenarios for New York...........................33Table 6. Summary of proposed agricultural BMP verification approach........................................................36Table 7. Summary of proposed wetland BMP verification approach...............................................................41Table 8. Partial list of NRCS practice standards potentially used for stream restoration.......................44Table 9. Summary of proposed stream restoration BMP verification approach.........................................48
3/31/2017 9

A3: DISTRIBUTION LIST
USC Watershed Coordinator – Wendy Walsh, [email protected] USC GIS Specialist – Chris Yearick, [email protected] USC Chairperson-Jeff Parker, [email protected] USC Agricultural Team Leader – Amanda Barber, [email protected] USC Agricultural Coordinator – Emily Dekar, [email protected] USC Wetland Coordinator – Melissa Yearick, [email protected] USC Stream Team Leader – Mike Lovegreen, [email protected] SWCD Technicians – All USC-member SWCD personnel
A4: PROJECT/TASK ORGANIZATION
A4.1: PROJECT SUMMARY
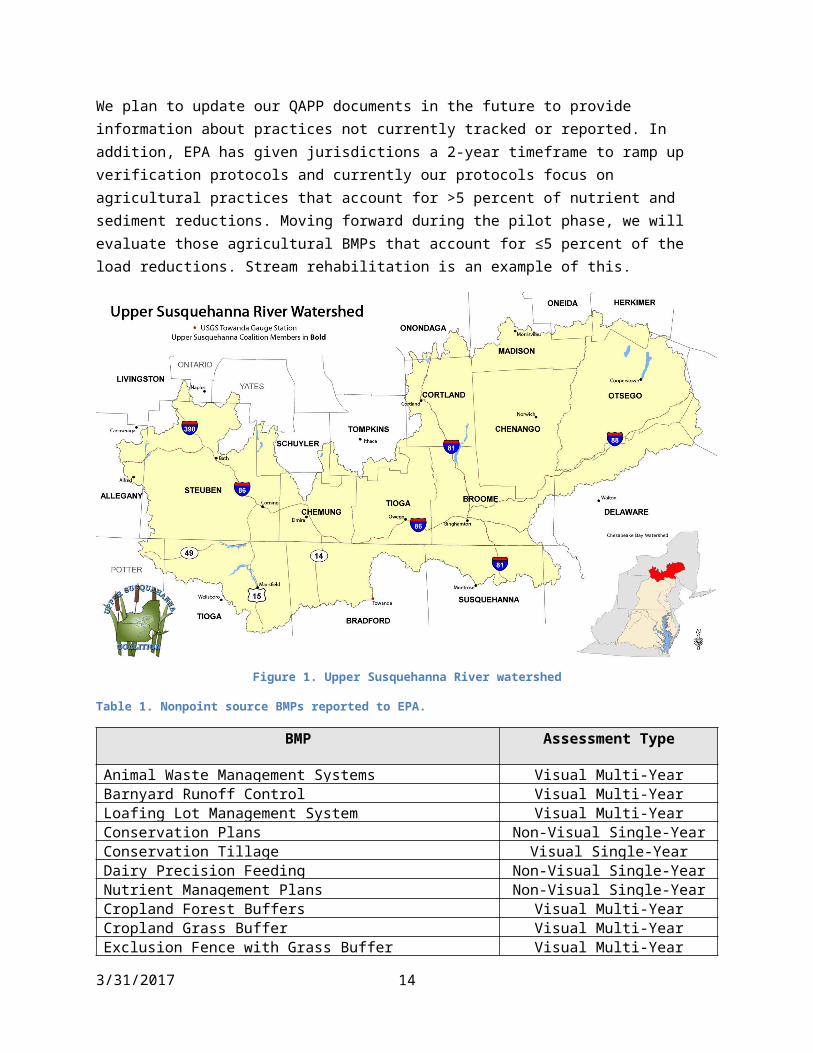
New York State currently collects data on agricultural, stream, and wetland best management practice (BMP) implementation in the New York portion of the Upper Susquehanna River watershed that drains into the Chesapeake Bay (Figure 1). The specific BMPs reported to EPA and addressed in this QAPP are shown in Table 1. Note that this list includes BMPs that we anticipate tracking for the Phase 6 CBP Watershed Model (WSM). Stream rehabilitation data are tracked but not currently reported because procedures are not finalized (see A5.3). In addition, stream rehabilitation practices currently account for less than 5 percent of pollutant load reductions. Improving tracking, reporting and verification of stream rehabilitation will be a focus in the next 2 years. Wetland restoration is tracked and reported. NYS does not currently track or report forest harvesting BMPs. Verification procedures for these practices have not been developed. The relationship, or mapping, between these reported BMPs and BMPs implemented under New York’s programs is described in section A.6 and shown in Table 4 of Appendix 1. Note that the list of BMPs in Table 4 of Appendix 1 will be updated to address all BMPs tracked and reported as we move forward. Data are aggregated at the county level and provided to the CBPO through the National Environmental Information Exchange Network (NEIEN) node.
We plan to update our QAPP documents in the future to provide information about practices not currently tracked or reported. In addition, EPA has given jurisdictions a 2-year timeframe to ramp up verification protocols and currently our protocols focus on agricultural practices that account for >5 percent of nutrient and sediment reductions. Moving forward during the pilot phase, we will evaluate those agricultural BMPs that account for ≤5 percent of the load reductions. Stream rehabilitation is an example of this.
3/31/2017 10

Figure 1. Upper Susquehanna River watershed
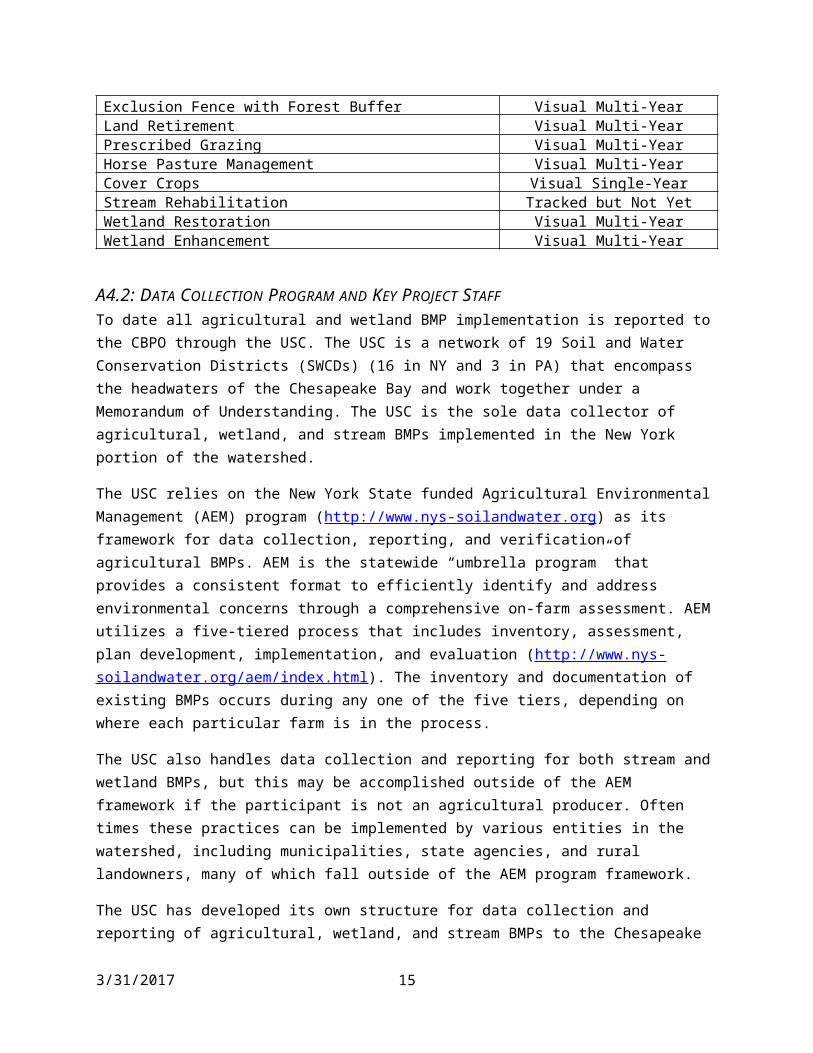
Table 1. Nonpoint source BMPs reported to EPA.
BMP Assessment Type
Animal Waste Management Systems Visual Multi-YearBarnyard Runoff Control Visual Multi-YearLoafing Lot Management System Visual Multi-YearConservation Plans Non-Visual Single-YearConservation Tillage Visual Single-YearDairy Precision Feeding Non-Visual Single-YearNutrient Management Plans Non-Visual Single-YearCropland Forest Buffers Visual Multi-YearCropland Grass Buffer Visual Multi-YearExclusion Fence with Grass Buffer Visual Multi-YearExclusion Fence with Forest Buffer Visual Multi-YearLand Retirement Visual Multi-YearPrescribed Grazing Visual Multi-YearHorse Pasture Management Visual Multi-YearCover Crops Visual Single-YearStream Rehabilitation Tracked but Not Yet ReportedWetland Restoration Visual Multi-YearWetland Enhancement Visual Multi-Year
A4.2: DATA COLLECTION PROGRAM AND KEY PROJECT STAFF
3/31/2017 11

To date all agricultural and wetland BMP implementation is reported to the CBPO through the USC. The USC is a network of 19 Soil and Water Conservation Districts (SWCDs) (16 in NY and 3 in PA) that encompass the headwaters of the Chesapeake Bay and work together under a Memorandum of Understanding. The USC is the sole data collector of agricultural, wetland, and stream BMPs implemented in the New York portion of the watershed.
The USC relies on the New York State funded Agricultural Environmental Management (AEM) program (http://www.nys-soilandwater.org) as its framework for data collection, reporting, and verification of agricultural BMPs. AEM is the statewide “umbrella program” that provides a consistent format to efficiently identify and address environmental concerns through a comprehensive on-farm assessment. AEM utilizes a five-tiered process that includes inventory, assessment, plan development, implementation, and evaluation (http://www.nys-soilandwater.org/aem/index.html). The inventory and documentation of existing BMPs occurs during any one of the five tiers, depending on where each particular farm is in the process.
The USC also handles data collection and reporting for both stream and wetland BMPs, but this may be accomplished outside of the AEM framework if the participant is not an agricultural producer. Often times these practices can be implemented by various entities in the watershed, including municipalities, state agencies, and rural landowners, many of which fall outside of the AEM program framework.
The USC has developed its own structure for data collection and reporting of agricultural, wetland, and stream BMPs to the Chesapeake Bay Program. To understand the approach used by USC, it is also important to understand the approach the USC takes toward implementation in the watershed. The USC has developed a “Multiple Barrier Approach” (MBA) for planning and implementing restoration projects on a watershed basis. The MBA addresses the issue at the source (e.g., headwaters), across the landscape, and in the stream corridor, as well as programmatically (e.g., regulations, training, and protection).
By developing multiple projects to address problems, progress can continue and tangible results achieved even with smaller funding levels. The MBA approach can increase the probability of success and help capture stakeholder interest by demonstrating progress through implementation.
A successful MBA relies on a firm understanding of how each watershed functions in relation to its hydrological characteristics, drainage patterns, topography, land cover, land uses and misuses, precipitation events, and other parameters. Flooding, streambank erosion, gravel deposition, and nutrient loading are both common problems in the Upper Susquehanna River watershed and priority USC issues.
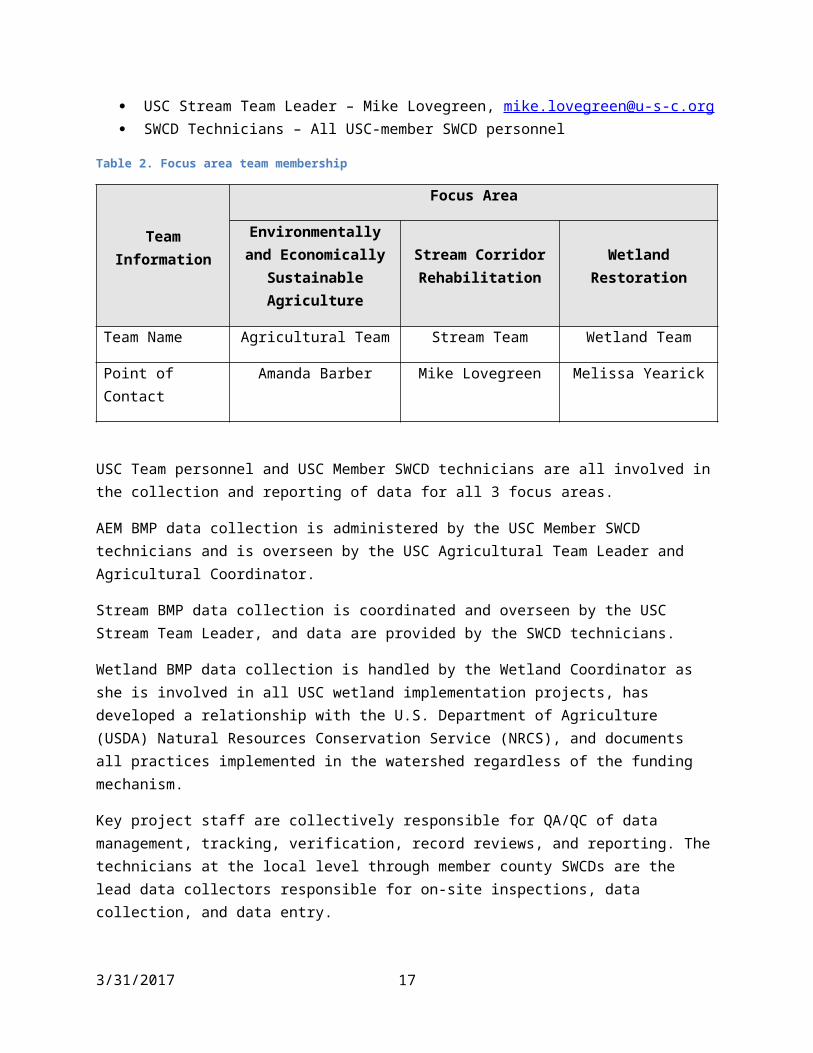
Based on this approach the USC has developed three key focus areas: environmentally and economically sustainable agriculture, stream corridor rehabilitation, and wetland restoration. The USC has supported the use of the MBA by the creation of “teams” for each of these focus areas (Table 2). Each team has a team leader and in some cases a program coordinator. Below is a listing of the key project staff identified for these teams.
3/31/2017 12

Key Project Staff
USC Watershed Coordinator – Wendy Walsh, [email protected] USC GIS Specialist – Chris Yearick, [email protected] USC Chairperson-Jeff Parker, [email protected] USC Agricultural Team Leader – Amanda Barber, [email protected] USC Agricultural Coordinator – Emily Dekar, [email protected] USC Wetland Coordinator – Melissa Yearick, [email protected] USC Stream Team Leader – Mike Lovegreen, [email protected] SWCD Technicians – All USC-member SWCD personnel
Table 2. Focus area team membership
Team Information
Focus Area
Environmentally and Economically Sustainable
Agriculture
Stream Corridor Rehabilitation
Wetland Restoration
Team Name Agricultural Team Stream Team Wetland Team
Point of Contact Amanda Barber Mike Lovegreen Melissa Yearick
USC Team personnel and USC Member SWCD technicians are all involved in the collection and reporting of data for all 3 focus areas.
AEM BMP data collection is administered by the USC Member SWCD technicians and is overseen by the USC Agricultural Team Leader and Agricultural Coordinator.
Stream BMP data collection is coordinated and overseen by the USC Stream Team Leader, and data are provided by the SWCD technicians.
Wetland BMP data collection is handled by the Wetland Coordinator as she is involved in all USC wetland implementation projects, has developed a relationship with the U.S. Department of Agriculture (USDA) Natural Resources Conservation Service (NRCS), and documents all practices implemented in the watershed regardless of the funding mechanism.
Key project staff are collectively responsible for QA/QC of data management, tracking, verification, record reviews, and reporting. The technicians at the local level through member county SWCDs are the lead data collectors responsible for on-site inspections, data collection, and data entry.
3/31/2017 13
A5: PROBLEM DEFINITION/BACKGROUND
A5.1: USC HISTORY AND BMP INVOLVEMENT
EPA’s Chesapeake Bay Total Maximum Daily Load (TMDL) requires New York to reduce nutrient and sediment pollutant loads to the Chesapeake Bay. As illustrated by Figure 1, the Susquehanna and Chemung rivers flow south from New York to the Chesapeake Bay. The USC has been New York State Department of Environmental Conservation’s (DEC’s) primary local partner since New York formally joined the effort to restore the Chesapeake Bay in 2000. New York’s efforts to meet its Chesapeake Bay restoration goals rely heavily on the work of the USC to implement BMPs to reduce pollutant loads and to collect data about BMPs that are implemented. Without the USC, New York cannot meet its Chesapeake Bay restoration goals and would be subject to regulatory penalties from EPA.
Established in 1992, the USC is a coalition of 16 SWCDs in New York and 3 SWCDs in Pennsylvania whose mission is to protect and improve water quality and natural resources in the Upper Susquehanna River watershed. Through a Memorandum of Understanding, the Tioga County SWCD is designated as the administrator and fiscal agent of the USC.
A5.2: IMPORTANCE OF DATA REPORTING
Even before it was formalized in 2000 when the AEM program was enacted into the New York State Agriculture and Markets Law, the USC’s SWCDs from New York had begun efforts to collect BMP data. SWCDs have a long history of implementing agricultural NPS BMPs and retain extensive hard copies of their projects in cooperator files. Data were solicited from NRCS, USDA Farm Services Agency (FSA), and SWCD files since the period 1985 to 2005. This timeframe represents the baseline BMP data for New York State. All baseline data collection was completed by December 2005. Data collection has continued since 2006. In 2013, a new online AEM Data Management Application was developed to manage historical and future BMP data collection for reporting to the CBPO. The USC is the sole provider of county-level agricultural, stream, and wetland data reported to the DEC. The DEC manages reporting of data to the CBPO through the NEIEN node.
A5.3: GENERAL BMP REPORTING PRINCIPLES
The goal of BMP data collection is to provide information to the CBPO that will assist in a more accurate estimate of baseline practices and future conservation needs on agricultural lands in the New York portion of the Chesapeake Bay watershed. The data are reported in standardized formats and codes via the NEIEN node. The CBPO creates annual progress scenarios using the WSM to describe, assess, and report the status of the restoration efforts, including estimated reductions in nitrogen, phosphorus and sediment loadings to Chesapeake Bay and its tidal tributaries. The CBPO uses these assessments to track progress toward meeting the New York State Phase II Watershed Implementation Plan (WIP) target loads.
To facilitate accurate reporting of agricultural BMP data, the USC has developed an online AEM Data Management System tool for use by the SWCDs in reporting agricultural data directly from their offices to a server. The tool uses GIS (Geographic Information System) and mapping capabilities to identify and geographically reference BMPs to a specific farm. Annual reporting consists only of
3/31/2017 14
new BMPs implemented that particular year and BMPs that were identified that year but not previously captured. Annual or single-year BMPs are reported once they are verified for that year. Previously reported multi-year structural BMPs are only reported once. This is treated as historical data and the data on these multi-year structural BMPs are not re-entered even if the BMP name is changed by the CBPO. BMP units are field verified and reported directly in the units established by the CBPO. The USC accesses the USDA federal cost-share practice data annually through a 1619 data-sharing agreement1. These USDA data are used only for QA purposes to ensure BMP data were not missed through AEM reporting. Any missing data would then be field verified and reported by the USC.
Data collection efforts are handled differently for the stream and wetland practices. For streams the USC Stream Team Leader provides a form (Appendix 11) for each District to log completed practices that were implemented within their county that year. The form is completed by SWCD staff and then sent back to the USC Stream Team Leader who acts as the repository for these practices. At this time the data are not provided to the CBPO because the USC still needs to find a way to document and capture this information with the online tool for reporting thru the NEIEN node.
Wetland implementation is tracked by the USC Wetland Coordinator, including USC, NRCS, and U.S. Fish and Wildlife Service (USFWS) implementation projects. These data are provided to the GIS Specialist on a county by county basis. The GIS Specialist then sums the wetland data implemented by each county and manually enters it into the online tool. These data are then included with DEC’s submittal of USC data through the NEIEN node.
It is important to mention that both cost-shared and non-cost shared practices are being implemented within the watershed. The USC tracks and reports these practices regardless of the implementation mechanism. Cost-shared practices meet CBP or NRCS conservation practice standards. Practices that are implemented without cost share often meet the CBP or NRCS conservation practice standards, but there are cases where such standards are not met despite providing similar environmental benefits. Practices that do not meet the conservation practice standard associated with our state and or federal cost-share programs but still provide a similar annual environmental benefit for water quality are called Resource Improvement (RI) BMPs. The USC will track and report RI practices in accordance with EPA’s guidance on reporting and verifying RI practice implementation (Chesapeake Bay Program Resource Improvement Practice Definitions and Verification Visual Indicators Report 2014). SWCD technicians will review and utilize Tier 2 AEM worksheets (see Appendix 2 for an example; others can be found at http://www.nys-soilandwater.org/aem/techtools.html) and complete a visual assessment of these practices in order to document and capture these RI practices in the online tool.
1By signing a 1619 Conservation Cooperator Agreement with NRCS and FSA, New York is granted access to the USDA’s datasets while maintaining data confidentiality as required by Section 1619 of the Food, Conservation, and Energy Act of 2008 (2008 Farm Bill).
3/31/2017 15
A6: PROJECT DESCRIPTION – BMP NAMES, DEFINITIONS, AND REPORTING TO NEIEN
BMP definitions are found in the Microsoft Word file “USC Ag BMP Deff6.15” which is attached as Appendix 3. On page 11 of that document is a spreadsheet table (NEIEN_NPS_BMP_CBP_Data_Flow_P6AppendixA_1_06092015.xlsx) showing USC BMP to Scenario Builder BMP Mapping. This information is also available in final form on worksheet “USC Names w NEIEN” of the Excel file “NEIEN_NPS_BMP_CBP_Data_Flow_P6Appendix_06252015 (USC).xlsx” which is included as Appendix 4. The information in this worksheet represents the current 2015 BMP information, including units and all relationships between CBP BMP names and USC BMP names. All BMPs are current, including the stream exclusion fencing BMP which was changed by EPA and is included in the NEIEN table. The USC is requesting a new Scenario Builder BMP for cover crop BMPs highlighted in yellow in rows 15 and 18 of the “USC Names w NEIEN” worksheet in the Excel file “NEIEN_NPS_BMP_CBP_Data_Flow_P6Appendix_06252015 (USC).xlsx”.
Farms in each county are mapped in GIS. The data are then transferred (digitized) to GIS. USC and SWCD technicians then collect BMP data for each farm, tagging them with the latitude/longitude coordinates of the farm where the BMPs are applied. BMP data are tagged with a Chesapeake Bay identifier to indicate that the BMPs are geographically part of the Chesapeake Bay Watershed. Data are then aggregated by county and processed into the required XML data exchange files for the NEIEN. The NYS Agriculture and Markets Law requires that data be aggregated by county to protect farmer confidentially.
The wetland data are tracked by site using information from the various implementation representatives, and compiled by the USC Wetland Coordinator into the Chesapeake Bay Wetland Workgroup tracking spreadsheet. Each site record is assigned a unique identifier and contains acreage, completion date, prior landuse, and location information. Wetland data are provided to the GIS Specialist on a county-by-county basis.
The USC is currently working on how to report collected stream rehabilitation project data into the tracking system as well.
A7: QUALITY OBJECTIVES AND CRITERIA
A7.1: ACCURACY OBJECTIVES
BMP projections are made annually based on the WSM reduction requirements and projects scheduled for that year. These projections are compared to the actual BMPs reported at the end of the year. The USC is in the process of generating county-level reports from the AEM Data Management System that will allow an end-of-year BMP report for the current year and a total of the historical data for comparison to previous years.
3/31/2017 16
A7.2: COMPLETENESS OBJECTIVES
There is low potential for double counting BMPs, the inclusion of expired and non-functional BMPs, or failure to implement annual BMPs because the data are site specific. These issues are addressed in greater detail in section B.10.
Each USC-member SWCD collects BMP data throughout the year and data are submitted by October first. A single BMP data transfer XML file is created for each county, for each year. This creates a data calendar year that starts on October first and ends on October first of the following year. All new BMPs reported are field verified by technicians. The verification of historical, expired, or annual practices (BMP data are coded by year of implementation) is under development and is described in section D2.2.
A8: TRAINING AND CERTIFICATION OF KEY STAFF
The mission of the USC is to protect and improve water quality and natural resources in the Upper Susquehanna River Basin with the involvement of citizens and agencies through planning and implementation of conservation projects, education, and advocacy for water resources. Each of the 16 NY SWCDs that are USC members are designated as the "lead" for water quality issues in their county and each has over 60 years of experience working on water quality issues with local landowners, natural resource partners, municipalities, industries, and regulators.
The USC currently communicates to its 16 NY member Districts using existing infrastructure and well-established relationships and traditions. Furthermore, our strategies are shared through a basin-wide array of professional partnerships that are focused on the Chesapeake Bay watershed effort. Other communication tools include USC bi-monthly meetings and partnerships with crop consultants, nutrient management and CAFO (concentrated animal feeding operation) planners, New York Farm Bureau, and the Northeast Dairy Producers Association. Moreover, the USC has strong partnerships with NRCS, FSA, DEC, NYS Department of Agriculture & Markets, and the Soil and Water Conservation Committee (SWCC) in New York. As a result, the USC is in a strong position to communicate our approach accurately and efficiently.
As described in section A4.2, the USC uses a "multiple barrier approach" for planning and implementation that addresses issues at the source, across the landscape, and in the stream corridor. At the basin-wide scale, the USC uses its success in soil and water conservation to be an active partner in the multi-state effort to restore the Chesapeake Bay. The USC is also the lead in New York for developing the agricultural NPS implementation portion of the Phase I and Phase II WIPs.
While individual SWCDs implement BMPs across a wide variety of land uses, the USC focuses our efforts on three key focus areas: Environmentally and Economically Sustainable Agriculture, Stream Corridor Rehabilitation, and Wetland Restoration. Each focus area has a team leader and coordinator to facilitate effective and efficient implementation within each SWCD and across the basin to meet local and regional water quality goals. Central to the success of the USC is its 'vertical and horizontal' integration: the USC plans, designs, and implements using its own professional staff, technicians, and equipment. The USC represents a basin-wide distribution of natural resources
3/31/2017 17

professionals that has established relationships and partnerships with stakeholders at every level (local, state, multi-state, and federal). The result has been a productive, decades-long history of strengthening and promoting environmental stewardship and protecting water quality at all scales.
Because the USC and SWCD members recognize the importance of training our resource professionals, each USC focus area has specific training and education opportunities as described below.
A8.1: AGRICULTURAL TEAM TRAINING AND EDUCATION Training of resource professionals from the public and private sectors is a vital component of AEM. Training is regularly provided to SWCDs and their partners with NRCS, Cornell Cooperative Extension, Private AEM Certified Planners, Certified Crop Advisors (CCA), NRCS Technical Service Providers (TSP), and agri-businesses. Training is overseen by the AEM State-wide Interagency Committee that reports to the SWCC. It is guided by a Technical Development Curriculum developed by the Conservation Partnership and endorsed by the SWCC and the NYS Conservation Districts Employee’s Association (CDEA). The curriculum has two tracks, one for planners who generally identify environmental concerns and opportunities and work with the farmer to plan solutions, and another for technicians who generally develop detailed designs of BMPs and oversee the installation. Training on the curriculum and related topics is provided annually at three venues:
NYS Water Quality Symposium (WQS) – 3 days of concurrent training held annually in March. Over 300 participants attend including Conservation District staffs and conservation partners from NRCS, Cooperative Extension, AEM Certified Planners, DEC staff, some farmers, and agribusiness representatives. The WQS annually hosts the classroom component of the AEM Planner Certification requirements. The WQS has occurred annually since 1979 and is funded through state funds and participant registrations.
NYS Conservation Skills Workshop (CSW) – 4.5 days of concurrent field training in support of the curriculum is held annually in October. Training at the CSW is often the field component of classroom training initiated at the WQS. The audience is similar to the WQS and averages 130 participants annually. The CSW has occurred annually since 1997 and is supported through participant registrations and contributions from CDEA, SWCC, and NRCS.
Northeast Region Certified Crop Advisor Annual Training Session (NRCCA) – 3 days of concurrent training held annually in December for Certified Crop Advisors and all conservation partners. Sessions are awareness oriented related to conservation programs, regulatory issues, current events, and new technology. Offerings at the NRCCA are coordinated with the Interagency Training Committee. The audience is predominantly CCAs from the public sector (Cooperative Extension, NRCS, and SWCD) and agri-businesses averaging around 150 participants annually. A training component for professional engineers (PEs) associated with AEM Certified Planners is often held in conjunction with the NRCCA or the WQS. The training is supported through participant registrations and has been held since 1992.
In addition to the three annual training events described above, numerous other statewide and regional sessions are offered through the AEM Interagency Training Committee as needed to
3/31/2017 18

support the curriculum, programs, and regulations, as well as address emerging needs, issues, and technology. Examples of training opportunities held annually that are available to the conservation partnership, CCAs, TSPs, and agribusiness include:
AEM: Overview of Procedures and Tools for Inventory and Assessment AEM: Overview of Procedures and Tools for Conservation Planning AEM Communications Training Phase 1, 2, and 3 Cropland Conservation Planning Field Session Farmstead Resource Concern Identification Nutrient Management and Groundwater Cover Crops Field Day Soil Health Training Course Conservation Planning on Pasture Cornell Cropware Nutrient Management Planning and RUSLE2 Training NRCS Phase 3 Conservation Planning Training
The USC takes team approach to all of the agricultural issues within the Chesapeake Bay watershed, including BMP data collection. Key USC project staff identified in section A4.2 who are responsible for the BMP data collection efforts include a Watershed Coordinator, Agricultural Team Leader, Agricultural Coordinator, GIS Specialist, and SWCD technicians. USC Staff and the USC-member SWCDs staff maintain a variety of professional certifications that include CCA, Certified Agricultural Environmental Management Planner (AEM Planner), Certified Professional in Erosion and Sediment Control (CPESC), and TSP. These resources are available to all USC-member counties.
A8.2: STREAM TEAM TRAINING AND EDUCATION
The USC has developed a core group of individuals throughout the membership that enable the USC to address issues related to stream resources. The USC believes that it is critical to both expand that group to include others from member SWCDs as well as expand and continue the professional competency of those involved. Members of the USC Stream Team and SWCD continue to improve skills and knowledge through annual trainings including the WQS and the CSW which both have stream management tracks that our technicians attend. In addition, the USC also seeks out specific training for staff based on program initiatives and priorities, including HEC RAS modeling, Culvert Assessment, etc. The USC recently won the 2015 NYSDEC Environmental Excellence Award for stream training sessions we offer throughout the watershed. Our team is recognized by the state as being the leader in stream corridor management and as such offers opportunities for sharing that expertise with partners, agencies, and others as needed.
A8.3: WETLAND TEAM TRAINING AND EDUCATION The USC Wetland Team is also comprised of highly trained individuals who are leaders in their field. This is evidenced by the fact that the USC has been designated by the DEC as the official NY wetland data manager for the Chesapeake Bay Program and is responsible for New York’s wetland goals in its Chesapeake Bay Tributary Strategy. In addition to that, the USC is the Chesapeake Bay Program’s “Wetland Champion” nominated to promote accelerated wetland restoration in the Basin. Our staff attend training similar to the above but also attend NYS Wetlands Forum and other training opportunities throughout the year. The USC Wetlands Team has also been awarded for
3/31/2017 19

being leaders of our field, winning the NYSDEC Environmental Excellence Award in 2014 and winning the EPA Environmental Champion Award in 2015.
A9: DOCUMENTATION AND RECORDS
A9.1: DATA COLLECTION PROCESS AND DATA MANAGEMENT SYSTEMS
As mentioned in section A4.2, the USC teams and or SWCD members track and collect data for streams, wetlands, and agricultural BMPs implemented in the watershed. The USC Stream Team leader works with SWCD technicians to capture implemented stream rehabilitation projects that meet the CBP definitions. The form currently used to report stream projects is provided in Appendix 11. This form will be reassessed as part of the effort to determine the best way to report collected stream rehabilitation project data into the tracking system. The USC Stream Team and GIS Specialist are working with a consultant to develop a way to enter these data into our online tool in order to submit this information to the CBPO through the NEIEN node. Wetland implementation tracked by the USC Wetlands Coordinator includes projects constructed by the Wetlands Team, the USFWS and the NRCS. This information is tracked by project, summarized by county for submission by our GIS Specialist, and then reported through the NEIEN node. Both the USC GIS Specialist and the USC Wetlands Coordinator keep hard copies of the wetland implementation data. Similarly, both the USC Stream Team Leader and GIS Specialist keep stream implementation records.
The USC Agricultural team and USC member SWCDs are the agricultural data providers. As described in section A4.2, they use the NYS AEM Program as its framework. Each county uses the highly interactive AEM on-farm framework and has resource professionals and peers working with the farmer throughout the process. This framework and associated process are designed to increase farmer awareness of the impact farm activities have on the environment. Further, it encourages farmer participation and seeks behavioral change, both of which are important overall goals. AEM utilizes the NRCS Planning Process as enhanced by its five-tiered framework. Initial BMP data collection starts with the AEM Tier 1 worksheet which is included as Appendix 5.
USC staff or an SWCD Technician uses AEM Tier 1 to collect farm contact information; inventories farm infrastructure, land use, and livestock; determines the farm’s future plans; informs the farmer of their watershed(s) and watershed concerns; and identifies potential environmental concerns and opportunities (see http://www.agriculture.ny.gov/SoilWater/aem/techtools.html for details). This information is kept confidential and coded with an individual farm AEM ID.
BMP data collection can be conducted throughout any of the five AEM Tiers by using the USC CBP Agricultural Environmental Management Ag BMP Data Entry Sheet which is included as Appendix 6. All relevant BMP data that will be reported to the CBPO can be captured on this sheet in a form ready for data entry to the online AEM Data Management System. Each SWCD keeps track of BMPs installed under different contracts associated with NYS Agriculture and Markets grants or other non-federal cost share funding. Each District will meet with NRCS and FSA staff to document and review the list of USDA cost-shared projects. All of these data are compiled and entered into the AEM Data Management System.
3/31/2017 20
A9.2: DATA RETENTION TIME AND LOSS PREVENTION
Each SWCD keeps a back-up copy of its own data in a hard copy, Excel spreadsheet, or Access database. These copies are stored in Cooperator Files and/or stored on the SWCD servers. Backup procedures are determined by the District. Once the BMP data are entered into the online AEM data management application the USC GIS Specialist can provide data feedback reports about the data to the individual SWCDs and other entities.
AEM plans, on-farm surveys, and assessments filed with the Department of Agriculture and Markets or filed with or prepared by county SWCDs are considered confidential and not subject to public disclosure, except such documents will not be considered confidential as deemed necessary by the Agricultural Commissioner or the SWCDs to implement the purposes of confidentiality. AEM and SWCDs cooperator files are retained permanently.
The AEM Database Management system is housed on servers located at the Southern Tier Central Regional Planning and Development Board. The SQL databases are backed up internally daily. The server is set up with RAID 5 and has an extra drive installed. That extra drive will have data written to it if a drive fails. Backup copies are created on RD1000 tape media periodically depending on new data installed or created.
A9.3: BMP INSPECTION FORMS
Inspection forms are currently being considered and investigated by the USC Agricultural Team working with the USC Agricultural Committee, which includes additional partners and experts. This process is under development and included in the BMP verification program in Section D. The BMP information is captured using the AEM Tier 2 (available athttp://www.nys-soilandwater.org/aem/techtools.html) and USC CBP Ag BMP Data Entry Sheet (Appendix 6) under the current process.
3/31/2017 21
GROUP B: DATA GENERATION AND ACQUISITION
The elements in this group address all aspects of project design and implementation. Implementation of these elements ensures that appropriate methods for sampling, measurement and analysis, data collection or generation, data handling, and QC activities are employed and are properly documented.
Sections B1 through B8 of an EPA-required QAPP (USEPA 2006) are not directly applicable to NPS BMP data tracking and reporting. Situations where implementing organizations generate data through sampling to answer research questions do occur. For example, soil samples are taken during the development of a nutrient management plan to determine appropriate fertilizer and manure application rates. Likewise, manure is sampled to determine nutrient content. Details regarding any sampling protocols related to evaluation of NPS BMPs will be incorporated in future versions of this QAPP.
B9: NON-DIRECT MEASUREMENTS
All data used to record and report on agricultural, stream, and wetland BMP implementation in New York’s portion of the Upper Susquehanna River watershed is collected directly. There is no reliance on non-measurement sources such as computer data bases, programs, literature files, and historical data bases.
B10: Data Management (TRACKING AND REPORTING PROCEDURES)
B10.1: ROLES AND RESPONSIBILITIES
AEM BMP data collection is administered by the USC Agricultural Team. The Agricultural Coordinator and the GIS Specialist are responsible for QA/QC of data management, tracking, verification, record reviews, and reporting. Technicians at the local level through USC-member SWCDs are the lead data collectors responsible for on-site inspections, data collection, and data entry.
1) Stream Data: As described previously, stream data are requested via the USC Stream Team Leader and are provided by each SWCD with project implementation data. These data are tracked by county in a spreadsheet format. The USC is currently tracking the practices and plans to develop a procedure for reporting these data in the future. Sections D2.7-D2.9 describe current plans for tracking and crediting stream projects.
2) Wetland Data: The Wetland Coordinator is responsible for collecting, verifying, and reporting to the GIS Specialist all wetland implementation in the watershed. This information is aggregated at the county level for reporting to the GIS Specialist. The GIS Specialist then enters the data into the database after the information is aggregated from the AEM online tool. The wetland practices are reported via the NEIEN node with the agricultural practices.
3) Agricultural Data: Each SWCD is responsible for collecting, verifying, and entering agricultural BMP data in their county. Each SWCD keeps track of BMPs installed under different contracts associated with NYS Agriculture and Markets grants or other non-federal
3/31/2017 22
cost-share funding. Each District meets with NRCS and FSA staff and reviews the list of USDA cost-shared projects. The SWCD staff also participates in DEC CAFO visits and reviews previous year CAFO reporting as another means of ensuring that all BMPs are reported. All of these data are compiled and entered into the AEM Data Management System using a standardized USC CBP Agricultural BMP Data Entry Sheet. Additional details of how BMP data are obtained are provided in section A9.1.
B10.2: DATA MANAGEMENT SYSTEM AND WORK-FLOW DIAGRAM
The AEM Data Management System is an online tool developed using ESRI’s ArcServer Software and Microsoft Silverlight. The tool allows for a common database standard that is directly formatted to match the Chesapeake Bay Program’s WSM schema. The database is created using SQL Server software and is designed as a multi-tiered relational database.
The AEM Data Management System is housed on servers located at the Southern Tier Central Regional Planning and Development Board. The SQL databases are backed up internally daily. The server is set up with RAID 5 and has an extra drive installed. That extra drive will have data written to it if a drive fails. Backup copies are created on RD1000 tape media periodically depending on new data installed or created.
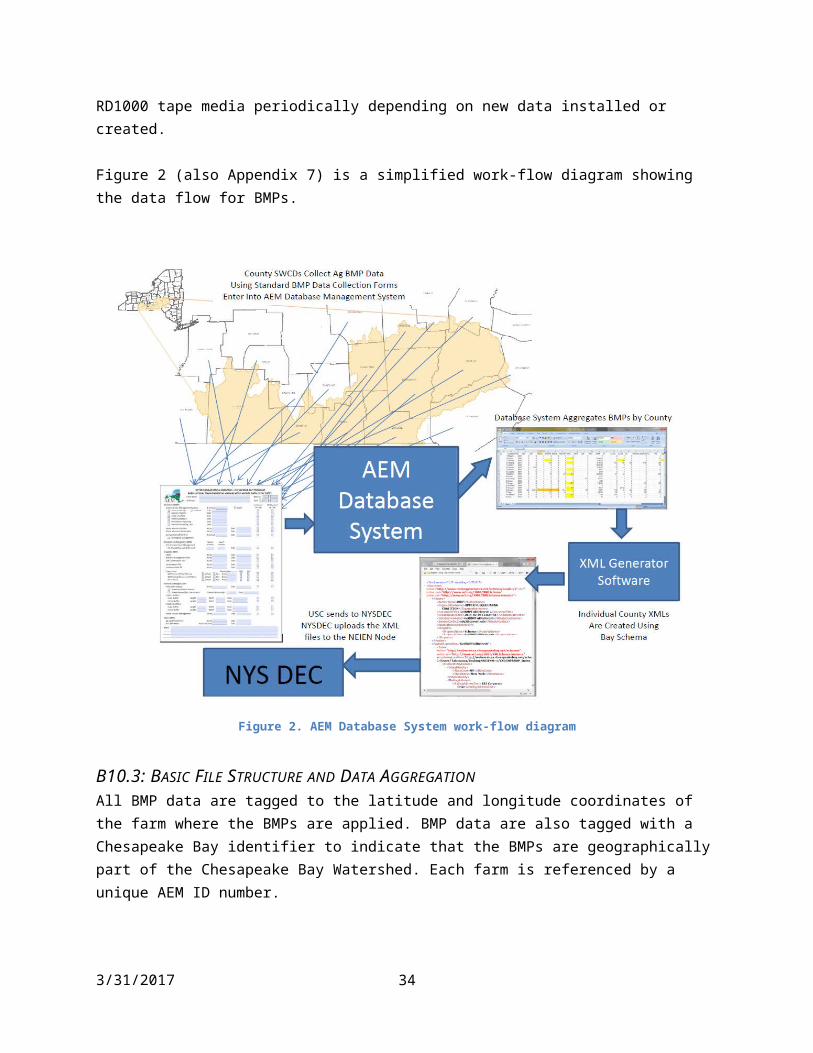
Figure 2 (also Appendix 7) is a simplified work-flow diagram showing the data flow for BMPs.
3/31/2017 23

Figure 2. AEM Database System work-flow diagram
B10.3: BASIC FILE STRUCTURE AND DATA AGGREGATION
All BMP data are tagged to the latitude and longitude coordinates of the farm where the BMPs are applied. BMP data are also tagged with a Chesapeake Bay identifier to indicate that the BMPs are geographically part of the Chesapeake Bay Watershed. Each farm is referenced by a unique AEM ID number.
All BMP and farm point data collected under the AEM program is protected under NYS Department of Agriculture and Markets Law and confidentiality law. Data are aggregated by county in accordance with this law and processed into the required XML data exchange files for the NEIEN.
B10.4: BMP LIFESPANS AND TRACKING
BMP lifespans will be tracked using the implementation date or an updated verification date as illustrated in Figure 3. Lifespans used for BMPs are those set by the CBP. The USC Agricultural Team and Agricultural Committee are currently developing the capability to run an annual query of the AEM Data Management System and generate county reports identifying all BMPs that will expire during that year. This process is to be included as part of the BMP verification program described further in section D.
3/31/2017 24
USC BMP Name (NEW MAPPING) Credit Duration
Animal Waste Management Systems 15 Waste Storage Facility 15 Barnyard Runoff Controls 10 Loafing Lot Management System 10 Conservation Tillage 1 Cover Crops 1 Comprehensive Nutrient Management Plans
1 Conservation Plans 10 Precision Feed Management Dairy 1 Horse Pasture Management 10 Prescribed Grazing 10 Cropland Forest Buffer 10 Cropland Grass Buffer 10 Narrow Cropland Forest Buffer 10 Narrow Cropland Grass Buffer 10 Exclusion Fence with Grass Buffer 5 Exclusion Fence with Forest Buffer 5 Exclusion Fence with Narrow Grass Buffer 5 Exclusion Fence with Narrow Forest Buffer 5 Ag Land Retirement 10 Wetland Restoration 15
Figure 3. BMP lifespan tracking approach
3/31/2017 25

B10.5: QUALITY ASSURANCE AND QUALITY CONTROL
The USC database is a comprehensive source of agricultural BMP implementation in New York, including BMPs funded by both state and federal programs. The online application of the AEM Data Management System has numerous security measures in place. Staff from USC-member SWCDs are the only people who enter data into the USC database, and all users are issued a unique password and credentials for their assigned geographic extent. In addition, the AEM Data Management System user guide (User Guide for Agricultural Environmental Management Web Application) is provided to all USC staff and USC-member SWCD staff. This guide is used as part of annual training and updated annually as changes are made to the AEM Data Management System.
Each year, SWCD staff review BMP implementation data with NRCS and FSA staff in each county to verify that all federally-funded BMPs are included and that none are double-counted or missed. After all data are entered each year, the USC requests summary BMP implementation data from NRCS and FSA headquarters to compare to the data in the database for quality control. Once these data entry and quality control processes are complete each year, the USC database becomes the sole source of agricultural BMP information used for New York’s annual Progress Reporting.
B10.6: REPORTING TO THE NEIENBecause USC is not a state entity, the XML files generated are sent to DEC to be uploaded into the NEIEN through the DEC NEIEN network node located in Albany. An Excel file (NEIEN_NPS_BMP_CBP_Data_Flow_P6Appendix_06252015 (USC).xlsx) (Appendix 4) is the final version of the NEIEN NPS BMP CBP Data Exchange Table.
B10.7: DATABASE UPGRADE
The USC created the AEM Data Management System during the infancy of the CBP to track practice implementation progress and record livestock numbers in the watershed. As a result, our database will need a significant upgrade to address the verification process outlined in section D. This will include entry of practice lifespans, practice maintenance dates, and other information needed to document verification. This will be a significant and costly endeavor for which the USC will need to secure funds.
3/31/2017 26
GROUP C: ASSESSMENT AND OVERSIGHTThe elements in this group address the activities for assessing the effectiveness of the implementation of the project and associated QA and QC activities. The purpose of assessment is to ensure that the QA Project Plan is implemented as prescribed.
C1: ASSESSMENT AND RESPONSE ACTION
C1.1: STRUCTURE OF ASSESSMENT PROTOCOL
The USC assesses data acquisition and verifications annually, led by the USC Program and Team Leaders, the Watershed Coordinator and GIS Specialist. The USC member SWCDs are informed of new information concerning BMP data, definitions, collection procedures, entry procedures, and projected timelines for their BMP data management goals. There is an established infrastructure for communication which includes bi-monthly USC meetings, monthly Team conference calls, and a Team e-mail list. Each of these elements offers a mechanism to provide new information, assess progress, answer questions, and have general discussions about all aspects of the BMP data management system. In addition, there are multiple trainings available as described in section A8 and a mandatory annual training for the BMP data management system.
As described in section B10.1, the data providers are SWCD technicians, and all collected data must meet the specifications outlined in sections A9 and B10. The AEM Data Management System also helps to control data quality by limiting data entry to only those data that are suitable for reporting. The data will be verified according to the procedures in Section D.
C1.2: BMP VERIFICATION
The BMPs and definitions the USC has historically used are identified in section A6 and the appendices referred to therein. It is the goal of the USC to fully verify all historical BMP data that has been entered into the WSM through 2015. The USC completed an historical databased cleanup in 2015. All newly implemented BMPs will be field verified and entered for the year of completion. The USC has identified the BMPs identified in section A6 based on the ability to collect associated implementation data and input that data to the WSM. The BMPs were not specifically or thoroughly investigated to account for the greatest nutrient and sediment pollutant load reductions. A new effort began in 2016 to assess the current BMPs, definitions, and detailed coding practices to ensure that the highest priority practices are reported and nutrient and sediment pollutant load reductions are fully accounted for by the new Phase 6 WSM. The USC Wetland, Stream, and Agricultural Teams continue to work with our partners and experts to achieve these goals while the BMP verification program outlined in Section D is further developed and piloted.
C2: COMMUNICATION AND REPORTS TO MANAGEMENT
Key project staff of the USC (see section A4.2) will be kept informed of project oversight, assessment activities, and findings by the communication infrastructure which includes bi-monthly USC meetings, monthly and quarterly Team conference calls, and a Team e-mail distribution list.
3/31/2017 27

USC Program Coordinators, Team Leaders and the GIS Specialist complete monthly activity reports that are provided to the USC Watershed Coordinator and sent out to the USC Executive Board for review. USC key project staff will develop other reports as required.
3/31/2017 28
GROUP D: DATA VALIDATION AND USABILITYThe elements in this group address the QA activities that occur after the data collection or generation phase of the project is completed. Implementation of these elements ensures that the data conform to the specified criteria, thus achieving the project objectives.
D1: DATA REVIEW, VERIFICATION, AND VALIDATION
D1.1: CBPO VERIFICATION PRINCIPLES
The Chesapeake Bay Program has called for increased transparency and scientific rigor in the verification of the BMPs that are implemented as part of the states’ WIPs and the Chesapeake Bay TMDL. To respond to this request, Strengthening Verification of Best Management Practices Implemented in the Chesapeake Bay Watershed: A Basinwide Framework - Report and Documentation from the Chesapeake Bay Program Water Quality Goal Implementation Team’s BMP Verification Committee (Verification Framework) (Chesapeake Bay Program 2014), was developed. The Verification Framework is intended to serve as a guide for the states to document the methodology for verification of BMP installation, function, and continued effectiveness of practices over time. This Verification Framework provides the requirements for reporting and documentation of practice verification for the states to follow. Specific guidance is provided for each of the source sectors (agriculture, forestry, urban stormwater, wastewater, wetlands, and streams).
Verification is formally defined by the Chesapeake Bay Program partners as “the process through which agency partners ensure practices, treatments, and technologies resulting in reductions of nitrogen, phosphorus, and/or sediment pollutant loads are implemented and operating correctly.” The Chesapeake Bay Program partnership’s Principals’ Staff Committee formally adopted five verification principles in December 2012; these are described in Table 3. The USC is committed to adhering to these verification principles in the collection and reporting of BMP implementation data.
3/31/2017 29
Table 3. Verification principles adopted by the Principals' Staff Committee
Principle Description
Practice Reporting Affirms that verification is required for practices, treatments, and technologies reported for nitrogen, phosphorus and/or sediment pollutant load reduction credit through the Bay Program. This principle also outlines general expectations for BMP verification protocols.
Scientific Rigor Scientific Rigor Asserts that BMP verification should assure effective implementation through scientifically rigorous and defensible, professionally established and accepted sampling, inspection and certification protocols. Recognizes that BMP verification shall allow for varying methods of data collection that balance scientific rigor with cost effectiveness and the significance of or priority placed upon the practice in achieving pollution reduction.
Public Confidence Calls for BMP verification protocols to incorporate transparency in both the processes of verification and tracking and reporting of the underlying data. Recognizes that levels of transparency will vary depending upon source sector, acknowledging existing legal limitations and the need to respect individual confidentiality to ensure access to non-cost shared practice data.
Adaptive Management Recognizes that advancements in practice reporting and scientific rigor, as described above, are integral to assuring desired long-term outcomes while reducing the uncertainty found in natural systems and human behaviors. Calls for BMP verification protocols to recognize existing funding and allow for reasonable levels of flexibility in the allocation or targeting of funds.
Sector Equity Calls for each jurisdiction’s BMP verification program to strive to achieve equity in the measurement of functionality and effectiveness of implemented BMPs among and across the source sectors.
D1.2: INITIAL AND FOLLOW-UP VERIFICATION REQUIREMENTS
While it is the goal to verify implementation of all BMPs implemented within the Chesapeake Bay watershed, resource constraints dictate that priorities be set to focus on those BMPs of greatest contribution to achieving each jurisdiction’s pollutant load reduction goals. This reality is reflected in Table 4 which summarizes the expected coverage of BMPs for agricultural verification protocols described in the agricultural verification guidance (Appendix B of the Verification Framework). Note that all practices are to be verified at installation or startup. Follow-up verification requirements vary based on program type and practice type, with a range of 5 to 20 percent annually.
3/31/2017 30

Table 4. Summary of verification coverage requirements
Program TypePractice
TypeInitial Verification Follow-Up or Re-Verification
Non-Cost-Shared BMPs (including
Resource Improvement
Practices)
Annual
100% BUT sub-sampling allowed for single year
BMPs (e.g., tillage practices) that are visually assessed.
Annual survey (using performance criteria and performed by qualified personnel) will determine the total number of annual BMPs. Based on the totals, the number of whole farm verification visits will be determined to achieve follow-up verification of at least 10% of those annual BMPs that account for >5% of agricultural sector nutrient and/or sediment load reductions as estimated in the most recent progress scenario (and 5% of those BMPs contributing ≤5% of the load reduction).
Multi-Year 100%
10% of those multi-year BMPs which account for >5% of agricultural sector nutrient and/or sediment load reductions as estimated in the most recent progress scenario (and 5% of those BMPs contributing ≤5% of the load reduction).
Cost-Shared BMPs
Annual
100% BUT sub-sampling allowed for single year
BMPs (e.g., tillage practices) that are visually assessed.
Annual survey (using performance criteria and performed by qualified personnel) will determine the total number of annual BMPs. Based on the totals, the number of whole farm verification visits will be determined to achieve follow-up verification of at least 10% of those annual BMPs that account for >5% of agricultural sector nutrient and/or sediment load reductions as estimated in the most recent progress scenario (and 5% of those BMPs contributing ≤5% of the load reduction).
Multi-Year 100%
10% of those multi-year BMPs which account for >5% of agricultural sector nutrient and/or sediment load reductions as estimated in the most recent progress scenario (and 5% of those BMPs contributing ≤5% of the load reduction).
Permit-Based BMPsAnnual
100% BUT sub-sampling allowed for single year
BMPs (e.g., tillage practices) that are visually assessed.
At least 20% during annual CAFO inspections.
Multi-Year 100% At least 20% during annual CAFO inspections.
3/31/2017 31
D2: VERIFICATION AND VALIDATION METHODS
This section summarizes the approach the USC will use to perform both initial and follow-up verification for both agricultural BMPs and wetlands. Verification for stream rehabilitation BMPs is not currently developed, but sections D2.7-D2.9 describe the current status of and future plans for verifying and reporting stream rehabilitation BMPs for credit. Over time as practices are changed and reported to the CBPO, additional verification and usability protocols will be developed as needed or as funds become available.
D2.1: SELECTION OF FARMS AND PRACTICES
New York will meet or exceed the verification frequency requirements in Table 4 for both initial and follow-up verification. New York State performs initial verification of all agricultural BMPs on farms participating in its AEM program, farms with contracts, and CAFO permitted facilities. Follow-up verification frequencies will be based on both the requirements in Table 4 and the relative contribution of BMPs to N, P, and sediment load reductions as supported by Attachment A in Appendix B (Relative Influence of BMPs in Agriculture Sector) of the Verification Framework.
Recent efforts of the USC and its partners have focused on the development of the sampling approach for follow-up verification of BMPs. Appendix 1 (Statistical Sampling Approach to Agricultural BMP Verification in New York State) describes New York’s adaptive management approach for prioritizing BMPs and selecting inspection sites for verification that implemented BMPs are performing as expected based on performance criteria, NRCS practice standards and specifications, engineering specifications, or other applicable criteria.
Our approach is to first evaluate the latest model load reductions from WSM progress runs as a basis for selection of BMPs and determining the required level of verification. BMPs considered the highest priority for developing verification procedures are those that are generally projected to contribute at least 5 percent of agricultural sector nutrient and/or sediment load reductions as estimated in the most recent progress scenario. In Appendix B of the agricultural verification guidance document, load reductions were compared between a 2013 progress scenario and a No-Action scenario. The results for New York are summarized in Table 5. Differences in the BMPs found in Table 5 and those in Table 1 of section A4.1 are due largely to the updated list of BMPs for the Phase 6 WSM. These differences will be resolved as we move forward.
3/31/2017 32

Table 5. BMP-specific load reductions for 2013 vs. no-action scenarios for New York
BMPShare of Total Agricultural Load
Reduction for 2013 vs. No-ActionN (%) P (%) Sediment (%)
Animal Waste Management Systems 28.6 30.8 -Land Retirement 15.9 4.9 13.0Enhanced Nutrient Management 14.1 8.1 -Trampled Riparian Pasture 14.0 26.1 29.3Forest Buffers 8.0 2.5 7.9Conservation Plans 3.6 5.5 14.5Pasture Fencing 3.1 5.4 8.2Grass Buffers 2.8 - 2.3Conservation Tillage 2.6 2.8 12.4Wetland Restoration 2.4 - 4.1Precision Rotation Grazing - 4.4 5.6Barnyard Runoff Control - 2.8 -Dairy Precision Feeding - 2.1 -Tree Planting - - 1.9Stream Channel and Corridor Rehabilitation and Restoration - - -
In accordance with the Verification Framework, the nine (9) BMPs highlighted in Table 5 would require re-verification at a 10 percent rate and the remaining BMPs with ≤5 percent load reduction contribution could be sampled at a 5 percent rate. Per an adaptive verification approach, these sampling rates may be adjusted to address factors such as the risk of BMPs not being maintained and the relative importance of BMPs in the future.
Conservation partners working to advance AEM in NYS have long held planning, implementation of high impact BMPs, and on-going operation and maintenance (O&M) as high priorities. Therefore the partnership also sought to develop follow-up verification methods that would primarily be of value to the farmer and for conservation and secondarily serve to collect data for progress reporting as required by the Verification Framework. For this reason a whole-farm approach was preferred over a BMP-based approach to achieve the required sampling rates for all reported BMPs. This method is designed to avoid artificial and confusing aspects of visiting farms to capture data on a single BMP when other BMPs are likely present (as well as repeat visits to verify independent BMPs) and should better match how farmers see their farms: as whole systems. It is anticipated that a whole-farm approach to verification will lead to more meaningful interactions with farmers about performance of current BMPs and potential for further BMP implementation, as has been the case during AEM Tier 5B evaluations and annual CAFO updates in NYS.
Follow-up verification of the permit-based (CAFO) BMPs has been on-going since 2004. The whole-farm approach has been successful, but full implementation of the planned additional procedures will be even more labor intensive.
3/31/2017 33
The specific method for selecting farms to achieve these sampling frequencies is described in detail in Appendix 1. This method incorporates random sampling of farms to achieve target sampling frequencies within a framework designed to both minimize overall cost and balance workload across NY USC member counties. As found on page 4 of Appendix 1, follow-up inspections of BMPs at CAFOs will be 2.5 times (50 vs. 20 percent) that required by the Verification Framework. Approximately 50 percent of CAFO-permitted farms are inspected by DEC or EPA annually (or 100 percent every two years; essentially verification by census). In addition, preliminary results show that the method achieves the minimum selection targets for BMPs using a farm-based approach (see Table 5 and Figure 3 of Appendix 1).
D2.2: AGRICULTURAL BMP VERIFICATION METHODS
New York will use on-site visual assessments and on-site record reviews for all verification during a BMP’s lifespan. On-site assessments for Visual–Multi-Year BMPs are employed to determine if the BMP meets the NRCS practice standards and specifications or the WSM practice definition and is performing as intended. These visual inspections are supported by AEM Tier 2 Worksheets (available at http://www.nys-soilandwater.org/aem/techtools.html), AEM Tier 5B Checklists (Appendix 8 and 9), NRCS practice standards, and any management records. A similar approach is used for Visual- Single-Year BMPs, except that the inspection is timed to occur when the BMP can be visually observed (e.g., late fall through spring for cover crops). On-site assessments for Non-Visual–Single-Year BMPs are also used to determine whether or not the BMP meets the NRCS practice standards and specifications or the WSM practice definition and is performing as intended. These assessments consist of a review of farm management records and further assessment with AEM Tier 2 Worksheets (available at http://www.nys-soilandwater.org/aem/techtools.html), AEM Tier 5B Checklists (Appendix 8 and 9), and NRCS practice standards. We will use the pilot phase of the new BMP verification protocols to test and further refine these methods.
The on-site, non-visual assessment for nutrient management is similar to the verification of other non-visual, single-year BMPs and determines if the BMP(s) was implemented according to the farm’s plan (i.e., a current plan based on NRCS definitions for that management area) or BMP definitions from Scenario Builder documentation. For nutrient management in NYS, the plan is based on the NRCS 590 Nutrient Management Standard (either stand-alone or as a part of a broader-based CNMP) and the plan criteria are linked to specific tiers of nutrient management in Scenario Builder for reporting purposes. The assessment of whether nutrient applications and other management practices were performed in accordance with the farm’s 590 nutrient management plan is based on discussion with the farmer and a review of the 590 plan, nutrient application records, soil and manure analyses, manure application setbacks, and crop rotation records.
All verification is performed by County Conservation Districts, NRCS Staff, Certified AEM Planners, and DEC inspectors (CAFOs). The USC will document verification of non-cost-shared BMPs through confirmation via PE signoff or SWCD evaluation that they meet appropriate government or CBP practice standards. Cost-shared BMPs and those implemented under permit issuing programs are documented by BMP certification or PE sign off.
3/31/2017 34
Re-verification of non-cost-shared and cost-shared BMPs will be performed by SWCD personnel or AEM planners. A farm inventory will be conducted if a practice sunsets within 2 years of the most recent on-site visual inspection. For BMPs implemented under permit issuing programs, re-verification will be performed by SWCD personnel or DEC staff during inspections. Additional information regarding how the USC will address lifespans can be found in section B10.4.
In 2013, a new online AEM Data Management Application was developed to manage historical and future BMP data collection for reporting to the CBPO. The USC completed an initiative to verify all historical practices in 2015. The verification of historical, expired, or annual practices (BMP data are coded by year of implementation) is under further development. It is the goal of the USC to fully verify all historical BMP data that has been entered into the WSM through 2015.
The overall approach for meeting the agricultural BMP verification targets in Table 4 is summarized in Table 6.
3/31/2017 35
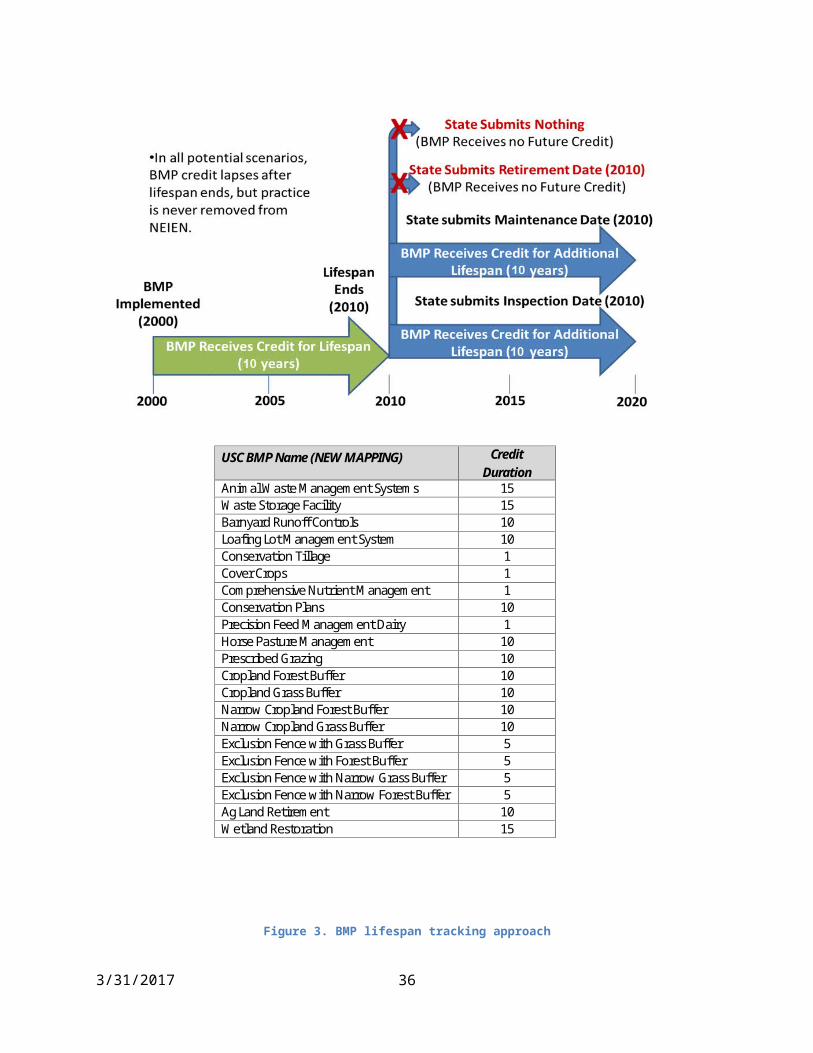
Table 6. Summary of proposed agricultural BMP verification approach
Verification Element
BMP Implementation Mechanism1
Non-Cost-Shared BMPs Cost-Shared BMPsPermit Issuing
ProgramsInitial Inspection
MethodFarm Inventory:
On Site Visual2 or Non-Visual3
Assessment
Farm Inventory:On Site Visual2 or Non-Visual3
Assessment
Farm Inventory:On Site Visual2 or Non-
Visual3 Assessment
Frequency100% of farms participating in AEM 100% of All farms under contract 100% of all CAFO
permitted facilities
Who Inspects
County Conservation Districts, NRCS Staff and Certified AEM Planners
County Conservation Districts, NRCS Staff and Certified AEM
Planners
County Conservation Districts, NRCS Staff and Certified AEM Planners,
DEC inspectors
Documentation
BMPs meet appropriate government and/or CBP practice
standard (PE sign off and/or SWCD evaluation)
BMP certification and/or PE sign off
BMP certification and/or PE Sign off
Follow-Up Check
Follow-Up InspectionAnnual and Multi-year BMPs: Farm Inventory: On-site Visual2 or Non-
Visual3 Assessment
Annual and Multi-year BMPs: Farm Inventory: On-site Visual2 or
Non-Visual3 Assessment
Annual and Multi-year BMPs: On-site Visual2 or Non-Visual3 Assessment
Statistical Sub-Sample
Random selection of ≥10% of all farms participating in AEM in order to verify at least 10% of those BMPs that account for >5% of agricultural
sector nutrient and/or sediment load reductions as estimated in the most recent progress scenario (and 5% of those BMPs contributing ≤5%
of the load reduction).
Random selection of ≥10% of farms with active contracts in order to verify at least 10% of
those BMPs that account for >5% of agricultural sector nutrient
and/or sediment load reductions as estimated in the most recent
progress scenario (and 5% of those BMPs contributing ≤5% of
the load reduction).
50% of all farms w/ active permits.
Response if ProblemBring into compliance within one
year or remove from reported BMPs
Cost Share Program Contract Compliance Policy
DEC CAFO Permit Compliance Policy
Lifespan/Sunset4
Re-verification by SWCD personnel and/or AEM planners. If practice sunsets within 2 years of on-site visual inspection a farm inventory will
be conducted.
Re-verification by SWCD personnel and/or DEC
staff during inspections.1New York State does not employ a Regulatory Program for BMP implementation as defined in the Chesapeake Bay Program Basinwide Framework. All farms under regulation operate within Permit Issuing Programs.2For animal waste management systems, barnyard runoff control, conservation tillage, forest buffers, grass buffers, grass buffers TRP, land retirement, precision rotation grazing, and wetlands (for Initial Inspection only).3For conservation plans, dairy precision feeding, and enhanced nutrient management.4Lifespan to be addressed in accordance with CBP lifespan criteria, including those for Resource Improvement practices.
3/31/2017 36

D2.3: AGRICULTURAL BMP DATA VALIDATION In 2015 the USC endeavored to document and further develop the USC data validation and usability protocols. The USC sector teams along with SWCD technicians, additional partners, experts, and outside consultants have been working to document existing and modify new data management practices and procedures to meet the Verification Framework requirements.
Initial validation and verification occur now through our existing data collection and management process. SWCD technicians and partners field verify initial implementation of all BMPs, both those funded through state and federal sources and those funded by landowners independently. Because only SWCD technicians with personal knowledge of practices report data to the data management system, no double counting of BMPs can occur. Initial verification is 100 percent field checked. No data are accepted from other sources or entered into the system without initial verification. The Agricultural Coordinator and GIS Specialist are responsible for QA/QC. Additionally the on-line data entry tool provides limitations and prompts for reporting that would prevent double counting. See section A9.1 and Group B for more details.
Data collection procedures are described further in sections A5.3, A6, A9, and B10.1 Data management procedures are described further in sections B10.2 through B10.6.
Several changes and upgrades to procedures and the data management system are required in response to Verification Framework requirements. New effort will be required to document and manage the sunset and re-verification of CAFO practices in our system as this is not presently done. Our newly developed follow-up assessment and sunset/lifespan protocols for all BMPs will also require changes to our data management system and other forms and documents. We will need to update data collection sheets to include inspection dates and narrative. For BMPs requiring maintenance, 1 year compliance-event status compliance codes need to be added along with maintenance dates. BMP lifespan/sunset will be tracked using an expiration date that will need to be added. We also will incorporate a retirement status in our on-line tool to record expiring, non-maintained, or destroyed/discontinued practices.
Once we have followed our verification approach and sunset dates/lifespans are added, the capability to add re-verification dates is added, inspections dates are incorporated including follow-up, and a retirement/expired function is added to our data management system, we will have adequate systems to address expired BMPs.
We will be working to institutionalize the follow-up verification process throughout the watershed in 2016 and 2017. The implementation of these new procedures and the changes to the Data Management System, on-line tool, and forms and worksheets used to collect data cannot be completed with current funding levels. USC will continue to work with DEC and CBP partners to address this issue.
D2.4: SELECTION OF WETLAND BMP VERIFICATION SITES
New York will meet or exceed the verification frequency requirements in Table 4 for both initial and follow-up verification of wetland BMPs. New York State and implementation partners at NRCS and USFWS perform initial verification of all wetland BMPs reported to the Chesapeake Bay
3/31/2017 37

Program. Follow-up verification frequencies for wetland BMPs will be at least 5 percent. The sampling approach described in Appendix 1 will be applied to all wetlands, resulting in at least 5 percent verification of wetlands installed under all programs. A number of these wetlands selected via the approach in Appendix 1 will be verified by NRCS based on its monitoring protocols which are described in Section D2.5. The remaining selected wetlands not implemented by NRCS will be verified by USC or USFWS as described in Section D2.5. Because NRCS annually verifies 20 percent of or more of wetlands it installs under the Wetland Reserve Easement (WRE), the coupling of the 5 percent sampling by USC per Appendix 1 with additional NRCS verification will always result in annual verification of at least 5 percent of wetland BMPs.
D2.5: WETLAND BMP VERIFICATION METHODS
The New York Wetland BMP Verification Methods incorporate all wetland related BMPs that are implemented and accounted for within New York’s WIP, including wetland restorations and creations. This information is also available in final form on worksheet “USC Names w NEIEN” of the Excel file “NEIEN_NPS_BMP_CBP_Data_Flow_P6Appendix_06252015 (USC).xlsx” which is included as Appendix 4. Details regarding verification and validation procedures for these practices are contained in Table 7 and summarized herein.
Programs involved in verification include:
Wetland restoration is funded and implemented primarily by NRCS and FSA under the Agricultural Conservation Easement Program (ACEP) - Wetland Reserve Easement (WRE) component, formerly known as Wetlands Reserve Protection (WRP). Through the easement program, all wetland practices are initially inspected upon completion, and follow a rigorous monitoring schedule for the duration of the easement. Because these lands are now considered federal “stewardship lands,” they must meet certain criteria as described below.
The USFWS partners with NRCS in many of their projects to provide technical assistance. For the projects for which they are partners, NRCS takes the lead on the initial and follow-up verification. However, USFWS also implements wetland restoration on their own; FWS will follow their most current verification protocol as we proceed with this verification process, and where FWS projects are selected by the New York Statistical Sampling approach, USC Wetland Team monitors will assist as needed in performing wetland verification using the NRCS WRP Monitoring worksheet (Appendix 10) to ensure consistency in monitoring data.
The USC often partners with NRCS, USFWS or both to implement wetland restoration projects. For those projects with which USC partners with NRCS, NRCS takes the lead on the initial and follow-up verification. However, USC also implements wetland restoration on its own. In these cases, USC will follow the wetland BMP verification approach outlined in Table 7, including 100 percent initial verification and 5 percent annual field verification of randomly selected sites. Field visits will be completed using the NRCS WRP Monitoring worksheet (Appendix 10) to ensure consistency in monitoring data.
Other Groups including Ducks Unlimited (DU) and various local conservation partners may also implement wetland restoration projects throughout the watershed. For those projects
3/31/2017 38
that are reported to the Wetland Coordinator, USC will follow the wetland BMP verification approach outlined in Table 7 including 100 percent initial verification, and 5 percent annual field verification of randomly selected sites. Field visits will be completed using the NRCS WRP Monitoring worksheet (Appendix 10) to ensure consistency in monitoring data.
NRCS WRE Monitoring Methodology
Wetland restoration projects implemented by NRCS are monitored using methodology outlined in the WRP manual which can be found here: http://directives.sc.egov.usda.gov/RollupViewer.aspx?hid=17111. This methodology has been approved by the CBP wetland workgroup (Chesapeake Bay Program 2014).
Inspection and maintenance are routinely performed as part of federal agricultural financial assistance programs. With the exception of post-construction monitoring frequency (which still meets the verification requirement of 5 percent annually), New York monitoring of all wetland projects will conform to the following guidelines set forth by NRCS:
WRE projects are monitored annually for three years, followed by an ownership review in the fourth year, then three years of remote sensing review. Onsite monitoring should occur every five years after that. Monitoring may be more frequent if there are violations or if compatible uses of the wetland have been approved. Note that rehabilitation projects in existing wetlands do not receive nutrient or sediment reduction credit at this time.
CRP/CREP projects are verified for correct installation. Annual monitoring is required for 10 percent of all active contracts. All of these projects are implemented on private lands where landowners typically inspect the sites a few times throughout the year. Landowners contact NRCS regarding any problems noted during these inspections.
During the monitoring process, the evaluator will record observations based on the questions found on the NRCS Wetlands Reserve Program (WRP) Monitoring Worksheet (Appendix 10). The WRP Monitoring Worksheet aims to ensure restoration requirements are being met, evaluate progress, determine what restoration repairs or enhancements may be needed, and maintain contact with the landowner. Photographs are also taken and stored with site visit information. Each implementing agency uses the following checklist for field verification:
Is the landowner present during the review? Has the landowner changed? Is the restoration boundary clearly marked and identifiable? Are the contract and agreement conditions being met? Are restoration practices being properly operated and maintained? (If not, what
maintenance is needed? Fill in maintenance practice and cost worksheet.) Is the planned hydrology (i.e. saturation or inundation) present? (If no, what actions are
needed?) Are maximum wildlife habitat objectives being achieved? (e.g. adequate hydrology, nesting
cover, etc.)
3/31/2017 39
Are planned vegetation restoration goals being achieved (e.g. is desired vegetation being established, are invasive or noxious species a problem)? (If no, what modifications are necessary?)
Are restoration practices being properly operated and maintained? (If no, what maintenance is needed?)
Are there opportunities to enhance wildlife habitat components? Does the landowner have any concerns or suggestions for improvement of the project site? Identify concerns or suggestions from partners involved with the restoration and
management of the restoration project. Additional observations or comments.
3/31/2017 40
Table 7. Summary of proposed wetland BMP verification approach
Verification Element
Wetland BMP Implementation MechanismDescription
Initial Inspection
Method NRCS Easements: On-site inspection and follow-up off-site/landowner contact All Other Projects: On-site inspection through completion of construction
FrequencyNRCS Easements: 100% on-site inspection and annually thereafter (on-site, off-site, landowner contact) All Other Projects: 100% on-site inspection at installation
Who Inspects
NRCS Easements: Technical Specialist, County Conservation Districts or TSP US FWS Projects: USFWS Trained Biologist or USC Trained Biologists USC and Other Voluntary Projects: USC Trained Biologists or County Conservation District Staff
Documentation
NRCS Easements: Reports to District Conservationist and inclusion of a summary of completed spot checks to State NRCS Easement Programs Coordinator who provides documentation to the USC Wetlands Coordinator US FWS Projects: USFWS or USC Biologists provides Wetland Coordinator inspection information alongside construction data for the annual data call USC and Other Voluntary Projects: USC Wetland Team provides Wetland Coordinator inspection information alongside construction data for the annual data call
Follow-up Check
Follow-up Inspection
NRCS Easements: On-site, off-site, and landowner contact as per the Monitoring Schedule (exceeds 5%) All Other Projects:: On-site inspection at 5% of all projects including NRCS
Statistical Sub-sample
NRCS WRP/WRE Easements: Monitored annually for three years, followed by an ownership review in the fourth year, then three years of remote sensing review. Onsite monitoring occurs every five years after that. Monitoring may be more frequent if there are violations or if compatible uses of the wetland have been approved NRCS CRP/CREP Easements: 10% of sites monitored annually for the duration of the easementAll Other Projects: Field-based site visits selected based on randomized site selection protocol for 5% of reported sites annually
Response if Problem
NRCS Easements: Cost-share program Contract compliance policy implemented All other Projects: All sites should be brought into compliance within one year or removed from reported BMPs
Lifespan/ SunsetRe-verification by NRCS, SWCD, or USC personnel throughout the 15-year lifespan determined for the Chesapeake Bay. If practice no longer exists or is no longer functional, the data are to be removed from NEIEN
3/31/2017 41
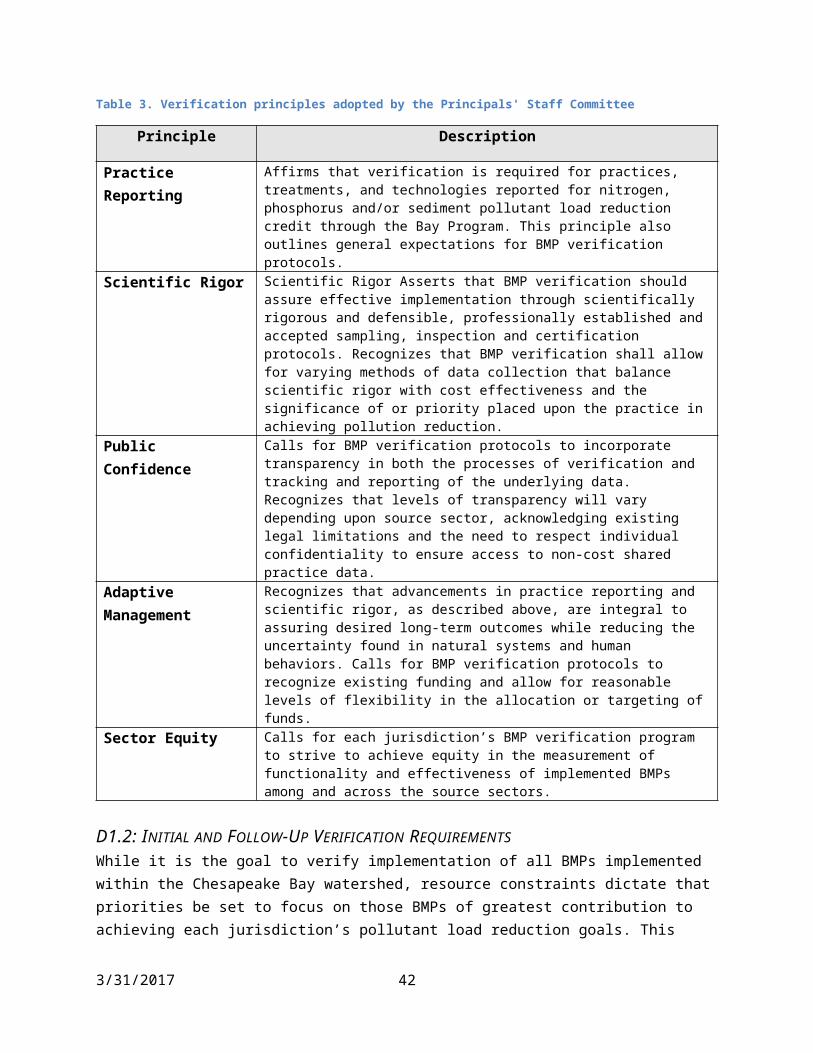
D2.6: WETLAND DATA VALIDATION Initial validation and verification occur through USC’s existing data collection and management process. Implementation partners and district technicians from throughout the watershed verify initial implementation of all wetlands, both those funded through state and federal sources and those funded by landowners independently. Because only SWCD technicians and federal agency staff with personal knowledge of practices report data to the data management system, no double counting of BMPs can occur. No data are accepted from other sources or entered into the system without initial verification, and the moderate number of sites reported annually allows the Wetland Coordinator to crosscheck each site and ensure that no project is reported twice. The Wetland Coordinator and GIS Specialist are responsible for QA/QC.
Data collection procedures are described further in sections A5.3, A6, A9, and B10.1 Data management procedures are described further in sections B10.2 through B10.6.
Several changes and upgrades to procedures and the data management system are required in response to Verification Framework requirements. New effort will be required to document and manage the sunset and re-verification wetland practices in our system as this is not presently done. Our newly developed follow-up assessment and sunset/lifespan protocols for all BMPs will also require changes to our data management system and other forms and documents. BMP lifespan/sunset will be tracked using an expiration date that will need to be added.
Once we have followed our verification approach and sunset dates/lifespans are added, the capability to add re-verification dates is added, inspections dates are incorporated including follow-up, and a retirement/expired function is added to our data management system, we will have adequate systems to address expired wetland BMPs.
We will be working to institutionalize the follow-up verification process throughout the watershed in 2017 and 2018. The implementation of these new procedures and the changes to the Data Management System, on-line tool, and forms and worksheets used to collect data cannot be completed with current funding levels. USC will continue to work with DEC and CBP partners to address this issue.
D2.7: SELECTION OF STREAM RESTORATION BMP VERIFICATION SITES
New York will meet or exceed the verification frequency requirements in Table 4 for both initial and follow-up verification of urban and non-urban stream restoration BMPs. New York State and implementation partners at NRCS perform initial verification of all stream rehabilitation and restoration BMPs reported to the Chesapeake Bay Program. The sampling approach described in Appendix 1 will be applied to provide for a follow-up verification frequency of 5 percent.
D2.8: STREAM RESTORATION BMP VERIFICATION METHODS
The New York stream project verification methods will address all stream restoration BMPs that are implemented and accounted for within New York’s WIP. Non-urban stream restoration is a visual assessment-multi-year BMP that can be verified by inventory by trained and certified personnel
3/31/2017 42

(Chesapeake Bay Program 2014). Details regarding verification and validation procedures for these practices are provided here and summarized later in Table 9.
The Urban Stream Restoration BMP Expert Panel (USRBMPEP 2014) recommends a watershed-based approach for screening and prioritizing stream restoration projects. The USRBMPEP also specified the following basic qualifying conditions for allowing stream restoration project credit (USRBMPEP 2014):
1. Stream restoration projects that are primarily designed to protect public infrastructure by bank armoring or rip rap do not qualify for a credit.
2. The stream reach must be greater than 100 feet in length and be still actively enlarging or degrading in response to upstream development or adjustment to previous disturbances in the watershed (e.g., a road crossing and failing dams). Most projects will be located on first- to third-order streams, but if larger fourth and fifth order streams are found to contribute significant and uncontrolled amounts of sediment and nutrients to downstream waters, consideration for this BMP would be appropriate, recognizing that multiple and/or larger scale projects may be needed or warranted to achieve desired watershed treatment goals.
3. The project must utilize a comprehensive approach to stream restoration design, addressing long-term stability of the channel, banks, and floodplain.
4. Special consideration is given to projects that are explicitly designed to reconnect the stream with its floodplain or create wetlands and instream habitat features known to promote nutrient uptake or denitrification.
5. In addition, there may be certain project design conditions that must be satisfied in order to be eligible for credit under one or more of the specific protocols described in Section 5.
New York addresses these five conditions by:
1. Not seeking credit for projects that are primarily designed to protect public infrastructure by bank armoring or rip rap,
2. Including only stream restoration projects that are at least 100 feet in length and still actively enlarging or degrading at the time when the project was initiated,
3. Including only stream restoration projects that address the long-term stability of the channel, banks, and floodplain, and
4. Meeting any other conditions associated with Protocol 1 for determining credit.
The USRBMPEP also recommends that proposed stream restoration projects be developed through a functional assessment process (USRBMPEP 2014). Regardless of the particular functional assessment method used, the basic steps should include:
Set programmatic goals and objectives Site selection and watershed assessment Conduct site-level function-based assessment Determine restoration potential
3/31/2017 43

Establish specific restoration design objectives Select restoration design approach and alternative analysis Project design review Implement post-construction monitoring
USC satisfies these requirements through its reliance on NRCS standards and specifications to plan and implement stream channel and corridor rehabilitation and restoration projects in the watershed. Practices for stream restoration are implemented in accordance with engineering principles and processes specified in the National Engineering Handbook Part 654, Stream Restoration Design. This includes establishment of goals and objectives, site assessment and investigation, a stream restoration design process, sediment impact assessments, project implementation, and maintenance and monitoring.Quality assurance measures for designed and constructed practices will be based on application of NRCS practice standards and specifications for stream restoration and riparian land best management practices. A non-exhaustive list of practices that may be included within a stream restoration project is provided in Table 8. Based on the standard applicable to the practice installed, the appropriate units and measurements will be tracked for each practice at each site.
Table 8. Partial list of NRCS practice standards potentially used for stream restoration
PracticeNRCS
StandardCompliance Units
evaluatedEvaluation Method
Streambank & Shoreline Protection
580 Linear feet Field certification
Stream Habitat Improvement
395Individual units / Area - square feet
Field certification
Stream Crossing 578 Individual units Field certification
Tree/Shrub Establishment 612 Area-acres Field certification
Riparian Forest Buffer 391 Area-acres Field certification
Prescribed Grazing 528 Area-acres Field certification
Aquatic Organism Passage 396 Individual units Field certification
Channel Bed Stabilization 584 Area – square feet Field evaluation
Fencing 382 Linear feet Field evaluation
Educational EventsNumber and number of participants
Written evaluations
3/31/2017 44
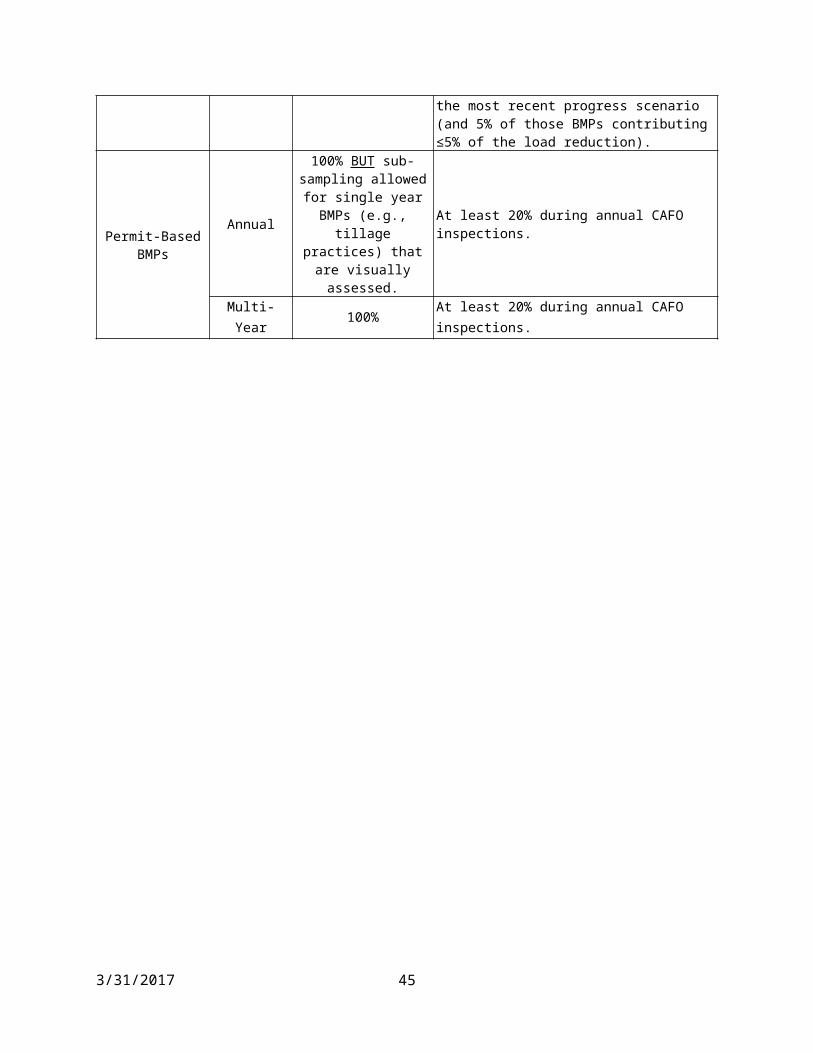
BMP design and implementation will be performed in accordance with the following guiding principles:
1. Stream issues will be approached in a systemic manner considering whole watershed condition and impact
2. When possible, stream issues will be monitored to determine rate and status of observed or perceived impairments
3. Stream issues will be approached wherever possible with clearly identified restoration objectives as opposed to a stabilization approach
4. Restoration includes consideration of geomorphic, hydrologic, habitat, water quality, riparian, social, and economic values
5. Stream issues will be approached in a pragmatic manner with the realization that funding, materials, and other resources are limited
6. The education and involvement of landowners, municipal officials, maintenance personnel, land use planners, etc. is of primary importance in order to effect cultural change in how we manage our streams and watersheds and addressing the assurance of both the success and long-term maintenance of BMPs identified
7. Creative, cost effective approaches to stream restoration are encouraged in management, regulation, and actual in-channel work
8. Lessons learned in our region regarding stream restoration (what works and what doesn’t work) will be shared and networked
9. Local empowerment through education, training, actual experience, etc. is a primary objective (use of local designers, contractors, material suppliers)
10. Further research of regional stream system elements is needed to better understand the complexity of local streams
11. All practitioners of stream rehabilitation and restoration will be adequately trained and supervised under the appropriate qualified authority
12. All stream BMPs designed and installed will have plans that clearly identify responsible parties for the inspection, functional verification, and operation and maintenance procedures
Figure 5 identifies the contents of stream rehabilitation and restoration project plans used by USC.
3/31/2017 45
Table of ContentsFOR
STREAM REHABILITATION PROJECTSA: Project Overview
Narrative – Overview, Purpose & ObjectivesDesign Procedures
Project Information SummaryLocation Information and Maps
Operation and Maintenance PlanPermit
Consent Forms and/or Contracts
B: Riprap Design InformationRiprap Design Worksheet
Survey InformationDesign Calculations
Design Specifications
C: Stream Barb Design InformationStream Barb Design Calculations
Design Specifications
D: Rock Weir Design InformationRock Weir Design Calculations
Design SpecificationsProject Cost Estimate
Quality Assurance Plan
C: Construction InformationPre-construction Checklist
Installation Sequence and Contractors Notification ListUtility Clearances
Erosion & Sedimentation Control PlanConstruction Specifications (additional conditions)
Drawings - Cover Sheet, Plan View, Proposed Cross Section, Typical Rip-Rap Installation, Typical Barb Installation, Typical Weir Installation
Figure 4. USC stream rehabilitation/restoration plan contents
The USC, its member Soil and Water Conservation Districts, and all partners engaged in any and all projects associated with stream channel and corridor BMP identification, design and implementation, recognize the need for quality, engineering based approach. As such, any BMP will adhere to both the standards and specifications for such practices as identified by the Engineering Field Manual developed and adopted by the NRCS. In the absence of practice specific standards and specifications for a specific BMP needed to address a stream corridor/channel need, acceptable
3/31/2017 46

Rehabilitation Project
Developed By:XX Conservation District
andUpper Susquehanna Coalition (USC)
Date: ______________
Design Prepared By: _____________________________________ Date: ___________
Printed Name and Title: _____________________________________
Design Assisted By: _____________________________________ Date: ___________
Printed Name and Title: _____________________________________
Design Reviewed By XXCD: ______________________________ Date: ___________
Printed Name and Title: _____________________________________
Design Reviewed By USC: _______________________________ Date: ___________
Printed Name and Title: _____________________________________
Design Reviewed By NRCS: ______________________________ Date: ___________
Printed Name and Title: _____________________________________
Design Reviewed By NRCS: ______________________________ Date: ___________
Printed Name and Title: _____________________________________
Engineering Approval: ___________________________________ Date: ___________
Printed Name and Title: _____________________________________
engineering practices and standards will be used and certified by a licensed engineer. A sample check-off sheet is provided in Figure 5.
Figure 5. Sample initial verification checklist for stream projects
3/31/2017 47
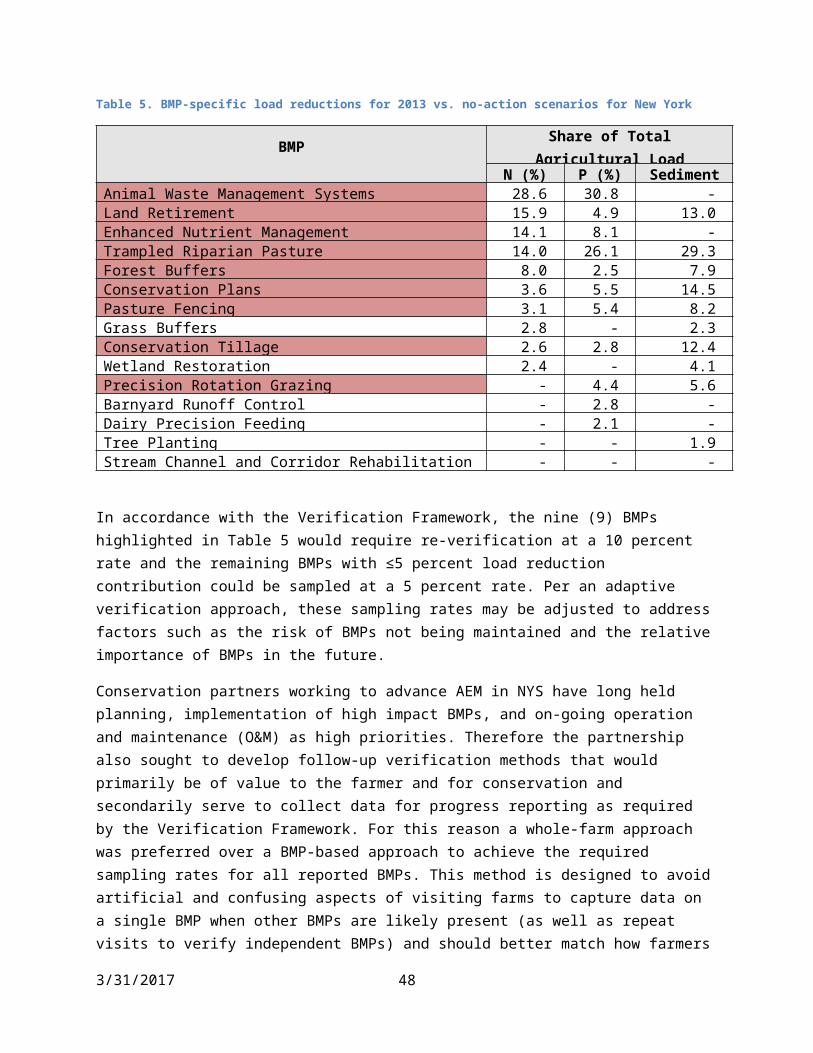
In accordance with USRBMPEP guidelines, New York will not seek removal credit for the following types of stream restoration projects:
Enhancement projects where the stream is in fair to good condition, but habitat features are added to increase fish production (e.g., trout stream habitat, brook trout restoration, removal of fish barriers, etc.)
Projects that seek to restore streams damaged by acid mine drainage Riparian fencing projects to keep livestock out of streams
USC currently plans to use USRBMPEP Protocol 1 (Credit for Prevented Sediment during Storm Flow) to determine credit for prevented sediment during storm flow (USRBMPEP 2014). The Stream Team is most comfortable using the BEHI (Bank Erosion Hazard Index) to determine potential sediment loading from the site, but it may explore additional methods. The BEHI estimates sediment loading, and nitrogen and phosphorus loads are usually calculated using standard soil nutrient content values from NRCS. USC has not yet reported stream credits, however, and so haven’t adopted a standard approach.
Table 9. Summary of proposed stream restoration BMP verification approach
Verification Element
Stream Restoration BMP Implementation MechanismDescription
Initial Inspection
Method NRCS operation and maintenance and inspection protocols
Frequency 100% on-site inspection
Who Inspects NRCS and USC
Documentation
USC Stream Team Leader provides a form (Appendix 11) for each District to log completed practices that were implemented within their county that year. The form is completed by SWCD staff and then sent back to the USC Stream Team Leader who acts as the repository for these practices.
Follow-up Check
Follow-up Inspection Annual on-site inspection of a randomly selected 5% subset of all projects
Response if Problem
NRCS: Cost-share program Contract compliance policy implemented All other Projects: All sites should be brought into compliance within one year or removed from reported BMPs
Lifespan/ SunsetRe-verification by NRCS, SWCD, or USC personnel throughout the project lifespan as determined for the Chesapeake Bay. If practice no longer exists or is no longer functional, the data are to be removed from NEIEN
3/31/2017 48
D2.9: STREAM RESTORATION BMP DATA VALIDATION
Initial validation and verification occur through USC’s existing data collection and management process. Implementation partners and district technicians from throughout the watershed verify initial implementation of all stream restoration projects, both those funded through state and federal sources and those funded by landowners independently. Because only SWCD technicians and federal agency staff with personal knowledge of practices report data to the data management system, no double counting of BMPs can occur. No data are accepted from other sources or entered into the system without initial verification, and the moderate number of sites reported annually allows the Stream Team Leader to crosscheck each site and ensure that no project is reported twice. The Stream Team Leader and GIS Specialist are responsible for QA/QC.
Data collection procedures are described further in sections A5.3, A6, A9, and B10.1 Data management procedures are described further in sections B10.2 through B10.6.
Several changes and upgrades to procedures and the data management system are required in response to Verification Framework requirements. New effort will be required to document and manage the sunset and re-verification of stream restoration practices in our system as this is not presently done. Our newly developed follow-up assessment and sunset/lifespan protocols for all BMPs will also require changes to our data management system and other forms and documents. BMP lifespan/sunset will be tracked using an expiration date that will need to be added.
Once we have followed our verification approach and sunset dates/lifespans are added, the capability to add re-verification dates is added, inspections dates are incorporated including follow-up, and a retirement/expired function is added to our data management system, we will have adequate systems to address expired stream restoration BMPs.
USC and its partners will be working to institutionalize the follow-up verification process throughout the watershed in 2017 and 2018. The implementation of these new procedures and the changes to the Data Management System, on-line tool, and forms and worksheets used to collect data cannot be completed with current funding levels. USC will continue to work with DEC and CBP partners to address this issue.
3/31/2017 49
ACRONYMSAEM – Agricultural Environmental Management program of NYS
BMP – Best Management Practices
CAFO – Concentrated Animal Feeding Operation
CBIG – Chesapeake Bay Implementation Grant
CBP – Chesapeake Bay Program
CBPO – Chesapeake Bay Program Office
CBRAP – Chesapeake Bay Regulatory and Accountability Program
CCA – Certified Crop Advisor
CDEA – New York’s Conservation Districts Employee’s Association
CPESC – Certified Professional in Erosion and Sediment Control
CSW – Conservation Skills Workshop
DEC – New York State Department of Environmental Conservation
EPA – U.S. Environmental Protection Agency
ESRI – Environmental Systems Research Institute
FSA – USDA Farm Services Agency
GIS – Geographic Information System
MBA – Multiple Barrier Approach
N - Nitrogen
NEIEN – National Environmental Information Exchange Network
NPS – Nonpoint Source
NRCCA – Northeast Region Certified Crop Advisor
NRCS – USDA’s Natural Resources Conservation Service
NY – New York
NYS – New York State
O&M – Operation and MaintenanceP - Phosphorus
PE – Professional Engineer
QA – Quality Assurance
QAPP – Quality Assurance Project Plan
QC – Quality Control
RAID 5 – Redundant Array of Independent (or Inexpensive) Disks. RAID 5 is the most common RAID configuration for business servers and enterprise NAS (network-attached storage) devices.
3/31/2017 50
A RAID-enabled system uses two or more hard disks to improve the performance or provide some level of fault tolerance for a machine—typically a NAS or server. Fault tolerance simply means providing a safety net for failed hardware by ensuring that the machine with the failed component, usually a hard drive, can still operate. Fault tolerance lessens interruptions in productivity, and it also decreases the chance of data loss.
RI – Resource Improvement
RUSLE2 – Revised Universal Soil Loss Equation Version 2
SQL – Structured Query Language. This is a special-purpose programming language designed for managing data held in a relational database management system, or for stream processing in a relational data stream management system.
SWCD – Soil and Water Conservation District
TMDL – Total Maximum Daily Load
TSP – Technical Service Provider for NRCS
USC – Upper Susquehanna Coalition
USDA – U.S. Department of Agriculture
WIP – Watershed Implementation Plan
WQS – Water Quality Symposium
WSM – Chesapeake Bay Program Watershed Model
XML – EXtensible Markup Language. XML was designed to store and transport data.
REFERENCESChesapeake Bay Program. 2014. Strengthening Verification of Best Management Practices Implemented in the Chesapeake Bay Watershed: A Basinwide Framework - Report and Documentation from the Chesapeake Bay Program Water Quality Goal Implementation Team’s BMP Verification Committee. Accessed March 2, 2016. http://www.chesapeakebay.net/publications/title/strengthening_verification_of_best_management_practices_implemented_in_the
USEPA (U.S. Environmental Protection Agency). 2006. Requirements for Quality Assurance Project Plans. (EPA QA/R-5, EPA/240/B-01/003. U.S. Environmental Protection Agency, Office of Environmental Information, Washington DC, March 2001 [Reissued May 2006]). Accessed March 2, 2016. http://www.epa.gov/sites/production/files/2015-07/documents/r5-final.pdf
USRBMPEP (Urban Stream Restoration BMP Expert Panel). 2014. Recommendations of the Expert Panel to Define Removal Rates for Individual Stream Restoration Projects. Test-Drive Revisions Approved by the WQGIT: September 8, 2014. Prepared for Urban Stormwater Work Group, Watershed Technical Work Group, and Water Quality Goal Implementation Team, by Tom Schueler, Chesapeake Stormwater Network and Bill Stack, Center for Watershed Protection. Accessed March 27, 2017. http://www.chesapeakebay.net/documents/Stream_Panel_Report_Final_08282014_Appendices_A_G.pdf
3/31/2017 51
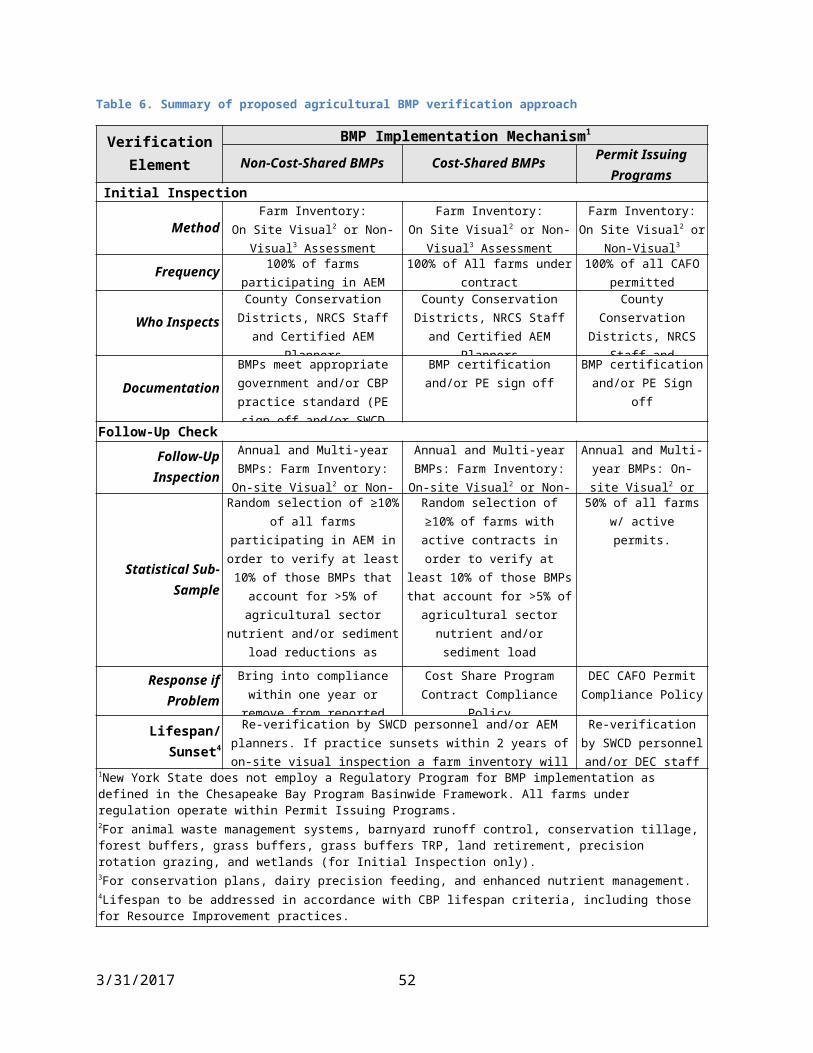
3/31/2017 52

APPENDICES
3/31/2017 53